Embed Size (px)
Citation preview

Municipal waste management in Belgium
Prepared by Emmanuel C. Gentil
ETC/SCP
February 2013
EEA project manager Almut Reichel
Author affiliation
Emmanuel C. Gentil, Copenhagen Resource Institute, http://www.cri.dk/
Context
The Topic Centre has prepared this working paper for the European Environment Agency
(EEA) under its 2012 work programme as a contribution to the EEA's work on waste
implementation.
Disclaimer
This ETC/SCP working paper has been subjected to European Environment Agency (EEA)
member country review. Please note that the contents of the working paper do not necessarily reflect the views of the EEA.
3
Contents Highlights .................................................................................................................. 4
1 Introduction ...................................................................................................... 5
1.1 Objective ................................................................................................. 5
2 Belgium’s MSW management performance .................................................. 5
2.1 MSW Indicators ....................................................................................... 8
2.1.1 The recycling of MSW from 2001 to 2010 ............................................... 8
2.1.2 The yearly rate of recycling of MSW...................................................... 10
2.1.3 Landfilling of biodegradable municipal waste ........................................ 13
2.1.4 Regional differences of MSW recycling from 2001 to 2010 ................... 14
2.1.5 The relation between landfill tax level and recycling level of MSW ....... 16
2.1.6 Environmental benefits of better MSW management ............................ 18
2.2 Uncertainties in the reporting ................................................................ 20
2.3 Important initiatives taken to improve MSW management .................... 21
2.4 Future possible trends ........................................................................... 23
References .............................................................................................................. 24
4
Highlights
Belgium has already met all the diversion targets for BMW of the EU Landfill Directive and the
50% recycling target for MSW of the EU Waste Framework Directive;
Significant historical differences for MSW recycling rates exist between Brussels Capital Region,
Flanders and Wallonia; Recycling rates for material and organic recycling are highest in Flanders
throughout the period 2001-2010 whereas Wallonia has made most progress;
Belgium has one of the highest landfill taxes and landfill tax increases in Europe, combined with
a landfill ban, which seem to have effectively diverted waste from landfill to recycling;
Use of a portfolio of policy instruments to achieve high recycling rate, although not uniformly
implemented across the different Belgium provinces;
Mandatory waste separation by householders with fines up to € 625 for non-compliance from
2010 (Bruxelles Capital Region);
Mandatory quality thresholds for separately collected waste (Flanders); and
Mandatory quantity thresholds for residual waste (Flanders).
5
1 Introduction
1.1 Objective
Based on historical MSW data for Belgium and EU targets linked to MSW in the Waste Framework
Directive, the Landfill Directive and the Packaging Directive, the analysis undertaken includes:
The historical performance on MSW management based on a set of indicators;
Uncertainties that might explain differences between the countries’ performance which are more
linked to differences of what the reporting includes than differences in management performance;
Relation of the indicators to the most important initiatives taken to improve MSW management in
the country, and
Assessment of the future possible trends and achieving of the future EU targets on MSW by 2020.
2 Belgium’s MSW management performance
Waste management in Belgium falls under the responsibility of three regions: Brussels Capital
Region, Flanders and Wallonia, where waste management planning and statistical reporting are
undertaken by three separate entities. All the relevant waste related statistics are submitted
individually to Eurostat. Eurostat compiles the information from the three regions to provide national
data. This report presents an ex-post analysis for the whole country but efforts are made to include the
regional differences, based on available information.
In order to understand the context of the waste management situation in Belgium, it is important to
understand that the Brussels Capital Region represents 9 % of the MSW generated in Belgium,
Flanders represents 60 % of the MSW generated and Wallonia represents 31 % of the MSW generated
(the total MSW generated in Belgium in 2010 is about 5 million tonnes). This MSW generation share
among the three regions has remained constant between 2000 and 2010. However, overall, the
quantity of MSW generated between 2001 and 2010 has increased by about 5 %. This is most
probably due to an increase in migrant population, as the MSW generated per capita has decreased by
about 1 % between 2001 and 2010.
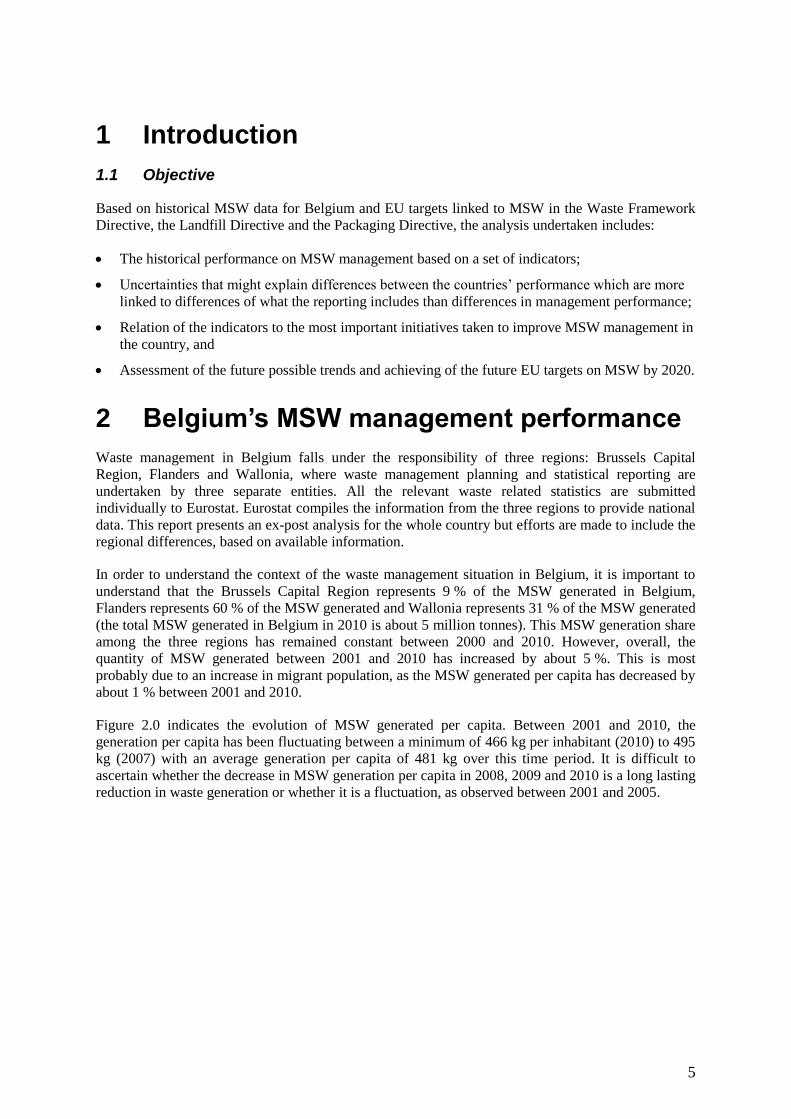
Figure 2.0 indicates the evolution of MSW generated per capita. Between 2001 and 2010, the
generation per capita has been fluctuating between a minimum of 466 kg per inhabitant (2010) to 495
kg (2007) with an average generation per capita of 481 kg over this time period. It is difficult to
ascertain whether the decrease in MSW generation per capita in 2008, 2009 and 2010 is a long lasting
reduction in waste generation or whether it is a fluctuation, as observed between 2001 and 2005.
6
Figure 2.0 MSW generations per capita in Belgium
0
100
200
300
400
500
600
700
800
2001 2002 2003 2004 2005 2006 2007 2008 2009 2010
Kil
og
ram
s p
er c
ap
ita
MSW generation in Belgium for the period 2001-2010
Brussels Capital Region
The Brussels Capital Region (BCR) has a very high population density, with a high level of
urbanisation, and is primarily service orientated, which can affect effective waste management, such
as lack of space for waste management infrastructure (lack of container parks for instance). Two
complementary institutions are responsible for waste management in BCR: Bruxelles Environnement
(waste prevention and management policy) and Agence Bruxelles Propreté (municipal waste
collection and treatment of waste).
The region is publishing a waste management plan on a five year interval for the first three plans.
According to the assessment of the waste prevention and management plan (2003-2007) (Bruxelles
Environment, 2008)1, the region depends on the waste management system and waste management
policy of the other regions of Belgium because there is no landfill capacity within the region. The
main objectives of these plans are to indicate the various instruments to promote waste prevention.
Extended producer responsibility (EPR) is applied to 11 flows of waste, and more specifically
fractions potentially found in the MSW, such as batteries and accumulators, out of date or unused
medicines, packaging and paper and cardboard. Other wastes subject to EPR are generally not
expected to be collected by municipalities (end of life vehicles). The EPR regulation has been
harmonised between the three Belgian regions. According to the 4th waste prevention management
plan 2010 (IBGE, 20102), the EPR has been a significant driver for the increase in the recycling rate
in Brussels Capital Region.
1IBGE (2008). Bilan du plan pour la prévention et de gestion des déchets 2003 – 2007. [In French]. Assessment
of the waste prevention and management plan 2003 – 2007.
Version 21st March 2008. Brussels Capital Region. Brussels. Belgium. 94 pp.
2IBGE (2010). Plan de prévention et de gestion des déchets. May 2010. [In French]. Waste prevention and
management plan. Brussels Capital Region. Brussels, Belgium. 71 pp.
7
Flanders
Flanders has a long history of waste management plans (Parent et al, 2004)3, where the first one was
initiated 1986 to 1990, with a focus on closing down landfills and developing new ones with better
standards. This plan also included the maximum use of the existing incineration capacity and the
separate collection of municipal solid waste was initiated. Landfill and incineration costs were
increased in order to promote waste separation and recycling.
A second plan was in force between 1991 and 1995, specifically emphasising the separate collection
of waste with the overall objective of waste prevention and material recovery. The waste management
plan from 1997 to 2001 initiated quantitative targets on the maximum amount of residual waste
generated by inhabitant (from 255 kg/cap in 1998 to 150 kg/cap in 2010). The 2003 to 2007 plan
indicated tighter targets (from 180 kg/cap in 2003 to 150 kg/cap in 2007). The plan also included
other key policy aspects, such as promotion of organic recycling, 13 % prevention by 2007 compared
to 2000, 70 % selective collection and recycling. It is worth noting that Flanders has also introduced
quality thresholds for separately collected waste (maximum 3 % contaminants for Vegetable, Fruit
and Garden (VFG), green waste, cardboard and paper, 5 % for wood and glass waste, 15 % for
construction and demolition waste and 5 to 15 % for textile waste)4. Finally, a landfill ban and an
incineration ban of selected waste streams have been in place since 1998 (ETC/SCP, 2008)5. In 2004,
in Flanders, 71 % of household waste was collected separately and only 4 % was landfilled.
The on-going plan (2008-2015) has four objectives: more environmentally beneficial consumption, no
more than 560 kg of waste produced per capita per annum and no more than 150 kg of residual waste
per capita per annum.
Generally, a number of instruments have been used in order to move waste management further up in
the waste hierarchy (prevention and material recovery). These include obligatory source separated
waste collection (urban and rural), subsidies for reuse centres, pay-as-you-throw schemes, producer
responsibility, landfill and incineration taxes (in addition to the selective ban), quotas on waste
production per inhabitant and communication instruments.
Wallonia
The recent waste management strategy of Wallonia has been driven by the implementation of waste
management plans. The general objectives of the 1991-1995 plan were to promote waste prevention,
material and energy recovery (through the development of infrastructure), optimisation of waste
management technology and pollution control, higher control of movements of waste, more consistent
waste statistics and the further development of the institutional framework for management and
control of waste management in Wallonia (DGO3, 1991)6.
The first plan also included the need to further develop separate collection of waste (kerbside
collection, bring banks in streets and container parks). Source separation of waste includes glass
(bring banks), paper and cardboard, metals, plastics, textiles, used engine oil (container parks and
3 OVAM (2004). Municipal waste management in Flanders - Experiences and Challenges. Prepared by Parent,
F., Vanacker, L, Vandeputte, A. and Wille, D. Mechelen, Belgium. 18 pp. 4 OVAM (2008) Implementation plan for environmentally responsible household waste management. Mechelen,
Belgium. 32 pp. 5 ETC/RWM (2008). Evaluation of waste policies related to the Landfill Directive Flanders. Prepared by
Skovgaard, M. and Reichel, A. Working paper 5/2008. Copenhagen, Denmark. 48 pp 6 DGO3 (1991). Pour une Wallonie plus propre : plan wallon des déchets 1991-1995. [In French]. For a Cleaner
Wallonia. Waste management plan 1991 – 1995. Ministère de la Région wallonne pour l’agriculture,
l’environnement et le logement, Brussels, Belgium. 32 pp.
8
kerbside collection). However, it should be noted that only 15 % of the source separated waste were
actually sent to industry for recycling (DGO3, 1998)7.
The objectives of the second plan (1998-2010) reinforce the objectives stated in the first Walloon
waste management plan. In addition, some quantitative targets were indicated such as halving
household and industrial waste generation by 2010 (waste prevention target). Municipal waste sent to
incineration was expected to increase from 480 000 tonnes to 733 000 tonnes (617 000 tonnes of
MSW) in 2010 in order to drastically reduce waste sent to landfill. The plan also indicated that a
strong increase in biological treatment was expected but no quantitative target was indicated.
The assessment of the waste management plan for Wallonia, performed in 2011 (DGO3, 2011)8,
indicated that a slight reduction of the MSW generated was achieved between 2001 and 2010. A more
significant reduction of household waste (mixed household and separately collected waste) has
occurred in the same period. However, a significant increase (except for 2010) of bulky household
waste (inerts, appliances, furniture and garden waste) was observed.
According to the same source, the material recovery of MSW (material and organics) has increased
significantly between 2000 and 2004 (49 % increase) with a weak increase in 2008 and 2010. An
important increase in incineration occurred between 2004 and 2008 and between 2008 and 2010.
Finally the landfilling rate has decreased drastically, especially in 2008 and 2010 (386 446 tonnes
landfilled in 2008, 55 387 tonnes of MSW disposed to landfill in 2010, equivalent to an 86 %
reduction in 2 years). In comparison, reported data to Eurostat indicate 236 330 tonnes landfilled in
2008 and 208 610 tonnes in 2009, based on the latest reported year to Eurostat.
2.1 MSW Indicators
For this ex-post analysis, 9 MSW indicators have been chosen, related to historical data from 2001 to
2010 to assess the performance of waste management in Belgium.
2.1.1 The recycling of MSW from 2001 to 2010
The historical comparison of the total MSW recycling, organic and material recycling rates is
analysed to assess whether one type of recycling has been prioritised over the other type, whether it be
organic recycling or material recycling.
7DGO3 (1998). Plan wallon des déchets - Horizon 2010. [In French]. Waste management plan for Wallonia -
Horizon 2010. Namur, Belgium. 596 pp. 8DGO3 (2011). Bilan du Plan wallon des déchets - Horizon 2010. Volet déchets ménagers et assimilés. Version
1.6. [In French]. Assessment of the Walloon waste management plan – Horizon 2010. Municipal solid waste.
Report published by the Direction Générale Opérationnelle de l’Agriculture, des Resources Naturelles et de
l’Environnement. Wallonia. Namur, Belgium. 93 pp.
9
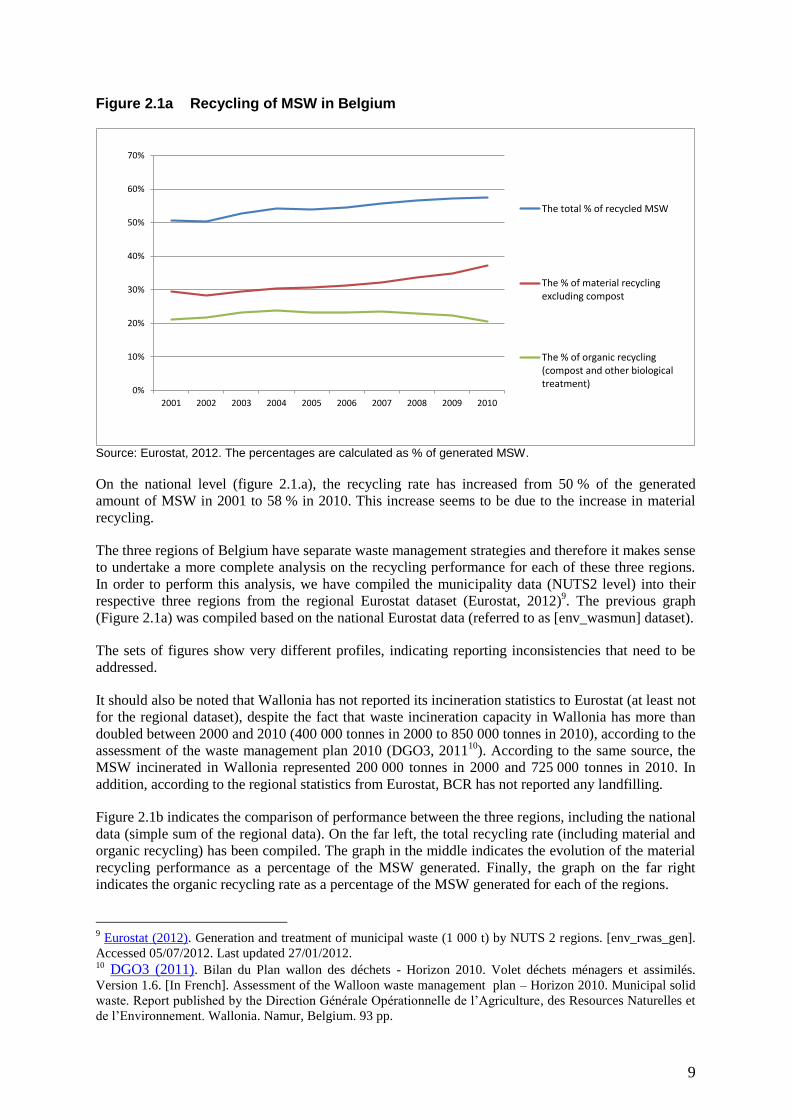
Figure 2.1a Recycling of MSW in Belgium
0%
10%
20%
30%
40%
50%
60%
70%
2001 2002 2003 2004 2005 2006 2007 2008 2009 2010
The total % of recycled MSW
The % of material recyclingexcluding compost
The % of organic recycling(compost and other biologicaltreatment)
Source: Eurostat, 2012. The percentages are calculated as % of generated MSW.
On the national level (figure 2.1.a), the recycling rate has increased from 50 % of the generated
amount of MSW in 2001 to 58 % in 2010. This increase seems to be due to the increase in material
recycling.
The three regions of Belgium have separate waste management strategies and therefore it makes sense
to undertake a more complete analysis on the recycling performance for each of these three regions.
In order to perform this analysis, we have compiled the municipality data (NUTS2 level) into their
respective three regions from the regional Eurostat dataset (Eurostat, 2012)9. The previous graph
(Figure 2.1a) was compiled based on the national Eurostat data (referred to as [env_wasmun] dataset).
The sets of figures show very different profiles, indicating reporting inconsistencies that need to be
addressed.
It should also be noted that Wallonia has not reported its incineration statistics to Eurostat (at least not
for the regional dataset), despite the fact that waste incineration capacity in Wallonia has more than
doubled between 2000 and 2010 (400 000 tonnes in 2000 to 850 000 tonnes in 2010), according to the
assessment of the waste management plan 2010 (DGO3, 201110
). According to the same source, the
MSW incinerated in Wallonia represented 200 000 tonnes in 2000 and 725 000 tonnes in 2010. In
addition, according to the regional statistics from Eurostat, BCR has not reported any landfilling.
Figure 2.1b indicates the comparison of performance between the three regions, including the national
data (simple sum of the regional data). On the far left, the total recycling rate (including material and
organic recycling) has been compiled. The graph in the middle indicates the evolution of the material
recycling performance as a percentage of the MSW generated. Finally, the graph on the far right
indicates the organic recycling rate as a percentage of the MSW generated for each of the regions.
9 Eurostat (2012). Generation and treatment of municipal waste (1 000 t) by NUTS 2 regions. [env_rwas_gen].
Accessed 05/07/2012. Last updated 27/01/2012. 10 DGO3 (2011). Bilan du Plan wallon des déchets - Horizon 2010. Volet déchets ménagers et assimilés.
Version 1.6. [In French]. Assessment of the Walloon waste management plan – Horizon 2010. Municipal solid
waste. Report published by the Direction Générale Opérationnelle de l’Agriculture, des Resources Naturelles et
de l’Environnement. Wallonia. Namur, Belgium. 93 pp.
10
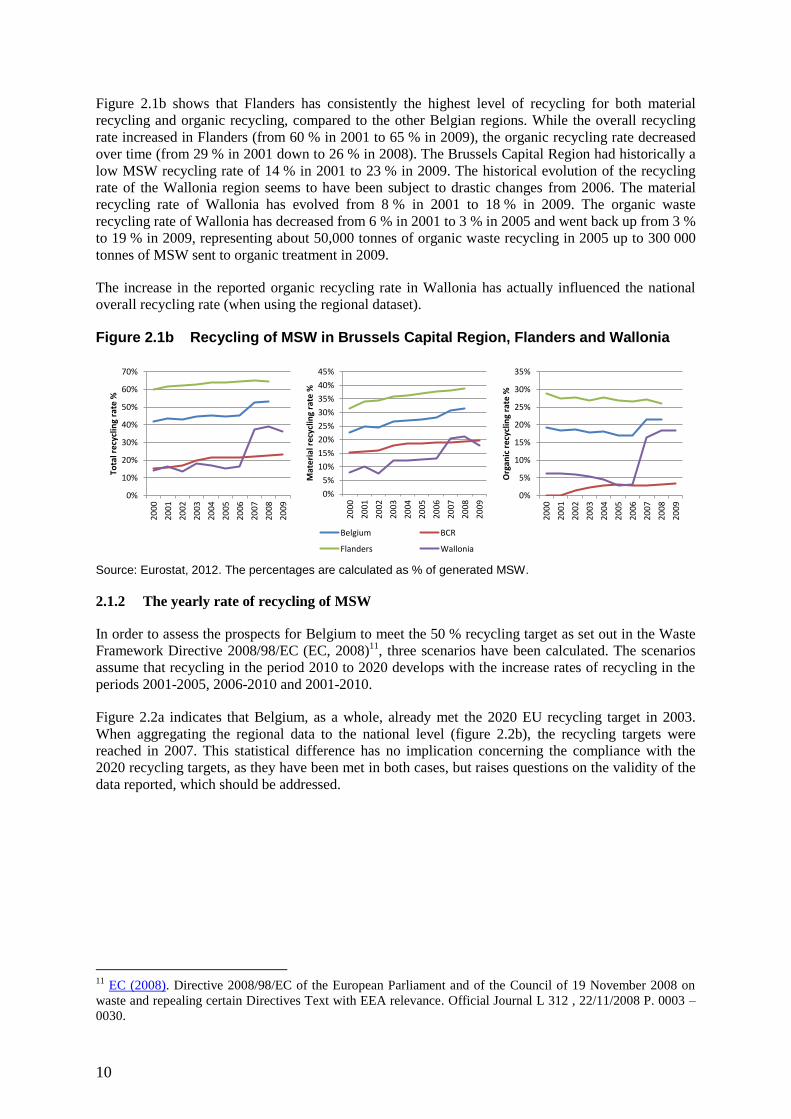
Figure 2.1b shows that Flanders has consistently the highest level of recycling for both material
recycling and organic recycling, compared to the other Belgian regions. While the overall recycling
rate increased in Flanders (from 60 % in 2001 to 65 % in 2009), the organic recycling rate decreased
over time (from 29 % in 2001 down to 26 % in 2008). The Brussels Capital Region had historically a
low MSW recycling rate of 14 % in 2001 to 23 % in 2009. The historical evolution of the recycling
rate of the Wallonia region seems to have been subject to drastic changes from 2006. The material
recycling rate of Wallonia has evolved from 8 % in 2001 to 18 % in 2009. The organic waste
recycling rate of Wallonia has decreased from 6 % in 2001 to 3 % in 2005 and went back up from 3 %
to 19 % in 2009, representing about 50,000 tonnes of organic waste recycling in 2005 up to 300 000
tonnes of MSW sent to organic treatment in 2009.
The increase in the reported organic recycling rate in Wallonia has actually influenced the national
overall recycling rate (when using the regional dataset).
Figure 2.1b Recycling of MSW in Brussels Capital Region, Flanders and Wallonia
0%
10%
20%
30%
40%
50%
60%
70%
20
00
20
01
20
02
20
03
20
04
20
05
20
06
20
07
20
08
20
09
Tota
l re
cycl
ing
rate
%
0%
5%
10%
15%
20%
25%
30%
35%
40%
45%
20
00
20
01
20
02
20
03
20
04
20
05
20
06
20
07
20
08
20
09
Mat
eri
al r
ecy
clin
g ra
te %
Belgium BCR
Flanders Wallonia
0%
5%
10%
15%
20%
25%
30%
35%
20
00
20
01
20
02
20
03
20
04
20
05
20
06
20
07
20
08
20
09
Org
anic
re
cycl
ing
rate
%
Source: Eurostat, 2012. The percentages are calculated as % of generated MSW.
2.1.2 The yearly rate of recycling of MSW
In order to assess the prospects for Belgium to meet the 50 % recycling target as set out in the Waste
Framework Directive 2008/98/EC (EC, 2008)11
, three scenarios have been calculated. The scenarios
assume that recycling in the period 2010 to 2020 develops with the increase rates of recycling in the
periods 2001-2005, 2006-2010 and 2001-2010.
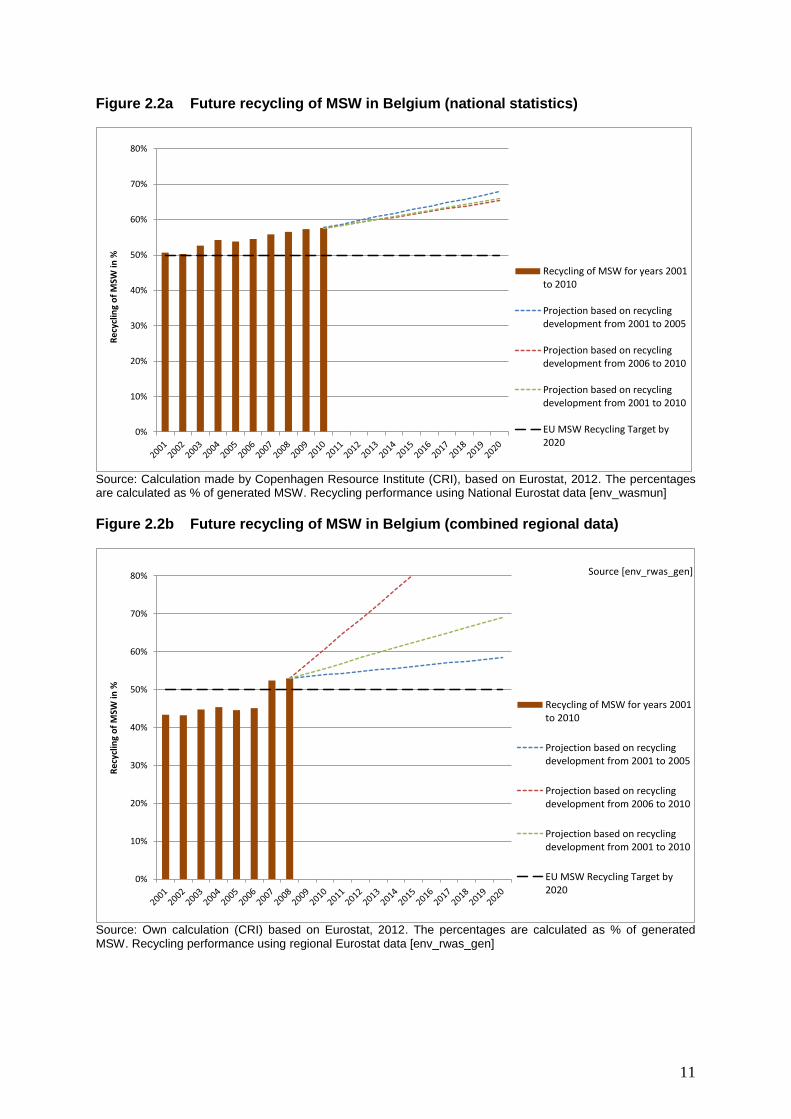
Figure 2.2a indicates that Belgium, as a whole, already met the 2020 EU recycling target in 2003.
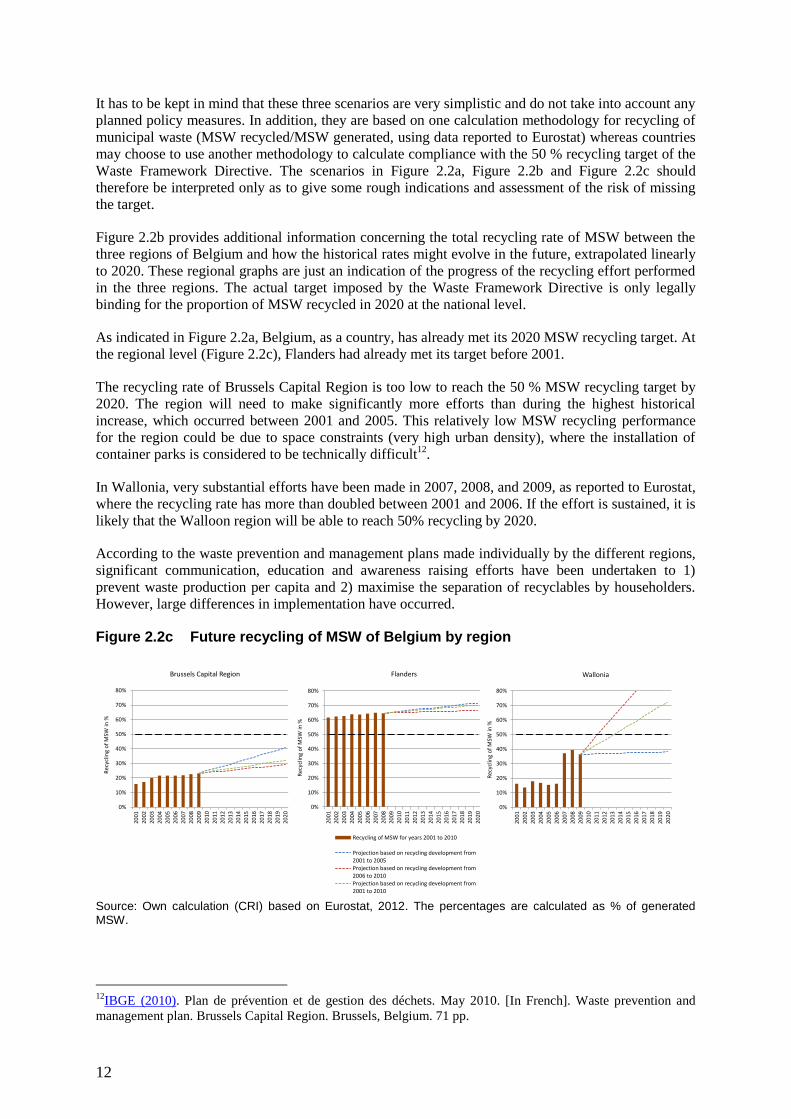
When aggregating the regional data to the national level (figure 2.2b), the recycling targets were
reached in 2007. This statistical difference has no implication concerning the compliance with the
2020 recycling targets, as they have been met in both cases, but raises questions on the validity of the
data reported, which should be addressed.
11
EC (2008). Directive 2008/98/EC of the European Parliament and of the Council of 19 November 2008 on
waste and repealing certain Directives Text with EEA relevance. Official Journal L 312 , 22/11/2008 P. 0003 –
0030.
11
Figure 2.2a Future recycling of MSW in Belgium (national statistics)
0%
10%
20%
30%
40%
50%
60%
70%
80%
Re
cycl
ing
of
MSW
in %
Recycling of MSW for years 2001to 2010
Projection based on recyclingdevelopment from 2001 to 2005
Projection based on recyclingdevelopment from 2006 to 2010
Projection based on recyclingdevelopment from 2001 to 2010
EU MSW Recycling Target by2020
Source: Calculation made by Copenhagen Resource Institute (CRI), based on Eurostat, 2012. The percentages are calculated as % of generated MSW. Recycling performance using National Eurostat data [env_wasmun]
Figure 2.2b Future recycling of MSW in Belgium (combined regional data)
0%
10%
20%
30%
40%
50%
60%
70%
80%
Rec
yclin
g o
f M
SW in
%
Recycling of MSW for years 2001to 2010
Projection based on recyclingdevelopment from 2001 to 2005
Projection based on recyclingdevelopment from 2006 to 2010
Projection based on recyclingdevelopment from 2001 to 2010
EU MSW Recycling Target by2020
Source [env_rwas_gen]
Source: Own calculation (CRI) based on Eurostat, 2012. The percentages are calculated as % of generated MSW. Recycling performance using regional Eurostat data [env_rwas_gen]
12
It has to be kept in mind that these three scenarios are very simplistic and do not take into account any
planned policy measures. In addition, they are based on one calculation methodology for recycling of
municipal waste (MSW recycled/MSW generated, using data reported to Eurostat) whereas countries
may choose to use another methodology to calculate compliance with the 50 % recycling target of the
Waste Framework Directive. The scenarios in Figure 2.2a, Figure 2.2b and Figure 2.2c should
therefore be interpreted only as to give some rough indications and assessment of the risk of missing
the target.
Figure 2.2b provides additional information concerning the total recycling rate of MSW between the
three regions of Belgium and how the historical rates might evolve in the future, extrapolated linearly
to 2020. These regional graphs are just an indication of the progress of the recycling effort performed
in the three regions. The actual target imposed by the Waste Framework Directive is only legally
binding for the proportion of MSW recycled in 2020 at the national level.
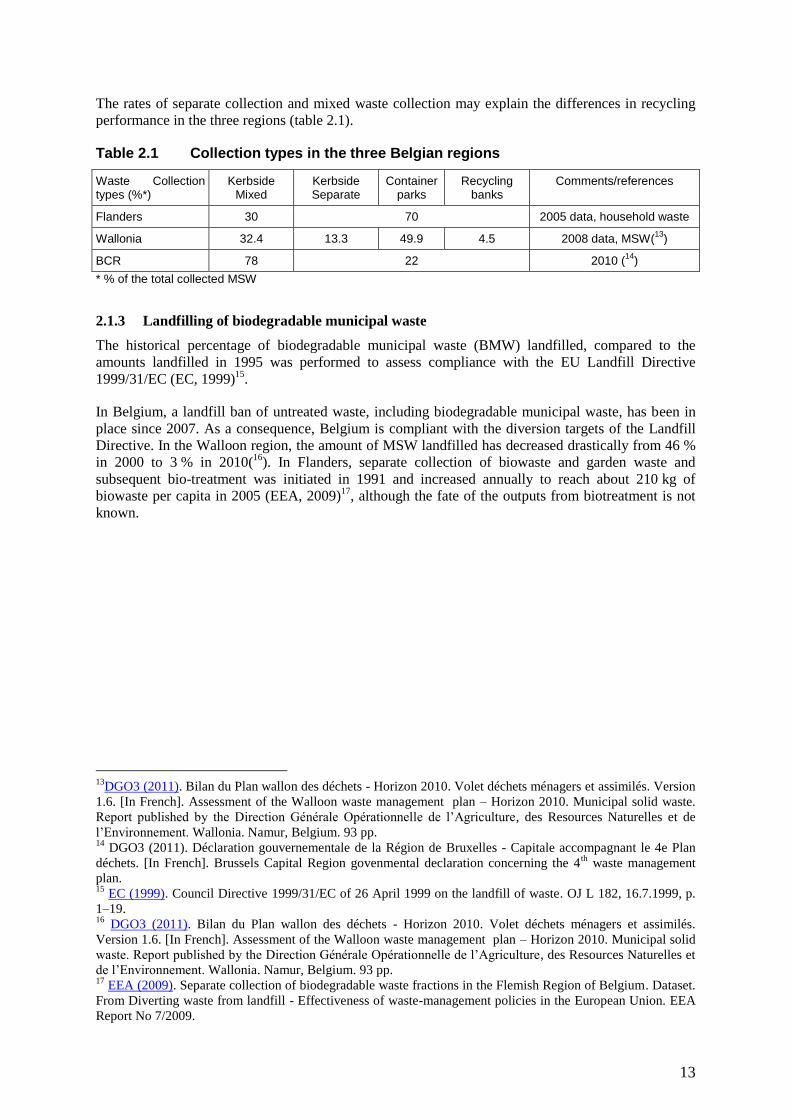
As indicated in Figure 2.2a, Belgium, as a country, has already met its 2020 MSW recycling target. At
the regional level (Figure 2.2c), Flanders had already met its target before 2001.
The recycling rate of Brussels Capital Region is too low to reach the 50 % MSW recycling target by
2020. The region will need to make significantly more efforts than during the highest historical
increase, which occurred between 2001 and 2005. This relatively low MSW recycling performance
for the region could be due to space constraints (very high urban density), where the installation of
container parks is considered to be technically difficult12
.
In Wallonia, very substantial efforts have been made in 2007, 2008, and 2009, as reported to Eurostat,
where the recycling rate has more than doubled between 2001 and 2006. If the effort is sustained, it is
likely that the Walloon region will be able to reach 50% recycling by 2020.
According to the waste prevention and management plans made individually by the different regions,
significant communication, education and awareness raising efforts have been undertaken to 1)
prevent waste production per capita and 2) maximise the separation of recyclables by householders.
However, large differences in implementation have occurred.
Figure 2.2c Future recycling of MSW of Belgium by region
0%
10%
20%
30%
40%
50%
60%
70%
80%
20
01
20
02
20
03
20
04
20
05
20
06
20
07
20
08
20
09
20
10
20
11
20
12
20
13
20
14
20
15
20
16
20
17
20
18
20
19
20
20
Rec
yclin
g o
f M
SW in
%
Brussels Capital Region
0%
10%
20%
30%
40%
50%
60%
70%
80%
20
01
20
02
20
03
20
04
20
05
20
06
20
07
20
08
20
09
20
10
20
11
20
12
20
13
20
14
20
15
20
16
20
17
20
18
20
19
20
20
Rec
yclin
g o
f M
SW in
%
Flanders
Recycling of MSW for years 2001 to 2010
Projection based on recycling development from2001 to 2005Projection based on recycling development from2006 to 2010Projection based on recycling development from2001 to 2010
0%
10%
20%
30%
40%
50%
60%
70%
80%
20
01
20
02
20
03
20
04
20
05
20
06
20
07
20
08
20
09
20
10
20
11
20
12
20
13
20
14
20
15
20
16
20
17
20
18
20
19
20
20
Rec
yclin
g o
f M
SW in
%
Wallonia
Source: Own calculation (CRI) based on Eurostat, 2012. The percentages are calculated as % of generated MSW.
12
IBGE (2010). Plan de prévention et de gestion des déchets. May 2010. [In French]. Waste prevention and
management plan. Brussels Capital Region. Brussels, Belgium. 71 pp.
13
The rates of separate collection and mixed waste collection may explain the differences in recycling
performance in the three regions (table 2.1).
Table 2.1 Collection types in the three Belgian regions
Waste Collection types (%*)
Kerbside Mixed
Kerbside Separate
Container parks
Recycling banks
Comments/references
Flanders 30 70 2005 data, household waste
Wallonia 32.4 13.3 49.9 4.5 2008 data, MSW(13
)
BCR 78 22 2010 (14
)
* % of the total collected MSW
2.1.3 Landfilling of biodegradable municipal waste
The historical percentage of biodegradable municipal waste (BMW) landfilled, compared to the
amounts landfilled in 1995 was performed to assess compliance with the EU Landfill Directive
1999/31/EC (EC, 1999)15
.
In Belgium, a landfill ban of untreated waste, including biodegradable municipal waste, has been in
place since 2007. As a consequence, Belgium is compliant with the diversion targets of the Landfill
Directive. In the Walloon region, the amount of MSW landfilled has decreased drastically from 46 %
in 2000 to 3 % in 2010(16
). In Flanders, separate collection of biowaste and garden waste and
subsequent bio-treatment was initiated in 1991 and increased annually to reach about 210 kg of
biowaste per capita in 2005 (EEA, 2009)17
, although the fate of the outputs from biotreatment is not
known.
13
DGO3 (2011). Bilan du Plan wallon des déchets - Horizon 2010. Volet déchets ménagers et assimilés. Version
1.6. [In French]. Assessment of the Walloon waste management plan – Horizon 2010. Municipal solid waste.
Report published by the Direction Générale Opérationnelle de l’Agriculture, des Resources Naturelles et de
l’Environnement. Wallonia. Namur, Belgium. 93 pp. 14
DGO3 (2011). Déclaration gouvernementale de la Région de Bruxelles - Capitale accompagnant le 4e Plan
déchets. [In French]. Brussels Capital Region govenmental declaration concerning the 4th
waste management
plan. 15
EC (1999). Council Directive 1999/31/EC of 26 April 1999 on the landfill of waste. OJ L 182, 16.7.1999, p.
1–19. 16
DGO3 (2011). Bilan du Plan wallon des déchets - Horizon 2010. Volet déchets ménagers et assimilés.
Version 1.6. [In French]. Assessment of the Walloon waste management plan – Horizon 2010. Municipal solid
waste. Report published by the Direction Générale Opérationnelle de l’Agriculture, des Resources Naturelles et
de l’Environnement. Wallonia. Namur, Belgium. 93 pp. 17
EEA (2009). Separate collection of biodegradable waste fractions in the Flemish Region of Belgium. Dataset.
From Diverting waste from landfill - Effectiveness of waste-management policies in the European Union. EEA
Report No 7/2009.
14
Figure 2.3 Landfilling of biodegradable MSW in Belgium
0%
10%
20%
30%
40%
50%
60%
70%
80%
90%
100%
2006 2007* 2008 2009 2010
Landfilling of biodegradable MSW in Belgium
Landfilling of biodegradablemunicipal waste (BMW) in % ofBMW generated in 1995
Target 2006
Target 2009
Target 2016
Source: EC, 2012 and own calculation (CRI). *Ban on biodegradable municipal waste (data presented only for Flanders).
2.1.4 Regional differences of MSW recycling from 2001 to 2010
We investigated the regional differences of MSW recycling. The included regional data include:
The total % of recycled MSW;
The % of material recycling excluding compost;
The % of organic recycling (compost and other biological treatment).
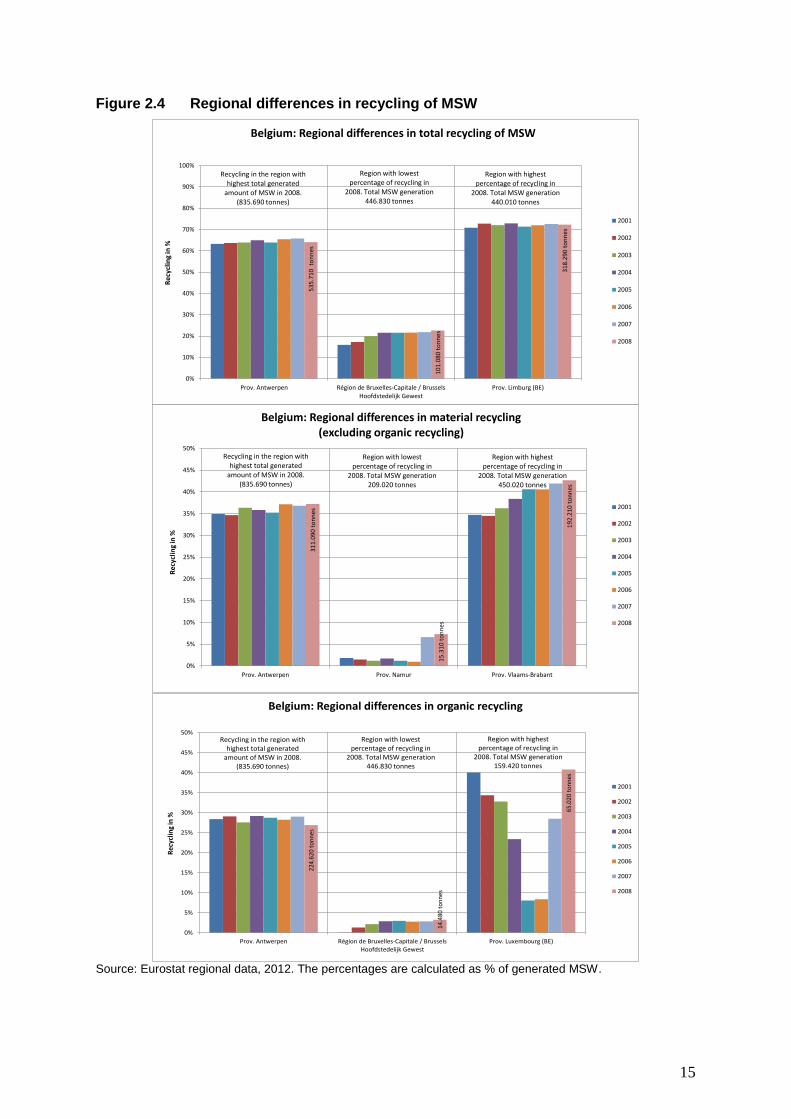
The recycling rates in Belgium are generally very high (greater than 50 %), however it is worth noting
that the Brussels Capital Region has the lowest overall recycling (material and organic recycling),
reportedly caused by a lack of container parks infrastructure due to the high urban density (Figure 2.4
top). The top of Figure 2.4 also indicates that regions producing the highest amount of waste in the
country (such as the province of Antwerp, Flanders) can reach a very high recycling rate, above 60 %.
In terms of material separately collected for recycling, and excluding organic recycling, the province
of Namur has a very low rate, reaching 7 % in 2008 of the MSW generated in that region (Figure 2.4
middle). The highest material recycling was achieved by the province of Vlaams-Brabant, Flanders
with 43 % of generated MSW in 2008. It is also very interesting to note the constant increase of the
material recycling rate that has occurred in this province between 2001 and 2008. This indicates a
very progressive and successful local policy on material separation, which could be used as an
example for other regions in Belgium to follow. Antwerp, generating twice as much waste as Vlaams-
Brabant Province in 2008, has also reached high levels of separate collection for recycling.
Figure 2.4, bottom part, indicates that the Brussels Capital Region has the lowest organic recycling
rate in the country representing 3 % of the generated MSW. This low level of recycling may be due
partly to the high urbanised environment and consequently small quantity of garden waste. The
temporary storage of organic waste in flats may also be an important barrier for organic recycling.
This low level of organic recycling raises the question of the treatment of biodegradable municipal
waste, since there are clear policy aspects concerning the bans of non-treated waste and BMW to
landfills. In contrast, the province of Luxembourg, Wallonia, is the region with the highest organic
waste recycling rate in 2008. This province has a very low demographic density of 61 inhabitants/km2
as opposed to 7000 inhabitants/km2 in the BCR. It is worth noting that the region with the highest
amount of generated MSW in 2008 and a density of 2400 inhabitants/km2, Antwerp in Flanders, has
achieved an organic recycling rate of between 27 % and 29 % of the generated MSW. It can be argued
that such high level of organic recycling could be achieved in other regions with similar demographic
density.
15
Figure 2.4 Regional differences in recycling of MSW
Recycling in the region with highest total generated
amount of MSW in 2008. (835.690 tonnes)
Region with lowest percentage of recycling in
2008. Total MSW generation 446.830 tonnes
Region with highest percentage of recycling in
2008. Total MSW generation 440.010 tonnes
53
5.7
10
to
nn
es
10
1.0
80
to
nn
es
31
8.2
90
to
nn
es
0%
10%
20%
30%
40%
50%
60%
70%
80%
90%
100%
Prov. Antwerpen Région de Bruxelles-Capitale / BrusselsHoofdstedelijk Gewest
Prov. Limburg (BE)
Re
cycl
ing
in %
Belgium: Regional differences in total recycling of MSW
2001
2002
2003
2004
2005
2006
2007
2008
Recycling in the region with highest total generated
amount of MSW in 2008. (835.690 tonnes)
Region with lowest percentage of recycling in
2008. Total MSW generation 209.020 tonnes
Region with highest percentage of recycling in
2008. Total MSW generation 450.020 tonnes
31
1.0
90
to
nn
es
15
.31
0 t
on
nes
19
2.2
10
to
nn
es
0%
5%
10%
15%
20%
25%
30%
35%
40%
45%
50%
Prov. Antwerpen Prov. Namur Prov. Vlaams-Brabant
Re
cycl
ing
in %
Belgium: Regional differences in material recycling (excluding organic recycling)
2001
2002
2003
2004
2005
2006
2007
2008
Recycling in the region with highest total generated
amount of MSW in 2008. (835.690 tonnes)
Region with lowest percentage of recycling in
2008. Total MSW generation 446.830 tonnes
Region with highest percentage of recycling in
2008. Total MSW generation 159.420 tonnes
224.
620
ton
nes
14.4
80 t
on
nes
65.0
20 t
on
nes
0%
5%
10%
15%
20%
25%
30%
35%
40%
45%
50%
Prov. Antwerpen Région de Bruxelles-Capitale / BrusselsHoofdstedelijk Gewest
Prov. Luxembourg (BE)
Rec
yclin
g in
%
Belgium: Regional differences in organic recycling
2001
2002
2003
2004
2005
2006
2007
2008
Source: Eurostat regional data, 2012. The percentages are calculated as % of generated MSW.
16
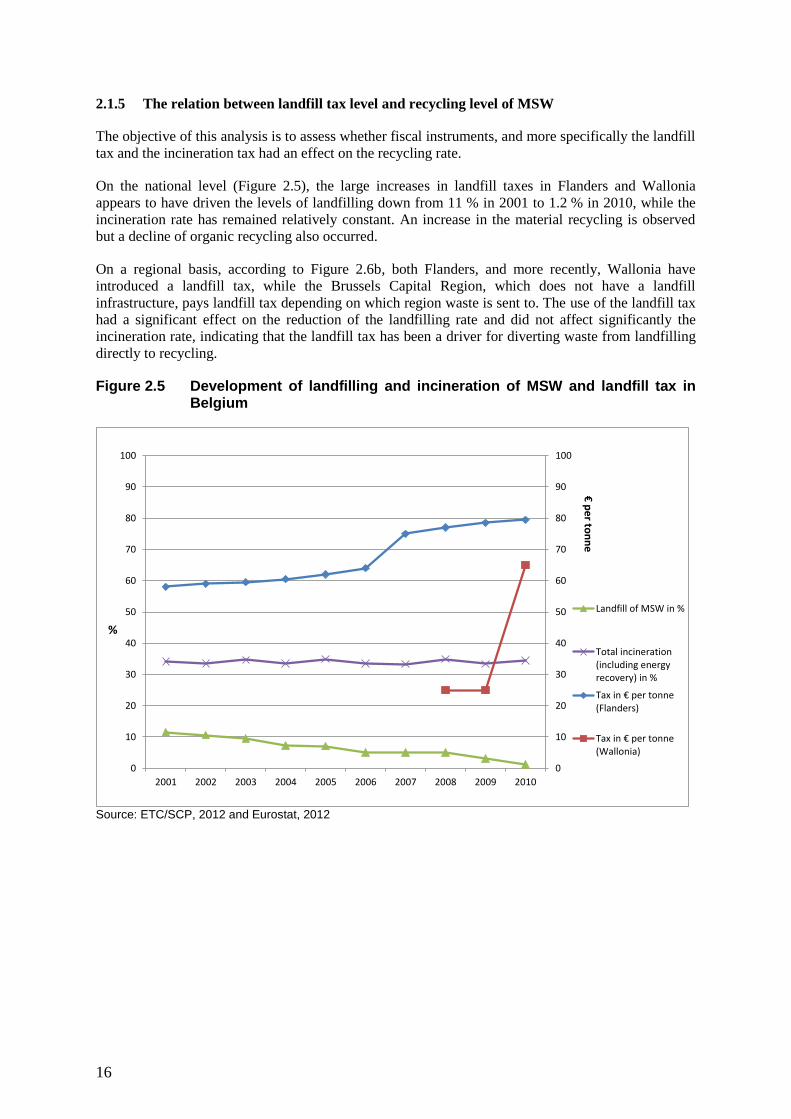
2.1.5 The relation between landfill tax level and recycling level of MSW
The objective of this analysis is to assess whether fiscal instruments, and more specifically the landfill
tax and the incineration tax had an effect on the recycling rate.
On the national level (Figure 2.5), the large increases in landfill taxes in Flanders and Wallonia
appears to have driven the levels of landfilling down from 11 % in 2001 to 1.2 % in 2010, while the
incineration rate has remained relatively constant. An increase in the material recycling is observed
but a decline of organic recycling also occurred.
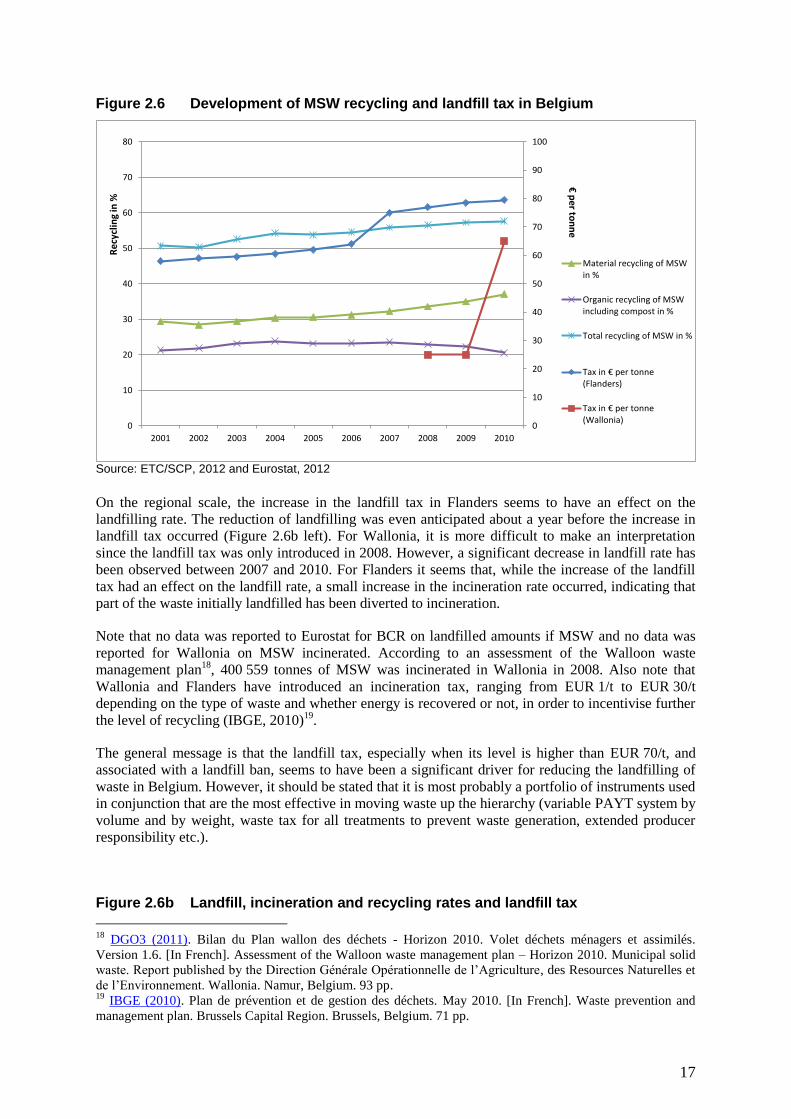
On a regional basis, according to Figure 2.6b, both Flanders, and more recently, Wallonia have
introduced a landfill tax, while the Brussels Capital Region, which does not have a landfill
infrastructure, pays landfill tax depending on which region waste is sent to. The use of the landfill tax
had a significant effect on the reduction of the landfilling rate and did not affect significantly the
incineration rate, indicating that the landfill tax has been a driver for diverting waste from landfilling
directly to recycling.
Figure 2.5 Development of landfilling and incineration of MSW and landfill tax in Belgium
0
10
20
30
40
50
60
70
80
90
100
0
10
20
30
40
50
60
70
80
90
100
2001 2002 2003 2004 2005 2006 2007 2008 2009 2010
€p
er ton
ne
%
Landfill of MSW in %
Total incineration(including energyrecovery) in %
Tax in € per tonne (Flanders)
Tax in € per tonne (Wallonia)
Source: ETC/SCP, 2012 and Eurostat, 2012
17
Figure 2.6 Development of MSW recycling and landfill tax in Belgium
0
10
20
30
40
50
60
70
80
90
100
0
10
20
30
40
50
60
70
80
2001 2002 2003 2004 2005 2006 2007 2008 2009 2010
€p
er ton
ne
Rec
yclin
g in
%
Material recycling of MSWin %
Organic recycling of MSWincluding compost in %
Total recycling of MSW in %
Tax in € per tonne (Flanders)
Tax in € per tonne (Wallonia)
Source: ETC/SCP, 2012 and Eurostat, 2012
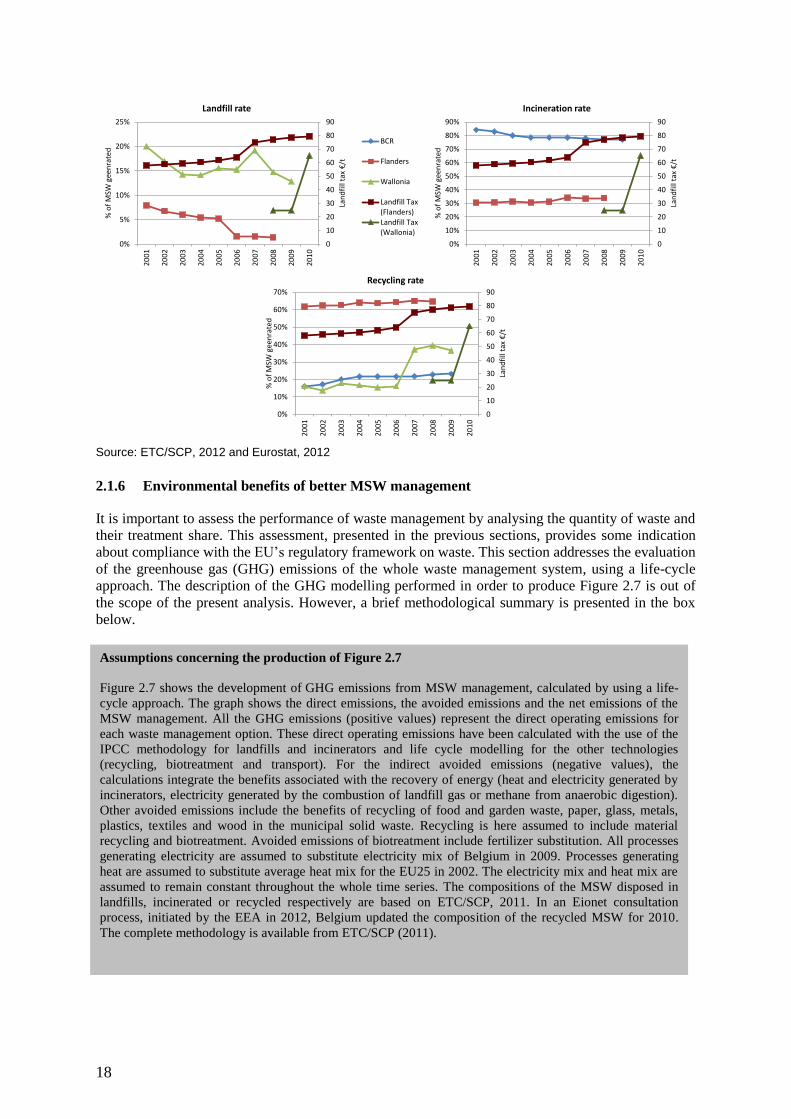
On the regional scale, the increase in the landfill tax in Flanders seems to have an effect on the
landfilling rate. The reduction of landfilling was even anticipated about a year before the increase in
landfill tax occurred (Figure 2.6b left). For Wallonia, it is more difficult to make an interpretation
since the landfill tax was only introduced in 2008. However, a significant decrease in landfill rate has
been observed between 2007 and 2010. For Flanders it seems that, while the increase of the landfill
tax had an effect on the landfill rate, a small increase in the incineration rate occurred, indicating that
part of the waste initially landfilled has been diverted to incineration.
Note that no data was reported to Eurostat for BCR on landfilled amounts if MSW and no data was
reported for Wallonia on MSW incinerated. According to an assessment of the Walloon waste
management plan18
, 400 559 tonnes of MSW was incinerated in Wallonia in 2008. Also note that
Wallonia and Flanders have introduced an incineration tax, ranging from EUR 1/t to EUR 30/t
depending on the type of waste and whether energy is recovered or not, in order to incentivise further
the level of recycling (IBGE, 2010)19
.
The general message is that the landfill tax, especially when its level is higher than EUR 70/t, and
associated with a landfill ban, seems to have been a significant driver for reducing the landfilling of
waste in Belgium. However, it should be stated that it is most probably a portfolio of instruments used
in conjunction that are the most effective in moving waste up the hierarchy (variable PAYT system by
volume and by weight, waste tax for all treatments to prevent waste generation, extended producer
responsibility etc.).
Figure 2.6b Landfill, incineration and recycling rates and landfill tax
18
DGO3 (2011). Bilan du Plan wallon des déchets - Horizon 2010. Volet déchets ménagers et assimilés.
Version 1.6. [In French]. Assessment of the Walloon waste management plan – Horizon 2010. Municipal solid
waste. Report published by the Direction Générale Opérationnelle de l’Agriculture, des Resources Naturelles et
de l’Environnement. Wallonia. Namur, Belgium. 93 pp. 19
IBGE (2010). Plan de prévention et de gestion des déchets. May 2010. [In French]. Waste prevention and
management plan. Brussels Capital Region. Brussels, Belgium. 71 pp.
18
0
10
20
30
40
50
60
70
80
90
0%
5%
10%
15%
20%
25%
20
01
20
02
20
03
20
04
20
05
20
06
20
07
20
08
20
09
20
10
Lan
dfi
ll ta
x €
/t
% o
f M
SW g
een
rate
dLandfill rate
BCR
Flanders
Wallonia
Landfill Tax(Flanders)Landfill Tax(Wallonia)
0
10
20
30
40
50
60
70
80
90
0%
10%
20%
30%
40%
50%
60%
70%
80%
90%
20
01
20
02
20
03
20
04
20
05
20
06
20
07
20
08
20
09
20
10
Lan
dfi
ll ta
x €
/t
% o
f M
SW g
een
rate
d
Incineration rate
0
10
20
30
40
50
60
70
80
90
0%
10%
20%
30%
40%
50%
60%
70%
20
01
20
02
20
03
20
04
20
05
20
06
20
07
20
08
20
09
20
10
Lan
dfi
ll ta
x €
/t
% o
f M
SW g
een
rate
d
Recycling rate
Source: ETC/SCP, 2012 and Eurostat, 2012
2.1.6 Environmental benefits of better MSW management
It is important to assess the performance of waste management by analysing the quantity of waste and
their treatment share. This assessment, presented in the previous sections, provides some indication
about compliance with the EU’s regulatory framework on waste. This section addresses the evaluation
of the greenhouse gas (GHG) emissions of the whole waste management system, using a life-cycle
approach. The description of the GHG modelling performed in order to produce Figure 2.7 is out of
the scope of the present analysis. However, a brief methodological summary is presented in the box
below.
Assumptions concerning the production of Figure 2.7
Figure 2.7 shows the development of GHG emissions from MSW management, calculated by using a life-
cycle approach. The graph shows the direct emissions, the avoided emissions and the net emissions of the
MSW management. All the GHG emissions (positive values) represent the direct operating emissions for
each waste management option. These direct operating emissions have been calculated with the use of the
IPCC methodology for landfills and incinerators and life cycle modelling for the other technologies
(recycling, biotreatment and transport). For the indirect avoided emissions (negative values), the
calculations integrate the benefits associated with the recovery of energy (heat and electricity generated by
incinerators, electricity generated by the combustion of landfill gas or methane from anaerobic digestion).
Other avoided emissions include the benefits of recycling of food and garden waste, paper, glass, metals,
plastics, textiles and wood in the municipal solid waste. Recycling is here assumed to include material
recycling and biotreatment. Avoided emissions of biotreatment include fertilizer substitution. All processes
generating electricity are assumed to substitute electricity mix of Belgium in 2009. Processes generating
heat are assumed to substitute average heat mix for the EU25 in 2002. The electricity mix and heat mix are
assumed to remain constant throughout the whole time series. The compositions of the MSW disposed in
landfills, incinerated or recycled respectively are based on ETC/SCP, 2011. In an Eionet consultation
process, initiated by the EEA in 2012, Belgium updated the composition of the recycled MSW for 2010.
The complete methodology is available from ETC/SCP (2011).
19
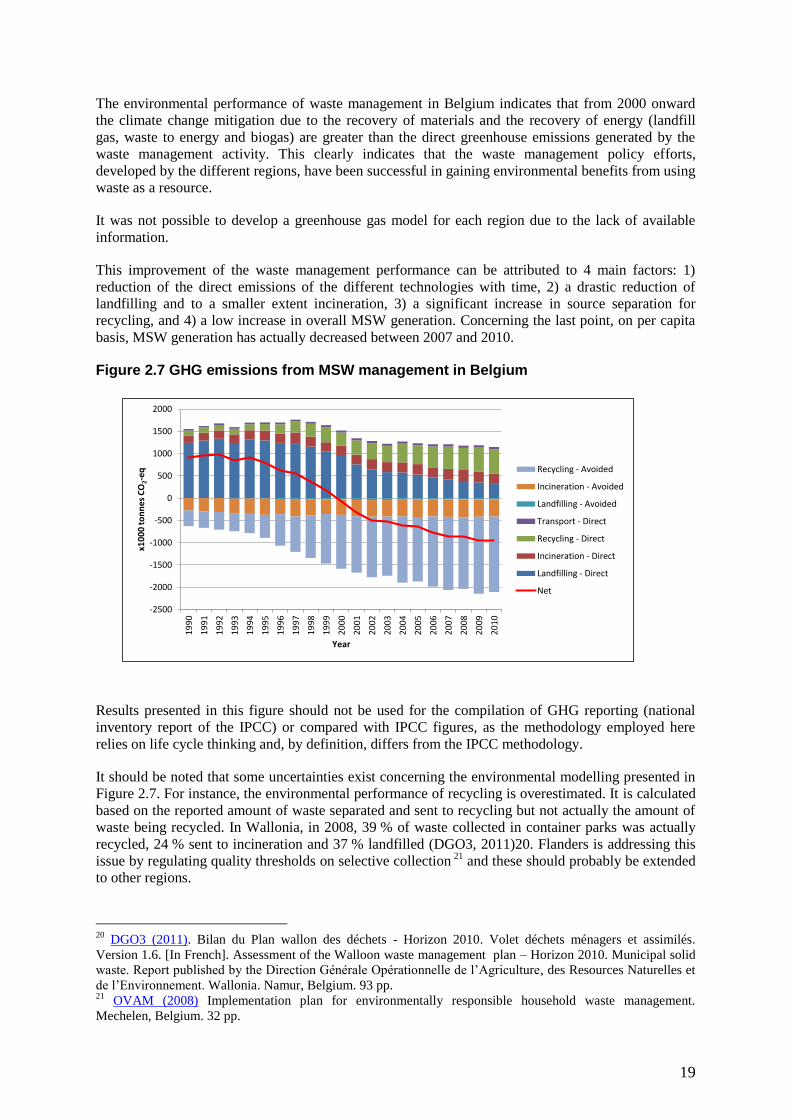
The environmental performance of waste management in Belgium indicates that from 2000 onward
the climate change mitigation due to the recovery of materials and the recovery of energy (landfill
gas, waste to energy and biogas) are greater than the direct greenhouse emissions generated by the
waste management activity. This clearly indicates that the waste management policy efforts,
developed by the different regions, have been successful in gaining environmental benefits from using
waste as a resource.
It was not possible to develop a greenhouse gas model for each region due to the lack of available
information.
This improvement of the waste management performance can be attributed to 4 main factors: 1)
reduction of the direct emissions of the different technologies with time, 2) a drastic reduction of
landfilling and to a smaller extent incineration, 3) a significant increase in source separation for
recycling, and 4) a low increase in overall MSW generation. Concerning the last point, on per capita
basis, MSW generation has actually decreased between 2007 and 2010.
Figure 2.7 GHG emissions from MSW management in Belgium
-2500
-2000
-1500
-1000
-500
0
500
1000
1500
2000
19
90
19
91
19
92
19
93
19
94
19
95
19
96
19
97
19
98
19
99
20
00
20
01
20
02
20
03
20
04
20
05
20
06
20
07
20
08
20
09
20
10
x10
00
to
nn
es
CO
2-eq
Year
Recycling - Avoided
Incineration - Avoided
Landfilling - Avoided
Transport - Direct
Recycling - Direct
Incineration - Direct
Landfilling - Direct
Net
Results presented in this figure should not be used for the compilation of GHG reporting (national
inventory report of the IPCC) or compared with IPCC figures, as the methodology employed here
relies on life cycle thinking and, by definition, differs from the IPCC methodology.
It should be noted that some uncertainties exist concerning the environmental modelling presented in
Figure 2.7. For instance, the environmental performance of recycling is overestimated. It is calculated
based on the reported amount of waste separated and sent to recycling but not actually the amount of
waste being recycled. In Wallonia, in 2008, 39 % of waste collected in container parks was actually
recycled, 24 % sent to incineration and 37 % landfilled (DGO3, 2011)20. Flanders is addressing this
issue by regulating quality thresholds on selective collection 21
and these should probably be extended
to other regions.
20
DGO3 (2011). Bilan du Plan wallon des déchets - Horizon 2010. Volet déchets ménagers et assimilés.
Version 1.6. [In French]. Assessment of the Walloon waste management plan – Horizon 2010. Municipal solid
waste. Report published by the Direction Générale Opérationnelle de l’Agriculture, des Resources Naturelles et
de l’Environnement. Wallonia. Namur, Belgium. 93 pp. 21
OVAM (2008) Implementation plan for environmentally responsible household waste management.
Mechelen, Belgium. 32 pp.
20
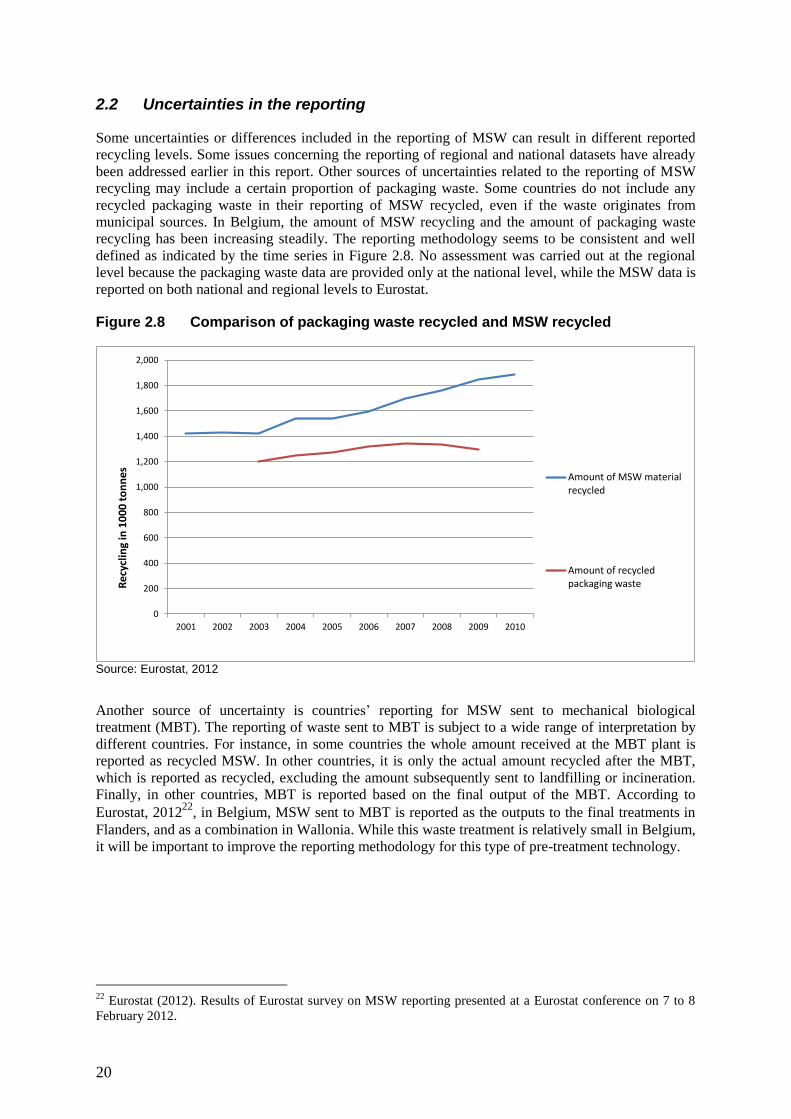
2.2 Uncertainties in the reporting
Some uncertainties or differences included in the reporting of MSW can result in different reported
recycling levels. Some issues concerning the reporting of regional and national datasets have already
been addressed earlier in this report. Other sources of uncertainties related to the reporting of MSW
recycling may include a certain proportion of packaging waste. Some countries do not include any
recycled packaging waste in their reporting of MSW recycled, even if the waste originates from
municipal sources. In Belgium, the amount of MSW recycling and the amount of packaging waste
recycling has been increasing steadily. The reporting methodology seems to be consistent and well
defined as indicated by the time series in Figure 2.8. No assessment was carried out at the regional
level because the packaging waste data are provided only at the national level, while the MSW data is
reported on both national and regional levels to Eurostat.
Figure 2.8 Comparison of packaging waste recycled and MSW recycled
0
200
400
600
800
1,000
1,200
1,400
1,600
1,800
2,000
2001 2002 2003 2004 2005 2006 2007 2008 2009 2010
Rec
yclin
g in
10
00
to
nn
es Amount of MSW materialrecycled
Amount of recycledpackaging waste
Source: Eurostat, 2012
Another source of uncertainty is countries’ reporting for MSW sent to mechanical biological
treatment (MBT). The reporting of waste sent to MBT is subject to a wide range of interpretation by
different countries. For instance, in some countries the whole amount received at the MBT plant is
reported as recycled MSW. In other countries, it is only the actual amount recycled after the MBT,
which is reported as recycled, excluding the amount subsequently sent to landfilling or incineration.
Finally, in other countries, MBT is reported based on the final output of the MBT. According to
Eurostat, 201222
, in Belgium, MSW sent to MBT is reported as the outputs to the final treatments in
Flanders, and as a combination in Wallonia. While this waste treatment is relatively small in Belgium,
it will be important to improve the reporting methodology for this type of pre-treatment technology.
22
Eurostat (2012). Results of Eurostat survey on MSW reporting presented at a Eurostat conference on 7 to 8
February 2012.
21
2.3 Important initiatives taken to improve MSW management
The most important initiatives taken in Belgium to improve MSW management between 2001 and
2010 include the following:
Regularly updated waste management plans;
Strong emphasis on waste prevention;
Mandatory waste separation by householders with fines up to EUR 625 for non-compliance since
2010 (BCR);
High levels of separate collection (kerbside, bring banks and container parks);
Landfill bans and high landfill tax (Flanders and Wallonia);
Incineration ban (Flanders) and incineration tax (Flanders and Wallonia);
Extended producer responsibility;
Quality thresholds for separately collected waste (Flanders);
Colour coded collection bags with variable fees (BCR, Flanders and Wallonia);
Systematic installation of communal container parks (Flanders and Wallonia);
Focus on communication campaigns for waste prevention and separation (BCR, Flanders and
Wallonia); and
Waste prevention and recycling education in schools (BCR, Flanders and Wallonia).
The recycling performance of each region was plotted with key policy initiatives, as presented in
Figures 2.9a, 2.9b and 2.9c.
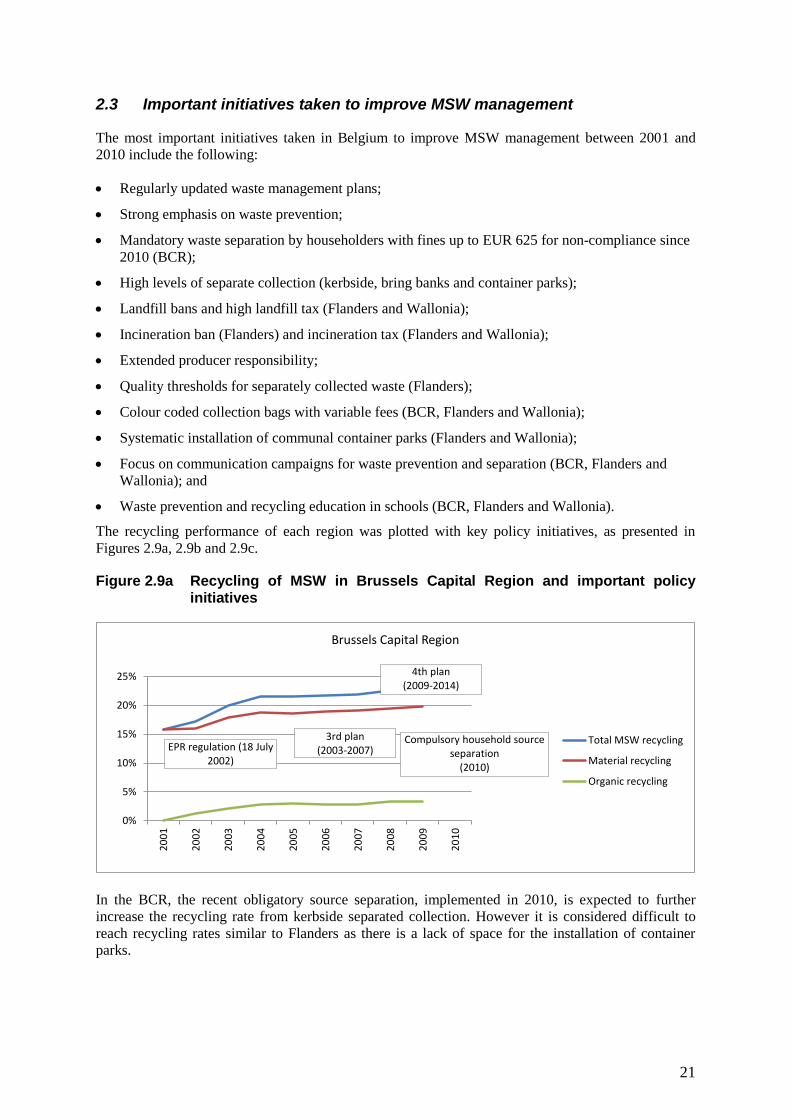
Figure 2.9a Recycling of MSW in Brussels Capital Region and important policy initiatives
0%
5%
10%
15%
20%
25%
20
01
20
02
20
03
20
04
20
05
20
06
20
07
20
08
20
09
20
10
Brussels Capital Region
Total MSW recycling
Material recycling
Organic recycling
3rd plan (2003-2007)
Compulsory household source separation
(2010)
EPR regulation (18 July 2002)
4th plan (2009-2014)
In the BCR, the recent obligatory source separation, implemented in 2010, is expected to further
increase the recycling rate from kerbside separated collection. However it is considered difficult to
reach recycling rates similar to Flanders as there is a lack of space for the installation of container
parks.
22
Figure 2.9b Recycling of MSW in Flanders and important policy initiatives
0%
10%
20%
30%
40%
50%
60%
70%2
00
1
20
02
20
03
20
04
20
05
20
06
20
07
20
08
20
09
20
10
Flanders
Total MSW recycling
Material recycling
Organic recycling
Landfill ban (2006)
Waste management plan (2003 - 2007)
Waste management plan (2008 - 2015)
Landfill ban (2001)
In Flanders, the recycling rate has reached very high levels. It should be noted that the landfill tax was
already at very high level (>EUR 50/t) before 2001 and seems to have been a major driver for the
high recycling rate achieved, despite Flanders being a very densely populated area.
Figure 2.9c Recycling of MSW in Wallonia and important policy initiatives
0%
5%
10%
15%
20%
25%
30%
35%
40%
45%
20
01
20
02
20
03
20
04
20
05
20
06
20
07
20
08
20
09
20
10
Wallonia
Total MSW recycling
Material recycling
Organic recycling
Waste plan 2010(1998)
New incineration capacity(2008)
Landfill bans (2004, 2007, 2008, 2010)
Landfill tax(2007)
New biotreatment capacity(2008)
Wallonia has experienced a drastic change in its recycling rate. When looking more closely, it is due
to the amount of organic waste collected and recycled (composting and biomethanisation) in the
Province of Luxembourg. The other provinces have also managed to significantly increase the organic
recycling rate but about half of the increase observed in the Luxembourg region. The most significant
factors that can explain such a dramatic increase in the organic recycling rate are the very large
increases in the landfill tax (from EUR 25/t in 2008 to EUR 65/t in 2010), in conjunction with a
number of landfill restrictions in 2004, 2007, 2008 and 2010. Additional incineration and biotreatment
capacities have been planned and installed which has enabled the diversion of waste from landfill.
23
2.4 Future possible trends
Belgium, as a country, has already met its recycling obligations. However when the three regions are
studied separately, both BCR and Wallonia need to increase efforts towards higher level of recycling
if they want to reach the 50 % target by 2020. This is mostly true for the BCR. In Wallonia, the steep
increase in landfill tax has driven the region to quickly increase its recycling rates for both material
and organic recycling.
In the Brussels Capital Region, source separation of municipal waste has occurred since the early
nineties, but on a voluntary basis. Since 2010, separate collection of municipal waste is mandatory.
This new instrument is likely to further increase the recycling rate of MSW in subsequent years.
Failure to comply with the mandatory separation of waste by households is sanctioned by a fine of up
to EUR 625, which could well be a strong driver for behavioural change.
Flanders has introduced a maximum threshold of residual waste generation of 150 kg per inhabitant at
the Flemish level and 200 kg at the municipality level. This threshold has been revised in 2010 to
180 kg per inhabitant on the Flemish municipality level.
Waste management policy in Flanders is now including quality thresholds for the separately collected
waste. This new set of policy instruments should potentially reduce the level of contaminations in
recyclable materials and support the further move towards the recycling society. It should be noted,
however, that in practice, it seems rather difficult to monitor the quality of the separated waste. It
seems that continued efforts to educate householders to better separate their waste will be of major
importance to reach these quality thresholds.

24
References
DGO3 (1991). Pour une Wallonie plus propre : plan wallon des déchets 1991-1995. [In French]. For a
Cleaner Wallonia. Waste management plan 1991 – 1995. Ministère de la Région wallonne pour
l’agriculture, l’environnement et le logement, Brussels, Belgium. 32 pp.
DGO3 (1998). Plan wallon des déchets - Horizon 2010. [In French]. Waste management plan for
Wallonia - Horizon 2010. Namur, Belgium. 596 pp.
DGO3 (2010). Déclaration gouvernementale de la Région de Bruxelles - Capitale accompagnant le 4e
Plan déchets. [In French]. Brussels Capital Region govenmental declaration concerning the 4th waste
management plan.
DGO3 (2011). Bilan du Plan wallon des déchets - Horizon 2010. Volet déchets ménagers et assimilés.
Version 1.6. [In French]. Assessment of the Walloon waste management plan – Horizon 2010.
Municipal solid waste. Report published by the Direction Générale Opérationnelle de l’Agriculture,
des Resources Naturelles et de l’Environnement. Wallonia. Namur, Belgium. 93 pp.
EC (1999). Council Directive 1999/31/EC of 26 April 1999 on the landfill of waste. OJ L 182,
16.7.1999, p. 1–19.
EC (2008). Directive 2008/98/EC of the European Parliament and of the Council of 19 November
2008 on waste and repealing certain Directives Text with EEA relevance. Official Journal L 312 ,
22/11/2008 P. 0003 – 0030.
EC, 2011: Commission Decision of 18 November 2011 establishing rules and calculation methods for
verifying compliance with the targets set in Article 11(2) of Directive 2008/98/EC of the European
Parliament and the Council
EC (2012). Member States’ reporting to the European Commission according to Council Directive
1999/31 of 26 April 1999. Landfill Directive and Commission Decision 2000/738/EC concerning a
questionnaire for Member States reports on the implementation of Directive 1999/31/EC on the
landfill of waste. E-mail from the Commission to the EEA on 16 February, 2012.
EEA (2009). Separate collection of biodegradable waste fractions in the Flemish Region of Belgium.
Dataset. From Diverting waste from landfill - Effectiveness of waste-management policies in the
European Union. EEA Report No 7/2009.
ETC/RWM (2008). Evaluation of waste policies related to the Landfill Directive Flanders. Prepared
by Skovgaard, M. and Reichel, A. Working paper 5/2008. Copenhagen, Denmark. 48 pp
ETC/SCP, 2011: Bakas, I., Sieck, M., Hermann, T., Andersen, F. M., Larsen, H. and Reichel, A.
(2011). ‘Projections of Municipal Waste Management and Greenhouse Gases’. ETC/SCP working
paper 4/2011. Copenhagen, Denmark, 89 pp.
http://scp.eionet.europa.eu/publications/2011WP4
ETC/SCP (2012). Christian Fischer, Mathias Lehner and David Lindsay McKinnon ‘Overview of the
use of landfill taxes in Europe’. ETC/SCP Working paper 1, 2012.
http://scp.eionet.europa.eu/publications/WP2012_1
Eurostat (2012). Generation and treatment of municipal waste (1 000 t) by NUTS 2 regions.
[env_rwas_gen]. Accessed 05/07/2012. Last updated 27/01/2012.
Eurostat (2012). Results of Eurostat survey on MSW reporting presented at a Eurostat conference on
7 to 8 February 2012.
25
Eurostat regional data (2012). ‘Generation and treatment of municipal waste (1 000 t) by NUTS 2
regions’, http://epp.eurostat.ec.europa.eu/portal/page/portal/waste/data/database
Accessed May 2012
Eurostat (2012). ‘Waste database municipal waste‘
http://epp.eurostat.ec.europa.eu/portal/page/portal/statistics/search_database, Accessed May 2012
IBGE (2008). Bilan du plan pour la prévention et de gestion des déchets 2003 – 2007. [In French].
Assessment of the waste prevention and management plan 2003 – 2007. Version 21st March 2008.
Brussels Capital Region. Brussels. Belgium. 94 pp.
IBGE (2010). Plan de prévention et de gestion des déchets. May 2010. [In French]. Waste prevention
and management plan. Brussels Capital Region. Brussels, Belgium. 71 pp.
OVAM (2004). Municipal waste management in Flanders - Experiences and Challenges. Prepared by
Parent, F., Vanacker, L, Vandeputte, A. and Wille, D. Mechelen, Belgium. 18 pp.
OVAM (2008) Implementation plan for environmentally responsible household waste management.
Mechelen, Belgium. 32 pp.


![Municipal Solid Waste Update - Global Methane Initiative...1 Municipal Solid Waste Update [JAPAN] [Kunihiko SHIMADA] GMI Municipal Solid Waste Subcommittee Meeting Vancouver, Canada,](https://img.pdfslide.us/doc/110x75/5e4de36d50ecd14cd3180f83/municipal-solid-waste-update-global-methane-initiative-1-municipal-solid-waste.jpg)