Embed Size (px)
Citation preview
MPRAMunich Personal RePEc Archive
Factors determining capital structure ofPakistani non-financial firms.
Mumtaz Hussain Shah and Atta Ullah Khan
30 June 2017
Online at https://mpra.ub.uni-muenchen.de/82015/MPRA Paper No. 82015, posted 23 October 2017 09:11 UTC
46
International Journal of Business Studies Review (IJBSR) Vol. 2, No. 1, June. 2017
46
Factors Determining Capital Structure of Pakistani Non-
Financial Firms Mumtaz Hussain Shah1, Atta Ullah Khan2
1,2Institute of Management Studies, University of Peshawar.
Abstract
This study is undertaken to discover the factors determining the capital structure decision of non-financial
Pakistani firms. The effect of firm’s profitability, liquidity, size, tangibility and non-debt tax shield on capital
structure decision of ten non-financial firms operating at Pakistan Stock Exchange is investigated for a period of
ten years i-e from 2005-2014. By using fixed effects panel estimation method it is found that leverage ratio is
inversely affected by profitability and current ratio of a firm. While, firm size, tangibility and non-debt tax shield
positively effects leverage ratio. The influence of profitability is weakly significant whereas that of liquidity, size,
tangibility and non-debt tax shield are strongly significant. The study also shows that results for profitability and
liquidity are in accordance with the Pecking Order Theory and the result for size; tangibility and non-debt tax
shield are in line with the Trade-Off Theory.
Keywords: Capital Structure, Profitability, Tangibility, Size, Liquidity, Non Debt Tax Shield and Panel Data.
JEL Classifications: G310, G320 and G330.
47
International Journal of Business Studies Review (IJBSR) Vol. 2, No. 1, June. 2017
47
Introduction
The irrelevance theory introduced by Modigliani & Miller (1958) has grown exponentially to enrich the
academic knowledge on the subject. Numerous theoretical and applied studies are added to the literature showing
that capital structure choice is one of the vital corporate financing decisions of a firm. Profit or loss of a firm is
partly based on its financial decision making criterion. It includes the raising of assets from various sources.
Especially, how a firm can best finance its assets between debt, equity and most commonly a combination of both.
If a firm exclusively go for debt financing, which is comparatively an inexpensive source of financing it adds to
a firm’s relative riskiness, reduces its financial flexibility, increases the possibility of bankruptcy and usually a
lower credit rating amongst many others. Debt financing has some benefits also such as interest on debt is tax
deductible.
Modigliani & Miller (1958) capital structure irrelevance theory argues that in the presence of perfect
capital market i.e. in the absence of “taxes and information asymmetries” capital structure does not affect share
price of a firm despite using whatever combination of debt & equity. However, in real world capital structure does
affect the firms’ value. Miller (1988) suggested that a firm’s value is influenced by capital structure because of
market imperfections. The conflicting conjectures of Miller lead to the creation of two main capital structure
theories: The Trade - Off Theory & The Pecking Order Theory.
Myers & Majluf (1984) Pecking Order Theory (POT) argues that there is no optimal capital structure for
an individual firm that will increase the firm’s value. The firm’s manager will finance new investment projects by
using pecking order hierarchy. It starts with using internal funds first then the less risky debt and finally issue new
securities because of asymmetric information and high risk level. Modigliani & Miller (1963) proposed the Trade
- Off Theory. It states that by balancing the benefits and costs of debt there is a target debt level that maximizes
shareholder wealth. The benefits of debts comes in the form of tax saving and reduction of free cash flow which
can increase a firm’s value. However, it shall be kept in mind that a high debt to equity ratio also increases
bankruptcy costs and agency conflict costs. Myers (1984) embracing the Trade - Off Theory explained that a firm
should frequently adjust its capital in accordance with anticipated optimum level. Conversely, imperfection in
capital market may avert sudden change. This refers to adjustment costs and describes that firms tend to move
away from their target capital structure when the adjustments costs are high.
Subsequently, the choice of capital structure is of vital importance for firms and optimal capital structure
is such a combination of liabilities & equities that increases the share price and decreases the weighted average
costs of capital (Akhtar & Oliver, 2009). There are many factors which effects capital structure choice of a firm
such as profitability, liquidity, size, tangibility, non-debt tax shield, earning variability and growth opportunities
etc. Given the divergent postulates of the capital structure theories and the inconclusiveness of empirical studies
as will become clear from the literature review it is imperative to keep exploring the different factors influencing
the capital structure decision of a firm with new variables and distinct time periods for a unique set of industries
or sectors. In this perspective this study attempts to analyse the factors that affect the capital structure of PSE
operating non-financial firms in Pakistan.
Problem Statement
Factors determining the capital structure of non - financial firms in Pakistan.
Research Questions
1. Does a firm’s profitability affect its capital structure choice?
48
International Journal of Business Studies Review (IJBSR) Vol. 2, No. 1, June. 2017
48
2. Does liquidity affect the capital structure decision?
3. Does firm size have any impact on leverage ratio?
4. Does asset tangibility affect the firms leverage ratio? And
5. Does non-debt tax shield affect the capital structure?
Research Objectives
This research primarily aims to analyse: the factors determining the capital structure of non-financial
firms in Pakistan. The effect of profitability, liquidity, firm size, non - debt tax shield and tangibility on leverage
ratio are analysed to answer the principal objective.
Research Hypothesis
The following hypotheses are developed to answer the research question of this study.
H0: The controlling variables do not affect the capital structure of a non - financial Pakistani firm
significantly.
H1: The controlling variables significantly affect the capital structure of a non - financial Pakistani firm.
Limitations of the Study
The limitations of the study are given below.
This study is confined only to those variables which can affect the capital structure choice of the non -
financial firms operating in Pakistan such as firm’s profitability, liquidity, size, tangibility and non - debt tax
shield. There are several other elements which can affect the capital structure choice which are not included in
this study. Due to unavailability of complete data only ten non - financial firms for which complete data was
available during the selected time horizon are chosen.
Scope of the Study
This research study is confined only to non - financial firms operating in Pakistan for the time period of 2005
to 2014.
Scheme of Study
The study is divided into five parts. Part one is the introduction, two the literature review. Part three
discuss research methodology and develops the theoretical framework diagram. Part four includes data analysis,
model specification, descriptive statistics, multicollinearity, heteroscedasticity and the empirical results. Part five
summarising the results concludes the research study.
Literature Review
Chen, Lensink and Sterken (1998) examined capital structure determinants of Dutch firms. Using panel
data it was concluded that pecking order theory (POT here after) is most appropriate for describing financing
decision of Dutch firms. The study shows that measurement choices of leverage can yield completely different
empirical results. For instance the relationship between leverage and explanatory variables do not yield the same
sign with respect to book value and market value leverage.
Chen (2004) studied capital structure determinants of the Chinese listed companies. Using regression
analysis on data from the balance sheets of listed Chinese companies for five years from 1995 – 2000, it was found
that profitability, tangibility and firm size have a significant impact on long term leverage ratio. The study shows
that the coefficient of size is significantly negative for long term leverage but positive in total leverage estimations.
Shah and Hijazi (2004) worked on the capital structure determinants of 445 Karachi Stock Exchange listed non -
49
International Journal of Business Studies Review (IJBSR) Vol. 2, No. 1, June. 2017
49
financial firms from 1997-2001. Applying pooled regression model it was found that tangibility is positively
related with leverage ratio but statistically insignificant, while size has positive association with debt ratio. This
research also shows that profitability has a strong negative association with debt ratio and thus linked with pecking
order theory.
Drobetz and Fix (2005) worked on capital structure determinants of Swiss firms. They tested leverage
forecasts of trade-off theory (TOT here after) and POT models by using a representative sample of Swiss data.
Their study illustrates that leverage for Swiss firms at an aggregate level is comparatively low. The study also
shows that firms having more investment opportunities are less dependent on leverage and follow both the TOT
& POT.
Huang (2006) investigated the capital structure determinants of 1200 Chinese listed firms from 1994 -
2003. It is found that size and tangibility have a positive impact whereas profitability and non - debt tax shield
have a negative association with debt ratio. This study concludes that Chinese companies tend to have a lower
long term debt.
Rafiq, Iqbal and Atiq (2008) examined capital structure causal factors of 26 KSE listed Pakistani
chemical industry firms for 1993 - 2004. Pooled regression analysis suggests that profitability and tangibility have
a negative sway on debt ratio and these results are consistent with pecking order theory (POT). Their study also
shows that non-debt tax shield has positive bearing on leverage ratio.
Afza and Hussain (2011) studied capital structure determinants of selected manufacturing sectors of
Pakistan including seven cable & electrical goods and eight engineering firms for five years from 2003 to 2007.
Using pooled regression analysis it is shown that both trade - off theory (TOT) & pecking order theory (POT)
determine capital structure. Tangibility and size of automobile & engineering sectors have insignificant positive
impact on debt ratio. On the contrary, in cable and electrical goods they exert a negative influence on leverage.
Awan, Rashid and Rehman (2011) explored the factors effecting capital structure of 31 sugar and allied industries
of Pakistan for the years 1996 to 2004. Utilising pooled regression method it is concluded that only profitability
have a significant effect on leverage. Sheikh and Wang (2011) scrutinised factors that affect capital structure
choice of 160 Pakistani manufacturing firms from 2003 to 2007. Their findings show that profitability, liquidity
and tangibility has a negative whereas size has a positive association with leverage ratio. This study also shows
that non-debt tax shield has no significant association with debt ratio. These findings are in accordance with TOT,
POT and agency theory.
Lim (2012) worked on capital structure determinants of 31 A-share Chinese financial service firms for
2005 to 2009. This study found that profitability and non - debt tax shield have negative relationship with leverage
while size is positively associated with it. Qayyum (2013) analysed capital structure determinants of 70 cement
sector Pakistani companies from 2007 - 2009. Through correlation analysis it was found that all the explanatory
variables have significant relationship with leverage except size.
Alzomaia (2014) scrutinized capital structure determinants of 93 publicly listed firms of Saudi Arabia
from 2000-2010. Employing cross-sectional pooled data model it is found that size exerts a direct positive
influence on capital structure whereas tangibility of assets and firms profitability have a negative influence on
capital structure. Awan and Amin (2014) explored capital structure determinants of 68 Pakistani textile firms from
2006-2012. Applying panel data techniques it is found that liquidity, non - debt tax shield and tangibility have
statistically significant linear relationship with leverage while profitability and firm size negatively influence debt
50
International Journal of Business Studies Review (IJBSR) Vol. 2, No. 1, June. 2017
50
ratio. It means that Pakistani textile sector follow both trade-off and pecking order theory. Baltaci and Ayaydin
(2014) considered macroeconomic factors that affect the capital structure of Turkish banking sector firms.
Exploiting regression analysis on quarterly firm - level data of 39 banks from 2002-2012, it is found that firm size
and leverage ratio are positively related, while assets tangibility and firm’s profitability are negatively linked with
leverage. The results for tangibility and profitability are related with POT, while the one for firm size is associated
with TOT. Bassey, Arene and Okpukpara (2014) probed capital structure determinants of twenty eight Agro-allied
firms in Nigeria from 2005-2010. Employing OLS it was concluded that size & profitability of firm are negatively
associated, while growth has a significant positive relationship with short term leverage. It is also suggested that
profitability has a negative whereas size has a statistically positive impact on long term leverage. These results
followed POT. Masnoon and Saeed (2014) analysed capital structure determinants of ten KSE listed automobile
companies from 2008-2012. The results show that profitability and liquidity of a firm have negatively significant
while size and tangibility have insignificant correlation with debt ratio. Osaretin and Michael (2014) examined
factors determining capital structure of 20 Nigerian listed firms. By applying cross sectional analysis they found
that firm’s profitability has insignificant and negative impact on debt ratio, whereas the impact of size was not
confirmed in the model. Several other factors which can affect the capital structure choice such as assets tangibility
and liquidity are not included in this study.
Research Methodology
Population of the Study
The population of this study comprises of all non - financial firms operating in Pakistan including
manufacturing, cement, textile, sugar, engineering, electrical, pharmaceutical and oil & gas etc.
Sample of the Study
In general the sample of study targets all Pharma, Oil and Gas companies of Pakistan. However, several
adjustments have to be made and finally it focuses exclusively on those firms for which complete data was
obtainable for ten years from 2005 - 2014. Eventually, choosing only ten non - financial sector firms of which
four are Pharma and six Oil and Gas companies.
Data Collection Method
The data is secondary in nature and is collected from annual reports i.e. financial statements, profit &
loss accounts and cash flow analysis of Pharma, Oil & Gas firms operating at PSE.
Theoretical Framework
Theoretical framework is an indispensable part of the research methodology to be employed. It is defined
by Sekaran and Bougie (2003, page 97) as “a framework which describes the relationship amongst the variables,
elaborate the theory carrying these associations and defines the nature and way of the association”. Based on these
associations and the researchers personal intuition and knowledge he/she formulates a theoretical model through
which reasonable arguments or hypothesis concerning the relationship amongst the numerous factors that have
been recognized as essential to the problem are developed and tested (Shah & Afridi, 2015).
Capital Structure Theories
Modigliani & Miller Irrelevance Theory
To determine the optimal capital structure many research studies have been conducted in order to enhance
the share price of a firm. Modigliani and Miller (1958), Irrelevance Theory postulates that under perfect capital
51
International Journal of Business Studies Review (IJBSR) Vol. 2, No. 1, June. 2017
51
market a firm value is not affected by its capital structure. It means that share price of a firm is free of optimal
capital structure. But in reality because of market imperfection optimal capital structure does affect the share
value. In order to recognize the influence of taxation, asymmetric information & agency problem in relation to
capital structure, the Trade - Off Theory, the Pecking Order Theory and Agency Cost Theory have been
established respectively.
The Trade - Off Theory
The Trade - Off Theory (TOT) of capital structure was introduced by Modigliani & Miller (1963) which
suggest that by balancing the benefits of tax saving and cost of bankruptcy there is a target level of debt that
increases share value. TOT mainly explains two concepts: financial distress & agency costs. This theory argues
that debt financing is advantageous because the interest paid on debt is tax deductible. Firms are interested in
raising cash flows & therefore, will prefer a higher debt level at a higher tax rate. Thus, tax rate is positively
associated with leverage. Nonetheless, the chances of inability to repay the debt surges with the rising of debt
beyond the optimum level. Consequently, a firm can even get insolvent and as a result of default the
ownership/control passes from shareholders to bond holders. The insolvency costs consist of direct and indirect
bankruptcy costs.
The Pecking Order Theory
Pecking Order Theory (POT) also known as the information asymmetry theory was postulated by Myers
and Majluf (1984). This theory states that firms use internal funds such as retained earnings first because of
relatively low costs than debts. It then uses debt financing because of relatively lower costs than equity. By
introducing the information effect Myers and Majluf argue that “asymmetric information’’ influences a firm’s
value. For example declarations made by the managers about the expected changes in capital structure provide a
direction to contemporary & prospective investors to make new or withdraw their existing investments. Myers
(2001) suggested the pecking order hierarchies as: A firm will first choose retained earnings, then select external
finance and will finance with equity as a last resort. Because of asymmetric information the firms’ managers have
more information in comparison to outside investors. Hence when securities become overvalued in financial
market then the managers shall issue new securities.
The Agency Cost Theory
The typical Agency Cost Theory was presented by Berle and Means (1932 & 1991). It recognises that
there is a conflict between shareholders and managers interest. The firm manager is interested in the maximization
of his own wealth, while the shareholders want to maximize value of the firm. To resolve these conflicts between
managers and shareholders agency cost theory provide decision rights and incentives. According to Simerly and
Li (2002) the incentives recommended by agency theory to realize the allocation of capital from organization to
investors is debt financing. The use of debt by the firm causes agency costs. The conflict between debt providers
and manager on one side and shareholders on the other leads to agency costs. Debt financing is a tool of
diminishing the volume of free cash available to the manager. This in turn eliminates the conflict between manager
and shareholder. Barnea, Haugen and Senbet (1980) suggested that the agency costs because of asymmetric
information can be resolved through debt maturity structure and call provision. Hence, the agency cost theory
provides a good justification for firms to raise the amount of debt in the capital structure as a disciplinary guide
to a firm manager.
52
International Journal of Business Studies Review (IJBSR) Vol. 2, No. 1, June. 2017
52
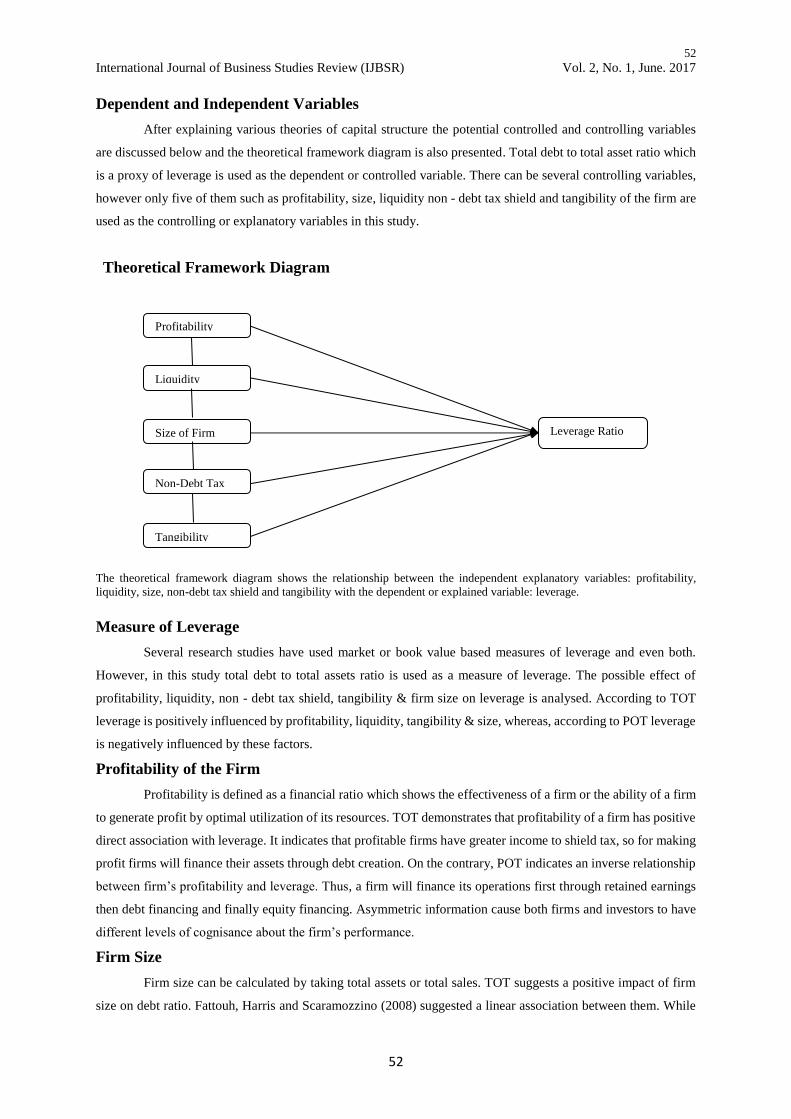
Dependent and Independent Variables
After explaining various theories of capital structure the potential controlled and controlling variables
are discussed below and the theoretical framework diagram is also presented. Total debt to total asset ratio which
is a proxy of leverage is used as the dependent or controlled variable. There can be several controlling variables,
however only five of them such as profitability, size, liquidity non - debt tax shield and tangibility of the firm are
used as the controlling or explanatory variables in this study.
Theoretical Framework Diagram
The theoretical framework diagram shows the relationship between the independent explanatory variables: profitability,
liquidity, size, non-debt tax shield and tangibility with the dependent or explained variable: leverage.
Measure of Leverage
Several research studies have used market or book value based measures of leverage and even both.
However, in this study total debt to total assets ratio is used as a measure of leverage. The possible effect of
profitability, liquidity, non - debt tax shield, tangibility & firm size on leverage is analysed. According to TOT
leverage is positively influenced by profitability, liquidity, tangibility & size, whereas, according to POT leverage
is negatively influenced by these factors.
Profitability of the Firm
Profitability is defined as a financial ratio which shows the effectiveness of a firm or the ability of a firm
to generate profit by optimal utilization of its resources. TOT demonstrates that profitability of a firm has positive
direct association with leverage. It indicates that profitable firms have greater income to shield tax, so for making
profit firms will finance their assets through debt creation. On the contrary, POT indicates an inverse relationship
between firm’s profitability and leverage. Thus, a firm will finance its operations first through retained earnings
then debt financing and finally equity financing. Asymmetric information cause both firms and investors to have
different levels of cognisance about the firm’s performance.
Firm Size
Firm size can be calculated by taking total assets or total sales. TOT suggests a positive impact of firm
size on debt ratio. Fattouh, Harris and Scaramozzino (2008) suggested a linear association between them. While
Profitability
Liquidity
Size of Firm
Non-Debt Tax Shield
Tangibility
Leverage Ratio
53
International Journal of Business Studies Review (IJBSR) Vol. 2, No. 1, June. 2017
53
POT suggest that size has negative influence on leverage. Rajan and Zingales (1995) found that large firms go for
equity financing because of asymmetric information.
Tangibility of the Firm
According to TOT a firm’s fixed assets are positively related with debt ratio. Miller (1998) and Myers
and Majluf (1984) advocated that the collection of firm’s assets influence financial policies of the firm. Whereas,
pecking order theory shows a positive association between fixed assets and long term leverage and negative
association between fixed assets and short term debt ratio.
Non Debt Tax Shields
According to the studies of Myers (1984); Myers and Majluf (1984); Masulis and Korwar (1986);
DeAngelo, DeAngelo and Whited (2011) both TOT and POT shows negative relationship between non-debt tax
shield and debt ratios. However, other empirical results shows leverage is positively influenced by non-debt tax
shield for example Karadenİz, Kandİr, Balcİlar, & Onal, (2009).
Liquidity of Firm
Liquidity of firm is defined as the amount of current assets that are financed by current liabilities. Tarde
- Off Theory postulates that liquidity of firm has positive influence on leverage. Whereas, Pecking Order Theory
suggests that liquidity of firm have a negative effect on leverage. This negative relationship is because of high
agency costs of liquidity. A positive association on the contrary suggests that liquid firms are capable of paying
its liabilities as they mature. Some research studies also found that liquidity of firm has a negative bearing on
leverage e-g Sheikh and Wang (2011).
Data Estimation Issues and Results
Model Specification
The regression model can be specified as given below:
𝑳𝒆𝒗𝒆𝒓𝒂𝒈𝒆𝒋𝒕 =𝜶𝟎 + 𝜷𝟏𝑭𝒊𝒓𝒎𝑺𝒊𝒛𝒆𝒋𝒕 + 𝜷𝟐𝑵𝒐𝒏 − 𝑫𝒆𝒃𝒕𝑻𝒂𝒙𝑺𝒉𝒊𝒆𝒍𝒅𝒋𝒕 + 𝜷𝟑𝑻𝒂𝒏𝒈𝒊𝒃𝒊𝒍𝒊𝒕𝒚𝒋𝒕
+𝜷𝟒𝑭𝒊𝒓𝒎 𝑷𝒓𝒐𝒇𝒊𝒕𝒊𝒃𝒊𝒍𝒊𝒕𝒚𝒋𝒕 + 𝜷𝟓 𝑪𝒖𝒓𝒓𝒆𝒏𝒕 𝑹𝒂𝒕𝒊𝒐𝒋𝒕 + 𝝃𝒋𝒕𝟏
Where 𝜶𝟎 = Constant, β1, β2, β3, β4 and β5 are coefficients of the corresponding controlling variables
and 𝜉𝑗𝑡 is the error term. t represents the time period and j a particular firm. Both vary from 1 to 10.
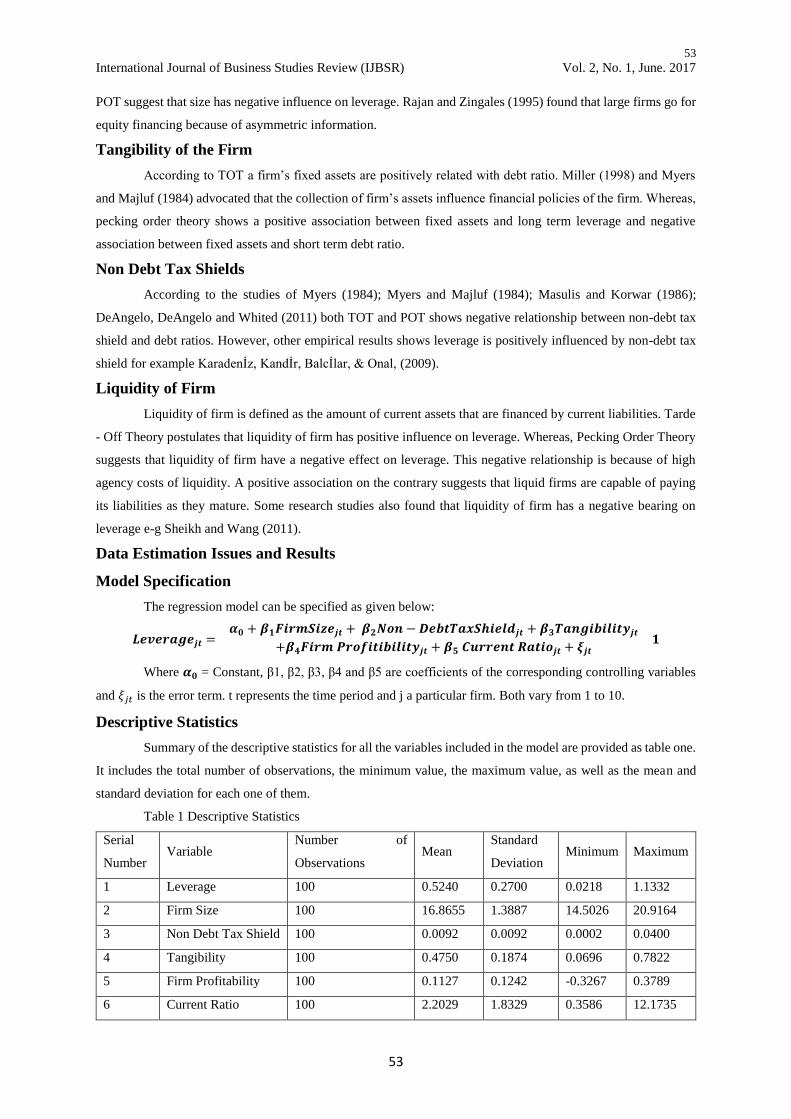
Descriptive Statistics
Summary of the descriptive statistics for all the variables included in the model are provided as table one.
It includes the total number of observations, the minimum value, the maximum value, as well as the mean and
standard deviation for each one of them.
Table 1 Descriptive Statistics
Serial
Number Variable
Number of
Observations Mean
Standard
Deviation Minimum Maximum
1 Leverage 100 0.5240 0.2700 0.0218 1.1332
2 Firm Size 100 16.8655 1.3887 14.5026 20.9164
3 Non Debt Tax Shield 100 0.0092 0.0092 0.0002 0.0400
4 Tangibility 100 0.4750 0.1874 0.0696 0.7822
5 Firm Profitability 100 0.1127 0.1242 -0.3267 0.3789
6 Current Ratio 100 2.2029 1.8329 0.3586 12.1735
54
International Journal of Business Studies Review (IJBSR) Vol. 2, No. 1, June. 2017
54
Multicollinearity
Multicollinearity is one of the most common problems of an econometric model (Shah, 2016).
Multicollinearity to some extent always exists in the data. However, we have to check whether it is “severe” or
not (Shah, 2017a). Multicollinearity can be detected through the correlation between the independent variables as
well as the Variance Inflation Factor (VIF).
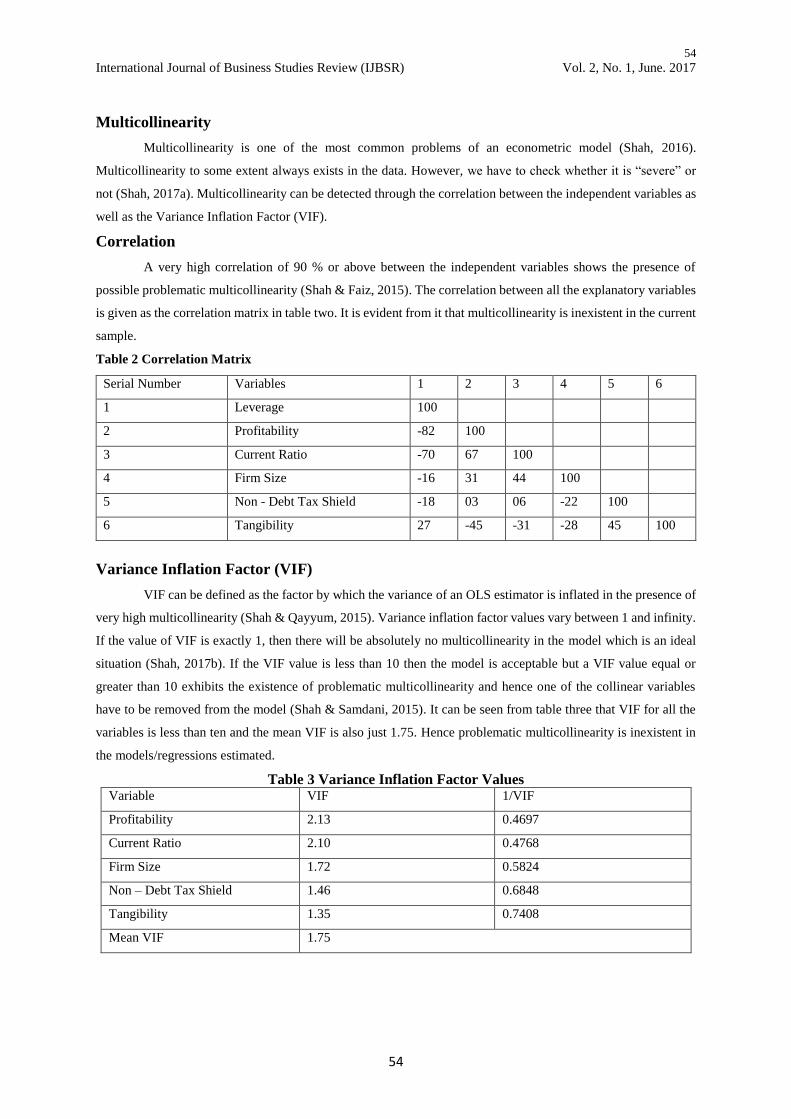
Correlation
A very high correlation of 90 % or above between the independent variables shows the presence of
possible problematic multicollinearity (Shah & Faiz, 2015). The correlation between all the explanatory variables
is given as the correlation matrix in table two. It is evident from it that multicollinearity is inexistent in the current
sample.
Table 2 Correlation Matrix
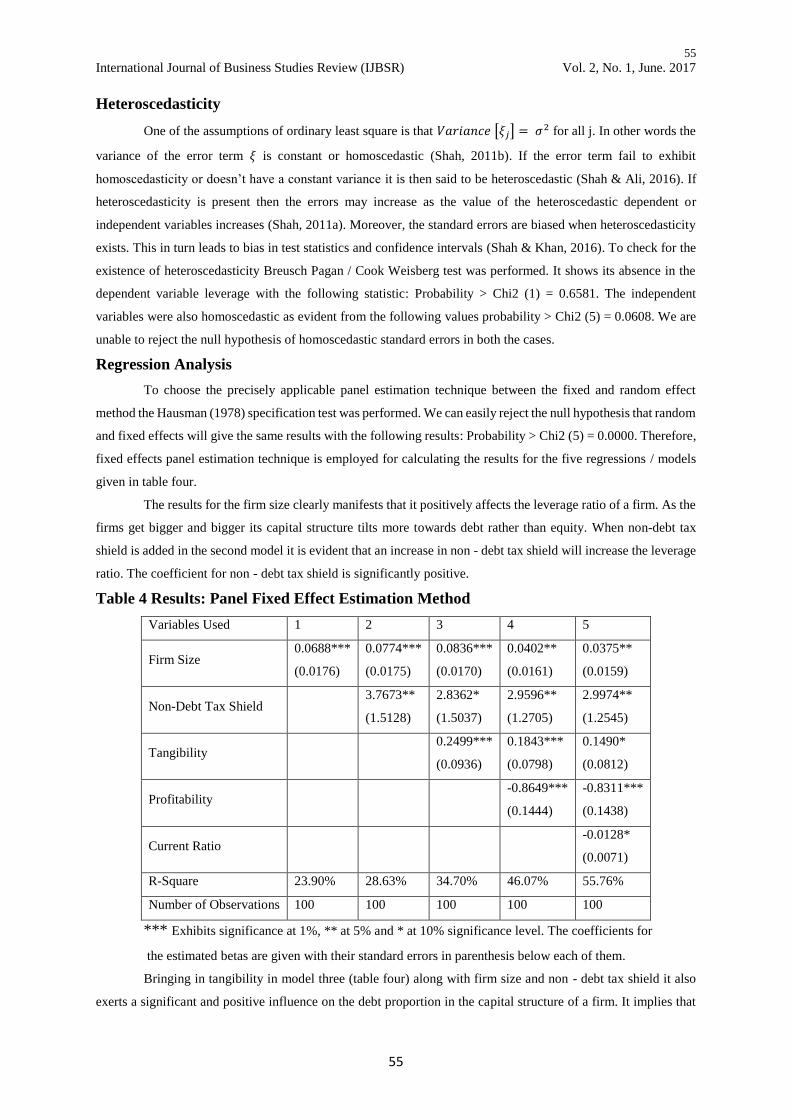
Variance Inflation Factor (VIF)
VIF can be defined as the factor by which the variance of an OLS estimator is inflated in the presence of
very high multicollinearity (Shah & Qayyum, 2015). Variance inflation factor values vary between 1 and infinity.
If the value of VIF is exactly 1, then there will be absolutely no multicollinearity in the model which is an ideal
situation (Shah, 2017b). If the VIF value is less than 10 then the model is acceptable but a VIF value equal or
greater than 10 exhibits the existence of problematic multicollinearity and hence one of the collinear variables
have to be removed from the model (Shah & Samdani, 2015). It can be seen from table three that VIF for all the
variables is less than ten and the mean VIF is also just 1.75. Hence problematic multicollinearity is inexistent in
the models/regressions estimated.
Table 3 Variance Inflation Factor Values Variable VIF 1/VIF
Profitability 2.13 0.4697
Current Ratio 2.10 0.4768
Firm Size 1.72 0.5824
Non – Debt Tax Shield 1.46 0.6848
Tangibility 1.35 0.7408
Mean VIF 1.75
Serial Number Variables 1 2 3 4 5 6
1 Leverage 100
2 Profitability -82 100
3 Current Ratio -70 67 100
4 Firm Size -16 31 44 100
5 Non - Debt Tax Shield -18 03 06 -22 100
6 Tangibility 27 -45 -31 -28 45 100
55
International Journal of Business Studies Review (IJBSR) Vol. 2, No. 1, June. 2017
55
Heteroscedasticity
One of the assumptions of ordinary least square is that 𝑉𝑎𝑟𝑖𝑎𝑛𝑐𝑒 [𝜉𝑗] = 𝜎2 for all j. In other words the
variance of the error term 𝜉 is constant or homoscedastic (Shah, 2011b). If the error term fail to exhibit
homoscedasticity or doesn’t have a constant variance it is then said to be heteroscedastic (Shah & Ali, 2016). If
heteroscedasticity is present then the errors may increase as the value of the heteroscedastic dependent or
independent variables increases (Shah, 2011a). Moreover, the standard errors are biased when heteroscedasticity
exists. This in turn leads to bias in test statistics and confidence intervals (Shah & Khan, 2016). To check for the
existence of heteroscedasticity Breusch Pagan / Cook Weisberg test was performed. It shows its absence in the
dependent variable leverage with the following statistic: Probability > Chi2 (1) = 0.6581. The independent
variables were also homoscedastic as evident from the following values probability > Chi2 (5) = 0.0608. We are
unable to reject the null hypothesis of homoscedastic standard errors in both the cases.
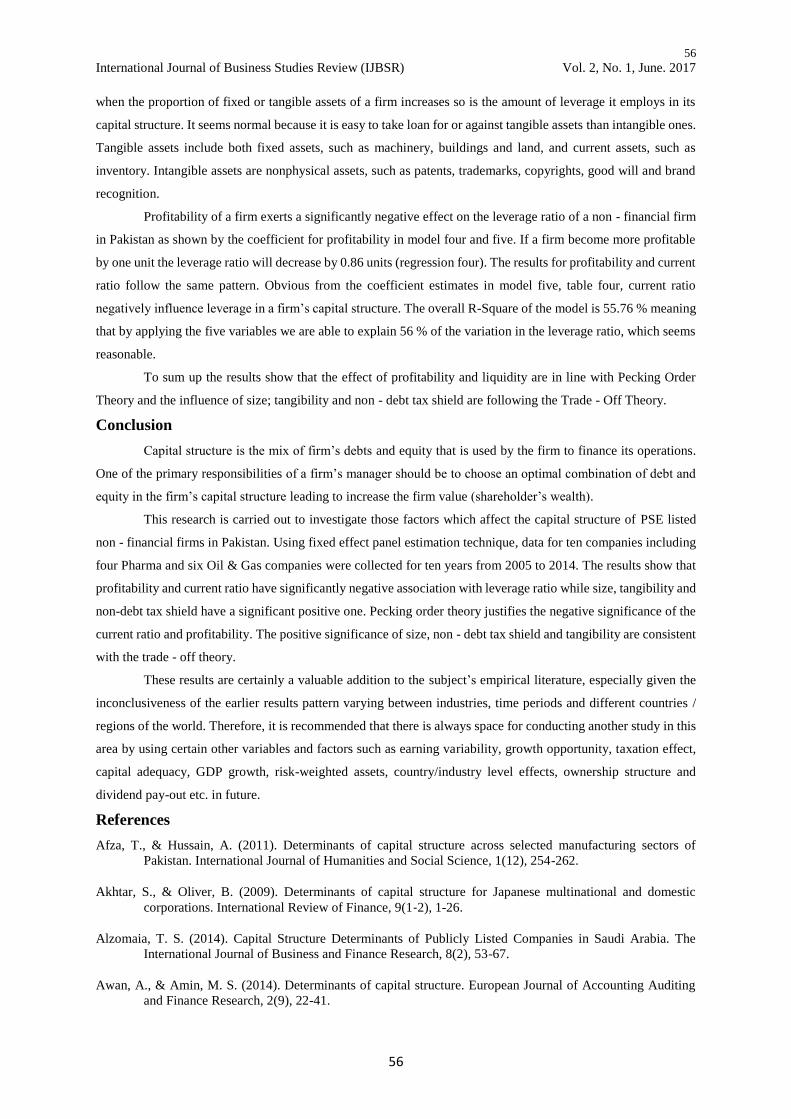
Regression Analysis
To choose the precisely applicable panel estimation technique between the fixed and random effect
method the Hausman (1978) specification test was performed. We can easily reject the null hypothesis that random
and fixed effects will give the same results with the following results: Probability > Chi2 (5) = 0.0000. Therefore,
fixed effects panel estimation technique is employed for calculating the results for the five regressions / models
given in table four.
The results for the firm size clearly manifests that it positively affects the leverage ratio of a firm. As the
firms get bigger and bigger its capital structure tilts more towards debt rather than equity. When non-debt tax
shield is added in the second model it is evident that an increase in non - debt tax shield will increase the leverage
ratio. The coefficient for non - debt tax shield is significantly positive.
Table 4 Results: Panel Fixed Effect Estimation Method
Variables Used 1 2 3 4 5
Firm Size 0.0688***
(0.0176)
0.0774***
(0.0175)
0.0836***
(0.0170)
0.0402**
(0.0161)
0.0375**
(0.0159)
Non-Debt Tax Shield 3.7673**
(1.5128)
2.8362*
(1.5037)
2.9596**
(1.2705)
2.9974**
(1.2545)
Tangibility 0.2499***
(0.0936)
0.1843***
(0.0798)
0.1490*
(0.0812)
Profitability -0.8649***
(0.1444)
-0.8311***
(0.1438)
Current Ratio -0.0128*
(0.0071)
R-Square 23.90% 28.63% 34.70% 46.07% 55.76%
Number of Observations 100 100 100 100 100
*** Exhibits significance at 1%, ** at 5% and * at 10% significance level. The coefficients for
the estimated betas are given with their standard errors in parenthesis below each of them.
Bringing in tangibility in model three (table four) along with firm size and non - debt tax shield it also
exerts a significant and positive influence on the debt proportion in the capital structure of a firm. It implies that
56
International Journal of Business Studies Review (IJBSR) Vol. 2, No. 1, June. 2017
56
when the proportion of fixed or tangible assets of a firm increases so is the amount of leverage it employs in its
capital structure. It seems normal because it is easy to take loan for or against tangible assets than intangible ones.
Tangible assets include both fixed assets, such as machinery, buildings and land, and current assets, such as
inventory. Intangible assets are nonphysical assets, such as patents, trademarks, copyrights, good will and brand
recognition.
Profitability of a firm exerts a significantly negative effect on the leverage ratio of a non - financial firm
in Pakistan as shown by the coefficient for profitability in model four and five. If a firm become more profitable
by one unit the leverage ratio will decrease by 0.86 units (regression four). The results for profitability and current
ratio follow the same pattern. Obvious from the coefficient estimates in model five, table four, current ratio
negatively influence leverage in a firm’s capital structure. The overall R-Square of the model is 55.76 % meaning
that by applying the five variables we are able to explain 56 % of the variation in the leverage ratio, which seems
reasonable.
To sum up the results show that the effect of profitability and liquidity are in line with Pecking Order
Theory and the influence of size; tangibility and non - debt tax shield are following the Trade - Off Theory.
Conclusion
Capital structure is the mix of firm’s debts and equity that is used by the firm to finance its operations.
One of the primary responsibilities of a firm’s manager should be to choose an optimal combination of debt and
equity in the firm’s capital structure leading to increase the firm value (shareholder’s wealth).
This research is carried out to investigate those factors which affect the capital structure of PSE listed
non - financial firms in Pakistan. Using fixed effect panel estimation technique, data for ten companies including
four Pharma and six Oil & Gas companies were collected for ten years from 2005 to 2014. The results show that
profitability and current ratio have significantly negative association with leverage ratio while size, tangibility and
non-debt tax shield have a significant positive one. Pecking order theory justifies the negative significance of the
current ratio and profitability. The positive significance of size, non - debt tax shield and tangibility are consistent
with the trade - off theory.
These results are certainly a valuable addition to the subject’s empirical literature, especially given the
inconclusiveness of the earlier results pattern varying between industries, time periods and different countries /
regions of the world. Therefore, it is recommended that there is always space for conducting another study in this
area by using certain other variables and factors such as earning variability, growth opportunity, taxation effect,
capital adequacy, GDP growth, risk-weighted assets, country/industry level effects, ownership structure and
dividend pay-out etc. in future.
References
Afza, T., & Hussain, A. (2011). Determinants of capital structure across selected manufacturing sectors of
Pakistan. International Journal of Humanities and Social Science, 1(12), 254-262.
Akhtar, S., & Oliver, B. (2009). Determinants of capital structure for Japanese multinational and domestic
corporations. International Review of Finance, 9(1‐2), 1-26.
Alzomaia, T. S. (2014). Capital Structure Determinants of Publicly Listed Companies in Saudi Arabia. The
International Journal of Business and Finance Research, 8(2), 53-67.
Awan, A., & Amin, M. S. (2014). Determinants of capital structure. European Journal of Accounting Auditing
and Finance Research, 2(9), 22-41.
57
International Journal of Business Studies Review (IJBSR) Vol. 2, No. 1, June. 2017
57
Awan, T. N., Rashid, M., & Zia-ur-Rehman, M. (2011). Analysis of the determinants of Capital Structure in sugar
and allied industry. International Journal of Business and Social Science, 2(1), 221-229.
Barnea, A., Haugen, R. A., & Senbet, L. W. (1980). A rationale for debt maturity structure and call provisions in
the agency theoretic framework. Journal of Finance, 35(5), 1223-1234.
Bassey, N. E., Arene, C. J., & Okpukpara, B. C. (2014). Determinants of capital structure of listed Agro firms in
Nigeria. Economic Affairs, 59(1), 35-47.
Baltacı, N., & Ayaydın, H. (2014). Firm, Country and Macroeconomic Determinants of Capital Structure:
Evidence from Turkish Banking Sector. EMAJ: Emerging Markets Journal, 3(3), 47-58.
Berle, A. A., & Means, G. C. (1932). Modern Corporation and Private Property.
Berle, A. A., & Means, G. G. C. (1991). The Modern Corporation and private property. Transaction Publishers.
Chen, J. J. (2004). Determinants of capital structure of Chinese-listed companies. Journal of Business research,
57(12), 1341-1351.
Chen, L. H., Lensink, R., & Sterken, E. (1999). The determinants of capital structure: evidence from Dutch panel
data (No. 99E14). University of Groningen, Research Institute SOM (Systems, Organisations and
Management).
DeAngelo, H., DeAngelo, L., & Whited, T. M. (2011). Capital structure dynamics and transitory debt. Journal of
Financial Economics, 99(2), 235-261.
Drobetz, W., & Fix, R. (2005). What are the Determinants of the Capital Structure? Evidence from Switzerland.
Swiss Journal of Economics and Statistics, 141(I), 71-113.
Fattouh, B., Harris, L., & Scaramozzino, P. (2008). Non-linearity in the determinants of capital structure: Evidence
from UK firms. Empirical Economics, 34(3), 417-438.
Hausman, J. A. (1978). Specification tests in econometrics. Econometrica: 46(6), 1251 - 1271.
Huang, G. (2006). The determinants of capital structure: Evidence from China. China economic review, 17(1),
14-36.
Karadenİz, E., Kandİr, S. Y., Balcİlar, M., & Onal, Y. B. (2009). Determinants of capital structure: evidence from
Turkish lodging companies. International Journal of Contemporary Hospitality Management, 21(5), 594-
609.
Lim, T. C. (2012). Determinants of Capital Structure Empirical Evidence from Financial Services Listed Firms in
China. International Journal of Economics and Finance, 4(3), 191-203.
Masnoon, M., & Saeed, A. (2014). Capital Structure Determinants of KSE Listed Automobile Companies.
European Scientific Journal, 10(13), 451-461.
Masulis, R. W., & Korwar, A. N. (1986). Seasoned equity offerings: An empirical investigation. Journal of
financial economics, 15(1), 91-118.
Miller, M. H. (1988). The Modigliani-Miller propositions after thirty years. The Journal of Economic
Perspectives, 2(4), 99-120.
Modigliani, F., & Miller, M. H. (1958). The cost of capital, corporation finance and the theory of investment. The
American Economic Review, 48(3), 261-297.
Modigliani, F., & Miller, M. H. (1963). Corporate income taxes and the cost of capital: a correction. The American
Economic Review, 53(3), 433-443.
58
International Journal of Business Studies Review (IJBSR) Vol. 2, No. 1, June. 2017
58
Myers, S. C. (1984). The capital structure puzzle. The Journal of Finance, 39(3), 574-592.
Myers, S. C. (2001). Capital structure. The Journal of Economic Perspectives, 15(2), 81-102.
Myers, S. C., & Majluf, N. S. (1984). Corporate financing and investment decisions when firms have information
that investors do not have. Journal of Financial Economics, 13(2), 187-221.
Osaretin, I. S., & Michael, C. I. (2014). The determinants of capital structure of listed firms in Nigeria. European
Journal of Accounting Auditing and Finance Research, 2(10), 96-111.
Qayyum, S. (2013). Determinants of capital structure: An empirical study of cement industry of Pakistan.
Interdisciplinary Journal of Contemporary Research in Business, 24(11), 784-795..
Rafiq, M., Iqbal, A., & Atiq, M. (2008). The determinants of capital structure of the chemical industry in Pakistan.
Lahore Journal of Economics, 13(1), 139-158..
Rajan, R. G., & Zingales, L. (1995). What do we know about capital structure? Some evidence from international
data. The journal of Finance, 50(5), 1421-1460.
Sekaran, U., & Bougie, R. (2003). Research Methods for Business: A Skill Building Approach. John Willey and
Sons, New York.
Shah, A., & Hijazi, T. (2004). The determinants of capital structure of stock exchange-listed non-financial firms
in Pakistan. Pakistan Development Review, 43(4-II), 605-618.
Shah, M. H. (2011a). Bilateral linkages with OECD and FDI inflows in leading developing countries. International
Journal of Interdisciplinary Social Sciences, 5(7), 255-270.
Shah, M. H. (2011b). Essays on foreign direct investment in developing countries (Doctoral dissertation,
University of Leicester).
Shah, M. H., (2016). The effect of macroeconomic stability on inward FDI in African developing countries.
International Journal of Business Studies Review. 1(1), 1-11.
Shah, M. H., (2017a). Significance of WTO’s trade related investment measures (TRIMS) agreement for inward
FDI in Sub-Saharan Africa. City University Research Journal, 7(1), 17-29.
Shah, M. H., (2017b). Political institutions and the incidence of FDI in South Asia. Business & Economic Review,
9(1), 21-42.
Shah, M. H., & Afridi, A.G. (2015). Significance of good governance for FDI inflows in SAARC countries.
Business & Economic Review. 7(2), 31-52.
Shah, M. H., & Faiz, M. (2015). Terrorism and foreign direct investment: An empirical analysis of SAARC
countries. City University Research Journal, 5(2), 219-233.
Shah, M. H., & Qayyum, S. (2015). Impact of double taxation treaties on inward FDI in Latin American and
Caribbean developing countries. Business & Economic Review. 7(1), 1-18.
Shah, M. H., & Samdani, S. (2015). Impact of trade liberalization on FDI inflows to D-8 countries. Global
Management Journal for Academic & Corporate Studies, 5(1), 30-37.
Shah, M. H., & Ali, Z. (2016). What drives foreign direct investment to BRICS? PUTAJ Humanities and Social
Sciences, 23(1), 51-66.
Shah, M. H., & Khan, Y. (2016). Trade liberalization and FDI inflows in emerging economies. Business &
Economic Review, 8(1), 35-52.

59
International Journal of Business Studies Review (IJBSR) Vol. 2, No. 1, June. 2017
59
Sheikh, N., A & Wang, Z. (2011). ‘Determinants of Capital Structure: An Empirical Study of Firms in
Manufacturing Industry of Pakistan. Managerial Finance, 37(2), 117 - 133.
Simerly, R. L., & Li, M. (2002). Rethinking the Capital Structure Decision: Translating Research into Practical
Solutions. Journal of Applied Topics in Business and Economics.