Embed Size (px)
Citation preview
MPRAMunich Personal RePEc Archive
Mergers and Product Quality: Evidencefrom the Airline Industry
Yongmin Chen and Philip Gayle
University of Colorado at Boulder, Kansas State University
4. November 2013
Online at http://mpra.ub.uni-muenchen.de/51238/MPRA Paper No. 51238, posted 5. November 2013 18:53 UTC
Mergers and Product Quality: Evidence from the Airline Industry�
Yongmin Cheny
University of Colorado at BoulderPhilip G. Gaylez
Kansas State University
November 4, 2013
Abstract
Retrospective studies of horizontal mergers have focused on their price e¤ects, leaving theimportant question of how mergers a¤ect product quality largely unanswered. This paper em-pirically investigates this issue for two recent airline mergers: Delta/Northwest and Continen-tal/United. Consistent with the theoretical premise that mergers improve coordination butdiminish competitive pressure for quality provision, we �nd: (i) each merger is associated witha quality increase in markets where the merging �rms did not compete pre-merger, but witha quality decrease in markets where they did; and (ii) the quality change can be a U-shapedfunction of the pre-merger competition intensity.
JEL Classi�cation: L13, L93
Keywords: Mergers; Product Quality; Airlines.
�We thank Jan Brueckner, Jiawei Chen, David Neumark, Kevin Roth, and Linda Cohen for very helpful commentsand suggestions. We thank Huubinh B. Le for excellent research assistance. Any remaining errors are our own.
yDepartment of Economics, University of Colorado at Boulder, Boulder, CO 80309 , Tel: (303)492-8736, email:[email protected].
zDepartment of Economics, 320 Waters Hall, Kansas State University, Manhattan, KS, 66506. Tel. (785) 532-4581,Fax: (785) 532-6919, email: [email protected]. Corresponding Author.
1
1 Introduction
Retrospective studies of horizontal mergers tend to focus on the price e¤ects of a merger, and
often use the price e¤ects to infer relative changes in market power and cost e¢ ciencies associated
with the merger. Such analyses implicitly assume that the quality of products do not change
over the relevant pre-post merger periods.1 However, price increases or decreases associated with
a merger could be closely related to product quality changes. Given the importance of product
quality to consumers, it would be imperative to understand the quality e¤ects of mergers. In
this paper, we aim to shed light on the relationship between mergers and product quality by
empirically investigating two recent airline mergers � the Delta/Northwest (DL/NW) and the
Continental/United (CO/UA) merger.
To motivate our empirical study, we �rst present a theoretical model with two �rms that captures
what we call the coordination and incentive e¤ects of a merger on product quality. A horizontal
merger allows two �rms to share technology information and coordinate production, which can
positively a¤ect the quality of their products. However, the merger also has an incentive e¤ect,
as it eliminates the competitive pressure on the �rms to provide high quality.2 This incentive ef-
fect is usually negative, but its magnitude depends on how intense the two �rms competed before
the merger. While competitive pressure motivates �rms to improve product quality, the dimin-
ished pro�t under competition, especially when competition intensity goes beyond certain point,
can weaken the incentive for costly quality provision. Hence, before the merger, product quality
could vary non-monotonically with competition intensity, possibly maximized at some intermedi-
ate level of competition intensity.3 Consequently, the e¤ect of a merger on quality can also be
non-monotonic in pre-merger competition intensity, possibly most negative when the strength of
pre-merger competition is at some intermediate point.
In markets where the two �rms have little or no direct competition prior to the merger, the
coordination e¤ect dominates, so that the merger will increase product quality. As pre-merger
competition is intensi�ed, the negative incentive e¤ect of the merger becomes more pronounced
1Notable exceptions include several studies of hospital mergers (see Mutter, Romano and Wong, 2011; Ho andHamilton, 2000; and Romano and Balan, 2011). These studies �nd mixed results on the e¤ect of hospital mergers onvarious measures of clinical quality, but a disproportionate portion of the evidence suggests clinical quality declineswith hospital mergers.
2 In a more general model, with only a subset of �rms that merge in a market, the merger may diminish, withouteliminating, the competitive pressure for quality provision. But the negative incentive e¤ect is still likely to exist,and hence the trade o¤ captured in our simple model will remain.
3This is reminiscent of the inverted-U relationship between innovation and competition, as in Aghion, etal. (2005).
2
and dominates the coordination e¤ect. With further increases in competition intensity, however,
it is possible that the incentive e¤ect diminishes, alleviating the negative quality impact of the
merger. Our theoretical model thus has two testable implications: (1) a merger tends to increase
(or decrease) product quality in markets where the two merging �rms had little (or substantial)
pre-merger competition; and (2) the quality change due to the merger may vary non-monotonically
as the intensity of pre-merger competition increases, possibly exhibiting a U-shaped relationship.
Equipped with the theoretical insights, we empirically explore how mergers a¤ect product qual-
ity from two recent airline mergers, the Delta/Northwest and the Continental/United merger, where
the merging �rms produce in multiple markets. In some of the markets, the �rms did not have
pre-merger competition with each other, whereas in others they competed directly, with varying
degrees of competition intensity.4 These mergers thus o¤er a proper setting for our study.
Our speci�c measure of air travel product quality is what we refer to as Routing Quality. (In
Section 3, we discuss in detail why we choose this measure in light of alternative measures of quality.)
Related to travel convenience of the air travel product itinerary, routing quality is measured by
the percentage ratio of nonstop �ight distance to the product�s itinerary �ight distance used to
get passengers from the origin to destination. Since some products have itineraries that require
intermediate airport stop(s) that are not on a straight path between the origin and destination,
each of these products will have an itinerary �ight distance that is longer than the nonstop �ight
distance. The presumption here is that passengers �nd a nonstop itinerary most convenient to get
to their destination. Therefore, the closer is the product�s itinerary �ight distance to the nonstop
�ight distance, i.e. higher values of our routing quality measure, the more desirable is the travel
itinerary to passengers.
Our empirical analysis starts by estimating a discrete choice model of air travel demand. This
serves two purposes. First, it veri�es that passengers� choice behavior is consistent with that
a higher routing quality measure is associated with a more passenger-desirable travel itinerary.
Second, estimates of the pre-merger cross-price elasticities of demand between the two merging
�rms, in markets where they competed directly, serve as a useful indicator of the competition
intensity. We then proceed to use a reduced-form regression equation of routing quality to evaluate
4The intensity of competiton may di¤er across markets, possibly because product o¤erings by the two �rms di¤eredacross markets, or consumers have di¤erent preference diversities across markets (as, for example, in Chen and Savage,2011). Our empirical work will estimate the cross-price elasticities of demand between the two �rms�products, whichserve as a measure of product di¤erentiation and competition intensity.
3
e¤ects that each of the two mergers have on product quality of the merged �rms.
Consistent with theory, the regression estimates suggest that each merger is associated with an
increase in routing quality in markets where the merging �rms did not compete with each other
prior to the merger, but with a decline in routing quality in markets where they did. Furthermore,
in the case of the CO/UA merger, the change in product quality appears to exhibit a U-shaped
relationship with the two �rms�pre-merger competition intensity. We also �nd that, compared to
the DL/NW merger, the CO/UA merger is associated with less severe quality declines and larger
quality improvements. Thus, in terms of consumer welfare e¤ects associated with product quality
changes, our econometric analysis reveals evidence that on average consumers fared better under
the CO/UA merger than under the DL/NW merger.
Since the deregulation of the US airline industry in 1978, there has been a number of mergers.
Empirical studies of these mergers, similar to merger studies in other industries, have focused on
price e¤ects, and sometimes used these price e¤ects to infer relative changes in market power and
cost e¢ ciencies associated with a merger (Werden, Joskow and Johnson, 1989; Borenstein, 1990;
Kim and Singal, 1993; Peters, 2006; Luo, 2011). In case of the recent DL/NW and UA/CO mergers,
Gayle and Le (2013) estimate marginal, recurrent �xed and sunk entry cost e¤ects associated with
these mergers. Even though there are several studies of the airline industry that examine the
relationship between service quality and market structure/competition,5 we are unaware of studies
that explicitly analyze e¤ects of mergers on air travel product quality.6 Our paper contributes to
this literature, as well as to understanding more generally how mergers a¤ect product quality.
In the rest of the paper, we provide the theoretical motivation in section 2, describe the mergers
and the data in section 3, and present the empirical model in section 4. Section 5 contains the
empirical results, and section 6 concludes.
5Mazzeo (2003), Rupp, Owens and Plumly (2006), and Prince and Simon (2009) all �nd evidence that airlinesprovide worse on-time performance on less competitive routes. However, contrary to this result, Prince and Simon(2013) �nd that incumbents�on-time performance actually worsens in response to entry, and the threat of entry, bySouthwest Airlines and other low-cost carriers.
6Draganska, Mazzeo and Seim (2009) and Fan (2012) constitute important methodological contributions in usingeconometric models to predict how mergers may in�uence non-price product characteristic choices. Draganska,Mazzeo and Seim (2009) applied their merger simulation analysis to the ice-cream industry, whereas Fan (2012)applied her merger simulation analysis to the newspaper industry. However, neither study is a retrospective analysisof how non-price product characteristics actually change subsequent to a merger, which is the focus of our study.
4
2 Theoretical Motivation
A merger by two �rms allows them to share technology and coordinate production activities, which
can positively a¤ect the quality of their products. We call this the coordination e¤ect of a merger.
For example, an airline merger may allow the two airlines to coordinate their �ight schedules to
better serve consumer needs. On the other hand, a merger reduces the competitive pressure on
quality improvement, which can negatively a¤ect the quality of their products. In the context of an
airline merger, this could be reduced product o¤erings that lessen travel convenience.7 We call this
the incentive e¤ect of a merger. Our basic theoretical premise is that whether a merger will raise or
lower product quality depends on the interaction of these two potential e¤ects. When pre-merger
competition between the two �rms is weak, the coordination e¤ect is likely to dominate. Otherwise,
the merger is more likely to reduce product quality.
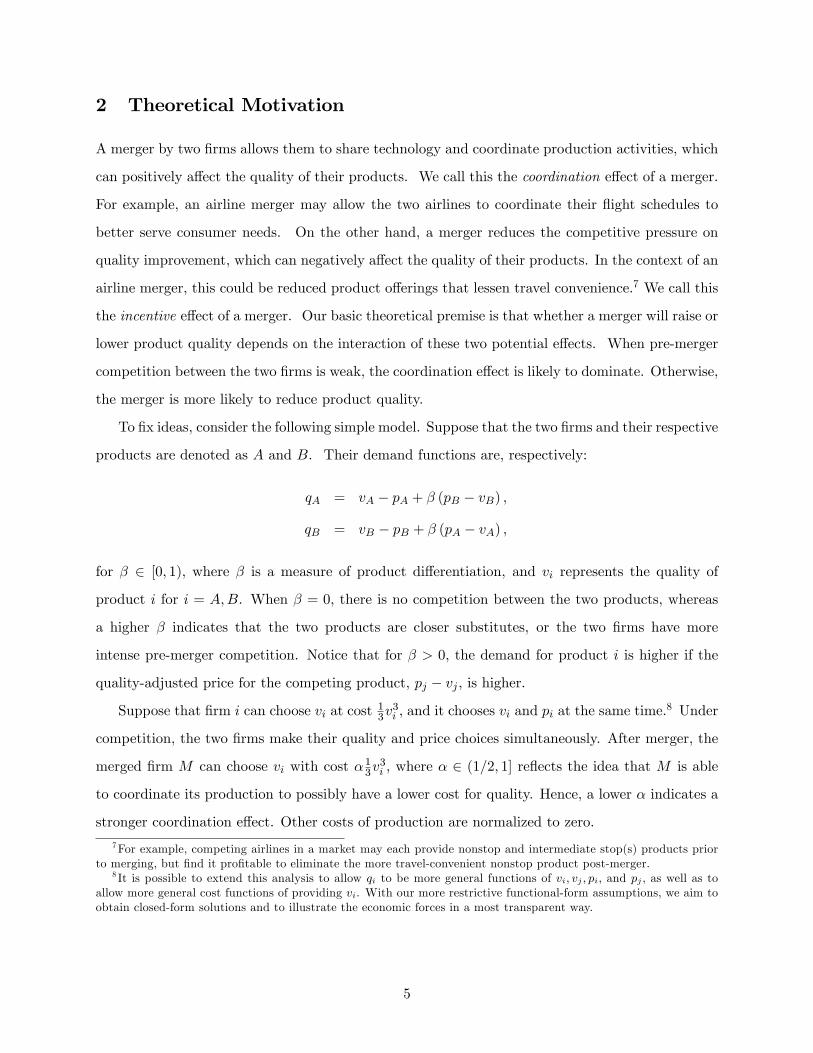
To �x ideas, consider the following simple model. Suppose that the two �rms and their respective
products are denoted as A and B. Their demand functions are, respectively:
qA = vA � pA + � (pB � vB) ;
qB = vB � pB + � (pA � vA) ;
for � 2 [0; 1); where � is a measure of product di¤erentiation, and vi represents the quality of
product i for i = A;B. When � = 0; there is no competition between the two products, whereas
a higher � indicates that the two products are closer substitutes, or the two �rms have more
intense pre-merger competition. Notice that for � > 0; the demand for product i is higher if the
quality-adjusted price for the competing product, pj � vj ; is higher.
Suppose that �rm i can choose vi at cost 13v3i ; and it chooses vi and pi at the same time.
8 Under
competition, the two �rms make their quality and price choices simultaneously. After merger, the
merged �rm M can choose vi with cost �13v3i ; where � 2 (1=2; 1] re�ects the idea that M is able
to coordinate its production to possibly have a lower cost for quality. Hence, a lower � indicates a
stronger coordination e¤ect. Other costs of production are normalized to zero.
7For example, competing airlines in a market may each provide nonstop and intermediate stop(s) products priorto merging, but �nd it pro�table to eliminate the more travel-convenient nonstop product post-merger.
8 It is possible to extend this analysis to allow qi to be more general functions of vi; vj ; pi; and pj ; as well as toallow more general cost functions of providing vi. With our more restrictive functional-form assumptions, we aim toobtain closed-form solutions and to illustrate the economic forces in a most transparent way.
5
Under competition, the �rms�pro�t functions are:
�A = pA [vA � pA � � (vB � pB)]�1
3v3A;
�B = pB [vB � pB � � (vA � pA)]�1
3v3B:
At a Nash equilibrium, �rm i0s strategy (pi; vi) ; i = A;B; satis�es @�i=pi = 0 and @�i=vi = 0: The
unique symmetric equilibrium, which solves these �rst-order conditions, give
pd =(1� �)2
(2� �)2; vd =
1� �2� � ; (1)
and this is also the unique Nash equilibrium when � � 0:56: We shall focus on the symmetric
equilibrium for the rest of our analysis.
After the merger, M chooses pA; pB; vA; vB to maximize its joint pro�t from both products:
�M = pA [vA � pA � � (vB � pB)] + pB [vB � pB � � (vA � pA)]��
3
�v3A + v
3B
�:
From the �rst-order conditions, @�M=pi = 0 and @�M=vi = 0; i = A;B; the merged �rm�s optimal
choices of price and quality are obtained as
pM =1� �4�
; vM =1� �2�
: (2)
Notice that the change in product quality due to the merger is
vM � vd =�1
2�� 1
2� �
�(1� �) : (3)
It follows that vM � vd < (>) 0 if 2 (1� �) < (>) �: That is, a merger reduces product quality in
markets where the coordination bene�t is weak relative to the pre-merger competition incentive (i.e.,
2 (1� �) < �), but increases product quality in markets where the coordination e¤ect dominates
the competition e¤ect (i.e., 2 (1� �) > �). We summarize this discussion in the following:
Proposition 1. For given � 2 (1=2; 1]; a merger increases product quality when the pre-merger
competition intensity is low (i.e., � < 2 (1� �)), but decreases quality when the pre-merger com-
petition intensity is high (i.e., � > 2 (1� �)). Furthermore, the quality change from the merger,
vM � vd ; is a U-shaped function of �; �rst decreasing and then increasing, reaching its minimum
at �̂ = 2�p2�:
Figure 1 provides a visual representation of the relationship between � and the change in
product quality due to the merger, vM � vd; for given �. Recall that � 2 (0:5; 1] and � 2 [0; 1).
6
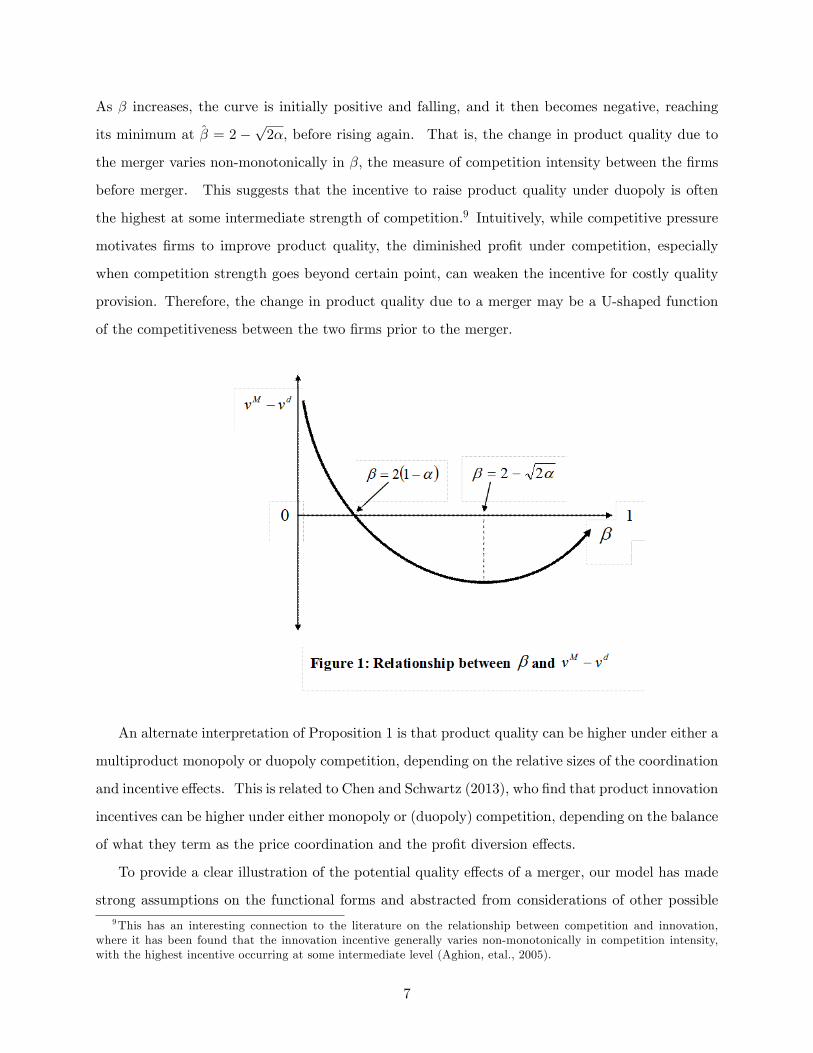
As � increases, the curve is initially positive and falling, and it then becomes negative, reaching
its minimum at �̂ = 2 �p2�, before rising again. That is, the change in product quality due to
the merger varies non-monotonically in �; the measure of competition intensity between the �rms
before merger. This suggests that the incentive to raise product quality under duopoly is often
the highest at some intermediate strength of competition.9 Intuitively, while competitive pressure
motivates �rms to improve product quality, the diminished pro�t under competition, especially
when competition strength goes beyond certain point, can weaken the incentive for costly quality
provision. Therefore, the change in product quality due to a merger may be a U-shaped function
of the competitiveness between the two �rms prior to the merger.
An alternate interpretation of Proposition 1 is that product quality can be higher under either a
multiproduct monopoly or duopoly competition, depending on the relative sizes of the coordination
and incentive e¤ects. This is related to Chen and Schwartz (2013), who �nd that product innovation
incentives can be higher under either monopoly or (duopoly) competition, depending on the balance
of what they term as the price coordination and the pro�t diversion e¤ects.
To provide a clear illustration of the potential quality e¤ects of a merger, our model has made
strong assumptions on the functional forms and abstracted from considerations of other possible9This has an interesting connection to the literature on the relationship between competition and innovation,
where it has been found that the innovation incentive generally varies non-monotonically in competition intensity,with the highest incentive occurring at some intermediate level (Aghion, etal., 2005).
7
competitors in the market (which we will control for in our empirical analysis). Despite these
restrictions, we believe that the economic forces illustrated here are general, and the trade-o¤s
between the coordination and incentive e¤ects, as well as their implications, will be valid in more
general settings. This straightforward theoretical model thus serves the purpose of motivating
our empirical analysis. Its �rst implication, that a merger increases product quality in markets
where the two �rms have little per-merger competition but may reduce quality when pre-merger
competition is signi�cant, does not depend on the speci�cs of the model. Its second implication,
that there is a U-shaped relationship between pre-merger competition intensity and the quality
change from the merger, is more likely to hinge on the speci�c functional forms we have assumed.
In light of these theoretical insights, we next turn to empirical analysis.
3 The Mergers and the Data
This section describes the mergers, our quality measure, and the data.
3.1 The Mergers
Delta Airlines (DL) and Northwest Airlines (NW) announced their plan to merge on April 14,
2008. At the time of the merger, Delta and Northwest were the third and �fth largest airlines in
the United States, with Delta having its primary hub in Atlanta, Georgia and Northwest having
its primary hub in Minneapolis, Minnesota. On October 29, 2008, the U.S. Department of Justice
(DoJ) approved the merger after being convinced that it should have minimal anti-competitive
e¤ects.10
The executives of the two airlines asserted that the merger will bene�t customers, employees,
shareholders, and the communities they serve.11 Moreover, they argue that the merger will help
create a more resilient airline for long-term success and �nancial stability. In terms of possible e¢ -
ciency gains from the merger, they anticipate that cost synergies will be achieved by 2012. Bene�ts
are anticipated to come from combining and improving the airlines�complementary network struc-
ture, where e¤ective �eet optimization will account for more than half of those network bene�ts.
Cost synergies are anticipated to come from the combining of sales agreements, vendor contracts,
10Department of Justice (2008), �Statement of the Department of Justice�s Antitrust Division on Its Decision toClose Its Investigation of the Merger of Delta Air Lines Inc. and Northwest Airlines Corporation.�19 October 2008.<http://www.justice.gov/atr/public/press_releases/2008/238849.htm>11Seeking Alpha (2008), "Delta Air Lines, Northwest Airlines Merger Call Transcript.� 16 April 2008.
<http://seekingalpha.com/article/72537-delta-air-lines-northwest-airlines-merger-call-transcript>
8
and more e¢ cient operation of airport facilities.
United Airlines (UA) and Continental Airlines (CO) announced their plan to merge on May 3,
2010. The merger was approved by the DoJ on August 27, 2010, creating the largest U.S. passenger
airline based on capacity as measured by year 2009 available seat miles. It is believed that UA and
CO are compatible partners in many ways.12 For example, both have similar �eets and operate
in di¤erent geographic markets that complement each other. Flying mainly Boeing aircrafts helps
reduce costs associated with multiple orders. Operating in distinct geographical markets enables
them to link and expand their networks as United�s strength is mainly in the western part of the
United States while Continental has a larger presence in the east coast.
While cost e¢ ciency gains are anticipated from both mergers, it is more di¢ cult to predict
whether the quality of products o¤ered by the newly merged �rms will be higher or lower.
3.2 Measuring Product Quality
A challenge that empirical work faces in studying the relationship between merger and product
quality is to �nd reasonable measure(s) of product quality. The literature on the airline industry
correctly views timeliness of service as an important dimension of air travel service quality.13 Var-
ious papers have analyzed di¤erent aspects of timeliness. The three main quality dimensions of
service timeliness analyzed in the literature are: (i) �On-time performance,�measured by carrier
delay time when servicing a given set of itineraries; (ii) �Schedule delay�, which is a gap between
a passenger�s preferred departure time and actual departure time; and (iii) travel time required to
complete a given itinerary in getting the passenger from the origin to destination. Studies in the
literature typically measure (i) directly from available data on �ight delay,14 but quality dimen-
sions (ii) and (iii) are typically measured indirectly using data that are posited to be correlated
with these quality dimensions.15
Indirect measures of quality dimension (iii) used in the literature, which is the focus of our paper,
are typically itinerary �ight distance-based. For example, Dunn (2008) uses the �ight distance
12Alukos, Basili. �How Long Has a Continental-United Merger Been in the Works?�Seeking Alpha. 30 April 2010.<http://seekingalpha.com/article/202056-how-long-has-a-continental-united-merger-been-in-the-works>13Another important quality measure that has been considered in the literature is airline safety (e.g., Rose, 1990).14Studies that analyze these direct measures of �On-time performance�include: Fare, Grosskopf and Sickles (2007);
Mazzeo (2003); Mayer and Sinai (2003); Prince and Simon (2009 and 2013); Rupp, Owens and Plumly (2006); Ruppand Sayanak (2008); among others.15An indirect measure of quality dimension (ii) used in the literature is �ight frequency [see Brueckner (2004);
Brueckner and Girvin (2008); Brueckner and Pai (2009); Brueckner and Luo (2012); Fare, Grosskopf and Sickles(2007); Girvin (2010)].
9
required for a product with intermediate stop relative to the nonstop �ight distance between the
origin and destination. A nonstop �ight between the origin and destination will have the shortest
itinerary �ight distance. Since some products require intermediate airport stop(s) that are not on
a straight path between the origin and destination, each of these products will have an itinerary
�ight distance that is longer than the nonstop �ight distance. The rationale is that �directness�of
the travel itinerary is correlated with required travel time, and the itinerary �ight distance relative
to nonstop �ight distance is a measure of �directness�. The greater the itinerary �ight distance
of an intermediate stop product relative to the nonstop �ight distance, the lower the quality of
this intermediate stop product. Other studies that have used this distance-based measure of air
travel itinerary quality, which is referred to as itinerary convenience/inconvenience in some studies,
include: Reiss and Spiller (1989); Borenstein (1989); Ito and Lee (2007); Fare, Grosskopf and
Sickles (2007); and Gayle (2007 and 2013).
Our speci�c measure of air travel product quality, which we refer to as Routing Quality, is the
percentage ratio of nonstop �ight distance to the product�s itinerary �ight distance used to get
passengers from the origin to destination. Therefore, the Routing Quality variable has only strictly
positive values, where the maximum value is 100 in the case that the product itinerary consists of
a nonstop �ight. As suggested above, the presumption is that passengers �nd a nonstop itinerary
most convenient to get to their destination, so higher values of Routing Quality are associated with
a more passenger-desirable travel itinerary. While this seems reasonable, the structural demand
model that we subsequently describe will provide empirical validation to this presumption.
Optimal integration of the merging airlines� route networks may involve elimination of some
products, and creation of others. Depending on what types of products are eliminated versus what
types are kept or created, the merging airlines� average routing quality in a market may either
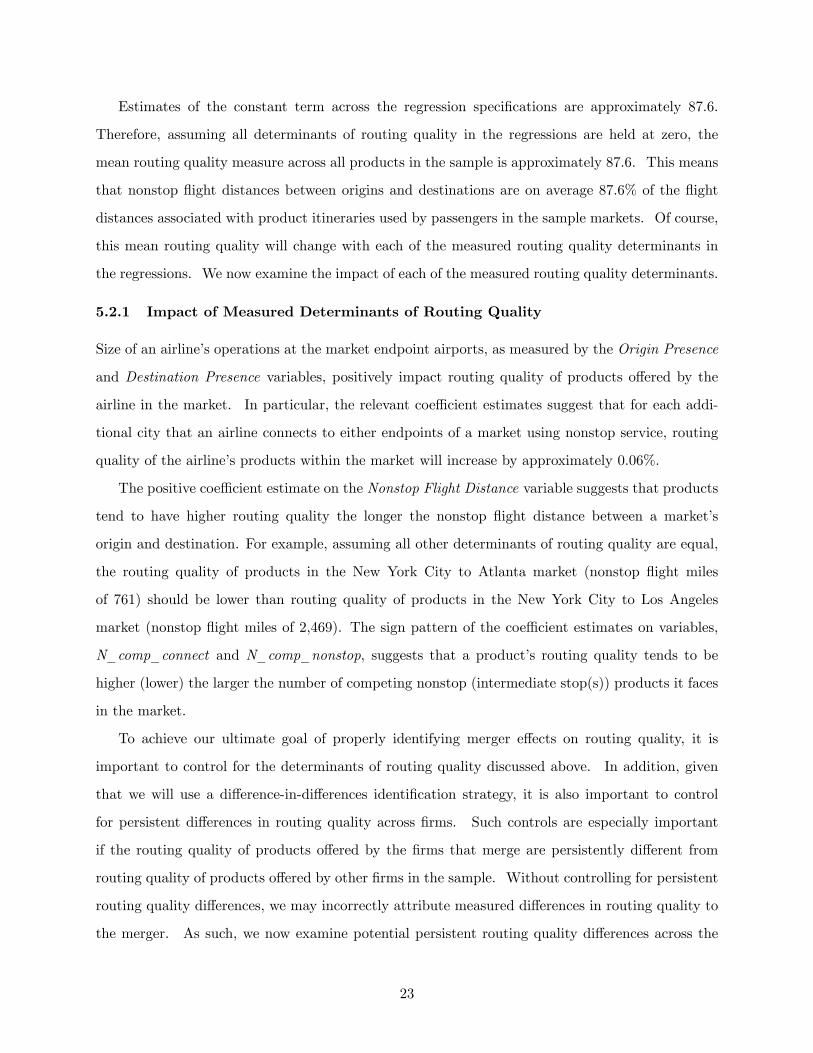
increase or decrease. Figures 2 and 3 give examples of how routing quality may change due to an
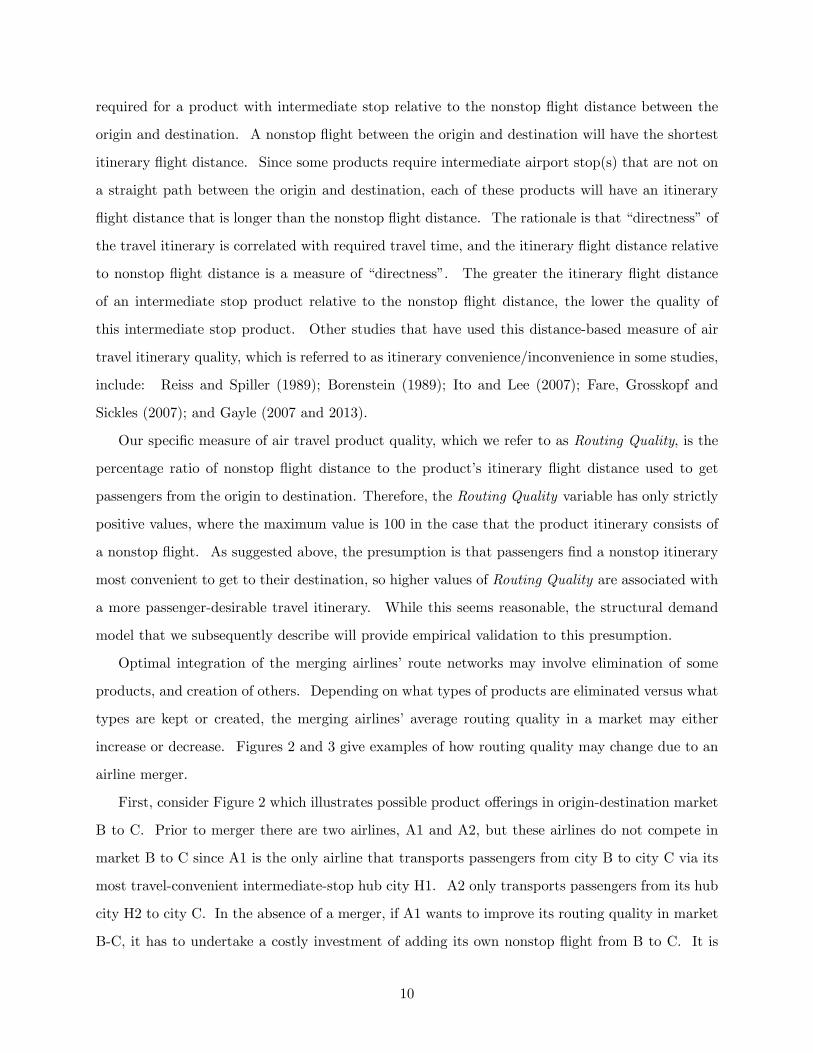
airline merger.
First, consider Figure 2 which illustrates possible product o¤erings in origin-destination market
B to C. Prior to merger there are two airlines, A1 and A2, but these airlines do not compete in
market B to C since A1 is the only airline that transports passengers from city B to city C via its
most travel-convenient intermediate-stop hub city H1. A2 only transports passengers from its hub
city H2 to city C. In the absence of a merger, if A1 wants to improve its routing quality in market
B-C, it has to undertake a costly investment of adding its own nonstop �ight from B to C. It is
10
possible that the e¤ective cost to A1 of adding and operating such a nonstop �ight is prohibitive.
However, since A2 already o¤ers service from H2 to C, by merging with A2, the merged �rm only
needs to undertake the investment of adding a �ight from B to H2 in order to o¤er an intermediate-
stop product of better routing quality compared to the pre-merger intermediate-stop product. To
service the B-C market, it is possibly more cost-e¢ cient for an airline to leverage an already existing
network through hub city H2 by simply adding a �ight from B to H2, compared to operating a
new direct �ight from B to C. This example directly relates to the positive coordination e¤ect of
a merger on product quality discussed earlier.
Required flightaddition withmerger
Required flight addition absent merger
B
H1
H2
C
A1 A1
A2
Figure 2: Options for Improvement in Routing Quality in origindestination market B to C.
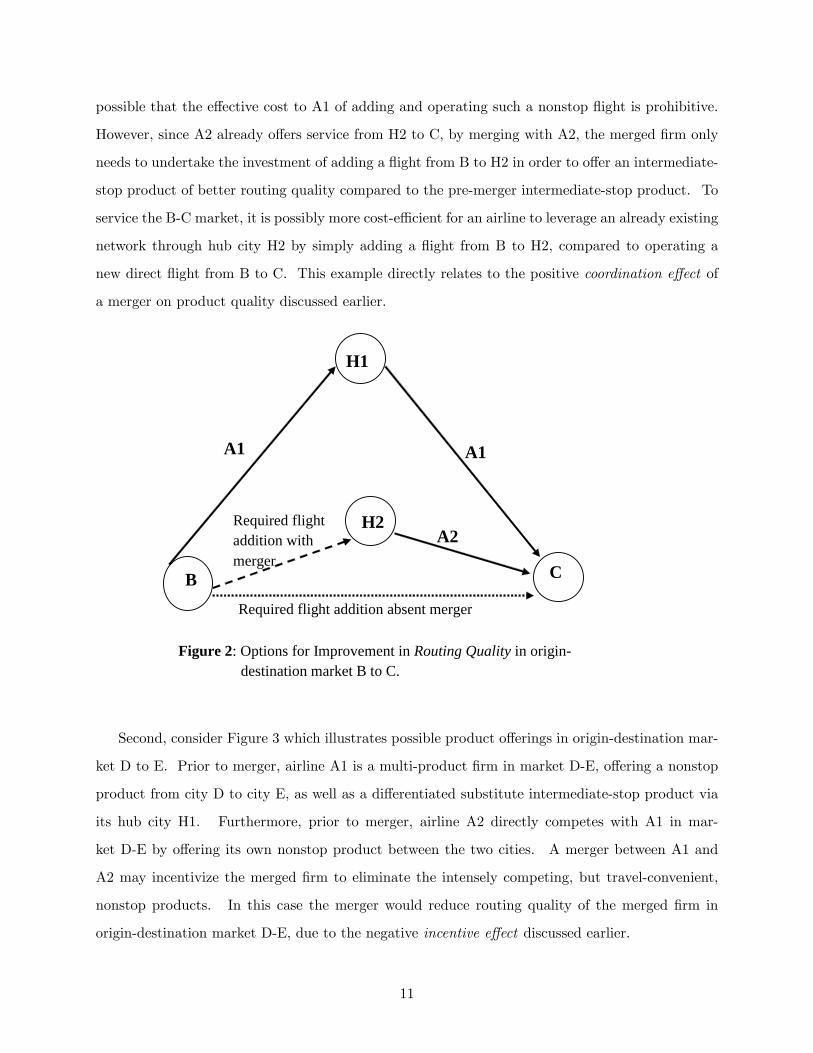
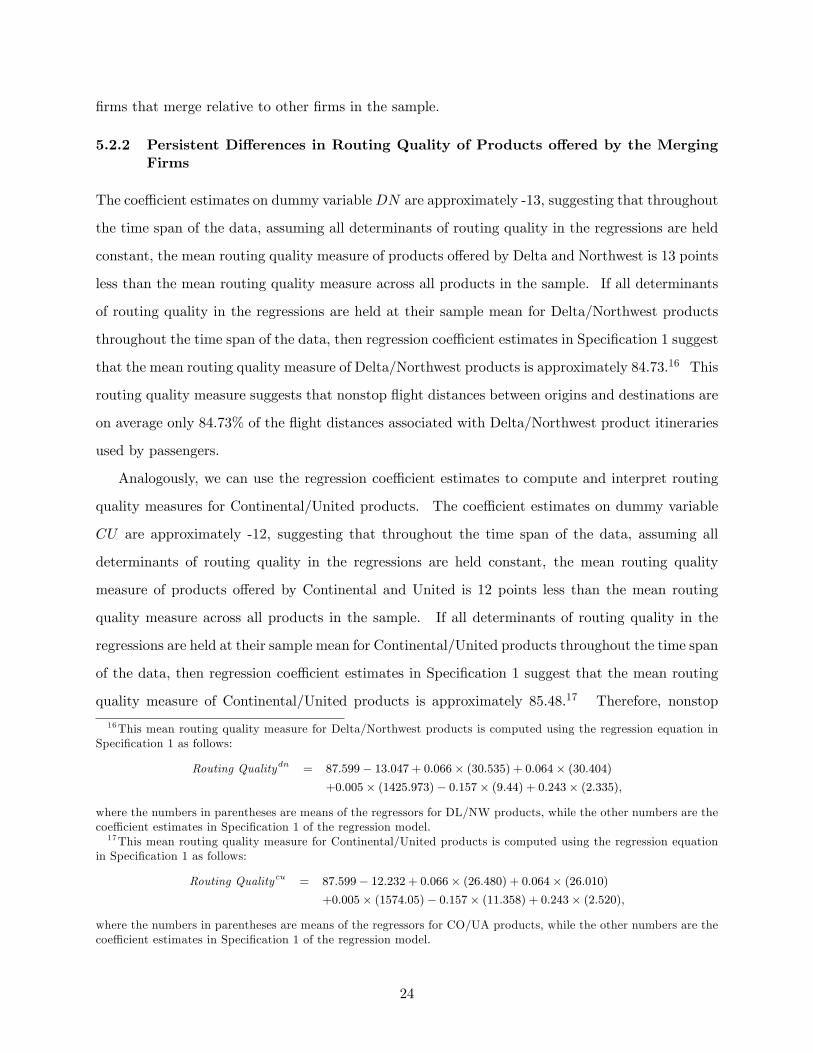
Second, consider Figure 3 which illustrates possible product o¤erings in origin-destination mar-
ket D to E. Prior to merger, airline A1 is a multi-product �rm in market D-E, o¤ering a nonstop
product from city D to city E, as well as a di¤erentiated substitute intermediate-stop product via
its hub city H1. Furthermore, prior to merger, airline A2 directly competes with A1 in mar-
ket D-E by o¤ering its own nonstop product between the two cities. A merger between A1 and
A2 may incentivize the merged �rm to eliminate the intensely competing, but travel-convenient,
nonstop products. In this case the merger would reduce routing quality of the merged �rm in
origin-destination market D-E, due to the negative incentive e¤ect discussed earlier.
11
D
A1
H1
E
A1A1
A2
Figure 3: Potential Postmerger Decline in Routing Quality inorigindestination market D to E.
We believe that routing quality is one of the better measurable quality dimensions of air travel
service that is more directly related to optimal choices of an airline. The task of our empirical
analysis, then, is to understand how optimal integration of the merging airlines�networks in�uences
their routing quality in a market.
3.3 Data
Data are drawn from the Origin and Destination Survey (DB1BMarket) published by the Bureau
of Transportation Statistics. The data are quarterly and constitute a 10 percent sample of air-
line tickets from reporting carriers. An observation is a �ight itinerary that provides information
on: (i) the identity of airline(s) associated with the itinerary; (ii) airfare; (iii) number of pas-
sengers that purchase the speci�c itinerary; (iv) market miles �own in getting the passenger from
the origin to destination; and (v) the identity of origin, destination and intermediate stop(s) air-
ports. Unfortunately, the DB1B data do not contain passenger-speci�c information, or information
on ticket restrictions such as advance-purchase and length-of-stay requirements; such information
would facilitate estimation of a richer demand model than the one we use based on available data.
The time span of the data we use is the �rst quarter of 2005 to the third quarter of 2011. This
time span covers pre and post-merger periods for each merger. A market is de�ned as directional
origin-destination-time period combination. Directional means that Dallas to Atlanta is a di¤erent
12
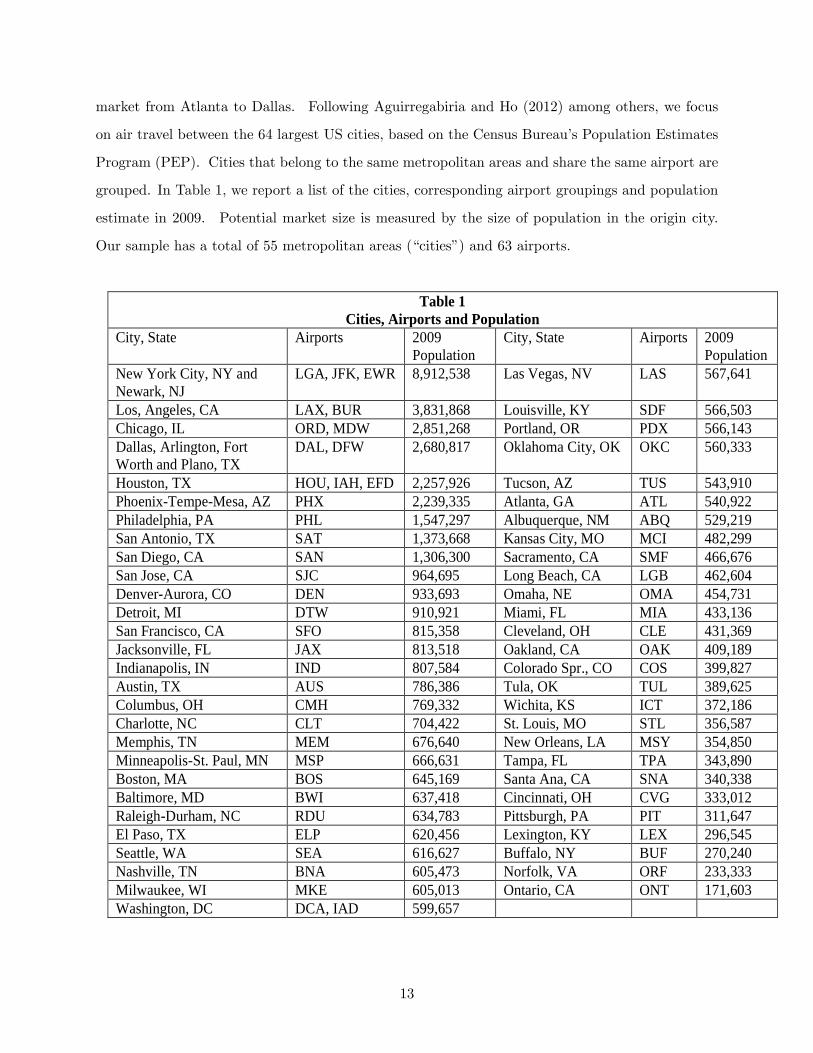
market from Atlanta to Dallas. Following Aguirregabiria and Ho (2012) among others, we focus
on air travel between the 64 largest US cities, based on the Census Bureau�s Population Estimates
Program (PEP). Cities that belong to the same metropolitan areas and share the same airport are
grouped. In Table 1, we report a list of the cities, corresponding airport groupings and population
estimate in 2009. Potential market size is measured by the size of population in the origin city.
Our sample has a total of 55 metropolitan areas (�cities�) and 63 airports.
Table 1Cities, Airports and Population
City, State Airports 2009Population
City, State Airports 2009Population
New York City, NY andNewark, NJ
LGA, JFK, EWR 8,912,538 Las Vegas, NV LAS 567,641
Los, Angeles, CA LAX, BUR 3,831,868 Louisville, KY SDF 566,503Chicago, IL ORD, MDW 2,851,268 Portland, OR PDX 566,143Dallas, Arlington, FortWorth and Plano, TX
DAL, DFW 2,680,817 Oklahoma City, OK OKC 560,333
Houston, TX HOU, IAH, EFD 2,257,926 Tucson, AZ TUS 543,910PhoenixTempeMesa, AZ PHX 2,239,335 Atlanta, GA ATL 540,922Philadelphia, PA PHL 1,547,297 Albuquerque, NM ABQ 529,219San Antonio, TX SAT 1,373,668 Kansas City, MO MCI 482,299San Diego, CA SAN 1,306,300 Sacramento, CA SMF 466,676San Jose, CA SJC 964,695 Long Beach, CA LGB 462,604DenverAurora, CO DEN 933,693 Omaha, NE OMA 454,731Detroit, MI DTW 910,921 Miami, FL MIA 433,136San Francisco, CA SFO 815,358 Cleveland, OH CLE 431,369Jacksonville, FL JAX 813,518 Oakland, CA OAK 409,189Indianapolis, IN IND 807,584 Colorado Spr., CO COS 399,827Austin, TX AUS 786,386 Tula, OK TUL 389,625Columbus, OH CMH 769,332 Wichita, KS ICT 372,186Charlotte, NC CLT 704,422 St. Louis, MO STL 356,587Memphis, TN MEM 676,640 New Orleans, LA MSY 354,850MinneapolisSt. Paul, MN MSP 666,631 Tampa, FL TPA 343,890Boston, MA BOS 645,169 Santa Ana, CA SNA 340,338Baltimore, MD BWI 637,418 Cincinnati, OH CVG 333,012RaleighDurham, NC RDU 634,783 Pittsburgh, PA PIT 311,647El Paso, TX ELP 620,456 Lexington, KY LEX 296,545Seattle, WA SEA 616,627 Buffalo, NY BUF 270,240Nashville, TN BNA 605,473 Norfolk, VA ORF 233,333Milwaukee, WI MKE 605,013 Ontario, CA ONT 171,603Washington, DC DCA, IAD 599,657
13
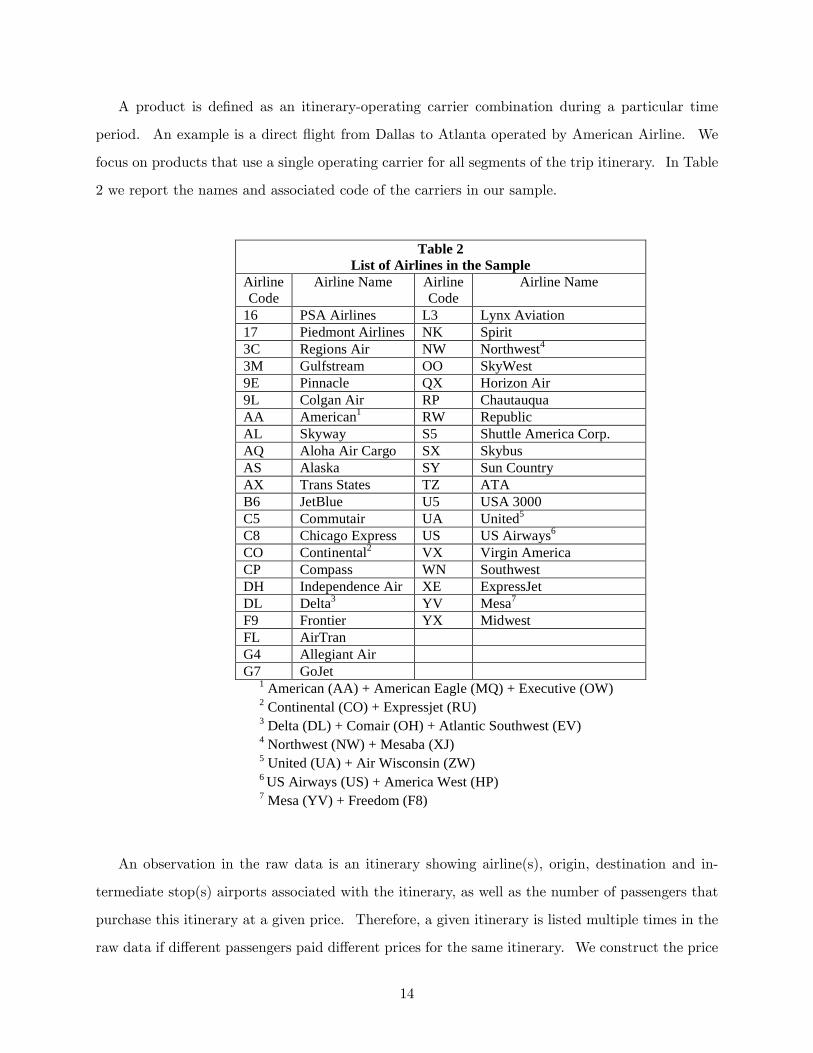
A product is de�ned as an itinerary-operating carrier combination during a particular time
period. An example is a direct �ight from Dallas to Atlanta operated by American Airline. We
focus on products that use a single operating carrier for all segments of the trip itinerary. In Table
2 we report the names and associated code of the carriers in our sample.
Table 2List of Airlines in the Sample
AirlineCode
Airline Name AirlineCode
Airline Name
16 PSA Airlines L3 Lynx Aviation17 Piedmont Airlines NK Spirit3C Regions Air NW Northwest4
3M Gulfstream OO SkyWest9E Pinnacle QX Horizon Air9L Colgan Air RP ChautauquaAA American1 RW RepublicAL Skyway S5 Shuttle America Corp.AQ Aloha Air Cargo SX SkybusAS Alaska SY Sun CountryAX Trans States TZ ATAB6 JetBlue U5 USA 3000C5 Commutair UA United5
C8 Chicago Express US US Airways6
CO Continental2 VX Virgin AmericaCP Compass WN SouthwestDH Independence Air XE ExpressJetDL Delta3 YV Mesa7
F9 Frontier YX MidwestFL AirTranG4 Allegiant AirG7 GoJet
1 American (AA) + American Eagle (MQ) + Executive (OW)2 Continental (CO) + Expressjet (RU)3 Delta (DL) + Comair (OH) + Atlantic Southwest (EV)4 Northwest (NW) + Mesaba (XJ)5 United (UA) + Air Wisconsin (ZW)6 US Airways (US) + America West (HP)7 Mesa (YV) + Freedom (F8)
An observation in the raw data is an itinerary showing airline(s), origin, destination and in-
termediate stop(s) airports associated with the itinerary, as well as the number of passengers that
purchase this itinerary at a given price. Therefore, a given itinerary is listed multiple times in the
raw data if di¤erent passengers paid di¤erent prices for the same itinerary. We construct the price
14
and quantity variables by averaging the airfare and aggregating number of passengers, respectively,
based on our product de�nition, and then collapse the data by product. Therefore, in the collapsed
data that we use for analyses a product appears only once during a given time period. In order to
avoid products that are not part of the regular o¤erings by an airline, we drop products that are
purchased by less than 9 consumers during a quarter.
Observed product shares (denoted as upper case Sj) are constructed by dividing quantity of
product j purchased (denoted as qj) by origin city population (denoted as POP ), i.e., Sj =qj
POP .
In addition to Routing Quality, we create two other non-price product characteristic variables: (i)
Origin Presence, which is computed by aggregating the number of destinations that an airline
connects with the origin city of the market using non-stop �ights. The greater the number of
di¤erent cities that an airline provides service to using non-stop �ights from a given airport, the
greater the �presence� the airline has at that airport. (ii) Nonstop, which is a zero-one dummy
variable that equals to one only if the product uses a nonstop �ight to get passengers from the
origin to destination.
Table 3Descriptive Statistics
Time period span of data: 2005:Q1 to 2011:Q3Variable Mean Std. Dev. Min Max
Pricea 165.90 50.6787 38.51 1,522.46Quantity 213.8515 604.0482 9 11,643Observed Product Shares 0.0003 0.00096 1.01e06 0.0458Origin presence 29.0576 25.8611 0 177Destination presence 28.9186 25.5970 0 176Nonstop (dummy variable) 0.227 0.419 0 1Itinerary distance flown (miles)b 1,544.255 720.9628 36 4,099Nonstop flight distance (miles) 1,377.951 667.414 36 2,724Routing Quality (measured in %) 89.70 12.78 32.33 100N_comp_nonstop 2.29 2.42 0 23N_comp_connect 9.11 8.11 0 71Number of Products 647,167Number of marketsc 75,774a Inflationadjusted.b In DB1B database this variable is reported as “Market miles flown”.c A market is defined as an origindestinationtime period combination.
There are two variables we use to measure level of competition faced by a given product in
a market, possibly from competitors other than a merging airline: (i) N_comp_nonstop, which
is the number of nonstop products o¤ered by an airline�s competitors in the market; and (ii)
15
N_comp_connect, which is the number of products that require intermediate stop(s) o¤ered by an
airline�s competitors in the market.
Summary statistics of variables used in estimation are reported in Table 3.
4 The Empirical Model
In the spirit of Peters (2006), Gayle and Le (2013), and among others, we �rst specify a discrete
choice model of air travel demand. This demand model is used to empirically validate that
consumers�choice behavior is consistent with our presumption that higher values of Routing Quality
is associated with a more passenger-desirable travel itinerary. It also provides estimates of the
pre-merger cross-price elasticities of demand between the two merging �rms in markets where they
competed directly. These cross-price elasticities serve as a useful indicator of their pre-merger
competition intensity. A reduced-form regression model of routing quality is subsequently speci�ed
to identify the merger�s quality e¤ects.
4.1 Air Travel Demand
Air travel demand is based on a nested logit model. Potential passenger i in market m during time
period t faces a choice between Jmt+1 alternatives. There are Jmt+1 alternatives because we allow
passengers the option not to choose one of the Jmt di¤erentiated air travel products. Products in
a market are thus assumed to be organized into G+1 exhaustive mutually exclusive groups/nests,
g = 0; 1; :::; G, in which the outside good, j = 0, is the only member of group 0.
A passenger solves the following optimization problem:
Maxj2f0;:::;Jmtg
�Uijmt = �jmt + ��imtg + (1� �) "ijmt
; (4)
where Uijmt is the level of utility passenger i will obtain if product j is chosen, while �jmt is the mean
level of utility across passengers that consume product j. �jmt is a function of the characteristics
of product j, as we will describe shortly. �imtg is a random component of utility that is common
to all products in group g, whereas the random term "ijmt is speci�c to product j and is assumed
to have an extreme value distribution.
The parameter �; lying between 0 and 1, measures the correlation of the consumers�utility
across products belonging to the same group. Since products are grouped by airlines, � measures
the correlation of the consumers�utility across products o¤ered by a given airline. As � increases,
16
the correlation of preferences among products o¤ered by the same airline within a market increases;
hence, the closer � is to 1, the more airline-loyal consumers are.
The mean utility function is speci�ed as:
�jmt = �0 + �1Pricejmt + �2Origin Presencejmt + �3Nonstopjmt (5)
+�4Routing Qualityjmt + aj + �t + originm + destm + �jmt;
where �1, �2, �3, and �4 are consumer taste parameters (marginal utilities) associated with the
measured product characteristics, aj are airline �xed e¤ects captured by airline dummy variables,
�t are time period �xed e¤ects captured by quarter and year dummy variables, originm and destm
are respectively market origin and destination �xed e¤ects, and �jmt captures unobserved (by the
researchers but observed by passengers) product characteristics. The expected signs of the marginal
utility parameters are: �1 < 0; �2 > 0; �3 > 0; and �4 > 0. A positive and statistically signi�cant
estimate of �4 would empirically validate that consumers�choice behavior is consistent with that
higher values of our Routing Quality measure are associated with a more desirable travel itinerary.
It is well-known in empirical industrial organization that the model above results in the following
linear equation to be estimated:
ln (Sjmt)� ln (S0mt) = �0 + �1Pricejmt + �2Origin Presencejmt + �3Nonstopjmt
+�4Routing Qualityjmt + � ln�Sjmtjg
�(6)
+aj + �t + originm + destm + �jmt;
where Sjmt is the observed share of product j computed from data by Sjmt =qjmtPOPmt
, in which qjmt
is the quantity of product j purchased and POPmt is the potential market size measured by origin
city population. S0mt = 1 �Xj2Jmt
Sjmt is the observed share of the outside option; Sjmtjg is the
observed within-group share of product j; and �jmt is the structural demand error term.
Since Pricejmt and ln�Sjmtjg
�are endogenous, we use two-stage least squares (2SLS) to esti-
mate equation (6). The instruments we use for the 2SLS estimation are: (1) number of competitor
products in the market; (2) number of competing products o¤ered by other airlines with an equiv-
alent number of intermediate stops; (3) itinerary distance; (4) the squared deviation of a product�s
itinerary distance from the average itinerary distance of competing products o¤ered by other air-
lines; (5) number of other products o¤ered by an airline in a market; and (6) mean number of
intermediate stops across products o¤ered by an airline in a market.
17
As discussed in Gayle (2007 and 2013), instruments (1)-(5) are motivated by supply theory,
which predicts that a product�s price and within-group product share are a¤ected by changes in
its marginal cost and markup. The number, and closeness in characteristics space, of competing
products in the market in�uence the size of a product�s markup, while a product�s itinerary distance
is likely to be correlated with its marginal cost. The intuition for instrument (6) is that a passenger
may prefer a set of products o¤ered by a particular airline over other airlines.
4.2 Reduced-form Routing Quality Equation
We use a reduced-form regression equation of Routing Quality to evaluate e¤ects that each of the
two mergers have on routing quality of the merged �rms. A di¤erence-in-di¤erences strategy is
used to identify possible merger e¤ects on routing quality, i.e., we compare pre-post merger periods
changes in routing quality of products o¤ered by the �rms that merge, relative to changes in routing
quality of products o¤ered by non-merging �rms over the relevant pre-post merger periods. Recall
that the full data set span the period 2005:Q1 to 2011:Q3. We use 2008:Q4 to 2011:Q3 for the
DL/NW post-merger period, while 2010:Q4 to 2011:Q3 is used for the CO/UA post-merger period.
We use the following reduced-form speci�cation of the Routing Quality equation:
Routing Qualityjmt = 0 + 1Origin Presencejmt + 2Destination Presencejmt (7)
+ 3Nonstop Flight Distancem + 4N_comp_connect jmt
+ 5N_comp_nonstopjmt + 6DNjmt + 7Tdnt + 8T
dnt �DNjmt
+ 9CUjmt + 10Tcut + 11T
cut � CUjmt + aj + �t + originm + destm + �jmt;
whereDNjmt is a zero-one airline-speci�c dummy variable that takes the value one only for products
o¤ered by Delta or Northwest, while T dnt is a zero-one time period dummy variable that takes a
value of one only in the DL/NW post-merger period. Considering the entire time span of the
data set, 6, which is the coe¢ cient on DNjmt, tells us whether the routing quality of Delta and
Northwest products systematically di¤ers from the routing quality of products o¤ered by other
airlines. 7, which is the coe¢ cient on Tdnt , tells us how routing quality of products o¤ered by
airlines other than Delta or Northwest change over the DL/NW pre-post merger periods. On the
other hand, 8, which is the coe¢ cient on the interaction variable Tdnt �DNjmt, tells us if routing
quality of products o¤ered by Delta or Northwest changed di¤erently relative to routing quality
changes of products o¤ered by other airlines over the DL/NW pre-post merger periods. Therefore,
18
8 should capture changes in the routing quality of products o¤ered by Delta and Northwest that
are associated with the DL/NW merger.
Parameters 9, 10 and 11 are interpreted analogously to 6, 7 and 8, but relate to the
CO/UA merger. For example, 11 tells us if routing quality of products o¤ered by Continental or
United changed di¤erently relative to routing quality changes of products o¤ered by other airlines
over the CO/UA pre-post merger periods. Therefore, 11 should capture changes in the routing
quality of products o¤ered by Continental and United that are associated with the CO/UA merger.
As mentioned in the data section, N_comp_nonstop measures the number of nonstop products
o¤ered by an airline�s competitors in the market, while N_comp_connect measures the number
of products that require intermediate stop(s) o¤ered by an airline�s competitors in the market.
Therefore, these two variables are used to control for the level of product-type-speci�c competition
faced by a given product in a market. We also control for the e¤ect of distance between the
origin and destination (Nonstop Flight Distance), and also for the size of an airline�s presence
at the endpoint airports of the market (Origin Presence and Destination Presence). Note that
unobserved airline-speci�c (aj), time period-speci�c (�t), origin-speci�c (originm), and destination-
speci�c (destm) e¤ects are controlled for in the reduced-form routing quality regression.
The reduced-form routing quality regression is estimated using ordinary least squares (OLS).
The routing quality equation in (7) can be thought of as a baseline speci�cation. We will subse-
quently augment the right-hand-side variables to more meticulously investigate predictions from
our theoretical model.
5 Empirical Results
5.1 Estimates from Demand Equation
Recall that price and within-group product shares are endogenous variables in the demand equation.
Therefore, OLS estimates of coe¢ cients on these variables will be biased and inconsistent. To get
a sense of the importance of using instruments for these endogenous variables, Table 4 reports
both OLS and 2SLS estimates of the demand equation. The OLS estimates of the coe¢ cients
on Price and ln�Sjmtjg
�are very di¤erent than the 2SLS estimates, in fact the OLS coe¢ cient
estimate on Price is positive and therefore contrary to standard demand theory. A formal Wu-
Hausman statistical test of exogeneity, reported in Table 4, con�rms the endogeneity of Price and
ln�Sjmtjg
�. First-stage reduced-form regressions in which Price and ln
�Sjmtjg
�are regressed on
19
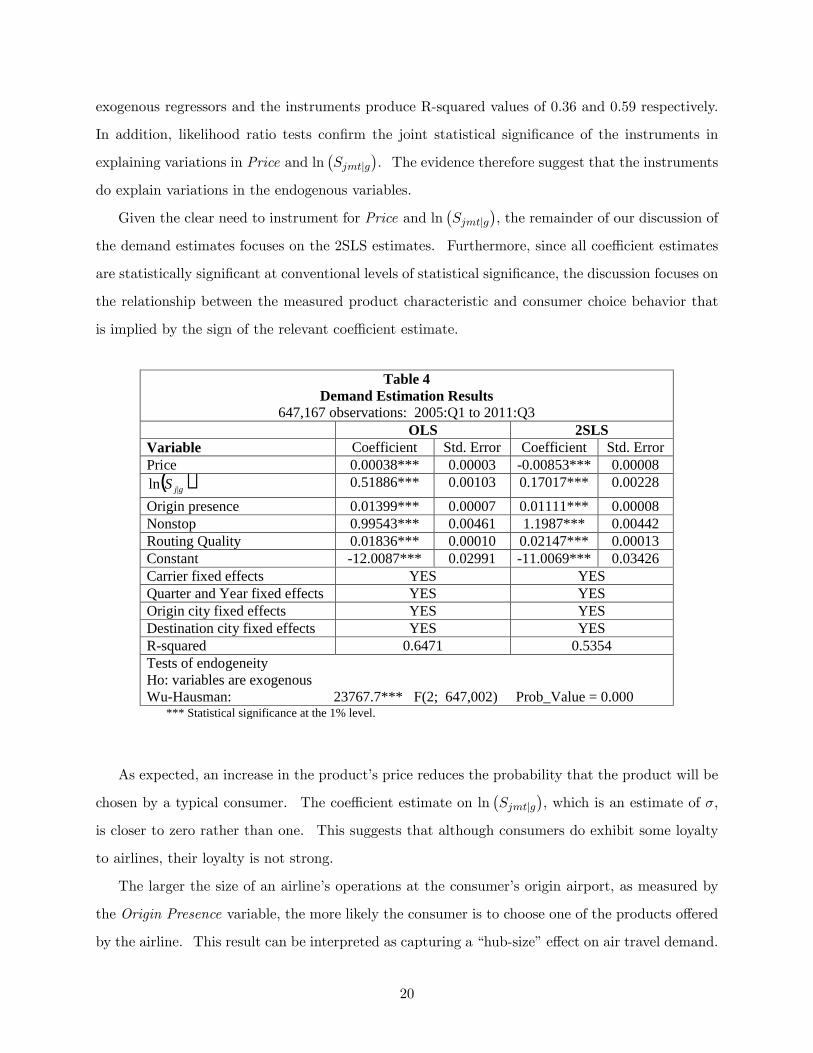
exogenous regressors and the instruments produce R-squared values of 0.36 and 0.59 respectively.
In addition, likelihood ratio tests con�rm the joint statistical signi�cance of the instruments in
explaining variations in Price and ln�Sjmtjg
�. The evidence therefore suggest that the instruments
do explain variations in the endogenous variables.
Given the clear need to instrument for Price and ln�Sjmtjg
�, the remainder of our discussion of
the demand estimates focuses on the 2SLS estimates. Furthermore, since all coe¢ cient estimates
are statistically signi�cant at conventional levels of statistical signi�cance, the discussion focuses on
the relationship between the measured product characteristic and consumer choice behavior that
is implied by the sign of the relevant coe¢ cient estimate.
Table 4Demand Estimation Results
647,167 observations: 2005:Q1 to 2011:Q3OLS 2SLS
Variable Coefficient Std. Error Coefficient Std. ErrorPrice 0.00038*** 0.00003 0.00853*** 0.00008
( )gjS |ln 0.51886*** 0.00103 0.17017*** 0.00228Origin presence 0.01399*** 0.00007 0.01111*** 0.00008Nonstop 0.99543*** 0.00461 1.1987*** 0.00442Routing Quality 0.01836*** 0.00010 0.02147*** 0.00013Constant 12.0087*** 0.02991 11.0069*** 0.03426Carrier fixed effects YES YESQuarter and Year fixed effects YES YESOrigin city fixed effects YES YESDestination city fixed effects YES YESRsquared 0.6471 0.5354Tests of endogeneityHo: variables are exogenousWuHausman: 23767.7*** F(2; 647,002) Prob_Value = 0.000
*** Statistical significance at the 1% level.
As expected, an increase in the product�s price reduces the probability that the product will be
chosen by a typical consumer. The coe¢ cient estimate on ln�Sjmtjg
�, which is an estimate of �,
is closer to zero rather than one. This suggests that although consumers do exhibit some loyalty
to airlines, their loyalty is not strong.
The larger the size of an airline�s operations at the consumer�s origin airport, as measured by
the Origin Presence variable, the more likely the consumer is to choose one of the products o¤ered
by the airline. This result can be interpreted as capturing a �hub-size�e¤ect on air travel demand.
20
Since airlines typically o¤er better services at their hub airports, such as frequent and convenient
departure times, the positive "hub-size" demand e¤ect is consistent with our expectation.
The positive coe¢ cient estimate on the Nonstop dummy variable suggests that passengers prefer
products that use a nonstop �ight itinerary from the origin to destination. In fact, if we divide
the coe¢ cient estimate on the Nonstop dummy variable by the coe¢ cient estimate on Price, this
ratio suggests that consumers are willing to pay up to $141 extra, on average, to obtain a product
with a nonstop itinerary in order to avoid products with intermediate stop(s).
The positive coe¢ cient estimate on the Routing Quality variable suggests that consumers prefer
products with itinerary �ight distances as close as possible to the nonstop �ight distance between
the origin and destination. This provides empirical validation that higher values of our routing
quality measure are associated with a more passenger-desirable travel itinerary. In fact, if we divide
the coe¢ cient estimate on the Routing Quality variable by the coe¢ cient estimate on the Price
variable, this ratio suggests that consumers are willing to pay up to $2.52, on average, for each
percentage point increase that the nonstop �ight distance is of the actual itinerary �ight distance.
The demand model yields a mean own-price elasticity of demand estimate of -1.55. Oum, Gillen
and Noble (1986) and Brander and Zhang (1990) argue that a reasonable estimate for own-price
elasticity of demand in the airline industry lies in the range of -1.2 to -2.0. Therefore, the mean
own-price elasticity estimate produced by our demand model appears reasonable.
Last, the demand model yields mean cross-price elasticity of demand estimates of 0.00025
between Delta and Northwest products, and 0.00033 between Continental and United products
during their respective pre-merger periods; the former is smaller than the latter, and the di¤erence
is statistically signi�cant. Recall that our theoretical model suggests that the intensity of pre-
merger competition (as measured by cross-elasticity of demand) between merging �rms�products
matters for the quality e¤ect of a merger. The empirical analysis in the next subsection veri�es
this theoretical prediction.
5.2 Estimates from Reduced-form Routing Quality Equation
Table 5 reports estimates of the reduced-form routing quality equation. The table provides four
columns of coe¢ cient estimates. Coe¢ cient estimates in the �rst column can be thought of as a
baseline speci�cation of the equation (Speci�cation 1), while the other three columns (Speci�cations
2, 3 and 4) incrementally assess how various factors in�uence the quality change from each merger.
21
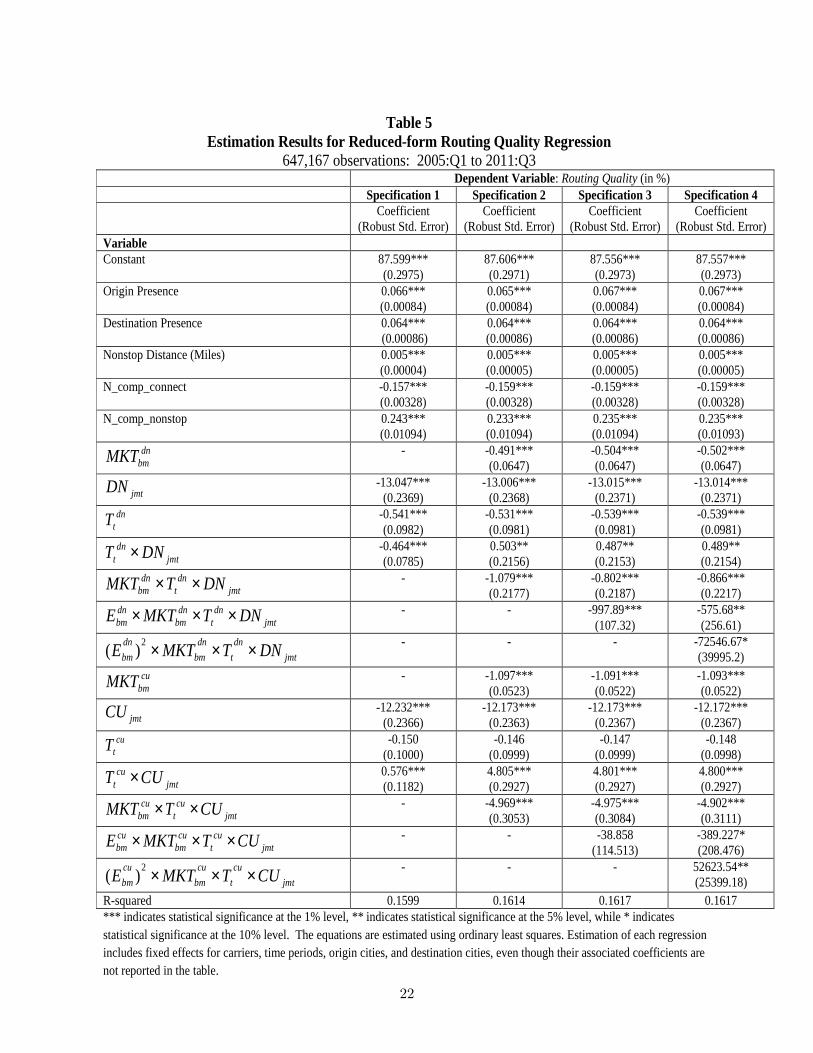
Table 5Estimation Results for Reducedform Routing Quality Regression
647,167 observations: 2005:Q1 to 2011:Q3Dependent Variable: Routing Quality (in %)
Specification 1 Specification 2 Specification 3 Specification 4Coefficient
(Robust Std. Error)Coefficient
(Robust Std. Error)Coefficient
(Robust Std. Error)Coefficient
(Robust Std. Error)VariableConstant 87.599***
(0.2975)87.606***(0.2971)
87.556***(0.2973)
87.557***(0.2973)
Origin Presence 0.066***(0.00084)
0.065***(0.00084)
0.067***(0.00084)
0.067***(0.00084)
Destination Presence 0.064***(0.00086)
0.064***(0.00086)
0.064***(0.00086)
0.064***(0.00086)
Nonstop Distance (Miles) 0.005***(0.00004)
0.005***(0.00005)
0.005***(0.00005)
0.005***(0.00005)
N_comp_connect 0.157***(0.00328)
0.159***(0.00328)
0.159***(0.00328)
0.159***(0.00328)
N_comp_nonstop 0.243***(0.01094)
0.233***(0.01094)
0.235***(0.01094)
0.235***(0.01093)
dnbmMKT 0.491***
(0.0647)0.504***(0.0647)
0.502***(0.0647)
jmtDN 13.047***(0.2369)
13.006***(0.2368)
13.015***(0.2371)
13.014***(0.2371)
dntT 0.541***
(0.0982)0.531***(0.0981)
0.539***(0.0981)
0.539***(0.0981)
jmtdn
t DNT × 0.464***(0.0785)
0.503**(0.2156)
0.487**(0.2153)
0.489**(0.2154)
jmtdn
tdn
bm DNTMKT ×× 1.079***(0.2177)
0.802***(0.2187)
0.866***(0.2217)
jmtdn
tdn
bmdnbm DNTMKTE ××× 997.89***
(107.32)575.68**(256.61)
jmtdn
tdn
bmdnbm DNTMKTE ×××2)( 72546.67*
(39995.2)cu
bmMKT 1.097***(0.0523)
1.091***(0.0522)
1.093***(0.0522)
jmtCU 12.232***(0.2366)
12.173***(0.2363)
12.173***(0.2367)
12.172***(0.2367)
cutT 0.150
(0.1000)0.146
(0.0999)0.147
(0.0999)0.148
(0.0998)
jmtcu
t CUT × 0.576***(0.1182)
4.805***(0.2927)
4.801***(0.2927)
4.800***(0.2927)
jmtcu
tcu
bm CUTMKT ×× 4.969***(0.3053)
4.975***(0.3084)
4.902***(0.3111)
jmtcu
tcu
bmcubm CUTMKTE ××× 38.858
(114.513)389.227*(208.476)
jmtcu
tcu
bmcubm CUTMKTE ×××2)( 52623.54**
(25399.18)Rsquared 0.1599 0.1614 0.1617 0.1617*** indicates statistical significance at the 1% level, ** indicates statistical significance at the 5% level, while * indicatesstatistical significance at the 10% level. The equations are estimated using ordinary least squares. Estimation of each regressionincludes fixed effects for carriers, time periods, origin cities, and destination cities, even though their associated coefficients arenot reported in the table.
22
Estimates of the constant term across the regression speci�cations are approximately 87.6.
Therefore, assuming all determinants of routing quality in the regressions are held at zero, the
mean routing quality measure across all products in the sample is approximately 87.6. This means
that nonstop �ight distances between origins and destinations are on average 87.6% of the �ight
distances associated with product itineraries used by passengers in the sample markets. Of course,
this mean routing quality will change with each of the measured routing quality determinants in
the regressions. We now examine the impact of each of the measured routing quality determinants.
5.2.1 Impact of Measured Determinants of Routing Quality
Size of an airline�s operations at the market endpoint airports, as measured by the Origin Presence
and Destination Presence variables, positively impact routing quality of products o¤ered by the
airline in the market. In particular, the relevant coe¢ cient estimates suggest that for each addi-
tional city that an airline connects to either endpoints of a market using nonstop service, routing
quality of the airline�s products within the market will increase by approximately 0.06%.
The positive coe¢ cient estimate on the Nonstop Flight Distance variable suggests that products
tend to have higher routing quality the longer the nonstop �ight distance between a market�s
origin and destination. For example, assuming all other determinants of routing quality are equal,
the routing quality of products in the New York City to Atlanta market (nonstop �ight miles
of 761) should be lower than routing quality of products in the New York City to Los Angeles
market (nonstop �ight miles of 2,469). The sign pattern of the coe¢ cient estimates on variables,
N_comp_connect and N_comp_nonstop, suggests that a product�s routing quality tends to be
higher (lower) the larger the number of competing nonstop (intermediate stop(s)) products it faces
in the market.
To achieve our ultimate goal of properly identifying merger e¤ects on routing quality, it is
important to control for the determinants of routing quality discussed above. In addition, given
that we will use a di¤erence-in-di¤erences identi�cation strategy, it is also important to control
for persistent di¤erences in routing quality across �rms. Such controls are especially important
if the routing quality of products o¤ered by the �rms that merge are persistently di¤erent from
routing quality of products o¤ered by other �rms in the sample. Without controlling for persistent
routing quality di¤erences, we may incorrectly attribute measured di¤erences in routing quality to
the merger. As such, we now examine potential persistent routing quality di¤erences across the
23
�rms that merge relative to other �rms in the sample.
5.2.2 Persistent Di¤erences in Routing Quality of Products o¤ered by the MergingFirms
The coe¢ cient estimates on dummy variableDN are approximately -13, suggesting that throughout
the time span of the data, assuming all determinants of routing quality in the regressions are held
constant, the mean routing quality measure of products o¤ered by Delta and Northwest is 13 points
less than the mean routing quality measure across all products in the sample. If all determinants
of routing quality in the regressions are held at their sample mean for Delta/Northwest products
throughout the time span of the data, then regression coe¢ cient estimates in Speci�cation 1 suggest
that the mean routing quality measure of Delta/Northwest products is approximately 84.73.16 This
routing quality measure suggests that nonstop �ight distances between origins and destinations are
on average only 84.73% of the �ight distances associated with Delta/Northwest product itineraries
used by passengers.
Analogously, we can use the regression coe¢ cient estimates to compute and interpret routing
quality measures for Continental/United products. The coe¢ cient estimates on dummy variable
CU are approximately -12, suggesting that throughout the time span of the data, assuming all
determinants of routing quality in the regressions are held constant, the mean routing quality
measure of products o¤ered by Continental and United is 12 points less than the mean routing
quality measure across all products in the sample. If all determinants of routing quality in the
regressions are held at their sample mean for Continental/United products throughout the time span
of the data, then regression coe¢ cient estimates in Speci�cation 1 suggest that the mean routing
quality measure of Continental/United products is approximately 85.48.17 Therefore, nonstop
16This mean routing quality measure for Delta/Northwest products is computed using the regression equation inSpeci�cation 1 as follows:
Routing Qualitydn = 87:599� 13:047 + 0:066� (30:535) + 0:064� (30:404)+0:005� (1425:973)� 0:157� (9:44) + 0:243� (2:335);
where the numbers in parentheses are means of the regressors for DL/NW products, while the other numbers are thecoe¢ cient estimates in Speci�cation 1 of the regression model.17This mean routing quality measure for Continental/United products is computed using the regression equation
in Speci�cation 1 as follows:
Routing Qualitycu = 87:599� 12:232 + 0:066� (26:480) + 0:064� (26:010)+0:005� (1574:05)� 0:157� (11:358) + 0:243� (2:520);
where the numbers in parentheses are means of the regressors for CO/UA products, while the other numbers are thecoe¢ cient estimates in Speci�cation 1 of the regression model.
24
�ight distances between origins and destinations are on average 85.48% of the �ight distances
associated with Continental/United product itineraries used by passengers. In summary, the
evidence suggests that CO/UA products have slightly higher mean routing quality compared to
mean routing quality of DL/NW products.
With the controls on routing quality discussed above in place, as well as �xed e¤ects controls
for other airlines, time periods, origin cities, and destination cities, we are now in a position to
examine the e¤ect of each merger on routing quality.
5.2.3 Overall Routing Quality E¤ects of each Merger
The negative coe¢ cient estimate on T dn suggests that the routing quality of products o¤ered by
airlines other than Delta or Northwest declined by 0.5% below the sample average over the DL/NW
pre-post merger periods, i.e., non-DL/NW itinerary �ight distances increased relative to nonstop
�ight distances by 0.5% over the relevant pre-post merger periods. Interestingly, the negative
coe¢ cient estimate on the interaction variable T dn�DN suggests that routing quality of products
o¤ered by the merged Delta/Northwest carrier has an even larger decline of 1% (= 0:541 + 0:464
based on estimates in Speci�cation 1) over the pre-post merger periods. This suggests that the
merger may have precipitated an additional 0.5% decline in the routing quality of DL/NW products
relative to the routing quality of products o¤ered by other airlines. In essence, the �ight distances
associated with DL/NW product itineraries increased over convenient nonstop �ight distances by
an additional 0.5% due to the merger.
The statistically insigni�cant coe¢ cient estimate on T cu suggests that the routing quality of
products o¤ered by airlines other than Continental and United were unchanged over the CO/UA
pre-post merger periods. However, in Speci�cation 1, the coe¢ cient estimate on the interaction
variable T cu�CU suggests that average routing quality of products o¤ered by the merged CO/UA
carrier increased by 0.6% over their pre-post merger periods. This suggests that the merger is
associated with an increase in routing quality of CO/UA products. In particular, according to
estimates in Speci�cation 1, �ight distances associated with CO/UA product itineraries fell towards
nonstop �ight distances by 0.6% due to the merger.
In summary, coe¢ cient estimates in Speci�cation 1 suggest that, overall, across all markets in
the sample, the CO/UA merger is associated with an increase in routing quality of their prod-
ucts, but the DL/NW merger is associated with a decline in routing quality of DL/NW products.
25
However, as our theoretical model suggests, these quality e¤ects may di¤er across markets based
on certain pre-merger characteristics of a market. We now explore this possibility via model
Speci�cations 2, 3, and 4.
5.2.4 Merger E¤ects on Routing Quality based on Existence of Pre-merger Compe-tition between Merging Firms
MKT dnbm is a zero-one market-speci�c dummy variable that takes a value of one only for origin-
destination markets in which Delta and Northwest competed prior to their merger. Similarly,
MKT cubm is a zero-one market-speci�c dummy variable that takes a value of one only for origin-
destination markets in which Continental and United competed prior to their merger. These
market-speci�c dummy variables are used in Speci�cation 2 of the regression estimates to inves-
tigate whether routing quality merger e¤ects di¤er in markets where the merging �rms competed
prior to the merger. In our data, Delta and Northwest simultaneously serve 1,730 directional
origin-destination combinations prior to their merger, while 735 directional origin-destination com-
binations are served by either one or the other carrier prior to their merger. However, Continental
and United simultaneously serve 1,436 directional origin-destination combinations prior to their
merger, while 1,025 directional origin-destination combinations are served by either one or the
other carrier prior to their merger.
The merger-speci�c variables in Speci�cation 2 suggest that the DL/NW and the CO/UA
mergers are associated with 1% and 5% declines, respectively, in routing quality of products o¤ered
by the merging �rms in markets where the merging �rms competed with each other prior to their
merger. This evidence comes from the negative coe¢ cient estimates of -1.079 and -4.969 on the
interaction variables,MKT dnbm �T dn�DN andMKT cubm �T cu�CU respectively. Based on results
from our structural demand estimates, we can monetize consumer welfare e¤ects of these routing
quality declines associated with the mergers. In particular, recall that our demand estimates
suggest that consumers are willing to pay $2.52, on average, for each percentage point increase that
the nonstop �ight distance is of the actual itinerary �ight distance. Since nonstop �ight distance
between an origin and destination cannot change, then actual itinerary �ight distance must fall
towards (increase away from) nonstop �ight distance so that nonstop �ight distance can account
for a larger (smaller) percentage of actual itinerary �ight distance. Therefore, in markets that
the merging �rms competed prior to merger, routing quality e¤ects of the mergers imply that each
consumers�utility falls by an average of $2.72 (= $2.52 � 1.079) in case of the DL/NW merger,
26
and $12.52 (= $2.52 � 4.969) in case of the CO/UA merger. These consumer welfare e¤ects are
not trivial considering that many of these markets in our sample have origin city populations close
to or greater than a million, e.g. Chicago, Illinois (one of United Airline�s hub city).
Speci�cation 2 coe¢ cient estimates on the interaction variables, T dn � DN and T cu � CU ,
suggest that routing quality of the merging �rms�products actually increase by 0.5% and 5% with
the DL/NW and CO/UA mergers, respectively, in markets where the merging �rms did not compete
with each other prior to the merger. So each consumer in these markets experienced increases in
utility related to routing quality improvements equivalent to $1.26 (= $2.52 � 0.5) in case of the
DL/NW merger, and $12.60 (= $2.52 � 5) in case of the CO/UA merger.
5.2.5 Merger E¤ects on Routing Quality based on Pre-merger Competition Intensitybetween Merging Firms
To investigate the theoretical prediction that the e¤ect of a merger on product quality depends
on the intensity of pre-merger competition (as measured by cross-elasticity of demand) between
products of the merging �rms, we use the demand model that was estimated in the previous section
to compute pre-merger cross-price elasticities between Delta and Northwest products, and between
Continental and United products. The variable, Ednbm, measures pre-merger cross-price elasticities
of demand between Delta and Northwest products, while variable Ecubm measures pre-merger cross-
price elasticities of demand between Continental and United products. The elasticities in each of
these variables vary across origin-destination markets in which the merging �rms competed prior
to their respective mergers. A cross-price elasticity between the merging �rms�products will only
exist in markets where they are competitors prior to the merger.
We use the pre-merger cross-elasticity variables to construct interaction variables: (i) Ednbm �
MKT dnbm� T dn�DN ; (ii)�Ednbm
�2�MKT dnbm� T dn�DN ; (iii) Ecubm�MKT cubm� T cu�CU ; and(iv) (Ecubm)
2 �MKT cubm � T cu � CU . Speci�cations 3 and 4 in Table 5 incrementally add these
variables to the routing quality regression.
The Delta/Northwest merger The segment of the regression equation in Speci�cation 4 that
relates to routing quality e¤ects of the Delta/Northwest merger in markets where they directly
competed prior to the merger is given by:
�Routing Qualitydn = �0:866� 575:68Ednbm � 72546:67�Ednbm
�2, (8)
27
where dummy variables MKT dnbm, Tdn and DN each take the value of 1. Note that all coe¢ cient
estimates in equation (8) are negative. This suggests that the Delta/Northwest merger decreased
routing quality of its products in all markets that the two airlines directly competed in prior to the
merger. In addition, consistent with theory, routing quality fell by more in markets where the two
airlines competed more intensely (higher Ednbm) prior to the merger.
Given that Ednbm has a mean of 0.00025, a minimum value of 1.52e-07, and a maximum value
of 0.0093, equation (8) implies that routing quality of DL/NW products declined by a mean of
1.01%, a minimum of 0.866%, and a maximum of 12.49% across markets in which Delta and
Northwest competed prior to their merger. So there exists a market in which a typical consumer
experienced a decline in utility equivalent to $31.47 (= $2.52 � 12.49), due to routing quality
declines associated with the DL/NW merger. In fact, Atlanta to Washington, DC; Atlanta to
Philadelphia; and Atlanta to San Francisco; are examples of markets in the sample in which Ednbm is
greater than 0.008, which implies that a typical consumer in these markets experienced a decline in
utility greater than $25 (� $2.52 � 10) due to routing quality declines associated with the DL/NW
merger.
Interpreting the Delta/Northwest results in the context of our theoretical model suggest that
the negative competitive incentive e¤ect of the merger dominates the positive coordination e¤ect in
all markets that the two airlines competed in prior to the merger. Note however that the coe¢ cient
on T dn �DN in Speci�cation 4 remains positive, suggesting that the positive coordination e¤ect
remains the key driver of merger quality e¤ects in markets where Delta and Northwest did not
directly compete prior to the merger.
The Continental/United merger The segment of the regression equation in Speci�cation 4
that relates to quality e¤ects of the Continental/United merger in markets where they directly
competed prior to the merger is given by:
�Routing Qualitycu = �4:902� 389:23Ecubm + 52623:54 (Ecubm)2 , (9)
where dummy variables MKT cubm, Tcu and CU each take the value of 1. Note that the coe¢ cient
estimate on (Ecubm)2 in equation (9) is positive, while the other coe¢ cients in the equation are
negative. This sign pattern of the coe¢ cients in equation (9) suggests an interesting result for the
Continental/United merger: the e¤ect of the merger on routing quality varies in a U-shaped manner
with pre-merger competition intensity (measured by cross-elasticity) between the two airlines, where
28
the minimum turning point in the U-shaped relationship occurs at a cross-elasticity of 0.0037 (=
389.23/(2 � 52623.54)). Speci�cally, the merger appears to have decreased routing quality more
in markets where the pre-merger cross-elasticities between the two airlines�products are higher, up
to an intermediate pre-merger cross-elasticity of 0.0037. Markets with pre-merger cross-elasticity
between CO and UA of 0.0037, experienced the largest decline in routing quality of 5.62%, which
yields a decline in a typical consumer�s utility equivalent to $14.16 (= $2.52 � 5.62). Examples of
origin-destination markets in our sample in which our demand model generates pre-merger cross-
elasticity between CO and UA of between 0.003 and 0.004 include: (i) Houston to Los Angeles;
(ii) Pittsburgh to Houston; and (iii) Santa Ana, California to New York City/Newark, New Jersey.
However, the decrease in routing quality of Continental/United products becomes smaller with
pre-merger cross-elasticity higher than this intermediate cross-elasticity level.
Note that equation (9) can be used to show that routing quality decreased in markets where
Ecubm is less than 0:014, but increased in markets where Ecubm is greater than 0:014. However, since
the maximum value for Ecubm in our data set is 0:014, there are no markets in which CO and UA
directly competed prior to the merger that experienced a routing quality increase of their products.
Last, the coe¢ cient on T cu � CU in Speci�cation 4 remains positive, suggesting that the positive
coordination e¤ect remains the key driver of merger quality e¤ects in markets where Continental
and United did not compete prior to their merger.
5.2.6 Summary of Empirical Results of each Merger on Routing Quality
In summary, the empirical results, taken together across both mergers, are consistent with the
theoretical predictions. The evidence suggests that each merger increased routing quality of the
merging �rms�products - approximately 0.5% and 5% for the DL/NW and CO/UA merger re-
spectively - in markets where the merging �rms did not compete prior to their merger. In these
markets, due to the merging �rms�quality improvements, a typical consumer is estimated to ex-
perience an increase in utility equivalent to $1.26 and $12.60, respectively for the DL/NW and
CO/UA merger.
In contrast, each merger decreased routing quality of the merging �rms�products in markets
where they competed prior to their merger, and the magnitude of the quality reductions di¤ered
across mergers, depending (non-monotonically in the case of CO/UA) on their competition intensity
prior to the merger. For the DL/NW merger, routing quality of the merging �rms declined by
29
a mean of 1.01%, a minimum of 0.866%, and a maximum of 12.49% across such markets. These
quality declines are estimated to yield utility decreases of a consumer in these markets ranging from
a minimum of $2.18 to as high as $31.47. For the CO/UA merger, the largest decline in routing
quality is 5.62%, which yields a decline in a typical consumer�s utility equivalent to $14.16.
In general, routing quality declined less severely for the CO/UA merger than for the DL/NW
merger. Combined with the evidence that routing quality improvements are larger for the CO/UA
merger, as far as quality changes are concerned, a typical consumer apparently fared better under
the CO/UA merger than under the DL/NW merger. In fact, overall, across all markets in the
sample, the CO/UAmerger is associated with an increase, whereas the DL/NWmerger is associated
with a decrease, in routing quality of the respective products.
6 Conclusion
An important issue in industrial organization and antitrust is how horizontal mergers a¤ect �rm
conduct and market performance. Departing from the extant literature that focuses on the price
e¤ects of mergers, this paper has investigated how mergers a¤ect product quality. Empirical analysis
of two recent airline mergers �nds that, averaging across all markets, the Delta/Northwest merger
is associated with a quality decrease while the Continental/United merger with a quality increase.
However, the quality e¤ects of mergers di¤er greatly between markets: each merger is associated
with a quality increase in markets where the merging �rms did not compete prior to their merger,
while each merger is associated with a quality decrease in markets where they did. Furthermore, the
quality change across markets from the Continental/United merger exhibited a U-shaped curve as
the pre-merger competition intensity between the two �rms increased. These �ndings are consistent
with the theory that mergers improve coordination but diminish competitive pressure for �rms to
provide high quality products.
30
References
Aghion, Philippe, Nick Bloom, Richard Blundell, Rachel Gri¢ th and Peter Howitt (2005),�Competition and Innovation: an Inverted-U Relationship,�Quarterly Journal of Economics,120: 701-728.
Aguirregabiria, Victor and Chun-Yu Ho (2012), �A Dynamic Oligopoly Game of the US AirlineIndustry: Estimation and Policy Experiments,�Journal of Econometrics, 168: 156-173.
Borenstein, Severin (1989) �Hubs and High Fares: Airport Dominance and Market Power in theU.S. Airline Industry,�RAND Journal of Economics, 20: 344-365.
Borenstein, Severin (1990), �Airline Mergers, Airport Dominance, and Market Power,�AmericanEconomic Review, 80: 400-404.
Brander, James A. and Anming Zhang (1990) �Market Conduct in the Airline Industry: AnEmpirical Investigation,�RAND Journal of Economics, 21: 567-583.
Brueckner, Jan K. (2004) �Network Structure and Airline Scheduling,�Journal of IndustrialEconomics, 52: 291-312.
Brueckner, Jan K. and Raquel Girvin (2008) �Airport Noise Regulation, Airline Service Quality,and Social Welfare,�Transportation Research: Part B: Methodological, 42: 19-37.
Brueckner Jan K. and Dan Luo (2012) � Measuring Strategic Interaction in Product-QualityChoices: The Case of Airline Flight Frequency,�working paper.
Brueckner Jan K., and Vivek Pai (2009) �Technological Innovation in the Airline Industry: TheImpact of Regional Jets,�International Journal of Industrial Organization, 27: 110-120.
Chen, Yongmin and Scott Savage (2011), "The E¤ects of Competition on the Price for CableModem Internet Access," Review of Economics and Statistics, 93: 201-217.
Chen, Yongmin and Marius Schwartz (2013), �Product Innovation Incentives: Monopoly vs.Competition,�Journal of Economics and Management Strategy, 22: 513-528.
Department of Justice (2008), �Statement of the Department of Justice�s Antitrust Division on ItsDecision to Close Its Investigation of the Merger of Delta Air Lines Inc. and Northwest AirlinesCorporation.�19 October 2008. <http://www.justice.gov/atr/public/press_releases/2008/238849.htm>
Draganska, Michaela, Michael Mazzeo, and Katja Seim (2009) �Beyond Plain Vanilla: Modelingjoint product assortment and pricing decisions,�Quantitative Marketing and Economics,7: 105 �146.
Dunn, Abe (2008) �Do low-quality products a¤ect high-quality entry? Multiproduct �rms andnonstop entry in airline markets,�International Journal of Industrial Organization, 26: 1074 -1089.
Fan, Ying (2012) �Ownership Consolidation and Product Characteristics: A Study of the U.S.Daily Newspaper Market,�American Economic Review, forthcoming.
Fare, R., S. Grosskopf and R. C. Sickles (2007) �Productivity? Of US Airlines After Deregulation,�Journal of Transport Economics and Policy, 41: 93 �112.
Gayle, Philip G. (2013), �On the E¢ ciency of Codeshare Contracts Between Airlines: Is DoubleMarginalization Eliminated?�American Economic Journal: Microeconomics, 5: 244-273.
Gayle, Philip G. (2007), �Airline Code-share Alliances and their Competitive E¤ects,�Journal ofLaw and Economics, 50: 781-819.
Gayle, Philip G. and Huubinh B. Le (2013), �Measuring Merger Cost E¤ects: Evidence from aDynamic Structural Econometric Model,�working paper.
Girvin, Raquel (2010) �Aircraft Noise Regulation, Airline Service Quality, and Social Welfare:
31
The Monopoly Case,�Journal of Transport Economics and Policy, 44: 17-35.
Ho, Vivian and Barton H. Hamilton (2000), �Hospital mergers and acquisitions: does marketconsolidation harm patients?�Journal of Health Economics, 19: 767 �791.
Ito, H., and D. Lee (2007) �Domestic Codesharing, Alliances and Airfares in the U.S. AirlineIndustry,�Journal of Law and Economics, 50: 355-380.
Kim, E.H., and V. Singal (1993), �Mergers and market power: Evidence from the airline industry,�American Economic Review, 83: 549�569.
Luo, Dan (2011), �The Price E¤ects of the Delta/Northwest Airline Merger,�Working Paper.
Mayer, Christopher and Todd Sinai (2003) �Network E¤ects, Congestion Externalities, and AirTra¢ c Delays: or Why All Delays Are Not Evil�, American Economic Review, 93: 1194-1215.
Mazzeo, Michael (2003) �Competition and Service Quality in the US Airline Industry,�Review ofIndustrial Organization, 22: 275-296.
Mutter, Ryan L., Patrick S. Romano and Herbert S. Wong (2011), �The e¤ects of US HospitalConsolidations on Hospital Quality,�International Journal of the Economics of Business,18: 109 �126.
Oum, Tae, David W. Gillen, and S.E. Noble (1986), �Demand for Fareclass and Pricing in AirlineMarkets,�Logistics and Transportation Review, 22: 195 �222.
Peters, C. 2006. �Evaluating the Performance of Merger Simulation: Evidence from the U.S. AirlineIndustry.�Journal of Law and Economics, 49: 627-649.
Prince, Je¤rey T. and Daniel Simon (2009) �Multimarket Contact and On-Time Performance inthe US Airline Industry,�Academy of Management Journal, 52: 336-354.
Prince, Je¤rey T. and Daniel Simon (2013) �Do Incumbents Improve Service Quality in Responseto Entry? Evidence from Airlines�On-time Performance,�Working paper.
Reiss, Peter and Pablo Spiller (1989) �Competition and Entry in Small Airline Markets,�Journalof Law and Economics, 32: S179 �S202.
Romano, Patrick S. and David J. Balan (2011), �A Retrospective Analysis of the Clinical QualityE¤ects of the Acquisition of Highland Park Hospital by Evanston Northwestern Healthcare,�International Journal of the Economics of Business, 18: 45-64.
Rose, Nancy L. (1990), �Pro�tability and Product Quality: Economic Determinants of Airline SafetyPerformance,�Journal of Political Economy, 98: 944-964.
Rupp, Nicholas G., D. Owens and L. Plumly (2006) �Does Competition In�uence Airline On-timePerformance?�Advances in Airline Economics: Competition Policy and Antitrust, Vol. 1,Elsevier, ed. D. Lee.
Rupp, Nicholas G. and Tejashree Sayanak (2008) �Do Low Cost Carriers Provide Low QualityService?�Revista de Analisis Economico, 23: 3-20.
Seeking Alpha (2008), �Delta Air Lines, Northwest Airlines Merger Call Transcript.�16 April 2008.<http://seekingalpha.com/article/72537-delta-air-lines-northwest-airlines-merger-call-transcript>
Werden, Gregory J., Andrew S. Joskow, and Richard L. Johnson. (1989). �The E¤ects of Mergerson Economic Performance: Two Case Studies from the Airline Industry,�U.S. Department ofJustice Antitrust Division Economic Analysis Group Discussion Paper. pp. 89-15.
32