Embed Size (px)
Citation preview

MPRAMunich Personal RePEc Archive
Is there any relationship betweenEnvironmental Quality Index, HumanDevelopment Index and EconomicGrowth? Evidences from Indian States
Sacchidananda Mukherjee and Debashis Chakraborty
National Institute of Public Finance and Policy (NIPFP), NewDelhi, Indian Institute of Foreign Trade (IIFT), New Delhi
September 2009
Online at http://mpra.ub.uni-muenchen.de/17207/MPRA Paper No. 17207, posted 4. February 2010 07:37 UTC

IS THERE ANY RELATIONSHIP BETWEEN ENVIRONMENTAL QUALITY INDEX, IS THERE ANY RELATIONSHIP BETWEEN ENVIRONMENTAL QUALITY INDEX, IS THERE ANY RELATIONSHIP BETWEEN ENVIRONMENTAL QUALITY INDEX, IS THERE ANY RELATIONSHIP BETWEEN ENVIRONMENTAL QUALITY INDEX, HUMAN DEVELOPMENT INDEX AND ECONOMIC GROWTH? HUMAN DEVELOPMENT INDEX AND ECONOMIC GROWTH? HUMAN DEVELOPMENT INDEX AND ECONOMIC GROWTH? HUMAN DEVELOPMENT INDEX AND ECONOMIC GROWTH?
EVIDENCES EVIDENCES EVIDENCES EVIDENCES FROM INDIAN STATES FROM INDIAN STATES FROM INDIAN STATES FROM INDIAN STATES
Sacchidananda Mukherjee*(1) and Debashis Chakraborty(2)
* Corresponding author (1) Consultant, National Institute of Public Finance and Policy (NIPFP), 18/2, Satsang
Vihar Marg, Special Institutional Area, New Delhi – 110 067, INDIA. Telephone: +91 11 2656 9780; +91 11 2696 3421; Mobile: +91 9868421239; Facsimile: +91 11 2685 2548. E-mail: [email protected]
(2) Assistant Professor, Indian Institute of Foreign Trade (IIFT), IIFT Bhawan, B-21,
Qutab Institutional Area, New Delhi 110016, India. Fax: +91 11 2685 3956. E-mail: [email protected]
AbstractAbstractAbstractAbstract
Economic growth does not necessarily ensure environmental sustainability for a country.
The relationship between the two is far more complicated for developing countries like India, given the dependence of a large section of the population on natural resources. Under
this backdrop, the current study attempts to analyze the relationships among Environmental Quality (EQ), Human Development (HD) and Economic Growth (EG) for
14 major Indian States during post liberalisation period (1991-2004). Further, for understanding the changes in EQ with the advancement of economic liberalisation, the
analysis is carried out by dividing the sample period into two: Period A (1990–1996) and Period B (1997–2004). For both the sub-periods, 63 environmental indicators have been
clustered under eight broad environmental groups and an overall index of EQ has been constructed using the HDI methodology. The EQ ranks of the States exhibit variation over
time, implying that environment has both spatial and temporal dimensions. Ranking of the States across different environmental criteria (groups) show that different States possess
different strengths and weaknesses in managing various aspects of EQ. The HDI rankings of the States for the two periods are constructed by the HDI technique following the National
Human Development Report 2001 methodology. We attempt to test for the Environmental Kuznets Curve hypothesis through multivariate OLS regression models, which indicate
presence of non-linear relationship between several individual environmental groups and per capita net state domestic product. The relationship between EQ and economic growth
however does not become clear from the current study. The regression results involving individual environmental groups and HDI score indicate a slanting N-shaped relationship.
The paper concludes that individual States should adopt environmental management practices based on their local (at the most disaggregated level) environmental information.
Moreover, since environmental sustainability and human well-being are complementary to each other, individual States should attempt to translate the economic growth to human
well-being. KeywordsKeywordsKeywordsKeywords: Environmental Quality Index (EQI); Human Development Index (HDI);
Economic Liberalisation; Economic Growth; India.

1
IS THERE ANY RELATIONSHIP BETWEEN ENVIRONMENTAL QUALITY INDEX, IS THERE ANY RELATIONSHIP BETWEEN ENVIRONMENTAL QUALITY INDEX, IS THERE ANY RELATIONSHIP BETWEEN ENVIRONMENTAL QUALITY INDEX, IS THERE ANY RELATIONSHIP BETWEEN ENVIRONMENTAL QUALITY INDEX,
HUMAN DEVELOPMENT INDEX AND ECONOMIC GROWTH? HUMAN DEVELOPMENT INDEX AND ECONOMIC GROWTH? HUMAN DEVELOPMENT INDEX AND ECONOMIC GROWTH? HUMAN DEVELOPMENT INDEX AND ECONOMIC GROWTH? EVIDENCES EVIDENCES EVIDENCES EVIDENCES FROM INDIAN STATES FROM INDIAN STATES FROM INDIAN STATES FROM INDIAN STATES
Sacchidananda Mukherjee and Debashis Chakraborty
1111.... IntroIntroIntroIntroductionductionductionduction
The economic reform process initiated in 1991 has played a major role in shaping
India’s overall as well as its sub-regional economic growth. First, the unshackling of
domestic industries, coupled with the shift towards export-oriented economic philosophy
caused an industrialisation drive across the Indian States. Second, the easing of FDI
approval system provided ample scope for States with enterprising governments to strike
their own growth curves by encouraging investment and thereby ensuring industrialisation
within their territories. Third, in the post-1991 period the policy objective of achieving
balanced growth no longer remained a driving concern, and thus enhanced the possibility of
increasing industrial concentration in strategic locations.
Enhanced economic growth (EG) is likely to raise the general level of human
development (HD) in the current period, which in turn may influence future EG potential
positively. However, increasing industrialisation or urbanisation on the other hand, if not
associated with requisite level of governance, can considerably influence the environmental
sustainability of a region in question (Maiti and Agrawal, 2005). The adverse impact could
either come through natural resource depletion and/or adverse health consequences of
environmental degradation, e.g., air or water pollution (Brandon and Hommann, 1995).
It can be further argued that with increasing level of HD, public awareness on
environmental sustainability increase in a particular State, which in turn will influence its
pattern of governance.1 In other words, States with higher HDI should ideally be ranked
higher in terms of environmental performance. The relationship between economic growth,
measured through per capita net state domestic product (PCNSDP), and environmental
performance might be more complex in nature. In general, higher income level is conducive
for ensuring higher HD, and therefore should ideally be favourable for maintaining
environmental sustainability (World Bank, 2006). However, some States might also choose
1 Jalan et al. (2003) show that raising the level of schooling of woman in an urban household from 0 to
10 years approximately doubles willingness to pay for improved drinking water quality.

2
to grow in the short run by hosting a number of environmentally damaging but fast-
growing industries within their territories, with obvious consequences on local environment.
Globally, the environmental regulation-avoiding attitude of producers often leads to
concentration of polluting industries in locations characterised by lax environmental norms
(‘Pollution Haven Hypothesis - PHH’). Usually it is argued that the developed country
producers relocate their polluting units in newly industrialising developing countries
(Eskeland and Harrison, 2003).2 Similarly within a country, relocation along that line from
‘cleaner’ States to the ‘dirtier’ States may be noticed for various reasons (Dastidar, 2006).3
Working with the Indian scenario, while negative environmental performance by
transnational corporations during 1980s (Jha, 1999) and higher FDI inflow in relatively
more polluting sectors in the post-liberalisation period have been reported (Gamper-
Rabindran and Jha, 2004); several studies rejected the existence of PHH (Dietzenbacher
and Mukhopadhyay, 2007; Jena et al., 2005). In long run the PHH may or may not become
a reality in some Indian States. However, that is beyond the scope of the current exercise.
The efficiency of environmental governance and pollution-abatement is currently a
much-researched area (Costantini and Salvatore, 2006; Kathuria and Sterner, 2006; Sankar,
1998). The intervention of Supreme Court in India has been quite successful in this regard
(Antony, 2001; World Bank, 2006), although the limitation of that approach has also been
highlighted (Venkatachalam, 2005).4 Programmes like joint forest management (JFM) can
also be mentioned here, with direct involvement of stakeholders, which has helped natural
2 Gallagher (2004) cautioned that without environmental laws, regulations, and the willingness and
capacity of enforcement, trade-led growth will lead to increase in environmental degradation. 3 Maharashtra is the biggest producer of electronic waste in India, however the more hazardous recycling
of these products (e.g. – extraction of copper, gold, breaking-up of cathode-ray tubes etc.) is actually
undertaken in Delhi. This particular choice of recycling location comes from the fact that the extracted
materials are important inputs for the copper and gold business in Moradabad and Meerat respectively,
both close to Delhi (Dastidar, 2006). 4 For instance, setting up of the Local Area Environmental Committees (LAECs) with the active
participation of the local people for inspection, monitoring of day-to-day development in hazardous
waste affected sites; the Supreme Court Monitoring Committee (SCMC) on hazardous waste has
ensured strict compliance of the Hazardous Wastes (Management and Handling) Rules, 1989 on the
part of the industries or any other agency involved in hazardous waste generation, collection, treatment
and disposal.

3
resource management to a great extent (CBD, undated; Balooni, 2002).5 World Bank
(2006) has noted that India’s environmental institutions and regulatory regime need to be
strengthened through incentives to the industries complying with greener norms on one
hand and devolution of more powers to local governments on the other. In addition, Chopra
and Gulati (1997) argued that strengthening property rights can also arrest environmental
degradation.
Apart from the internal factors like economic liberalisation, external factors have
also influenced the environmental scenario in India significantly. Trade and Environment
remained an important issue for discussion at the WTO forums since the inception of the
multilateral body in 1995 and standard-setting has been a continuous process. Indian firms,
especially doing business in sectors like textile, marine products, leather, chemicals etc.,
have often complained that the environmental compliance norms for exporting to EU and
US are too stringent (Chakraborty and Singh, 2005). Nonetheless, owing to sanctions and
regular factory visits by importing country officials, the compliance level in India has
increased over the years for several industries (Tewari and Pillai, 2005; Sankar, 2006;
Schjolden, 2000), with obvious positive implications on the domestic environment.
In this background, on the basis of a secondary data analysis, the current paper
attempts to analyze the relationship of environmental quality with human development and
economic growth separately for 14 major Indian States over 1991-2004. For a closer analysis
of the impact of the reform element on environmental quality of the States, the sample
period is bifurcated into two sub-periods - Period A (1990–1996) and Period B (1997–2004)
respectively. This period marks an evolving attitude of the country towards environment,
although in a gradual manner.6 The paper is organised as follows. A brief literature survey
on environmental sustainability, human development and economic growth is followed by
the discussion on the methodology adopted in this paper, the results and the policy
observations respectively.
5 Sankar (1998) argues that the government may ensure participation of community based organisations
in management of local commons as well as in the enforcement of environmental laws and rules. 6 India introduced Environment (Protection) Act and Hazardous Waste (Management and Handling)
Rules in 1986 and 1989 respectively and became a member of Basel Convention in 1992. However, the
national rules on hazardous waste were brought into conformity with Basel norms only in 2000
(Sharma, 2005; Divan and Rosencranz, 2002).
4
2222 Literature ReviewLiterature ReviewLiterature ReviewLiterature Review
2.12.12.12.1 Environmental SustainabilityEnvironmental SustainabilityEnvironmental SustainabilityEnvironmental Sustainability
Determining the appropriate methodology for arriving at meaningful environmental
indices is a debated research question (Ebert and Welsch, 2004; Zhou et al., 2006). It has
generally been observed that using a composite environmental index summarises the
environment condition of a region or country or state,7 and is more meaningful than
individual indicators (Rogers et al., 1997; Adriaanse et al., 1995; Adriaanse, 1993, Esty et
al., 2005; Jones et al., 2002; Mukherjee and Kathuria, 2006). However the methodology and
selection of variables for construction of environmental index vary considerably across these
studies.
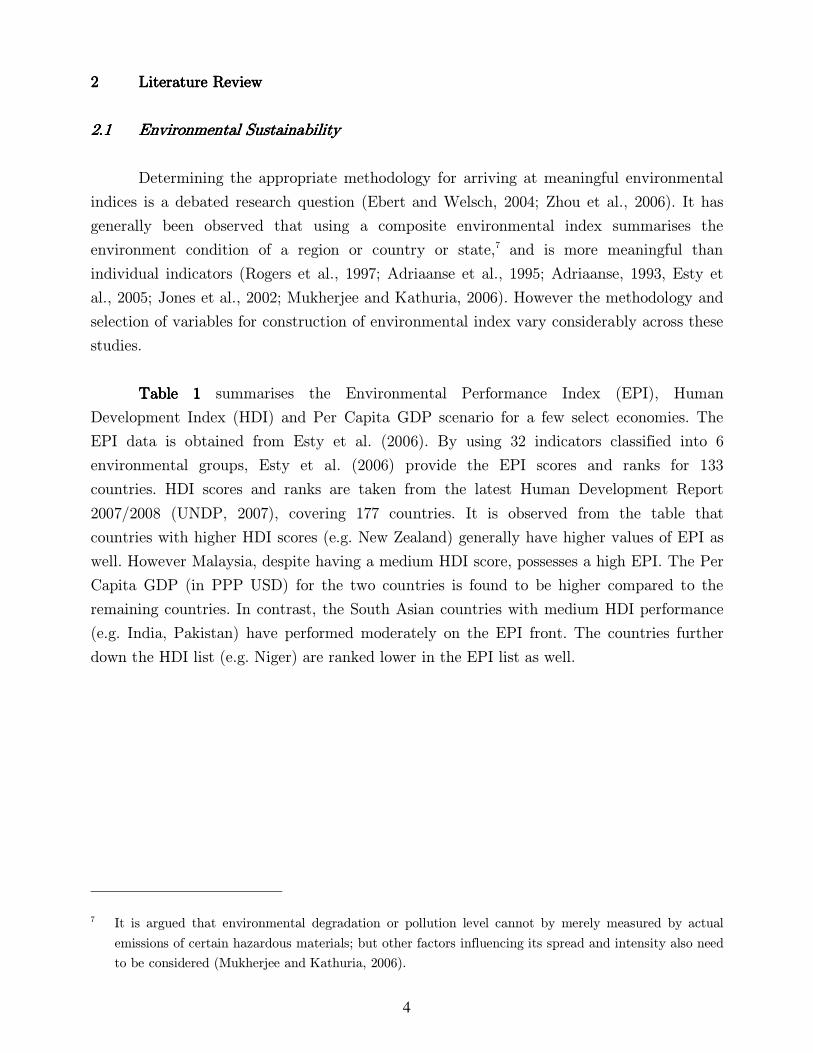
Table 1Table 1Table 1Table 1 summarises the Environmental Performance Index (EPI), Human
Development Index (HDI) and Per Capita GDP scenario for a few select economies. The
EPI data is obtained from Esty et al. (2006). By using 32 indicators classified into 6
environmental groups, Esty et al. (2006) provide the EPI scores and ranks for 133
countries. HDI scores and ranks are taken from the latest Human Development Report
2007/2008 (UNDP, 2007), covering 177 countries. It is observed from the table that
countries with higher HDI scores (e.g. New Zealand) generally have higher values of EPI as
well. However Malaysia, despite having a medium HDI score, possesses a high EPI. The Per
Capita GDP (in PPP USD) for the two countries is found to be higher compared to the
remaining countries. In contrast, the South Asian countries with medium HDI performance
(e.g. India, Pakistan) have performed moderately on the EPI front. The countries further
down the HDI list (e.g. Niger) are ranked lower in the EPI list as well.
7 It is argued that environmental degradation or pollution level cannot by merely measured by actual
emissions of certain hazardous materials; but other factors influencing its spread and intensity also need
to be considered (Mukherjee and Kathuria, 2006).

5
Table 1: Table 1: Table 1: Table 1: Environmental Performance Index, Human Development Index and Environmental Performance Index, Human Development Index and Environmental Performance Index, Human Development Index and Environmental Performance Index, Human Development Index and Per Capita GDP Per Capita GDP Per Capita GDP Per Capita GDP – A Cross Country View A Cross Country View A Cross Country View A Cross Country View
CountryCountryCountryCountry Environmental Environmental Environmental Environmental
Performance Index Performance Index Performance Index Performance Index Score: 2006Score: 2006Score: 2006Score: 2006
Human Human Human Human Development Development Development Development
Index Score: 2005Index Score: 2005Index Score: 2005Index Score: 2005
Per Capita Per Capita Per Capita Per Capita GDP (PPP GDP (PPP GDP (PPP GDP (PPP USD): 2005USD): 2005USD): 2005USD): 2005
Bangladesh 43.5 (125) 0.547 (140) 2,053 China 56.2 (94) 0.777 (81) 6,757 IndiaIndiaIndiaIndia 47.747.747.747.7 (118)(118)(118)(118) 0.6190.6190.6190.619 (128)(128)(128)(128) 3,4523,4523,4523,452 Indonesia 60.7 (79) 0.728 (107) 3,843 Malaysia 83.3 (9) 0.811 (63) 10,882 Myanmar 57.0 (88) 0.583 (132) 1,027 Nepal 60.2 (81) 0.534 (142) 1,550 Pakistan 41.1 (127) 0.551 (136) 2,370 Philippines 69.4 (55) 0.771 (90) 5,137 Sri Lanka 64.6 (67) 0.743 (99) 4,595 Thailand 66.8 (61) 0.781 (78) 8,677 Niger 25.7 (133) 0.374 (174) 781 New Zealand 88.0 (1) 0.943 (19) 24,996 Note: Figure in the parenthesis shows the rank of the country for the corresponding score Source: Esty et al (2006), UNDP (2007/2008)
2.22.22.22.2 Relationships between Environmental Quality and Economic Growth Relationships between Environmental Quality and Economic Growth Relationships between Environmental Quality and Economic Growth Relationships between Environmental Quality and Economic Growth
The literature on the relationship between Per Capita Income (PCI) or the PCNSDP
in case of States within a country, and pollution or environmental degradation generally
attempts to verify the existence of an inverted U-shaped curve in the PCI vs. pollution
plane (‘Environmental Kuznets Curve’). The relationship implies that with the rise in PCI,
environmental degradation continues up to a certain level of PCI, but improves afterwards
as with prosperity, countries shift to cleaner production technologies or spend more
resources on pollution abatement (Esty and Porter, 2001-02; Andreoni and Levinson, 2001).
Recent empirical studies show that while some local pollutants like Sulphur dioxide (SO2),
Suspended Particulate Matter (SPM), Carbon monoxide (CO) etc. support EKC
hypothesis; other pollutants exhibit either monotonicity or N-shaped curve (Dinda, 2004;
Stern, 1998). Studies based on both ambient concentration of pollutants (Baldwin, 1995;
Grossman and Krueger, 1995; Selden and Song, 1994; Panayatou, 1993; Shafik and
Bandyopadhyay, 1992; Pezzey, 1989) or the actual emissions of pollutants (Bruvoll and
Medin, 2003; de Bruyn et al., 1998; Carson et al., 1997) also support the EKC hypothesis.
It is argued that working with a composite indicator of pollutants, as a proxy of
actual EQ scenario, scores over selection of a single pollutant in determination of the EKC
relationship (Mukherjee and Kathuria, 2006), although only a handful of studies have

6
adopted that approach so far. Jha and Bhanu Murthy (2001) created an Environmental
Degradation Index (EDI) for 174 countries and compared that with the Human
Development Index (HDI) instead of the PCI. The study found an inverse link between
EDI and HDI, which supported the existence of an inverted N-shaped global EKC rather
than an inverted U-shaped one.
In Indian context, Mukherjee and Kathuria (2006) explored the EKC relationship for
14 major Indian States over 1990-2001 by considering 63 environmental variables, arranged
under eight broad environmental groups. The ranking of the States on a constructed
Environmental Quality Index (EQI) were determined by using the factor analysis method.
The results indicate that the relationship between EQ and PCNSDP is slanting S-shaped,
indicating that the economic growth has occurred in Indian States mostly at the cost of
EQ. It was observed that except Bihar, all the States are on the upward sloping portion of
the EKC. Kadekodi and Venkatachalam (2006) noted evidence of a strong linkage between
various natural resources and environment with income and the status of livelihood and
concluded that the causal relationship between poverty and environment works in both
directions. The research has also highlighted the importance of poverty alleviation while
minimising the human health and environmental costs of economic growth (Nadkarni, 2000;
Nagdeve, 2007) and the possibility of entering into a long-run vicious circle of
environmental degradation, greater inequality and lower growth (Dutt and Rao, 1996) in
that process. However Bhattacharya and Innes (2006) argued that the poverty-environment
nexus (vicious-cycle) hypothesis does not hold in rural India.
2.32.32.32.3 Relationship between Environment and Human WellRelationship between Environment and Human WellRelationship between Environment and Human WellRelationship between Environment and Human Well----being being being being
It is observed from the literature on environmental impacts of structural adjustment
programme that if the victims of depletion and degradation of natural environment are not
identified and compensated by the beneficiaries, the vulnerable sections face additional
economic hardship, which may fuel inequality further (Dasgupta, 2001). It has been argued
by Boyce (2003) that, “social and economic inequalities can influence both the distribution
of the costs and benefits from environmental degradation and the extent of environmental
protection. When those benefit from environmentally degrading economic activities are
powerful relative to those who bear the costs, environmental protection is generally weaker
than when the reverse is true.” The analysis suggests that socio-economic inequality leads
to environmental inequality, which may consequently affect the overall extent of
environmental quality. Therefore any attempt to reduce inequalities would eventually result
in environmental protection (Sagar, undated).

7
It is increasingly believed that environmental problems should no longer be viewed
as the side effects of development process. On the contrary, a new approach focusing on
promotion of their integration need to be adopted (van Ginkel et al., 2001). The objective
has been met through Target 9 of the United Nations’ Millennium Development Goals
(MDGs),8 which demands that environmental conservation and conservation of natural
resources from quantitative depletion and qualitative degradation, should be an integral
part of any economic and development policy.
Melnick et al. (2005) highlight the critical importance of achieving environmental
sustainability to meet the MDGs with respect to poverty, illiteracy, hunger, gender
inequality, unsafe drinking water and environmental degradation. They argue that
achieving environmental sustainability requires carefully balancing human development
activities while maintaining a stable environment that predictably and regularly provides
resources and protects people from natural calamities.
2.2.2.2.4444 Relationship between Economic Growth and Human DevelopmentRelationship between Economic Growth and Human DevelopmentRelationship between Economic Growth and Human DevelopmentRelationship between Economic Growth and Human Development
The literature suggests a two-way relationship between EG and HD, implying that
nations may enter either into a virtuous cycle of high growth and large HD gains, or a
vicious cycle of low growth and low HD improvement (Ranis, 2004). It is also observed that
higher initial level of HD corresponds to positive effects on institutional quality and
indirectly on EG (Costantini and Salvatore, 2006). The study by Agarwal and Samanta
(2006) involving 31 developing countries, observed that EG is not correlated with social
progress, structural adjustment or governance. Nevertheless, all of them might have an
impact on the EQ within a country like India, where a two-way causality between EG and
HD is observed, indicating possibilities of vicious cycles (Ghosh, 2006), which might have
environmental repercussions.
The UNDP annually publishes an extensive analysis of global HD situation in the
Human Development Report (HDR) along with country rankings. However, it is often
argued that the UNDP’s HD indicators are perhaps too narrow in nature, and inclusion of
certain important socio-economic variables would enrich the analysis further. The Latent
Variable Approach adopted by Nagar and Basu (2001) involving 174 countries confirms
8 ”Integrate the principles of sustainable development into country policies and programmes and reverse
the losses of environmental resources” - Target 9 of the UN’s MDGs.

8
that with inclusion of additional socio-economic variables, the alternate HD rankings differ
significantly from the official UNDP ranking.
While India’s HD ranking remained in the low HD category throughout nineties, in
2002 it graduated to medium HD category with the HDI score of 0.577, as compared to the
corresponding figure of 0.439 in 1990. India’s global HDI rank has improved from 132 in
1999 to 127 in 2003.9 Recently in association with UNDP, the Government of India has
started analysing the State-wise HD status. The National Human Development Report 2001
(Government of India, 2002), brought out by the Planning Commission, is worth
mentioning in this regard. While the report ranked Kerala, Punjab and Tamil Nadu as the
toppers; Bihar, Madhya Pradesh and Uttar Pradesh were at the other extreme in HD scale.
The alternate index developed by Guha and Chakraborty (2003), in line with Nagar and
Basu (2001), however showed that inclusion of other socio-economic variables changes the
State rankings to some extent. For instance, Tamil Nadu, ranked third by NHDR, slides
down the ladder to the eighth place according to the alternate index.
3333 Methodology and DataMethodology and DataMethodology and DataMethodology and Data
3.13.13.13.1 Environmental Quality Index (EQI)Environmental Quality Index (EQI)Environmental Quality Index (EQI)Environmental Quality Index (EQI)
The EQI for the States is postulated to be linearly dependent on a set of observable
indicators and has been determined by adopting the HDI method, by putting the selected
variables under eight broad categories mentioned in Appendix 1Appendix 1Appendix 1Appendix 1. The idea is that all the 63
environmental variables, when combined, give a composite EQI ranking of the States,
unobservable otherwise. We assume Xij to be the value of the ith indicator for jth State of
India with respect to X (or environmental quality), where X consists of a large number of
indicators varying from 6 to 12 (Appendix 2Appendix 2Appendix 2Appendix 2). As defined earlier, X’s are Air Pollution
(AIRPOL), Indoor Air Pollution Potential (INDOOR), Green House Gases Emissions
(GHGS), Pollution from Energy Generation and Consumption (ENERGY), Depletion and
Degradation of Forest Resources (FOREST), Depletion and Degradation of Water
Resources (WATER), Nonpoint Source Pollution Potential (NPSP) and Depletion and
Degradation of Land Resources (LAND) respectively.
9 In relative sense, India’s position actually does not look that bad as UNDP considered 130 and 177
countries in 1990 and 2003 respectively.

9
In line with the HDI method, we transform the indicators into their standardised
form to obtain the adjusted values of Xij (i.e., EXij’s) to be used for the analysis. EXij’s are
obtained by dividing the difference between any Xij and the minimum value of Xi to the
difference between the maximum and the minimum value of Xi. Alternatively, EXij’s are
obtained by dividing the difference between the maximum value of Xi and any Xij to the
difference between the maximum and the minimum value of Xi.10
Now, EQIXj, i.e., the environmental quality index score for the jth State with respect
to each individual environmental quality X (which constitutes of n number of indicators, n
varies from 6 to 12), is arrived at by summing the EXijs over i and dividing the number of
variables (n) selected within that group. In a similar manner, EQIj, i.e., the overall
environmental quality index score for the jth State, is arrived at by summing all the 63 EXijs
and diving it by 63.
The obtained EQIs measure the environmental well-being of the States, i.e., the
States with higher score are characterised by cleaner environment. The EQIjs (where j=1 to
14), thus arrived, is therefore used to obtain the REQIjs (the rank of the jth State), where
the States having higher EQIj are assigned higher rank.
3.23.23.23.2 Human Development Index (HDI)Human Development Index (HDI)Human Development Index (HDI)Human Development Index (HDI)
Following the principle of the NHDR 2001 (Government of India, 2002)
methodology, for calculation of the Human Development Index (HDI), we consider three
variables, namely - per capita consumption expenditure; and composite indicators of
educational attainment and health attainment respectively. With this formulation,
following the HDI method, the HDI score for the jth State is given by the average of the
normalised values of the three indicators, namely - inflation and inequality adjusted per
capita consumption expenditure (X1); composite indicator on educational attainment (X2)
and composite indicator on health attainment (X3). Like the earlier case, the normalisation
is done by dividing the difference between any variable (Xij) within these categories and the
minimum value of Xi to the difference between the maximum and the minimum value of Xi.
Although UNDP considers Real GDP Per Capita in PPP USD for generating the
HDI, the NHDR (Government of India, 2002) has preferred total inflation and inequality
adjusted per capita consumption expenditure of a State (i.e., Rural and Urban Combined)
10 The variables for which these two alternate formulas are used are specified at the end of Appendix 3.

10
over that for the analysis. Here the monthly per capita consumption expenditure data
obtained from NSSO for two periods (1993-94 and 1999-2000), first adjusted for inequality
using estimated Gini Ratios, and further adjusted for inflation to bring them to 1983 prices
by using deflators derived from State specific poverty line (Government of India, 2002). If
GRij is the Gini Ratio for the jth State for the ith period and MPCEij is the average
monthly per capita consumption expenditure for the jth State for the ith period, inequality
adjusted average monthly per capita expenditure for the jth state for the ith period
(IMPCEij) is (1-GRij)*MPCEij, where 10 ≤≤ ijGR . After adjustment for inequality for each
of the States, we carried out adjustment for inflation. If PLij is the poverty line for the jth
State for the ith period and PL1983j is the poverty line of the jth State for 1983, then
inflation and inequality adjusted average monthly consumption expenditure for the jth
State for the ith period (IIMPCEij) is (PL1983j/PLij)*IMPCEij. We consider inflation and
inequality adjusted average monthly per capita consumption expenditure of a State as
indicator of consumption (X1) to construct Human Development Index.
The composite indicator on educational attainment (X2) is arrived at by considering
two variables, namely literacy rate for the age group of 7 years and above (e1) and adjusted
intensity of formal education (e2). The idea is that literacy rate being an overall ratio alone
may not indicate the actual scenario, and the drop-out rate, needs to be incorporated in the
formula. We consider the data on literacy rate for two periods, namely - 1991 and 2001.
The adjusted Intensity of Formal Education data is used for two periods – 1993 and 2002.
The current analysis assigns weightage of 0.35 to e1 and 0.65 to e2 to estimate X2.
The Intensity of Formal Education is estimated as weighted average of the enrolled
students from class I to class XII (where weights being 1 for Class I, 2 for Class II and so
on) to the total enrolment in Class I to Class XII. This is adjusted by proportion of total
enrolment to population in the age group 6-18 (Government of India, 2002). According to
the formula suppose Ei be the number of children (rural and urban combined) enrolled in ith
standard in 2002, i= 1 for Class I to 12 for Class XII). Then Weighted Average of the
Enrolment (WAE) from Class I to Class XII is calculated as the weighted average of
enrolment (Ei) in a particular Class where weights are i = 1 for Class I to 12 for Class XII.
Now, suppose TEi is the total enrolment of Children from Class I to Class XII in
2002. Then the Intensity of Formal Education (IFE) for children (rural and urban
combined) in 2002 becomes WAE expressed as a percentage of TE. Suppose PC represents
the Population of Children (rural and urban combined) in the age group 6 to 18 years in
2001. Then we can determine the Adjusted Intensity of formal education (AIFE) for

11
children (rural and urban combined) in 2002, as the ratio of IFE multiplied by TE and the
Population of Children (rural and urban combined) in the age group 6 to 18 years in 2001.
Finally the Composite indicator on health attainment (X2) is arrived at by
considering two variables, namely Life Expectancy (LE) at age one (h1) and the reciprocal
of Infant Mortality Rate (IMR) as the second variable (h2). For h1, which measures the life
expectancy at age 1 (Rural and Urban Combined), the two data points considered for the
two periods are 1990-94 and 1998-2002 respectively. On the other hand, the IMR (Per
Thousand) data is considered for two periods, namely - 1992 and 2000. We assign the
weightage of 0.65 and 0.35 to h1 and h2 respectively to determine the composite indicator
(X3) used for calculation of the HDI.
3.33.33.33.3 Economic Growth (EG)Economic Growth (EG)Economic Growth (EG)Economic Growth (EG)
EG in the current analysis is measured by the PCNSDP of the States at constant
(1993-94) prices. PCNSDP for Period A and Period B are the average PCNSDP for the
period 1993-94 to 1995-96 and 1997-98 to 1999-2000 respectively. The average is taken to
smoothen out uneven fluctuations. To understand the size of the economy and growth
pattern of each of the 14 States, we have classified the States into three categories with
respect to their Gross State Domestic Product (GSDP) at constant 1993-94 prices: high
income States (GSDP: greater than 3rd Quartile), medium income States (GSDP: 1st to 3rd
Quartile) and low income States (GSDP: less than 1st Quartile).
Mukherjee and Chakraborty (2007) noted that during 1993-96, on an average middle
income states (e.g. - Gujarat, Rajasthan and Karnataka) were growing faster than others.
However, during 1997-2000, except for low income States (e.g. – Kerala, Orissa), growth
rate slowed down, indicating stagnation. Moreover, during 2000-2004, the difference in EG
rate across the States having different level of income has gone down and barring few
exceptions (Rajasthan and West Bengal) both for low and medium income States, the
growth rate generally slowed down as compared to the late 1990s level.
3.43.43.43.4 DataDataDataData
In order to obtain State level secondary information on environment and natural
resources from published government reports and other databases for both the time periods
selected in our analysis, i.e., Period A (1990-96) and Period B (1997-2004), the sample is

12
restricted only to 14 major Indian States, namely - Andhra Pradesh (AP), Bihar (BH),
Gujarat (GJ), Haryana (HR), Karnataka (KR), Kerala (KL), Madhya Pradesh (MP),
Maharashtra (MH), Orissa (OR), Punjab (PB), Rajasthan (RJ), Tamil Nadu (TN), Uttar
Pradesh (UP) and West Bengal (WB). Now the data available for various environmental
indicators in India are not always necessarily compatible with the time period selected by
us, given the varying date and frequency of their publication. To resolve this issue, we have
chosen only those indicators with at least two observations, where one of these observations
is located within the boundary of the two sample periods. The selected indicators have then
been normalised using appropriate measures of size / scale of the States – geographical
area, population and GSDP at current prices.
Here we need to distinguish between two key concepts, namely - endowment effect
and efficiency in natural resource management effect. The depletion and degradation of
natural resources and occurrence of environmental pollution is chiefly concerned with
environmental management. On the other hand, the initial endowments of natural resources
(forests, land and water) are determined by geographical, climatic and ecological factors.
Quite understandably, the former is comparatively more influenced by human activities. By
calculating the change in the natural resource position with respect to a base year we can
isolate the two effects.11 The current study focuses on the environmental management
efficiency effect as well as the size effect of the States.
The data sources for our analysis on EQ and descriptions of the actual data series
used to construct each group are listed in Appendix Appendix Appendix Appendix 1111 and 2222 respectively. A total of 63
variables have been selected for the analysis, placed under eight broad categories, which are
summarised in Appendix 1Appendix 1Appendix 1Appendix 1.
For the analysis on education, we use the data available from the “7th All India
Educational Survey (AIES): All India School Education Survey (AISES)”, published by
NCERT (2002). On the health front, IMR data is taken from Sample Registration System
(SRS) Bulletins; Registrar General of India, New Delhi and LE data is taken from Indiastat
database website (www.indiastat.com). The data on EG of the States is obtained from
11 For instance, a higher index for Orissa as compared to Punjab by merely ranking the forest resources of
the two States (by taking the percentage of geographical area under forests land) comes from the fact
that Punjab possess very little of the selected variable to begin with. Therefore the analysis does not
imply that forest conservation practices of the former are in any way better than the same of the latter.
Ranking the change in their forest area (as a percentage of geographical area) during any two periods
would be the ideal exercise for comparing their forest conservation practices.

13
Economic and Political Weekly Research Foundation’s Database Software and Reserve
Bank of India’s Database on Indian Economy.
4.4.4.4. The ResultsThe ResultsThe ResultsThe Results
4.14.14.14.1 EQIEQIEQIEQI
In Table Table Table Table 2222, we present the EQ scores and rankings of the States for Period A, both
for individual categories as well as for the composite index. It is observed that Kerala,
Karnataka and Maharashtra were the toppers during this period, while Uttar Pradesh,
Punjab and Haryana had been the laggards. Interestingly the topper Kerala, despite a good
performance in AIRPOL, GHGS, ENERGY, WATER and NPSP, fared among the laggards
in case of INDOOR, LAND and FOREST. Karnataka had good performance in case of
AIRPOL and GHGS, while maintaining moderate performance in other categories. The
third ranking of Maharashtra, an industrialised state, is justified by the fact that the State
performed appreciably in several categories like INDOOR, GHGS, LAND and NPSP,
however the performance with respect to ENERGY, WATER, FOREST and AIRPOL was
not that satisfactory. Looking at the other extreme, we can see that the overall rankings of
laggards like Haryana and Uttar Pradesh were influenced by their performance in sub-
categories like LAND, NPSP etc. It is observed that while some major States like Madhya
Pradesh (tenth) and West Bengal (ninth) placed in the lower segment, others like Gujarat
(sixth) and Andhra Pradesh (seventh) had performed moderately well. Interestingly, a
relatively poorer State, Orissa, obtained the fourth rank, owing to comparatively better
performance in case of AIRPOL, ENERGY and WATER.
Table Table Table Table 3333 provides the EQ scores and ranking of the States for Period B. As in the
earlier case, we see that Kerala, Karnataka and Maharashtra retained their positions at the
top (although the latter two interchange their positions), while Haryana, Bihar and Punjab
now turned out to be the laggards. It is observed that the toppers improved their position
in certain sub-categories (Kerala in AIRPOL, INDOOR, GHGS, FOREST; Karnataka in
ENERGY, FOREST etc.). However, their performance deteriorated in certain key areas as
well. For instance, the lower ranking of Karnataka in AIRPOL in Period B can be
explained by rapid urbanisation, industrialisation and vehicular pollution. Its relative
performance on WATER also raises concern. Among the states at the middle, Andhra
Pradesh’s performance in WATER is not satisfactory, and degradation in water bodies
within its territory has already been highlighted (Reddy and Char, 2004). On the other
hand the laggards continued to perform poorly in several sub-categories (e.g. - Punjab –

14
AIRPOL, GHGS, ENERGY, LAND, WATER and NPSP; Bihar - AIRPOL, INDOOR,
GHGS, LAND, FOREST and NPSP; Haryana – ENERGY, LAND, WATER and NPSP).
Energy management and forest conservation should be the first two priority areas for
environmental management in Maharashtra. For Karnataka, conservation of land and water
should be priority areas for environmental management.
Table Table Table Table 2222: Environmental Quality Scores and Ranks of the States: 1990: Environmental Quality Scores and Ranks of the States: 1990: Environmental Quality Scores and Ranks of the States: 1990: Environmental Quality Scores and Ranks of the States: 1990----1996199619961996
AIRPOL
(1) INDOOR
(2) GHGS (3)
ENERGY(4)
LAND (5)
WATER (6)
FOREST (7)
NPSP (8)
EQI SCORE (9)
Andhra Pradesh 0.876 (4) 0.320 (11) 0.685 (5) 0.524 (8) 0.592 (5) 0.535 (6) 0.506 (13) 0.489 (8) 0.544 (7)
Bihar 0.647 (8) 0.129 (14)(14)(14)(14) 0.467(11) 0.555 (7) 0.502(10) 0.604 (5) 0.515 (12) 0.467(11) 0.480 (11)
Gujarat 0.432 (12)0.643 (3) 0.617 (7) 0.282 (13) 0.616 (4) 0.482 (9) 0.594 (6) 0.630 (2) 0.545 (6)
Haryana 0.783 (6) 0.574 (4) 0.494 (9) 0.450 (12) 0.183(13) 0.381 (13)0.671 (2) 0.333(13) 0.475 (12)
Karnataka 0.912 (1)(1)(1)(1) 0.435 (5) 0.901 (1)(1)(1)(1) 0.673 (5) 0.535 (7) 0.516 (7) 0.573 (9) 0.541 (6) 0.607 (2)
Kerala 0.874 (5) 0.327 (10) 0.870 (3) 0.709 (3) 0.520 (8) 0.696 (3) 0.517 (11) 0.559 (5) 0.617 (1)(1)(1)(1)
Madhya Pradesh 0.483 (11)0.367 (8) 0.355(13) 0.468 (10) 0.719 (1)(1)(1)(1) 0.695 (4)(4)(4)(4) 0.158 (14)(14)(14)(14) 0.597 (4) 0.493 (10)
Maharashtra 0.653 (7) 0.715 (2) 0.697 (4) 0.473 (9) 0.652 (2) 0.514 (8) 0.581 (8) 0.599 (3) 0.605 (3)
Orissa 0.909 (2) 0.228 (12) 0.350(14)(14)(14)(14) 0.771 (1)(1)(1)(1) 0.543 (6) 0.760 (1) 0.584 (7) 0.516 (7) 0.578 (4)
Punjab 0.644 (9) 0.803 (1)(1)(1)(1) 0.427(12) 0.274 (14)(14)(14)(14) 0.181(14)(14)(14)(14) 0.244 (14)(14)(14)(14)0.840 (1)(1)(1)(1) 0.267(14)(14)(14)(14) 0.456 (13)
Rajasthan 0.631 (10)0.397 (7) 0.881 (2) 0.622 (6) 0.637 (3) 0.465 (10)0.520 (10) 0.642 (1)(1)(1)(1) 0.577 (5)
Tamil Nadu 0.896 (3) 0.412 (6) 0.656 (6) 0.458 (11) 0.513 (9) 0.381 (12)0.612 (4) 0.478(10) 0.525 (8)
Uttar Pradesh 0.152 (14)(14)(14)(14)0.222 (13) 0.600 (8) 0.682 (4) 0.363(12) 0.447 (11)0.620 (3) 0.478 (9) 0.443 (14)(14)(14)(14)
West Bengal 0.248 (13)0.357 (9) 0.473(10) 0.758 (2) 0.369(11) 0.699 (2) 0.611 (5) 0.442(12) 0.508 (9)
Note: Figure in the parenthesis shows the rank of the State for the corresponding Environmental Quality Score
Table Table Table Table 3333: Environmental Quality Scores and Ranks of the States: 1997: Environmental Quality Scores and Ranks of the States: 1997: Environmental Quality Scores and Ranks of the States: 1997: Environmental Quality Scores and Ranks of the States: 1997----2004200420042004
STATES AIRPOL (1)
INDOOR(2)
GHGS (3)
ENERGY(4)
LAND (5)
WATER (6)
FOREST (7)
NPSP (8)
EQI SCORE (9)
Andhra Pradesh 0.802 (3) 0.498 (7) 0.553 (5) 0.585 (5) 0.617 (3) 0.479 (9) 0.781 (9) 0.474 (9) 0.580 (6)
Bihar 0.433 (12) 0.141 (14)(14)(14)(14)0.428 (10) 0.574 (7) 0.436 (10) 0.675 (2) 0.480 (13) 0.422 (12) 0.455 (13)
Gujarat 0.310 (13) 0.718 (3) 0.547 (6) 0.231 (13) 0.653 (1)(1)(1)(1) 0.539 (8) 0.769 (10) 0.599 (4) 0.564 (7)
Haryana 0.715 (5) 0.714 (4) 0.542 (7) 0.362 (10) 0.088 (14)(14)(14)(14) 0.332 (13) 0.790 (7) 0.278 (14)(14)(14)(14) 0.472 (12)
Karnataka 0.684 (6) 0.610 (6) 0.885 (1)(1)(1)(1) 0.679 (3) 0.568 (7) 0.465 (11) 0.807 (5) 0.563 (6) 0.636 (3)
Kerala 0.791 (4) 0.467 (8) 0.882 (2) 0.644 (4) 0.534 (9) 0.541 (7) 0.942 (1)(1)(1)(1) 0.598 (5) 0.656 (1)(1)(1)(1)
Madhya Pradesh 0.510 (10) 0.453 (10)0.302 (14)(14)(14)(14) 0.349 (12) 0.647 (2) 0.689 (1)(1)(1)(1) 0.230 (14)(14)(14)(14) 0.627 (1)(1)(1)(1) 0.497 (10)
Maharashtra 0.676 (7) 0.771 (2) 0.682 (4) 0.428 (9) 0.578 (6) 0.606 (5) 0.731 (11) 0.615 (2) 0.641 (2)
Orissa 0.823 (2) 0.189 (13)0.381 (11) 0.745 (2) 0.612 (4) 0.673 (3) 0.864 (2) 0.527 (7) 0.593 (5)
Punjab 0.600 (9) 0.812 (1)(1)(1)(1) 0.349 (13) 0.211 (14)(14)(14)(14) 0.118 (13) 0.273 (14)(14)(14)(14) 0.789 (8) 0.279 (13) 0.434 (14)(14)(14)(14)
Rajasthan 0.670 (8) 0.459 (9) 0.807 (3) 0.564 (8) 0.603 (5) 0.470 (10) 0.804 (6) 0.614 (3) 0.606 (4)
Tamil Nadu 0.949 (1)(1)(1)(1) 0.624 (5) 0.376 (12) 0.361 (11) 0.567 (8) 0.356 (12) 0.842 (3) 0.483 (8) 0.555 (8)
Uttar Pradesh 0.471 (11) 0.305 (12)0.518 (8) 0.584 (6) 0.366 (11) 0.566 (6) 0.507 (12) 0.458 (10) 0.473 (11)
West Bengal 0.212 (14)(14)(14)(14) 0.417 (11)0.476 (9) 0.794 (1)(1)(1)(1) 0.347 (12) 0.610 (4) 0.825 (4) 0.422 (11) 0.522 (9)
Note: Figure in the parenthesis shows the rank of the State for the corresponding Environmental Quality Score

15
We can compare the relative performance of the States on EQ scale during the two
time periods looking at their ranks. It is observed that although the overall position of the
better performing States remained unchanged, there had been some interesting movements
of their ranking within the sub-categories. For instance, Maharashtra’s rank declined in
LAND and FOREST,12 while it improved its performance in WATER. Karnataka had been
subjected to greater variations - while its ranking improved in ENERGY and FOREST, but
declined for AIRPOL, INDOOR and WATER. Kerala on the other hand improved its
relative performance in a number of sub-categories (notably FOREST).13 Nonetheless, its
score got affected by the decline in its ranking in categories like WATER.14 Looking across
categories, it is observed that Punjab and Uttar Pradesh experienced a sharp decline in
their ranking in case of FOREST, indicating degradation on that front.
4.24.24.24.2 HDIHDIHDIHDI
Table Table Table Table 4444 provides the HDI scores and rankings of the States in the three sub-
categories and the composite index for two periods, Period A and Period B. It is observed
that while for the first period, Kerala, Punjab and Maharashtra were holding the top three
positions; in the second period, Haryana had replaced Maharashtra at the top three.
Looking at the sub-categories, it is observed that Kerala continued to perform well in all
categories. Punjab performed comfortably in terms of consumption and health, but was in
the mid-level on educational attainments. Looking at the other end of the distribution, we
observe that Bihar, UP and MP were consistently at the bottom for most of the categories,
which in turn leads to their poor overall HDI ranking.
12 Rithe and Fernandes (2002) argued that Maharashtra has achieved the current level of industrialisation
at the cost of the loss of much of its forests. However, the findings of Kadekodi and Venkatachalam
(2005) do not support this. 13 Apart from the Government regulations, exporter firms increasingly adopted environment-friendly
processes to comply with strict norms in export markets (e.g. - marine industries in Kochi), which had
a significant positive influence on the environment of the State. 14 Nair (2006) noted that depletion of the groundwater table due to indiscriminate sand mining, shrinkage
in natural forest cover and reclamation of wetland and paddy fields are major environmental challenges
that Kerala is facing today.

16
Table Table Table Table 4444:::: HDI Scores and Ranks of the States over theHDI Scores and Ranks of the States over theHDI Scores and Ranks of the States over theHDI Scores and Ranks of the States over the Sample Period Sample Period Sample Period Sample Period
ConsumptionConsumptionConsumptionConsumption HealthHealthHealthHealth EducationEducationEducationEducation HDI SCOREHDI SCOREHDI SCOREHDI SCORE Period A Period B Period A Period B Period A Period B Period A Period B StatesStatesStatesStates
(1) (2) (3) (4) (5) (6) (7) (8) Andhra Pradesh 0.338 (8) 0.196 (10) 0.300 (8) 0.410 (7) 0.136 (11) 0.344 (11) 0.258 (9) 0.317 (9) Bihar 0.000 (14)(14)(14)(14) 0.025 (13) 0.125 (11) 0.143 (11) 0.000 (14)(14)(14)(14) 0.000 (14)(14)(14)(14) 0.042 (14)(14)(14)(14) 0.056 (14)(14)(14)(14) Gujarat 0.575 (5) 0.636 (4) 0.275 (9) 0.374 (9) 0.484 (4) 0.531 (4) 0.445 (6) 0.514 (6) Haryana 0.610 (3) 0.792 (3) 0.499 (4) 0.614 (3) 0.366 (8) 0.497 (6) 0.492 (4) 0.635 (3) Karnataka 0.295 (9) 0.402 (8) 0.466 (5) 0.481 (5) 0.371 (7) 0.478 (8) 0.377 (8) 0.454 (7) Kerala 0.831 (2) 1.000 (1)(1)(1)(1) 1.000 (1)(1)(1)(1) 1.000 (1)(1)(1)(1) 1.000 (1)(1)(1)(1) 1.000 (1)(1)(1)(1) 0.944 (1)(1)(1)(1) 1.000 (1)(1)(1)(1) Madhya Pradesh 0.052 (12) 0.000 (14)(14)(14)(14) 0.000 (14(14(14(14)))) 0.000 (14)(14)(14)(14) 0.165 (10) 0.396 (9) 0.072 (12) 0.132 (13) Maharashtra 0.459 (7) 0.490 (6) 0.549 (3) 0.570 (4) 0.541 (2) 0.710 (2) 0.516 (3) 0.590 (4) Orissa 0.258 (11) 0.069 (11) 0.083 (12) 0.089 (13) 0.235 (9) 0.377 (10) 0.192 (10) 0.178 (11) Punjab 1.000 (1)(1)(1)(1) 0.907 (2) 0.765 (2) 0.837 (2) 0.414 (5) 0.505 (5) 0.726 (2) 0.750 (2) Rajasthan 0.294 (10) 0.307 (9) 0.241 (10) 0.312 (10) 0.038 (13) 0.317 (12) 0.191 (11) 0.312 (10) Tamil Nadu 0.489 (6) 0.583 (5) 0.366 (6) 0.454 (6) 0.517 (3) 0.658 (3) 0.457 (5) 0.565 (5) Uttar Pradesh 0.039 (13) 0.054 (12) 0.050 (13) 0.134 (12) 0.073 (12) 0.238 (13) 0.054 (13) 0.142 (12) West Bengal 0.583 (4) 0.441 (7) 0.358 (7) 0.383 (8) 0.378 (6) 0.486 (7) 0.440 (7) 0.437 (8)
Note: Figure in the parenthesis shows the rank of the State for the corresponding component wise score of HDI and HDI Score Comparison of the relative performance of the States on HDI during the two time
periods covered in our analysis shows interesting results. We observe that there had not
been major changes in the overall HDI Score of the States, and in all cases their ranks
changed by one unit only. Some changes in the relative positions of the States in terms of
consumption can be noted, reflecting their relative growth pattern, but in case of education
and health the relative positions of fifty percent of the States remained unchanged. We
observe that the aggregate picture do not always show the dynamics of different
components of HDI, e.g., for MP aggregate HDI Score had gone up from 0.072 to 0.132,
however its consumption score had gone down from 0.052 to 0.000. A declining trend in the
HDI is noticed for AP as well. For MP, since health status remained unchanged it is only
the improvement in education, which had driven its HDI score up. Movement in
consumption expenditure is interesting; it had gone down both for poor States like Orissa
(insignificant poverty reduction over NSSO 50th (1993-94) and 55th (1999-2000) round) and
moderate performers like West Bengal (9 percent poverty reduction over NSSO 50th and
55th round). One reason may perhaps be that the decline in income inequality (Gini ratio)
in these two States over 1993-94 to 1999-00 (Government of India, 2002) had been
marginal.
4.34.34.34.3 EQI and PCNSDPEQI and PCNSDPEQI and PCNSDPEQI and PCNSDP
Figure 1Figure 1Figure 1Figure 1 plots the EQI Scores and PCNSDP of the States during both Periods
(postscript 1 and 2 denote periods A and B respectively), which suggests a convex
relationship between the two. While the North-East corner of the Figure characterise States

17
with both high EQI and PCNSDP, States placed in South-West corner represents those
with worst performance on both counts. The States positioned in the North-West corner of
the figure on the other hand indicates the States performing appreciably in terms of EQI,
but not on PCNSDP. It is observed that Maharashtra retains its top position on both
counts during the two periods. Bihar during Period B get grouped with UP at the South-
West corner. Despite improvement in EQI Score, Orissa however remains at the bottom in
terms of PCNSDP (i.e., below the first quartile line). Punjab and Haryana stay in the
South-East corner of the Figure, implying their growth may have come at the cost of their
environmental degradation. Karnataka, Kerala, Andhra Pradesh and Rajasthan improved
their respective positions in both the fronts during Period B and are toppers among the
medium income States. West Bengal, Tamil Nadu and Gujarat, the laggards among
medium income States in terms of EQ, however improved their respective positions in both
the fronts during Period B.
Figure 1: PFigure 1: PFigure 1: PFigure 1: PCNSDP Vs. EQI Score CNSDP Vs. EQI Score CNSDP Vs. EQI Score CNSDP Vs. EQI Score ---- Period A and Period BPeriod A and Period BPeriod A and Period BPeriod A and Period B
4.44.44.44.4 EQI and HDI EQI and HDI EQI and HDI EQI and HDI
Figure 2Figure 2Figure 2Figure 2 plots the EQI and HDI Scores of the States for the Periods (postscript 1
and 2 denote periods A and B respectively). While the North-East corner of the Figure
characterise States with both high EQI and HDI scores, States placed in South-West corner
represents those with worst performance on both counts. The States positioned in the
North-West corner of the figure on the other hand indicates the States performing
appreciably in terms of EQI, but not on HDI scale. It is observed that while Kerala retains
PCNSDP Vs. EQ I Score
OR2
HR1
PB1
HR2
PB2
GJ 2
M H1
MH2
OR1
BH1
BH2
UP2
UP1
MP2
WB1
M P1
RJ1
WB2 TN1
TN2GJ1
KR2
KL2
AP2
RJ2
AP1
KL1
KR1
0.40
0.45
0.50
0.55
0.60
0.65
0.70
2 3 4 5 6 7 8 9 10 11 12 13 14 15 16
PCNSDP (in Rs.'000/person/year)
EQ
I S
core

18
its position in the North-East corner during both periods. Haryana, a top performer on HDI
front, despite a marginal improvement in EQ still remains a poor performer. Punjab,
another top performer in HDI, experienced a decline in EQI Score, primarily owing to
overexploitation of natural resources (Bhullar and Sidhu, 2006). Looking at the South-West
corner, it is seen that while the EQI Score had declined for Bihar, it had marginally
increased for MP and UP. Orissa on the other hand maintains its position in the North-
West corner during both periods. Though its performance marginally improved in EQ front,
it performed poorly on HD scale (placed below the first quartile). AP and Rajasthan had
improved their positions in both the fronts. As compared to Period A, the middle HD
category States improved their positions in EQI during Period B. Broadly, the relationship
between EQI Score and HDI Score is found to be slanting N-shaped owing to the divergence
in performance of States like Punjab, Haryana and Kerala.
Figure 2: HDI Score Vs. EQI Score Figure 2: HDI Score Vs. EQI Score Figure 2: HDI Score Vs. EQI Score Figure 2: HDI Score Vs. EQI Score – Period A and Period B Period A and Period B Period A and Period B Period A and Period B
4.64.64.64.6 Testing the Existence of the Environmental Kuznets Curve (EKC)Testing the Existence of the Environmental Kuznets Curve (EKC)Testing the Existence of the Environmental Kuznets Curve (EKC)Testing the Existence of the Environmental Kuznets Curve (EKC)
For testing the EKC hypothesis, multivariate OLS regression models are estimated
for individual environmental groups. Different variants of the models are estimated by
assuming a non-linearity between PCNSDP and EQ. Apart from PCNSDP (in Rs.
thousand at constant 1993-94 Prices); various other explanatory variables are introduced to
capture the dynamic aspects of EQ. TablesTablesTablesTables 5 5 5 5 present the regression results which show a
mixed picture: while non-linearity exist for a number of environmental groups like
ENERGY, GHGS, LAND, NPS; linear relationship is observed for other groups like
HD Score vs. EQ Score
MP2
UP2
BH2
UP1
BH1
MP1
AP2
RJ2
OR2
OR1
RJ1
AP1
WB2
WB1
TN1
KR1
KR2
MH1
MH2
GJ1
GJ2TN2
HR1 HR2
KL1
KL2
PB1
PB2
0.40
0.45
0.50
0.55
0.60
0.65
0.70
0.00 0.10 0.20 0.30 0.40 0.50 0.60 0.70 0.80 0.90 1.00 1.10
HDI Score
EQ
I S
co
re

19
INDOOR, WATER and FOREST (Appendix Appendix Appendix Appendix 3333 for graphical representation of the obtained
relationships between PCNSDP and various environmental groups). Similarly, with respect
to controlling variables, it is observed that share of primary sector in GSDP (PRISHARE)15
is negatively related to ENERGY, LAND, NPS and FOREST. This is because with the fall
in share of primary sector in GSDP; pressure on land, water and forest resources goes down
and EQ improves. With the rise in share of secondary sector in GSDP (SECSHARE),16
ENRGY score falls and the same for WATER increases and as the share of tertiary sector
improves, the scores of GHGs and WATER increase. The results imply that composition of
income of a State has substantial impacts on its environmental quality. Increased share of
workers in agriculture (AGRWRK) shows a mixed trend (positive for GHGS, INDOOR and
NPS etc. and negative for LAND and AIRPOL). Population density (POPD) and level of
urbanisation (URB) is generally showing a negative relationship with EQ.
4.7 4.7 4.7 4.7 Relationship between HDI Score and Individual Environmental GroupsRelationship between HDI Score and Individual Environmental GroupsRelationship between HDI Score and Individual Environmental GroupsRelationship between HDI Score and Individual Environmental Groups
For analysing the relationship between the HDI score and composite indicator of
individual environmental groups, we estimate different specifications of multivariate OLS
regression models by assuming the presence of non-linearity. In addition, apart from HDI
score, various other explanatory variables are introduced. From Tables 6Tables 6Tables 6Tables 6, summarising the
regression results for different variants of the models, it is observed that non-linearity exist
for all the eight environmental groups (Appendix 4Appendix 4Appendix 4Appendix 4 for graphical representation of the
obtained relationships between HDI score and various environmental groups). The results
show that investment in human development will have both direct and cumulative impacts
on the natural resources conservation. In addition, with respect to controlling variables, it is
observed that share of primary sector in GSDP (PRISHARE) is negatively related to most
of the environmental groups, but positively related to INDOOR. The exception can be
explained by the fact that the fall in PRISHARE leads to sophistication in domestic energy
use, thereby improving INDOOR. With the rise in share of secondary sector in GSDP
(SECSHARE), ENRGY and WATER score fall and the same for LAND and NPS increase.
As the share of tertiary sector improves, the scores of GHGs, LAND and NPS improve. The
findings indicate that composition of income of a State significantly influence its EQ. Like
15 Percentage share of Primary Sector in GSDP (at constant 1993-94 Prices), which includes Agriculture,
Forestry and Logging and Fishing. 16 Secondary sector includes Mining and Quarrying, Manufacturing and Construction.

20
the EKC result, increased share of workers in agriculture (AGRWRK) shows a mixed trend
(positive for FOREST, GHGS and INDOOR and negative for AIRPOL). Share of workers
in non-agriculture (NAGRWRK) is negatively related to AIRPOL. Population density
(POPD) generally shows a negative relationship with EQ (exception: ENERGY). The
relationship between level of urbanisation (URB) and EQ however shows a mixed trend
(positive for INDOOR, LAND and NPS and negative for ENERGY and FOREST).

18
Table 5: Table 5: Table 5: Table 5: Testing the ExisTesting the ExisTesting the ExisTesting the Existence of the Environmental Kuznets Curve (EKC)tence of the Environmental Kuznets Curve (EKC)tence of the Environmental Kuznets Curve (EKC)tence of the Environmental Kuznets Curve (EKC)
(Number of observations: 28) Dependent Variable ENERGY ENERGY GHGS GHGS INDOOR INDOOR LAND LAND
NPS NPS WATER WATER FOREST FOREST AIRPOL
Explanatory Variable Coeff. Coeff. Coeff. Coeff. Coeff. Coeff. Coeff. Coeff. Coeff. Coeff. Coeff. Coeff. Coeff. Coeff. Coeff.
Constant 0.2827 0.9792 * -0.7672 * -1.0282 * -0.1426 * 0.1144 * 1.5019 * 1.6652 * 0.9442 * 0.8553 * 0.2996 * 1.0884 * -0.0640 1.0679 * 1.5312 * (0.1782) (0.245) (0.2798) (0.2474) (0.0439) (0.0575) (0.105) (0.1515) (0.0991) (0.084) (0.1683) (0.0969) (0.214) (0.2948) (0.2477) PCNSDP 0.0794 * 0.0725 * 0.0440 * 0.0245 * -0.0389 * -0.0439 * -0.0172 * -0.0331 * -0.0353 * 0.0724 * 0.0715 * -0.0197 (0.0352) (0.0418) (0.0101) (0.0117) (0.0062) (0.0068) (0.0043) (0.0064) (0.0043) (0.017) (0.0205) (0.0118) PCNSDP2 -0.0059 * -0.0053 * 0.0102 * 0.0072 * 0.0010 * 0.0018 * -0.0009 * (0.0019) (0.002) (0.0024) (0.0033) (0.0006) (0.0007) (0.0002) PCNSDP3 -0.0006 * -0.0005 * (0.0002) (0.0002) PRISHARE -0.0087 * -0.0162 * -0.0143 * -0.0123 * -0.0118 * -0.0075 * -0.0116 * (0.0033) (0.0022) (0.002) (0.0013) (0.0014) (0.0022) (0.0054) SECSHARE -0.0136 * 0.0058 * (0.0055) (0.003) TERSHARE 0.0184 * 0.0183 * 0.0089 * 0.0132 * (0.0041) (0.0036) (0.0029) (0.0045) POPD 0.0002 * -0.0001 * -0.0003 * -0.0005 * -0.0007 * (0.0001) (0.00003) (0.0001) (0.0001) (0.0002) URB -0.0202 * -0.0265 * (0.0076) (0.0113) AGRWRK 0.0066 * 0.0103 * 0.0030 * -0.0038 * 0.0031 * 0.0031 * -0.0130 * (0.0034) (0.003) (0.0006) (0.002) (0.0014) (0.0014) (0.0036) NAGRWRK 0.0072 * (0.0037) Adj. RAdj. RAdj. RAdj. R2222 0.4950.4950.4950.495 0.5240.5240.5240.524 0.2640.2640.2640.264 0.3150.3150.3150.315 0.950.950.950.955555 0.9410.9410.9410.941 0.7490.7490.7490.749 0.7740.7740.7740.774 0.5910.5910.5910.591 0.5970.5970.5970.597 0.4900.4900.4900.490 0.5020.5020.5020.502 0.4250.4250.4250.425 0.3930.3930.3930.393 0.2730.2730.2730.273 F-Stat 9.823 8.431 3.427 3.478 192.002 145.550 27.799 24.053 13.979 14.338 9.649 14.583 7.646 6.820 4.378 D-W Stat 2.104 1.882 1.873 1.690 2.069 2.105 1.679 1.900 1.282 1.283 1.323 1.245 1.557 1.590 2.156 1st Turning Point (in Rs.’000)
6.729 6.840 11.333 9.600 -- -- -- -- -- -- -- -- -- -- --
Note: Figure in the parenthesis shows the White Heteroskedasticity-Consistent Standard Errors * - implies coefficient is significant at most at 0.10 level.

19
Table 6: Table 6: Table 6: Table 6: Relationship between HDI and Environmental QualityRelationship between HDI and Environmental QualityRelationship between HDI and Environmental QualityRelationship between HDI and Environmental Quality (Number of observations: 28)
Dependent Variable
AIR ENERGY ENERGY FOREST GHGS INDOOR INDOOR LAND LAND NPS NPS WATER WATER
Explanatory Variable Coeff. Coeff. Coeff. Coeff. Coeff. Coeff. Coeff. Coeff. Coeff. Coeff. Coeff. Coeff. Coeff.
Constant 1.4445 * 1.4238 * 0.1977 * 0.3321 * -1.0008 * -0.1518 -0.0311 -0.3019 1.2517 * -0.0512 0.7769 * 0.8395 * 1.0513 * (0.2587) (0.3788) (0.0919) (0.1214) (0.254) (0.1536) (0.122) (0.1865) (0.0836) (0.0959) (0.1097) (0.0807) (0.2165) HDI 4.2322 * 2.7629 * 3.2469 * 1.3688 3.0151 * (1.3751) (1.2293) (0.648) (0.69) (0.9611) HDI2 -7.2035 * -5.8169 * -8.8858 * -1.3020 * -6.1352 * 1.7530 * 2.2598 * -2.9027 * -2.2677 * -1.7022 * -1.8293 * -1.8201 * -1.5433 * (2.8178) (2.7605) (1.5277) (0.5882) (2.2971) (0.4173) (0.436) (0.7745) (0.3768) (0.2622) (0.3335) (0.3755) (0.5667) HDI3 5.0476 * 3.3176 5.8978 * 3.9813 * -1.5379 * -1.9498 * 2.7043 * 2.2011 * 1.685 * 1.7538 * 1.749 * 1.4337 * (1.8388) (1.751) (1.0053) (1.4975) (0.4299) (0.437) (0.755) (0.3627) (0.2704) (0.3223) (0.4138) (0.6239) PRISHARE -0.0127 * 0.0062 * -0.0147 * -0.0083 * -0.0053 * -0.0081 * (0.0049) (0.0025) (0.0022) (0.0018) (0.002) (0.0037) SECSHARE -0.0188 * 0.0139 * 0.014 * -0.0057 (0.0071) (0.0046) (0.0021) (0.0055) TERSHARE 0.0172 * 0.0114 * 0.0077 * (0.0045) (0.004) (0.002) POPD -0.0003 0.0003 * -0.0002 * -0.0001 -0.0003 * (0.0002) (0.0001) (0.0001) (0.0001) (0.0001) URB -0.0123 -0.0112 0.0127 * 0.0077 * 0.0072 0.0049 (0.0067) (0.0063) (0.0038) (0.0027) (0.0051) (0.0029) AGRWRK -0.0078 * 0.0097 0.0118 * 0.0039 * (0.0037) (0.0056) (0.0025) (0.0017) NAGRWRK -0.0330 * (0.0078) Adj. RAdj. RAdj. RAdj. R2222 0.5430.5430.5430.543 0.5460.5460.5460.546 0.4900.4900.4900.490 0.4290.4290.4290.429 0.4320.4320.4320.432 0.8380.8380.8380.838 0.8360.8360.8360.836 0.6270.6270.6270.627 0.7580.7580.7580.758 0.6600.6600.6600.660 0.6420.6420.6420.642 0.3740.3740.3740.374 0.3700.3700.3700.370 F-stat 6.337 6.400 7.496 6.073 5.102 28.832 28.505 10.085 22.178 14.106 13.117 6.377 4.972 D-W stat 2.209 1.301 1.751 1.906 1.449 1.550 1.683 1.640 2.228 2.077 1.847 1.878 1.877
Note: Figure in the parenthesis shows the White Heteroskedasticity-Consistent Standard Errors
* - implies coefficient is significant at most at 0.10 level.

20
5555 Policy ConclusionsPolicy ConclusionsPolicy ConclusionsPolicy Conclusions
A number of developing countries located in Asia, Africa and Latin America
witnessed economic stagnation or crisis during eighties, and had to undergo structural
adjustment in the subsequent period, either unilaterally or as part of policy package
offered by external development agencies. Given the focus on growth in the short run,
many developing countries created little room to accommodate environmental and natural
resource concerns in their economic policy. A similar picture emerges if one analyses the
cross-region scenario within a country as well. However, despite the attempts by various
studies to evaluate different environmental parameters, determination of a composite
overall environmental quality index is still lacking. The current study makes an attempt
to bridge that gap by constructing an index of EQ for India by using 63 environmental
indicators.
Based on inter- and intra-sectoral differences in economic activities, different States
in India in the post-1991 period have different levels of stress on their natural resources.
To understand the impacts of economic growth on environmental quality, the current
analysis first constructs the environmental quality index for the 14 major Indian States
and look for its possible relationship with economic growth. This paper also attempts to
capture the relationship between environmental sustainability and human well-being – as
measured by the Human Development Index. To capture the temporal aspects of
environmental quality and to understand the dynamics of economic liberalisation process,
the entire period of our study has been divided into two broad time periods – Period A
(1990-1996) and Period B (1997-2004).
It is observed that different States possess different strengths and weaknesses in
managing various aspects of EQ. For instance, while Maharashtra is in the second position
in terms of EQI during period B, and fares satisfactorily in terms of INDOOR and NPSP;
it’s performance on ENERGY and FOREST is not that satisfactory. On the other hand,
Punjab, the state at the bottom in terms of overall EQI and ENERGY and WATER, is
actually topper for INDOOR. It also shows that there are scopes for the States to learn
from each other about different aspects of environmental management. Therefore,
adoption of a ‘one-size-fits-all’ National Environmental Policy at the country-level might
have limited impact on the local environmental quality. In other words, individual States
should adopt environmental management practices based on their local (at the most

21
disaggregated level) environmental information. Furthermore, over time performance of an
individual State varies across the environmental criteria, which shows that environmental
management practices should take into account this dynamic nature of environment, and
review their environmental status or achievement regularly.
The analysis on the relationship between economic growth and EQ does not reveal
a very clear picture during the two time periods under consideration. For different States,
the impacts of economic restructuring process, as adopted by them during 1990s, have
affected the environmental quality differently. It is observed that while States like
Maharashtra has performed well on both counts, growth in northern States like Punjab
and Haryana has taken place mostly at the cost of EQ. On the other hand Orissa, despite
being a low-income State, performed well during both period A and B in terms of EQ.
The results indicate that laggards like Bihar and MP have also achieved their economic
growth at the cost of their EQ. On the other hand a few States like Karnataka and
Rajasthan have achieved economic growth and also maintained their environment well.
The obtained results again indicate that individual States should adopt special
environmental measures, based on their environmental impacts assessment of major
economic activities, to achieve sustainable economic growth.
The formal testing for the existence of Environmental Kuznets Curve (EKC)
through multivariate OLS regression models are estimated by assuming non-linearity in
the relationship between PCNSDP and the composite score of the defined environmental
sub-categories. It is observed that while for a few categories an inverted U-shaped
relationship exists between PCNSDP and individual indicator of environmental quality
(e.g. – GHGS, LAND, ENERGY, NPS),17 a linear relationship exist for other categories
(INDOOR, WATER, FOREST) and no relationship in case of AIRPOL. The absence of
the EKC in the Indian framework can be explained by the mixed performance of the
States across environmental groups – e.g., worse EQ for economically advanced Punjab
and better EQ for economically lagging Orissa.
Estimation of multivariate OLS regression models between individual EQ Scores
and HDI Score indicate presence of non-linear relationships (in most cases, slanting N-
17 However it goes against the popular EKC hypothesis, which shows inverted U-shaped relationship
between PCI and environmental degradation (pollution) instead of environmental quality.

22
shaped and parabolic in case of FOREST). The results originate from the concentration of
several States in low HDI-Low EQ category (Bihar, UP) and high EQ-mid HDI category
(AP, Rajasthan) on one hand, and presence of the outliers like Orissa (high EQ-Low HDI)
on one hand and Punjab and Haryana (high HDI-Low EQ) on the other. The result
indicates the need to re-examine the methodology for calculating the HD achievements of
the States. Perhaps, the HD ranking of States like Punjab and Haryana has been
influenced too heavily by their high per capita consumption expenditure. Broad-basing the
HD index by incorporating other social achievements might reveal interesting results.
Finally, a few limitations of the study are as follows. We have confined our analysis
only to 14 major Indian States, the constraint being the availability of various secondary
environmental information for both the time periods under consideration. Given the fact
that a number of Indian States are currently in the process of preparing their
environmental profile, one future area of research would be to extend the analysis to the
remaining States. The analysis can be further extended by dividing the post-1997 period
into more sub-groups, as permitted by availability of newer data points.
A few policy issues need to be highlighted here. First, the increment in HD
indicators and economic growth can effectively increase the demand for a better
environment, and therefore provide a demand side solution to the problem of
environmental sustainability. Second, in contrary to popular belief, industrial pollution is
not the source of all the problems. In Punjab and Haryana, it seems that the thrust on
agriculture is increasingly becoming a serious concern. Third, given the need to arrive at
local State-level solutions, there seems to be enough scope to involve local communities
with direct interest in certain initiatives (e.g. - JFM). Fourth, it is difficult to comment on
the choice of optimal level of income and its composition for a State, which would be in
line with the objective of sustainable development. For instance, we observe a high level
of EQ for a poor State like Orissa, which clearly is a result of unutilised resources. Fifth,
as has been observed, improved governance can play a key role (e.g. – Supreme Court
intervention) in ensuring sustainable development, and there is increasing need for
implementing that in environmentally vulnerable States. Finally, here we focus only on
the economic growth of the Indian States during the two periods (1990-96 and 1997-2004)
and look into its relationship with EQ. However, income inequality varies across Indian
States and it has often been observed that inequality has increased in the post-reform
period (Deaton and Dreze, 2002). An area of future research can be to analyse the
relationship between income inequality of the States, their EQ and HD achievements.

23
ReferencesReferencesReferencesReferences
Adriaanse, A. 1993, Environmental Policy Performance Indicators: A Study of the Development of Indicators for Environmental Policy in the Netherlands, SDU Publishers, The Hague.
Adriaanse, A., Bryant, D., Hammond, A.L., Rodeburg, E. and Woodward, R. 1995, Environmental Indicators: A Systematic Approach to Measuring and Reporting on Environmental Policy Performance in the Context of Sustainable Development, World Resources Institute, Washington D.C.
Agarwal, M. and Samanta, S. 2006, ‘Structural adjustment, governance, economic growth and social progress’, Journal of International Trade & Economic Development, Vol. 15, No. 3, pp. 387 – 401.
Andreoni, J. and Levinson, A. 2001, ‘The simple analytics of the Environmental Kuznets curve’, Journal of Public Economics, Vol. 80, No.1, pp. 269–286.
Antony, M. J. 2001, Landmark Judgements on Environmental Protection, Indian Social Institute, New Delhi.
Baldwin, R. 1995, ‘Does sustainability require growth?’ in The Economics of Sustainable Development, ed. I. Goldin and L.A. Winters, Cambridge University Press, Cambridge, UK.
Balooni, K. 2002, ‘Participatory Forest Management in India - An Analysis of Policy Trends amid Management Change’, Policy Trend Report 2002: 88-113, The Institute for Global Environmental Strategies (IGES), Japan.
Bhattacharya, H. and Innes, R. 2006, Is There a Nexus between Poverty and Environment in Rural India?, Available at http://cals.arizona.edu/AREC/pubs/ researchpapers/2006-05bhattacharyainnes.pdf
Bhullar, A.S. and Sidhu, R.S. 2006, ‘Integrated Land and Water Use: A Case Study of Punjab’, Economic and Political Weekly, 30 December, pp. 5353-5357.
Boyce, J.K. 2003, Inequality and Environmental Protection, Working Paper Series No. 52, Political Economy Research Institute, University of Massachusetts, Amherst, The Netherlands.
Brandon, Carter and Hommann, Kirsten 1995, ‘The Cost of Inaction: Valuing the Economy-Wide Cost of Environmental Degradation in India’, Modelling Global Sustainability, United Nations University, Tokyo.
Bruvoll, A. and Medin, H. 2003, ‘Factors behind the environmental Kuznets curve: A decomposition of the changes in air pollution’, Environmental and Resource Economics, Vol. 24, No. 1, pp.27–48.
Carson, R.T., Jeon, Y. and McCubbin, D.R. 1997, ‘The relationship between air pollution emissions and income: US data’, Environment and Development Economics, Vol. 2, No. 4, pp.433–450.
Chakraborty, P. and Singh, J. 2005, Leather Bound: A Comprehensive Guide for SMEs, The Energy and Resources Institute, New Delhi.

24
Chopra, K. and Gulati, S.C. 1997, ‘Environmental degradation and Population Movements: The Role of Property Rights’, Environmental and Resource Economics, Vol. 9, No. 4, pp. 383-408.
Convention on Biological Diversity (CBD) undated, Case study on Joint Forest Management (JFM) as an example of non-monetary positive incentive, Available at: www.biodiv.org/doc/case-studies/inc/cs-inc-india-forest-en.doc
Costantini, V. and Salvatore, M. 2006, Environment, Human Development and Economic Growth, The Fondazione Eni Enrico Mattei, Note di Lavoro Series, Available at: http://www.feem.it/NR/rdonlyres/CA11D877-29E3-462F-A591-7738FBD508F0/1891/ 3506.pdf
Dasgupta, P. 2001, Human Well-Being and the Natural Environment, Oxford University Press, New Delhi.
Dastidar, A. G. 2006, ‘Maharashtra ‘outsources’ toxic e-waste to Delhi’, Hindustan Times, 30 December.
Deaton, A. and Drèze, J. 2002, ‘Poverty and Inequality in India: A Re-Examination’, Economic and Political Weekly, Vol. 36, No. 37, pp. 3729-3748.
de Bruyn, S.M., van den Berg, J.C.J.M. and Opschoor, J.B. 1998, ‘Economic growth and emissions: reconsidering the empirical basis of Environmental Kuznets Curve’, Ecological Economics, Vol. 25, No. 2, pp.161–175.
Dietzenbacher, E. and Mukhopadhyay, K. 2007, ‘An Empirical Examination of the Pollution Haven Hypothesis for India: Towards a Green Leontief Paradox?’, Environment and Resource Economics, Vol. 36, No. 4, pp. 427-449.
Dinda, S. 2004, ‘Environmental Kuznets curve hypothesis: a survey’, Ecological Economics, Vol. 49, No. 4, pp. 431–455.
Divan, S. and Rosencranz, A. 2002, Environmental Law and Policy in India: Cases, Materials and Statutes, Second Edition, Oxford University Press, New Delhi.
Dutt, A.K. and Rao, J.M. 1996, ‘Growth, Distribution and the Environment: Sustainable Development in India’, World Development, Vol. 24, No. 2. pp. 287-305.
Ebert, U. and Welsch, H. 2004, ‘Meaningful environmental indices: a social choice approach’, Journal of Environmental Economics and Management, Vol. 47, No. 2, pp. 270–283.
Eskeland, G.S. and Harrison, A.E. 2003, ‘Moving to greener pastures? Multinationals and the pollution haven hypothesis’, Journal of Development Economics, Vol. 70, No. 1, pp. 1-23.
Esty, D.C., Levy, M.A., Srebotnjak, T., de Sherbinin, A., Kim, C.H. and Anderson, B. 2006, Pilot 2006 Environmental Performance Index, Yale Center for Environmental Law and Policy and Center for International Earth Science Information Network (CIESIN), Available at: http://www.yale.edu/ epi/2006EPI˙Report˙Full.pdf
Esty, D.C., Levy, M.A., Srebotnjak, T. and de Sherbinin, A. 2005, 2005 Environmental Sustainability Index: Benchmarking National Environmental Stewardship, Yale Center for Environmental Law & Policy, New Haven.
Esty, D.C. and Porter, M.E. 2001-02, Ranking National Environmental Regulation and Performance: A Leading Indicator of Future Competitiveness?, Chapter 2.1, pp. 78-100, Harvard Business School, Global Competitiveness Report, http://www.isc.hbs.edu/GCR˙20012002˙Environment.pdf

25
Gallagher, K.P 2004, Free Trade and the Environment: Mexico, NAFTA, and Beyond, Available at: http://ase.tufts.edu/gdae/Pubs/rp/NAFTAEnviroKGAmerProgSep04. pdf
Gamper-Rabindran, S. and Jha, S. 2004, Environmental Impact of India’s Trade Liberalization, Available at: http://unpan1.un.org/intradoc/groups/ public/documents/APCITY/ UNPAN024230.pdf
Ghosh, M. 2006, ‘Economic Growth and Human Development in Indian States’, Economic and Political Weekly, 29 July, pp. 3321-3329.
Government of India 2002, National Human Development Report 2001, Planning Commission, New Delhi.
Grossman, G.M. and Krueger, A.B. 1995, ‘Economic growth and the environment’, Quarterly Journal of Economics, Vol. 110, No. 2, pp.353–378.
Guha, A. and Chakraborty, D. 2003, ‘Relative Positions of Human Development Index Across Indian States: Some Exploratory Results’, Artha Beekshan, Vol. 11, No. 4, pp. 166-181.
Jalan, J., Somanathan, E. and Chaudhuri, S. 2003, Awareness and the Demand for Environmental Quality: Drinking Water in Urban India, Economics Discussion Paper No. 03-05, Indian Statistical Institute, New Delhi.
Jena, P.R., Sahu, N.C. and Rath, B. 2005, ‘Does Trade Liberalisation Create Pollution Haven? An Indian Experience’, International Conference on Environment and Development: Developing Countries Perspective, Jawaharlal Nehru University, New Delhi.
Jha, R. and Bhanu Murthy, K.V. 2001, ‘An Inverse Global Environmental Kuznets Curve’, Departmental Working Papers: 2001–2002, Division of Economics, RSPAS, Australian National University, Canberra, Australia.
Jha, V. (1999), Investment Liberalization and Environmental Protection: Conflicts and Compatibilities in the Case of India, Occasional Paper No. 1, Copenhagen Business School. Copenhagen, Denmark.
Jones, L., Fredricksen, L. and Wates, T. 2002, Environmental Indicators, 5th edn., The Fraser Institute, Available at: http://www.fraserinstitute.ca/shared/ readmore.asp?snav=pb&id=314.
Kadekodi, G. K. and Venkatachalam, L. 2006, Human Development, Environment and Poverty Nexus in India, Background Paper on Environment and Poverty, UNDP, New Delhi.
Kathuria, V. and Sterner, T. 2006, ’Monitoring and enforcement: Is two-tier regulation robust? - A case study of Ankleshwar, India’, Ecological Economics, Vol. 57, No. 3, pp. 477-493.
Maiti, S. and Agrawal, P.K. 2005, ‘Environmental Degradation in the Context of Growing Urbanization: A Focus on the Metropolitan Cities of India’, Journal of Human Ecology, Vol. 17, No. 4, pp. 277-287.
Melnick, D., McNeely, J., Navarro, Y.K., Schmidt-Traub, G. and Sears, R.R. 2005, Environment and human well-being: a practical strategy, UN Millennium Project, Task Force on Environmental Sustainability, Available at: http://www.unmillenniumproject.org/documents/Environment-complete-lowres.pdf
Mukherjee, S. and Chakraborty, D. 2007, ‘Environment, Human Development and Economic Growth of Indian States after Liberalisation’, Making Growth Inclusive with

26
Special Reference to Imbalance in Regional Development, Department of Economics, Jammu University, Jammu and Kashmir.
Mukherjee, S. and Kathuria, V. 2006, ‘Is Economic Growth Sustainable? Environmental Quality of Indian States After 1991’, International Journal of Sustainable Development, Vol. 9, No. 1, pp. 38-60.
NCERT (2002), 7th All India Educational Survey (AIES): All India School Education Survey (AISES), National Council of Educational Research and Training (NCERT), Ministry of Human Resource Development (MHRD), Government of India, New Delhi.
Nadkarni, M.V. 2000, ‘Poverty, environment, development: a many patterned nexus’, Economic and Political Weekly, Vol. 35, No. 14, pp. 1184–1190.
Nagar, A.L., and Basu, S.R. 2001, Weighing Socio-Economic Indicators of Human Development: A Latent Variable Approach, Working Paper, National Institute of Public Finance and Policy, New Delhi.
Nagdeve, D.A. 2007, Population Growth and Environmental Degradation in India, Available at: http://paa2007.princeton.edu/download.aspx?submissionId=7192
Nair, G.K. 2006, Water scarcity hits parts of south Kerala, The Hindu Business Line, 31 March, Available at: http://www.thehindubusinessline.com/2006/03/31/stories /2006033101981900.htm
Panayatou, T. 1993, Empirical Tests and Policy Analysis of Environmental Degradation at Different Stages of Economic Development, Working Paper No. WP238, Technology and Employment Programme, International Labour Office, Geneva.
Pezzey, J. 1989, Economic Analysis of Sustainable Growth and Sustainable Development, Environment Department Working Paper No 15, World Bank, Washington DC.
Ranis, G. 2004, Human Development and Economic Growth, Center Discussion Paper No. 887, Economic Growth Center, Yale University, Available at: http://www.econ.yale.edu/growth˙pdf/ cdp887.pdf
Reddy, M.S. and Char, N.V.V. 2004, Management of Lakes in India, Available at: http://www.worldlakes.org/uploads/Management˙of˙lakes˙in˙India˙10Mar04.pdf
Rithe, K. and Fernandes, A. 2002, Maharashtra’s tiger troubles, Available at: www.satpuda.org/maharashtratiger.doc
Rogers, P., Jalal, K.F., Lohani, B.N., Owens, G.M., Yu, C-C., Christia, M. and Dufournaud, J.B. 1997, Measuring Environmental Quality in Asia, Harvard University Press and ADB, London, UK.
Sagar, V. undated, ‘Inequality, Agricultural Sustainability and Environmental Degradation’, Available at: http://www.sussex.ac.uk/Units/PRU/ inequality˙agricultural˙sustain.pdf
Sankar, U. 2006, ‘Trade Liberalisation and Environmental Protection Responses of Leather Industry in Brazil, China and India’, Economic and Political Weekly, Vol. 41, No. 24, pp. 2470-2477.
Sankar, U. 1998, ‘Laws and Institutions relating to Environmental Protection in India’, Occasional Paper, Madras School of Economics, Chennai, Available at: http://www.mse.ac.in/pub/op˙sankar.pdf
Schjolden, A. 2000, Leather tanning in India: Environmental regulations and firms’ Compliance, F-I-L. Working Papers, No. 21, Available at: http://www.cicero.uio.no/media/1677.pdf

27
Selden, T.M. and Song, D.S. 1994, ‘Environmental quality and development: is there a Kuznets curve for air pollution emissions?’, Journal of Environmental Economics and Management, Vol. 27, No. 2, pp. 147–162.
Shafik, N. and Bandyopadhyay, S. 1992, Economic Growth and Environmental Quality: Time-Series and Cross-Country Evidence, World Bank Policy Research Working Paper No. 904, World Bank, Washington DC.
Sharma, D.C. 2005, ‘By Order of the Court: Environmental Cleanup in India’, Environmental Health Perspectives, Vol. 113, No. 6, pp. A394-A397.
Stern, D.I. 1998, ‘Progress on the Environmental Kuznets curve’, Environment and Development Economics, Vol. 3, No. 2, pp. 175–198.
Tewari, M. and Pilai, P. 2005, ‘Global standards and environmental compliance in India’s leather industry’, Oxford Development Studies, Vol. 33, No. 2, pp. 245-267.
UNDP 2007, Human Development Report 2007/2008 - Fighting climate change: Human solidarity in a divided world, UNDP, New York, USA.
UNDP, Human Development Report - various issues, UNDP, New York, USA. van Ginkel, H., Barrett, B., Court, J. and Velasquez, J. (eds.) 2001, Human Development
and the Environment: Challenges for the United Nations in the New Millennium, United Nations University Press, Tokyo, Japan.
Venkatachalam, L. 2005, ‘Damage Assessment and Compensation to Farmers: Lessons from Verdict of Loss of Ecology Authority in Tamil Nadu’, Economic and Political Weekly, Vol. 40, No. 15, pp. 1556-1560.
World Bank 2006, India: Strengthening Institutions for Sustainable Growth, Country Environmental Analysis for India, Washington D.C., Available at: http://siteresources.worldbank.org/INDIAEXTN/Resources/295583-1176163782791/complete.pdf
Zhou, P., Ang, B.W., Poh, K.L. (2006), ‘Comparing aggregating methods for constructing the composite environmental index: an objective measure’, Ecological Economics, Vol. 59, No. 3, pp. 305-311.

28
Appendix Appendix Appendix Appendix 1111: : : : Description of the Environmental GroupsDescription of the Environmental GroupsDescription of the Environmental GroupsDescription of the Environmental Groups and Data sources and Data sources and Data sources and Data sources
GroGroGroGroupsupsupsups DescriptionDescriptionDescriptionDescription Number Number Number Number
of of of of VariablesVariablesVariablesVariables
Data Sources*Data Sources*Data Sources*Data Sources*
AIRPOL Air Pollution 6 8
INDOOR Indoor Air Pollution Potential 9 2, 3, 13, 14
GHGS Green House Gases (GHGs) Emissions 6 12, 15, 16
ENERGY Pollution from Energy Generation and Consumption 6 2, 12, 14, 15
FOREST Depletion and Degradation of Forest Resources 8 3, 4, 6, 10, 12, 15
WATER Depletion and Degradation of Water Resources 12 1, 2, 3, 7, 9, 11
NPSP Nonpoint Source Water Pollution Potential 10 1, 5, 7, 13
LAND Pressure and Degradation of Land Resources 6 1, 3, 4, 7, 12
TotalTotalTotalTotal 63636363 Note: * - implies that details of the data sources are provided below 1 Centre for Monitoring Indian Economy, Mumbai: India’s Agriculture Sector –
Various Years 2 Centre for Monitoring Indian Economy, Mumbai: India’s Energy Sector – Various
Years 3 Centre for Science and Environment, New Delhi: State of India’s Environment: The
Citizens’ Fifth Report (Part II: Statistical Database) 4 Central Statistical Organisation, Ministry of Statistics and Programme
Implementation, Government of India (GoI), New Delhi: Compendium of Environmental Statistics – 2000 and 2002
5 Department of Animal Husbandry, Dairying and Fisheries, Ministry of Agriculture, GoI, New Delhi: Livestock Census Data – 1992, 1997 and 2003
6 Forest Survey of India, Ministry of Environment and Forest, GoI, Dehradun: State of Forest Reports – 1997, 1999 and 2001
7 Ministry of Agriculture, GoI, New Delhi: Annual Report – Various Years 8 Central Pollution Control Board, Ministry of Environment and Forests, GoI, New
Delhi: National Ambient Air Quality Monitoring Programme Database – Various Years
9 Central Pollution Control Board, Ministry of Environment and Forests, GoI, New Delhi: National Rivers Water Quality Monitoring Programme Database – Various Years
10 Ministry of Environment and Forests, GoI, New Delhi: The State of Environment – India: 1999 and 2001
11 Ministry of Water Resources, GoI, New Delhi: Annual Report – Various Years 12 Office of the Registrar General, Director of Census Operation, Ministry of Home
Affairs, GoI, New Delhi: Census of India 2001 – CensusInfo India 2001 (Version 1.0) – Database Software
13 Office of the Registrar General, Director of Census Operation, Ministry of Home

29
Affairs, GoI, New Delhi: Census of India 2001 – Tables on Houses, Amenities and Assets (Database Software)
14 The Energy and Resources Institute, New Delhi (TERI): TERI Energy Data Directory and Yearbook (TEDDY) – Various Years (Database Software)
15 Economic and Political Weekly Research Foundation (EPWRF), Mumbai: Domestic Product of State of India: 1960–1961 to 2000–2001, Database Software, 2003.
16 Garg, A. and P.R. Shukla (2002), “Emission Inventory of India”, Tata McGraw-Hill Publishing Company Limited, New Delhi.

30
Appendix Appendix Appendix Appendix 2222: Descriptions of Environmen: Descriptions of Environmen: Descriptions of Environmen: Descriptions of Environmental Groups (Variables) & Indicatorstal Groups (Variables) & Indicatorstal Groups (Variables) & Indicatorstal Groups (Variables) & Indicators
AIR POLLUTION (12 indicators)AIR POLLUTION (12 indicators)AIR POLLUTION (12 indicators)AIR POLLUTION (12 indicators) � Maximum Concentration of NO2, SO2 and SPM in Residential and Industrial Area
(`g/m3): 1990-1995 and 1996-2000 * INDOOR AIR POLLUTION POTENTIAL (18 indicators) INDOOR AIR POLLUTION POTENTIAL (18 indicators) INDOOR AIR POLLUTION POTENTIAL (18 indicators) INDOOR AIR POLLUTION POTENTIAL (18 indicators) � Monthly Per-Capita Expenditure (MPCE) on Fuel & Lighting (Rs./month/head)
Rural and Urban Areas: 1993-94 and 1999-2000 $ � Percentage of Rural Households using Bio-fuels (Firewoods and chips, Dung cake) as
primary source of energy (Traditional & Commercial) for cooking (%): 1993-1994 and 1999-2000 *
� Percentage of Urban Households using Bio-fuels (Firewoods and chips) as primary source of energy (Traditional) for cooking (%): 1993-1994 and 1999-2000 *
� Percentage of Rural and Urban Households Do Not Have Access to Electricity: 1991 and 2001 *
� Achievement in Installation of Biogas Plants: Upto 1994-95 and Upto 2001-2002 $ � Kerosene as a Primary Source of Energy for Lighting for Rural and Urban Households
(%): 1993-94 and 1999-2000 * GREEN HOUSE GASES EMISSIONS (12 indicators)GREEN HOUSE GASES EMISSIONS (12 indicators)GREEN HOUSE GASES EMISSIONS (12 indicators)GREEN HOUSE GASES EMISSIONS (12 indicators) � CO2 Equivalent GHGs (CO2, CH4, N2O) Emissions (Kg. /Person): 1990 and 1995 * � CO2 Equivalent GHGs (CO2, CH4, N2O) Emissions (Tons/Rs. Lakh of GSDP at
Constant 1980-81 Prices): 1990 and 1995 * � CO2 Equivalent GHGs (CO2, CH4, N2O) Emissions (Tons/hectare of Reporting Area
of Land Utilisation): 1990 and 1995 * � Other GHGs (NOx, SO2) Emissions (Kg. /Person): 1990 and 1995 * � Other GHGs (NOx, SO2) Emissions (Tons/Rs. Lakh of GSDP at Constant 1980-81
Prices): 1990 and 1995 * � Other GHGs (NOx, SO2) Emissions (Tons/hectare of Reporting Area of Land
Utilisation): 1990 and 1995 * POLLUTION FROM ENERGY GENERATION AND CONSUMPTION (12 indicators)POLLUTION FROM ENERGY GENERATION AND CONSUMPTION (12 indicators)POLLUTION FROM ENERGY GENERATION AND CONSUMPTION (12 indicators)POLLUTION FROM ENERGY GENERATION AND CONSUMPTION (12 indicators) � Annual Percentage Increase in Motor Vehicles Number (given geographical area)
during 1991-92 to 1995-96 and during 1995-96 to 2000-2001 * � Average Per Capita Consumption of LPG, MG, Kerosene, HSD & LDO (in Kg. per
person): 1993-94 to 1996-97 and 1997-98 to 2000-2001 * � Average Petroleum Consumption (in tonnes) Per Rs. Lakh of GSDP (at constant
1993-94 Prices): 1993-94 to 1996-97 and 1997-98 to 2000-2001 * � Average Thermal Electricity Generation as a Percentage of Total Electricity
Generation (%): 1990-91 to 1995-96 and 1996-97 to 1999-2000 * � Average Electricity Consumption (in KwH) per Rs. Lakh of GSDP at Constant (1993-
94) Prices: 1993-94 to 1995-96 and 1996-97 to 1999-2001 * � Average Per Capita Consumption of Electricity (in KwH/Person): 1990-91 to 1995-96
and 1996-97 to 1999-2000 * DEPLETION AND DEGRADATION OF FOREST RESOURCES (16 indicators)DEPLETION AND DEGRADATION OF FOREST RESOURCES (16 indicators)DEPLETION AND DEGRADATION OF FOREST RESOURCES (16 indicators)DEPLETION AND DEGRADATION OF FOREST RESOURCES (16 indicators) � Change in Forest Cover (Dense and Open Forest) as Percentage of Geographical Area
(in percentage points): 1995 to 1997 and 1999-2001 $ � Change in Per Capita Forest Cover (Dense Forest, Open Forest, Mangrove, Scrub) (in

31
Hectare): 1995 to 1997 and 1999 to 2001 $ � Change in Recorded Forest Area as a Percentage of Total Geographical Area: 1997 to
1999 and 1999 to 2001 $ � Change in Common Property Forest Area@ as Percentage of Total Recorded Forest
Area: 1997 to 1999 and 1999 to 2001 $ � Change in Common Property Forest Area@ as a Percentage of Geographical Area:
1997 to 1999 and 1999 to 2001 $ � Change in Per Capita Availability of Recorded Forest Area (Person/ha): 1997 to 1999
and 1999 to 2001$ � Change in Per Capita Availability of Common Property Forest Area (in Person/ha):
1997 to 1999 and 1999 to 2001$ � Change in Protected Area (National Park & Sanctuary) as a Percentage of Total
Geographical Area: 1997 to 1999 and 1999 to 2001 $ Note: @ - Common Property Forest Area = Protected + Unclassed Forest Area DEPLETION AND DEGRADATION OF WATER DEPLETION AND DEGRADATION OF WATER DEPLETION AND DEGRADATION OF WATER DEPLETION AND DEGRADATION OF WATER RESOURCES (24 indicators)RESOURCES (24 indicators)RESOURCES (24 indicators)RESOURCES (24 indicators) � Level of groundwater development (%): 1996 and 2004 * � Percentage of Irrigated Area Irrigated by Surface Water Sources (Canals & Tanks):
1992-93 and 1998-99 $ � Inland Surface Water Resources (% of geographical area): 1995 and 2001 $ � Major & Medium Irrigation Potential Created (Developed) upto the end of the 8th
Plan (1992-1997) as a Percentage of Ultimate Irrigation Potential of the State * � Major & Medium Irrigation Potential Utilised as a Percentage of Irrigation Potential
Created Upto March 1997 * � Minor Irrigation Potential Created (Developed) upto the end of the 8th Plan (1992-
1997) as a Percentage of Ultimate Irrigation Potential of the State * � Minor Irrigation Potential Utilised as a Percentage of Irrigation Potential Created
Upto March 1997 * � Major & Medium Irrigation Potential Created (Developed) upto the end of the 9th
Plan (1997-2002) as a Percentage of Ultimate Irrigation Potential of the State * � Major & Medium Irrigation Potential Utilised as a Percentage of Irrigation Potential
Created Upto March 2002 * � Minor Irrigation Potential Created (Developed) upto the end of the 9th Plan (1997-
2002) as a Percentage of Ultimate Irrigation Potential of the State * � Minor Irrigation Potential Utilised as a Percentage of Irrigation Potential Created
Upto March 2002 * � Average Gross Irrigated as a Percentage of Total Cropped Area (%): 1992-93 to 1995-
96 and 1996-97 to 1999-2000 * � Average Area Irrigated more than Once as a Percentage of Gross Irrigated Area (%):
1992-93 to 1995-96 and 1996-97 to 1999-2000 * � Average Agricultural Consumption of Electricity (in KwH) Per Rs. Lakh of
Agricultural GSDP at Constant (1993-94) Prices: 1993-94 to 1995-96 and 1996-97 to 1999-2001 *
� Number of Energised Pumpsets Per Hectare of Gross Irrigated Area (No./ha): 1995-96 and 1999-2000 *
� Change in Number of Energised Pumpsets Per Hectare of Gross Irrigated Area (No./ha)/: 1992-93 to 1995-96 and 1995-96 to 1999-2000 *
NONNONNONNON----POINT SOURCE WATER POLLUTION POTENTIAL (20 indicators)POINT SOURCE WATER POLLUTION POTENTIAL (20 indicators)POINT SOURCE WATER POLLUTION POTENTIAL (20 indicators)POINT SOURCE WATER POLLUTION POTENTIAL (20 indicators) � Population Density (Person Per Km2 of Geographical Area): 1991 and 2001*

32
� Percentage of Rural and Urban Households Without Latrine: 1993 and 1998 * � Average Fertilisers Consumption (Kg./hectare): 1992-93 to 1995-96 and 1996-97 to
2000-01 * � Average Annual Rainfall (in mm): 1990-95 and 1996-2000 $ � Pesticides Consumption: (Kg./hectare) 1995-96 and 1999-2000 * � Area under Pulses as a Percentage of Gross Cropped Area: 1990-91 and 2000-2001 $ � Livestock Per Head of Person (No. in Cattle unit Per Person): 1992 and 1997 * � Poultry Birds Per Head of Person (No. Per Person): 1992 and 1997 * � Average Total Cropped Area as a Percentage of Reporting Area of Land Utilisation
(%): 1992-93 to 1995-96 and 1996-97 to 1999-2000 * PRESSURE AND DEGRADATION OF LAND RESOURCES (12 indicators)PRESSURE AND DEGRADATION OF LAND RESOURCES (12 indicators)PRESSURE AND DEGRADATION OF LAND RESOURCES (12 indicators)PRESSURE AND DEGRADATION OF LAND RESOURCES (12 indicators) � Average Forest Area as a Percentage of Reporting Area of Land Utilisation (%): 1992-
93 to 1995-96 and 1996-97 to 1999-2000 $ � Average Non-Forest Common Property Land as a Percentage of Reporting Area of
Land Utilisation (%): 1992-93 to 1995-96 and 1996-97 to 1999-2000 $ � Average Non-Forest Common Property Land Per Capita (in ha/person): 1992-93 to
1995-96 and 1996-97 to 1999-2000 $ � Average Area Sown more than Once as a Percentage of Total Cropped Area (%):
1992-93 to 1995-96 and 1996-97 to 1999-2000 * � Average Gross Irrigated as a Percentage of Total Cropped Area (%): 1992-93 to 1995-
96 and 1996-97 to 1999-2000 * � Land Degradation as a Percentage of Geographical Area: 1994 and 2001 * NoteNoteNoteNote: * - implies that for the environmental indicator we have used (Maximum – Actual) / (Maximum – Minimum) for standardisation. $ - implies that for the environmental indicator we have used (Actual – Minimum) / (Maximum – Minimum) for standardisation.

33
Appendix Appendix Appendix Appendix 3333: Graphical Relationship between PCNSDP and Various Compon: Graphical Relationship between PCNSDP and Various Compon: Graphical Relationship between PCNSDP and Various Compon: Graphical Relationship between PCNSDP and Various Components of ents of ents of ents of Environmental Quality Scores Environmental Quality Scores Environmental Quality Scores Environmental Quality Scores
PCNSDP Vs. GHGS
0.2
0.3
0.4
0.5
0.6
0.7
0.8
0.9
1
1 6 11 16PCNSDP
GH
GS
PCNSDP Vs. LAND
0
0.1
0.2
0.3
0.4
0.5
0.6
0.7
0.8
1 6 11 16PCNSDP
LA
ND
PCNSDP Vs. WATER
0.2
0.3
0.4
0.5
0.6
0.7
0.8
2.5 7.5 12.5 17.5
PCNSDP
WA
TE
R
PCNSDP Vs. INDOOR
0.1
0.2
0.3
0.4
0.5
0.6
0.7
0.8
0.9
2.5 4.5 6.5 8.5 10.5 12.5 14.5 16.5
PCNSDP
IN
DO
OR
PCNSDP Vs. FOREST
0.1
0.2
0.3
0.4
0.5
0.6
0.7
0.8
0.9
1
2 7 12 17PCNSDP
WA
TE
R
PCNSDP Vs. AIRPOL
0.1
0.2
0.3
0.4
0.5
0.6
0.7
0.8
0.9
1
1 6 11 16PCNSDP
AIR
PCNSDP Vs. ENERGY
0.1
0.2
0.3
0.4
0.5
0.6
0.7
0.8
0.9
1 6 11 16PCNSDP
EN
ER
GY
PCNSDP Vs. NPS
0.2
0.3
0.4
0.5
0.6
0.7
1 6 11 16PCNSDP
NP
S
FO
RE
ST

34
Appendix Appendix Appendix Appendix 4444: Graphical Relationship between HDI Score and Various Components of : Graphical Relationship between HDI Score and Various Components of : Graphical Relationship between HDI Score and Various Components of : Graphical Relationship between HDI Score and Various Components of
Environmental Quality Scores Environmental Quality Scores Environmental Quality Scores Environmental Quality Scores
HDI Score Vs. AIRPOL
0.00
0.20
0.40
0.60
0.80
1.00
0.00 0.20 0.40 0.60 0.80 1.00 1.20
HDI Score
AIR
PO
L
HDI Score Vs. INDOOR
0.00
0.10
0.20
0.30
0.40
0.50
0.60
0.70
0.80
0.90
0.00 0.20 0.40 0.60 0.80 1.00 1.20
HDI Score
IN
DO
OR
HDI Score Vs. GHGS
0.20
0.30
0.40
0.50
0.60
0.70
0.80
0.90
1.00
0.00 0.20 0.40 0.60 0.80 1.00 1.20
HDI Score
GH
GS
HDI Score Vs. ENERGY
0.15
0.25
0.35
0.45
0.55
0.65
0.75
0.85
0.00 0.20 0.40 0.60 0.80 1.00 1.20
HDI Score
EN
ER
GY
HDI Score Vs. LAND
0.00
0.10
0.20
0.30
0.40
0.50
0.60
0.70
0.80
0.00 0.20 0.40 0.60 0.80 1.00 1.20
HDI Score
LA
ND
HDI Score Vs. WAT ER
0.20
0.30
0.40
0.50
0.60
0.70
0.80
0.00 0.20 0.40 0.60 0.80 1.00 1.20
HDI Score
WA
TE
R
HDI Score Vs. FOREST
0.00
0.20
0.40
0.60
0.80
1.00
0.00 0.20 0.40 0.60 0.80 1.00 1.20
HDI Score
FO
RE
ST
HDI Score Vs. NPS
0.20
0.30
0.40
0.50
0.60
0.70
0.00 0.20 0.40 0.60 0.80 1.00 1.20
HDI Score
NP
S