Embed Size (px)
Citation preview
RSC Advances
PAPER
Ope
n A
cces
s A
rtic
le. P
ublis
hed
on 3
0 A
ugus
t 201
9. D
ownl
oade
d on
10/
30/2
021
8:38
:05
AM
. T
his
artic
le is
lice
nsed
und
er a
Cre
ativ
e C
omm
ons
Attr
ibut
ion-
Non
Com
mer
cial
3.0
Unp
orte
d L
icen
ce.
View Article OnlineView Journal | View Issue
Multistage kineti
aSchool of Energy and Mechanical Engine
Technology, Nanchang, 330013, P. R. ChinabSchool of Metallurgy and Environment, Cen
P. R. ChinacCollege of Metallurgical Engineering, Hun
412008, P. R. China
Cite this: RSC Adv., 2019, 9, 27305
Received 14th June 2019Accepted 20th August 2019
DOI: 10.1039/c9ra04489b
rsc.li/rsc-advances
This journal is © The Royal Society of C
c analysis of DMAA/MBAM polymerremoval from gelcast ceramic parts using a multi-stage parallel reaction model and model-freemethod
Jing Li, ab Jindi Huang *a and Ruiming Yinc
This work aims to develop an effective method for investigating the multistage debinding kinetics and
reaction mechanisms of removing N,N-dimethylacrylamide/N,N0-methylenebisacrylamide (DMAA/MBAM)
polymer from gelcast ceramic parts. Thermogravimetry (TG) and pyrolysis-gas chromatography/mass
spectrometry (Py-GC/MS) experiments were performed to investigate the thermal degradation
characteristics and the main compounds produced during the pyrolysis of DMAA/MBAM polymer within
green components. A multi-stage parallel reaction model (M-PRM) was proposed to separate the
overlapping peaks in the da/dT curves. The kinetic parameters (activation energy E and pre-exponential
factor k0) of each substage were calculated using model-free methods (Flynn–Wall–Ozawa, Starink,
Friedman and Kissinger–Akahira–Sunose) and an activation energy variable model. In addition, the most
appropriate kinetic mechanism function f(a) of each substage was analyzed and discussed via Malek's
procedure and the Sestak–Berggren (SB) model. The results showed that the DMAA/MBAM polymer
burnout in green components can be divided into three substages through a three-stage parallel
reaction model (3-PRM). The values of E (Friedman method) for substages 1 to 3 were E(a) ¼ 139.862 �110.481a + 156.161a2 � 88.714a3 kJ mol�1, E(a) ¼ 160.791 + 152.496a � 236.906a2 +
163.724a3 kJ mol�1 and E(a) ¼ 72.132 + 452.830a � 669.039a2 + 507.015a3 kJ mol�1, respectively. The
average values of E showed an increasing tendency from substages 1 to 3, and a kinetic compensation
effect was also observed between the E and k0 in each substage. The kinetic mechanism analysis
revealed that the reaction mechanisms for substages 1 to 3 were f(a) ¼ (1 � a)0.668a3.049(�ln(1 �a))�3.874, f(a) ¼ (1 � a)0.700a3.177(�ln(1 � a))�3.962 and f(a) ¼ (1 � a)1.049a�0.161(�ln(1 � a))0.518,
respectively. It is expected that the research results can be extended to investigate the multiplex
debinding of binders or polymers for various colloidal molding techniques.
1 Introduction
Gelcasting is an emerging colloidal molding technology fornear-net shaping of ceramic parts.1–3 This technique inge-niously utilizes the in situ polymerization of the gel system toform a three-dimensional network to enwrap and immobilizeceramic particles, allowing them to keep the desired shape ofgreen bodies.4 The gelcasting processing mainly consists of foursteps: preparation of ceramic slurries with low viscosity andhigh solids content, injection of slurries into the mold,demolding and drying, and debinding and sintering. Thedevelopment of a reasonable debinding process, which is
ering, Jiangxi University of Science and
. E-mail: [email protected]
tral South University, Changsha, 410083,
an University of Technology, Zhuzhou,
hemistry 2019
a critical step in the gelcasting process, is essential for obtainingcompact and defect-free sintered bodies.5,6 At present, the mainmethods for removing polymer or binder are classied into fourcategories: catalytic debinding,7 solvent debinding,8,9 thermaldebinding10,11 and wicking debinding.12 For gelcasting, theorganic polymer formed by the polymerization of the monomeris insoluble in the solvent and does not melt; thus, it cannot beremoved by processes such as wicking debinding and solventdebinding. The related reports mainly use the thermaldebinding technique.13–15
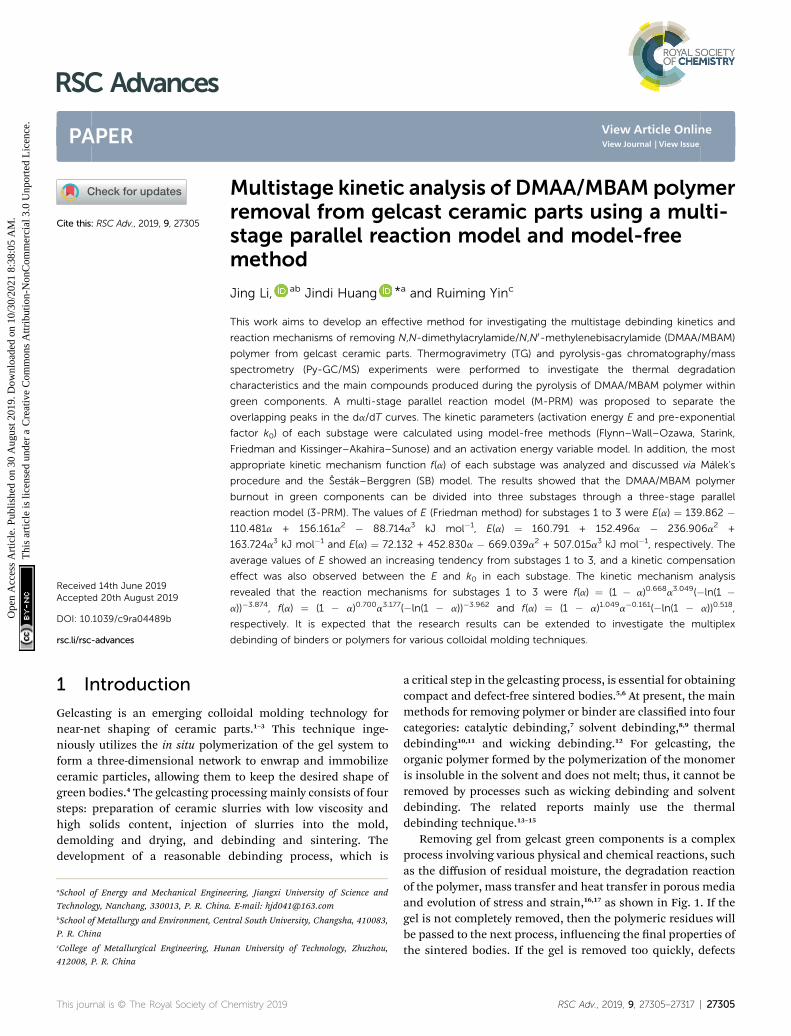
Removing gel from gelcast green components is a complexprocess involving various physical and chemical reactions, suchas the diffusion of residual moisture, the degradation reactionof the polymer, mass transfer and heat transfer in porous mediaand evolution of stress and strain,16,17 as shown in Fig. 1. If thegel is not completely removed, then the polymeric residues willbe passed to the next process, inuencing the nal properties ofthe sintered bodies. If the gel is removed too quickly, defects
RSC Adv., 2019, 9, 27305–27317 | 27305
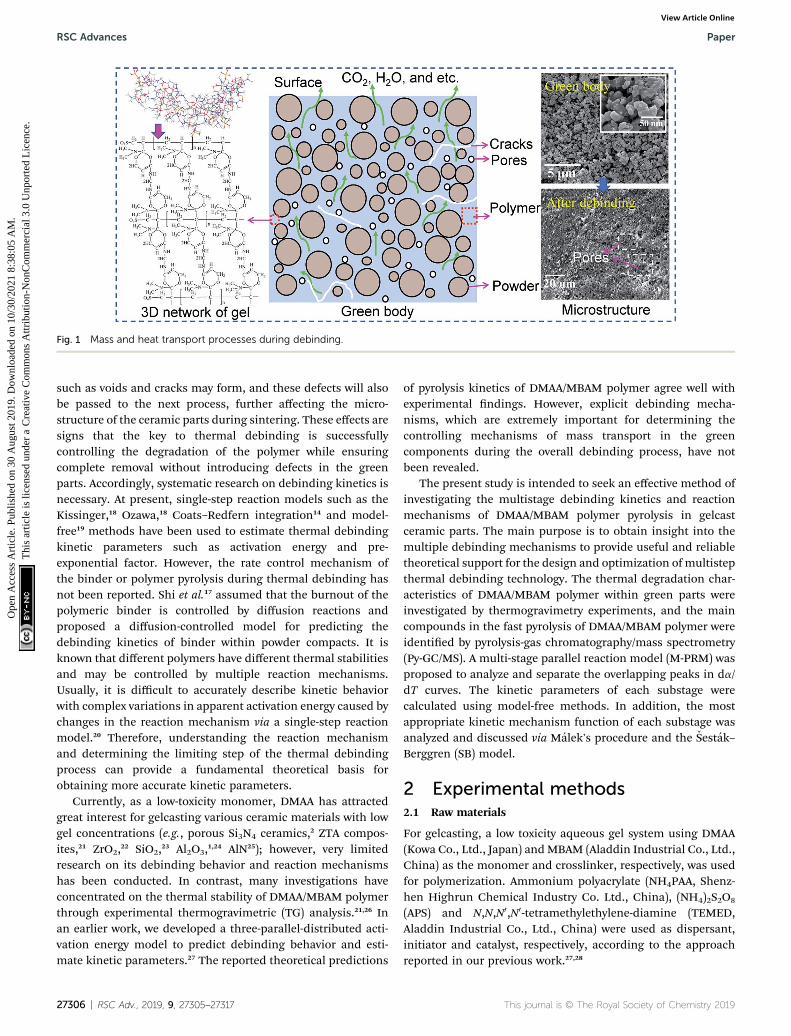
Fig. 1 Mass and heat transport processes during debinding.
RSC Advances Paper
Ope
n A
cces
s A
rtic
le. P
ublis
hed
on 3
0 A
ugus
t 201
9. D
ownl
oade
d on
10/
30/2
021
8:38
:05
AM
. T
his
artic
le is
lice
nsed
und
er a
Cre
ativ
e C
omm
ons
Attr
ibut
ion-
Non
Com
mer
cial
3.0
Unp
orte
d L
icen
ce.
View Article Online
such as voids and cracks may form, and these defects will alsobe passed to the next process, further affecting the micro-structure of the ceramic parts during sintering. These effects aresigns that the key to thermal debinding is successfullycontrolling the degradation of the polymer while ensuringcomplete removal without introducing defects in the greenparts. Accordingly, systematic research on debinding kinetics isnecessary. At present, single-step reaction models such as theKissinger,18 Ozawa,18 Coats–Redfern integration14 and model-free19 methods have been used to estimate thermal debindingkinetic parameters such as activation energy and pre-exponential factor. However, the rate control mechanism ofthe binder or polymer pyrolysis during thermal debinding hasnot been reported. Shi et al.17 assumed that the burnout of thepolymeric binder is controlled by diffusion reactions andproposed a diffusion-controlled model for predicting thedebinding kinetics of binder within powder compacts. It isknown that different polymers have different thermal stabilitiesand may be controlled by multiple reaction mechanisms.Usually, it is difficult to accurately describe kinetic behaviorwith complex variations in apparent activation energy caused bychanges in the reaction mechanism via a single-step reactionmodel.20 Therefore, understanding the reaction mechanismand determining the limiting step of the thermal debindingprocess can provide a fundamental theoretical basis forobtaining more accurate kinetic parameters.
Currently, as a low-toxicity monomer, DMAA has attractedgreat interest for gelcasting various ceramic materials with lowgel concentrations (e.g., porous Si3N4 ceramics,2 ZTA compos-ites,21 ZrO2,22 SiO2,23 Al2O3,1,24 AlN25); however, very limitedresearch on its debinding behavior and reaction mechanismshas been conducted. In contrast, many investigations haveconcentrated on the thermal stability of DMAA/MBAM polymerthrough experimental thermogravimetric (TG) analysis.21,26 Inan earlier work, we developed a three-parallel-distributed acti-vation energy model to predict debinding behavior and esti-mate kinetic parameters.27 The reported theoretical predictions
27306 | RSC Adv., 2019, 9, 27305–27317
of pyrolysis kinetics of DMAA/MBAM polymer agree well withexperimental ndings. However, explicit debinding mecha-nisms, which are extremely important for determining thecontrolling mechanisms of mass transport in the greencomponents during the overall debinding process, have notbeen revealed.
The present study is intended to seek an effective method ofinvestigating the multistage debinding kinetics and reactionmechanisms of DMAA/MBAM polymer pyrolysis in gelcastceramic parts. The main purpose is to obtain insight into themultiple debinding mechanisms to provide useful and reliabletheoretical support for the design and optimization of multistepthermal debinding technology. The thermal degradation char-acteristics of DMAA/MBAM polymer within green parts wereinvestigated by thermogravimetry experiments, and the maincompounds in the fast pyrolysis of DMAA/MBAM polymer wereidentied by pyrolysis-gas chromatography/mass spectrometry(Py-GC/MS). A multi-stage parallel reaction model (M-PRM) wasproposed to analyze and separate the overlapping peaks in da/dT curves. The kinetic parameters of each substage werecalculated using model-free methods. In addition, the mostappropriate kinetic mechanism function of each substage wasanalyzed and discussed via Malek's procedure and the Sestak–Berggren (SB) model.
2 Experimental methods2.1 Raw materials
For gelcasting, a low toxicity aqueous gel system using DMAA(Kowa Co., Ltd., Japan) andMBAM (Aladdin Industrial Co., Ltd.,China) as the monomer and crosslinker, respectively, was usedfor polymerization. Ammonium polyacrylate (NH4PAA, Shenz-hen Highrun Chemical Industry Co. Ltd., China), (NH4)2S2O8
(APS) and N,N,N0,N0-tetramethylethylene-diamine (TEMED,Aladdin Industrial Co., Ltd., China) were used as dispersant,initiator and catalyst, respectively, according to the approachreported in our previous work.27,28
This journal is © The Royal Society of Chemistry 2019
Paper RSC Advances
Ope
n A
cces
s A
rtic
le. P
ublis
hed
on 3
0 A
ugus
t 201
9. D
ownl
oade
d on
10/
30/2
021
8:38
:05
AM
. T
his
artic
le is
lice
nsed
und
er a
Cre
ativ
e C
omm
ons
Attr
ibut
ion-
Non
Com
mer
cial
3.0
Unp
orte
d L
icen
ce.
View Article Online
Y-a-SiAlON, with a composition of Y0.5Si9.75Al2.25O0.75N15.25
(m ¼ 1.5, n ¼ 0.75), was selected for investigation. Additionalamounts of 3 wt% Y2O3 and 6 wt% Ce2O3 were used to promotesintering densication. The rawmaterials were a-Si3N4 (SN-E10,UBE Industries, Ube, Japan), AlN (d ¼ 2.0 mm, purity of 99.9%,Aladdin Industrial Co., Ltd., China), Al2O3 (d¼ 0.5 mm, purity of99.9%, AKP-50, Sumitomo Chemical, Japan), Y2O3 (grade ne,purity of 99.9%, H.C. Stark, Germany) and Ce2O3 (d ¼ 5 mm,purity of 99.9%, Aladdin Industrial Co., Ltd., China). To avoidthe occulation of the suspension caused by the hydrolysisreaction of AlN powder in aqueous solution, thermal oxidationtreatment was used to obtain AlN with a modied surface(called M-AlN) to obtain hydrolytic resistance, following theapproach reported by Li et al.29
2.2 Green body preparation
The gelcasting process of a green body includes the followingsteps. (1) The premixed solution is prepared by dissolvingDMAA, MBAM (DMAA : MBAM ¼ 16 : 1, DMAA + MBAM ¼12.4 wt%) and NH4PAA (1.0 wt%) in deionized water. The pHvalue of the premixed solution was adjusted to approximately 11by NH3$H2O. (2) The suspensions are prepared by addingmixture powders into the premixed solution. The solid loadingof the suspensions was 40 vol%. To increase the dispersionuniformity of the slurry, the Si3N4, Al2O3, Y2O3 and Ce2O3 wererst added to the slurry under constant stirring and ball milledfor 3 h in a planetary mill using ZrO2 balls. The rotating rate was255 rpm, and the weight ratio of ball-to-powder-to water was1.9 : 1 : 0.4. Then, M-AlN was added, and the planetary mill wasrun without ZrO2 balls for 30 min to prevent the wear of thedense alumina lm of M-AlN owed by degassing for 30 min. (3)The gelation process of the slurry proceeded by adding 1.0 wt%initiator and catalyst. The suspensions were cast into a cylin-drical mold (B 35 mm � 25 mm) and then cured at roomtemperature until the DMAA andMBAMwere fully polymerized.Then, they were demolded in a drying oven at 60 �C for 24 h. (4)The drying process is performed. The demolded wet ceramicparts were moved to a temperature and humidity test chamberand dried under controlled temperature and humidity condi-tions to avoid cracking and uneven shrinkage of the body due tothe rapid evaporation of water. Then, the green bodies wereobtained for subsequent thermal analysis.
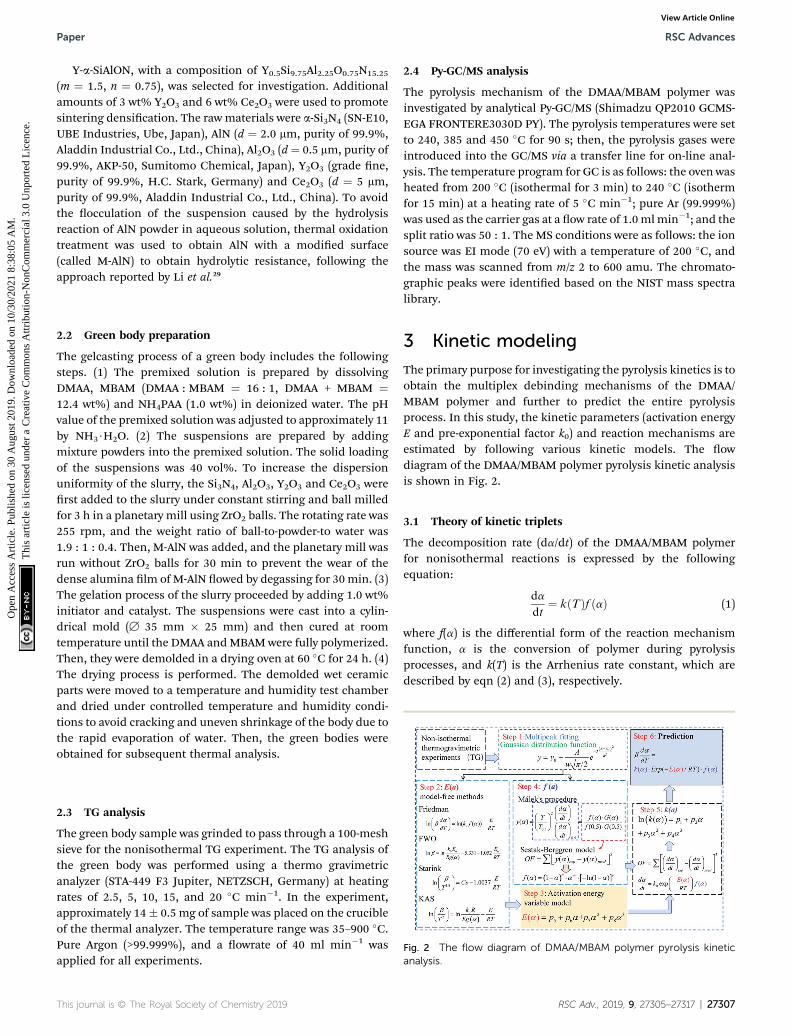
Fig. 2 The flow diagram of DMAA/MBAM polymer pyrolysis kineticanalysis.
2.3 TG analysis
The green body sample was grinded to pass through a 100-meshsieve for the nonisothermal TG experiment. The TG analysis ofthe green body was performed using a thermo gravimetricanalyzer (STA-449 F3 Jupiter, NETZSCH, Germany) at heatingrates of 2.5, 5, 10, 15, and 20 �C min�1. In the experiment,approximately 14� 0.5 mg of sample was placed on the crucibleof the thermal analyzer. The temperature range was 35–900 �C.Pure Argon (>99.999%), and a owrate of 40 ml min�1 wasapplied for all experiments.
This journal is © The Royal Society of Chemistry 2019
2.4 Py-GC/MS analysis
The pyrolysis mechanism of the DMAA/MBAM polymer wasinvestigated by analytical Py-GC/MS (Shimadzu QP2010 GCMS-EGA FRONTERE3030D PY). The pyrolysis temperatures were setto 240, 385 and 450 �C for 90 s; then, the pyrolysis gases wereintroduced into the GC/MS via a transfer line for on-line anal-ysis. The temperature program for GC is as follows: the oven washeated from 200 �C (isothermal for 3 min) to 240 �C (isothermfor 15 min) at a heating rate of 5 �C min�1; pure Ar (99.999%)was used as the carrier gas at a ow rate of 1.0 mlmin�1; and thesplit ratio was 50 : 1. The MS conditions were as follows: the ionsource was EI mode (70 eV) with a temperature of 200 �C, andthe mass was scanned from m/z 2 to 600 amu. The chromato-graphic peaks were identied based on the NIST mass spectralibrary.
3 Kinetic modeling
The primary purpose for investigating the pyrolysis kinetics is toobtain the multiplex debinding mechanisms of the DMAA/MBAM polymer and further to predict the entire pyrolysisprocess. In this study, the kinetic parameters (activation energyE and pre-exponential factor k0) and reaction mechanisms areestimated by following various kinetic models. The owdiagram of the DMAA/MBAM polymer pyrolysis kinetic analysisis shown in Fig. 2.
3.1 Theory of kinetic triplets
The decomposition rate (da/dt) of the DMAA/MBAM polymerfor nonisothermal reactions is expressed by the followingequation:
da
dt¼ kðTÞf ðaÞ (1)
where f(a) is the differential form of the reaction mechanismfunction, a is the conversion of polymer during pyrolysisprocesses, and k(T) is the Arrhenius rate constant, which aredescribed by eqn (2) and (3), respectively.
RSC Adv., 2019, 9, 27305–27317 | 27307
RSC Advances Paper
Ope
n A
cces
s A
rtic
le. P
ublis
hed
on 3
0 A
ugus
t 201
9. D
ownl
oade
d on
10/
30/2
021
8:38
:05
AM
. T
his
artic
le is
lice
nsed
und
er a
Cre
ativ
e C
omm
ons
Attr
ibut
ion-
Non
Com
mer
cial
3.0
Unp
orte
d L
icen
ce.
View Article Online
a ¼ (m0 � mt)/(m0 � mN) (2)
k(T) ¼ k0 exp(�E/RT) (3)
here, m0, mt, and mN are the initial, actual and nal masses ofthe gel polymer, respectively; k0 is the pre-exponential factor; Eis the apparent activation energy; R is the universal gasconstant; and T is the temperature.
The nonisothermal kinetic equation can be expressed asfollows:
da
dT¼ kf ðaÞ ¼ k0
bexp
�� E
RT
�ð1� aÞn (4)
gðaÞ ¼ða0
da
f ðaÞzk0
b
ðT0
exp
�� E
RT
�dT ¼ k0E
bRpðyÞ (5)
y ¼ E=ðRTÞ; pðyÞ ¼ �ðyN
expð�yÞy2
dy (6)
where b is the heating rate and b¼ dT/dt, n is the reaction orderof the decomposition reaction of DMAA/MBAM copolymer,which is assumed to be an isothermal homogeneous reaction(f(a) ¼ (1 � a)n), and g(a) is the integral form of the reactionmechanism function.
3.2 Theory of model-free methods
In thermal degradation kinetic analysis, model-free methodscan be used to obtain the activation energy for any reactionprogress without considering reaction mechanism.19,30 In thisstudy, four commonly used model-free methods, namely, theFlynn–Wall–Ozawa (FWO), Starink, Friedman and Kissinger–Akahira–Sunose (KAS) methods, are used to study the pyrolysisprocess of the DMAA/MBAM polymer during debinding.
The FWO method is established based on Doyle's approxi-mation.31 Aer rearranging and taking the common logarithm,Doyle's approximation equation, that is, ln p(y) ¼ �5.331 �1.052y, is substituted into eqn (5), and the following linearrelationship is obtained:
ln b ¼ lnk0E
RgðaÞ � 5:331� 1:052E
RT(7)
where gðaÞz k0EbR
�0:0048 exp
��1:052 E
RT
��.
The Starink method32,33 is considered to have the highest
accuracy, and its equation is expressed as:
ln
�b
T1:8
�¼ Cs � 1:0037
E
RT(8)
For the same value of a of the DMAA/MBAM polymer atdifferent heating rates, ln(b) is plotted vs. 1/T for the FWOmethod, and ln(b/T1.8) is plotted vs. 1/T for the Starink method.The values of E are estimated from the slope of the regressionlines.
The KAS method uses the Coats–Redfern approximation,which is p(y) ¼ exp(�y)/y2, therefore, eqn (5) is rearranged as
27308 | RSC Adv., 2019, 9, 27305–27317
gðaÞ ¼ k0EbR
expð�y=y2Þ. Then, the logarithm of both sides of the
rearranged equation is taken; thus, the mathematical expres-sion is proposed as:34
ln
�b
T2
�¼ ln
k0R
EagðaÞ �E
RT(9)
Under isoconversional conditions, ln(b/T2) is plotted vs. 1/T,and the apparent activation energy E can be determinedaccording to the slopes of the regression lines of �E/R atdifferent heating rates.
The differential Friedman approach has recently beenconsidered the most accurate method, and is establishedwithout approximation algorithms.19 The equation is expressedas:
ln
�bda
dT
�¼ lnðk0f ðaÞÞ � E
RT(10)
If the regression lines of ln�bdadT
�vs. 1/T for the Friedman
method are plotted, then the apparent activation energy E canbe determined according to the slopes of the regression lines atdifferent heating rates.
3.3 Model-tting method
3.3.1 M-PRM. M-PRM considers the overall pyrolysis stageto be a combination of several independent reactions.Assuming that there are a series of subpeaks in the entirepyrolysis process and that each subpeak represents an inde-pendent reaction, the kinetic parameters of the entire pyrolysisstage can be considered to be the weights of the kineticparameters of each substage. The nonisothermal pyrolysiskinetics of stage i can be described by the following differentialequation:
dai/dT ¼ k0,i/b exp(�Ei/RT)fi(ai) (11)
The weighted factor of parallel reaction stage i is calculatedby eqn (12):
wi ¼�mi0 �mif
���m0 �mf
�;
XNi¼1
wi ¼ 1 (12)
where wi is the weighted factor of stage i,m0 is the initial weight,mf is the nal weight, and i is the ith stage.
Then, a and E for the overall pyrolysis reaction process canbe written as:
a ¼ ðm0 �mTÞ��
m0 �mf
� ¼ XNi¼1
wiai (13)
E ¼XNi¼1
wiEi (14)
wheremT is the mass of the gel polymer at temperature T, and Nis the total number of substages.
This journal is © The Royal Society of Chemistry 2019
Paper RSC Advances
Ope
n A
cces
s A
rtic
le. P
ublis
hed
on 3
0 A
ugus
t 201
9. D
ownl
oade
d on
10/
30/2
021
8:38
:05
AM
. T
his
artic
le is
lice
nsed
und
er a
Cre
ativ
e C
omm
ons
Attr
ibut
ion-
Non
Com
mer
cial
3.0
Unp
orte
d L
icen
ce.
View Article Online
M-PRM uses a multipeak tting method to separate theoverlapping peaks in the reaction rate (da/dT) or differentialthermogravimetric (DTG) curve. In this study, the Gaussiandistribution function eqn (15) is used to t the da/dT curve. TheLevenberg–Marquardt algorithm is used for curve tting.
y ¼ y0 þ k0
wffiffiffiffiffiffiffiffiffip=2
p e�2ðx�xc Þ
w2
2
(15)
3.3.2 Activation energy variable model. Then, the kineticparameters (E and k0) of each substage can be determined bymodel-free methods. Additionally, an activation energy variablemodel reported by Sun et al.35 can be applied to describe thedependency between the activation energies and conversion fordifferent substages. The theory of the activation energy variablemodel can be expressed as:
bda
dT¼ kðaÞexp
�� EðaÞ
RT
�f ðaÞ (16)
where ln[k(a)] ¼ p1 + p2a + p3a2 + p4a
3, E(a) ¼ p5 + p6a + p7a2 +
p8a3.Aer taking the common logarithm, the eqn (16) can be
written as:
ln
�bda
dT
�¼ lnðkðaÞf ðaÞÞ � EðaÞ
RT(17)
ln�bdadT
�vs. 1/T can be plotted at the same fractional extent
of conversion a from a series of non-isothermal thermogravi-metric experiments at different heating rates. The activationenergy E(a) can be estimated from the slope of the regression
lines of ln�bdadT
�vs. 1/T. On this basis, the model parameters
(p5, p6, p7 and p8) can be obtained by polynomial regressiontting.
Based on the data of f(a), E(a), da/dt, T and a, the unknownmodel parameters (p1, p2, p3 and p4) can be obtained by mini-mizing the objective function (OF) using the generalizedreduced gradient (GRG) method in Microso Excel Solver.36
OF ¼X"�
da
dt
�exp
��da
dt
�pred
#2
(18)
where (da/dt)exp and (da/dt)pred represent the experimental andpredicted data of reaction rate (da/dt), respectively.
3.4 Determination of the mechanism function
3.4.1 Malek's procedure. It has been reported that Malek'sprocedure is an effective method for determining f(a) or G(a),which can be described as follows:32,33
yðaÞ ¼�
T
T0:5
�2
�dadt
��dadt
�0:5
¼ f ðaÞGðaÞf ð0:5ÞGð0:5Þ (19)
This journal is © The Royal Society of Chemistry 2019
where y(a) indicates the dening function, G(a) is the integralform of f(a), and T0.5 and (da/dt)0.5 denote the temperature andreaction rate, respectively, when a ¼ 0.5.
The most appropriate kinetic mechanism function f(a) isdeduced from the theoretical curve of y(a).
Arbitrarily, ai, y(ai) (i ¼ 1, 2, ., j) and a ¼ 0.5, y(0.5) aresubstituted into the following equation, and the theoreticalmaster plot f(a)G(a)/f(0.5)G(0.5) vs. a can be obtained.
yðaÞ ¼ f ðaÞGðaÞf ð0:5ÞGð0:5Þ (20)
Substituting, ai, Ti, (da/dt)i (i ¼ 1, 2, ., j) and a ¼ 0.5, T0.5,(da/dt)0.5 into eqn (19) provides the experimental master plot of(T/T0.5)
2(da/dt)/(da/dt)0.5 vs. a.
yðaÞ ¼�
T
T0:5
�2
�dadt
��dadt
�0:5
(21)
If the experimental plot overlaps with the theoretical plot orif the experimental data points all fall on a certain theoreticalplot, then the chosen f(a) can be considered to be the mostlikely kinetic mechanism function. The common functions ofthe kinetic mechanism for f(a) and G(a) are summarized inTable 1.20,33
3.4.2 SB model. The Sestak–Berggren (SB) model has beenreported as a powerful tool for the description of the reactionmechanism of single-step combined kinetics.37 The mathe-matical expression can be described as:38
f(a) ¼ (1 � a)nam[�ln(1 � a)]p (22)
where m, n and p refer to constant parameters. Here, the m, nand p represent the reaction order, the power law, and thediffusion mechanisms, respectively.36,38
Based on the data of da/dt, T and a, the unknown modelparameters (m, n and p) can be obtained by minimizing theobjective function (OF) using the generalized reduced gradient(GRG) method in Microso Excel Solver.36
OF ¼ P[y(a)exp � y(a)pred]
2 (23)
where y(a)exp and y(a)pred represent the experimental and pre-dicted data of y(a), respectively.
4 Results and discussion4.1 TG and Py-GC/MS analysis
Fig. 3 shows the TG and DTG curves of the DMAA/MBAMpolymer in the gelcast green bodies obtained at 2.5, 5, 15 and20 �C min�1. As illustrated in Fig. 3, it can be seen that both TGand DTG curves show similar trends for all heating rates. Fromthe TG curves in Fig. 3, a small mass loss is found at a temper-ature below 200 �C, which should correspond to the removal ofresidual moisture (free/bound water) absorption in the polymer.
RSC Adv., 2019, 9, 27305–27317 | 27309
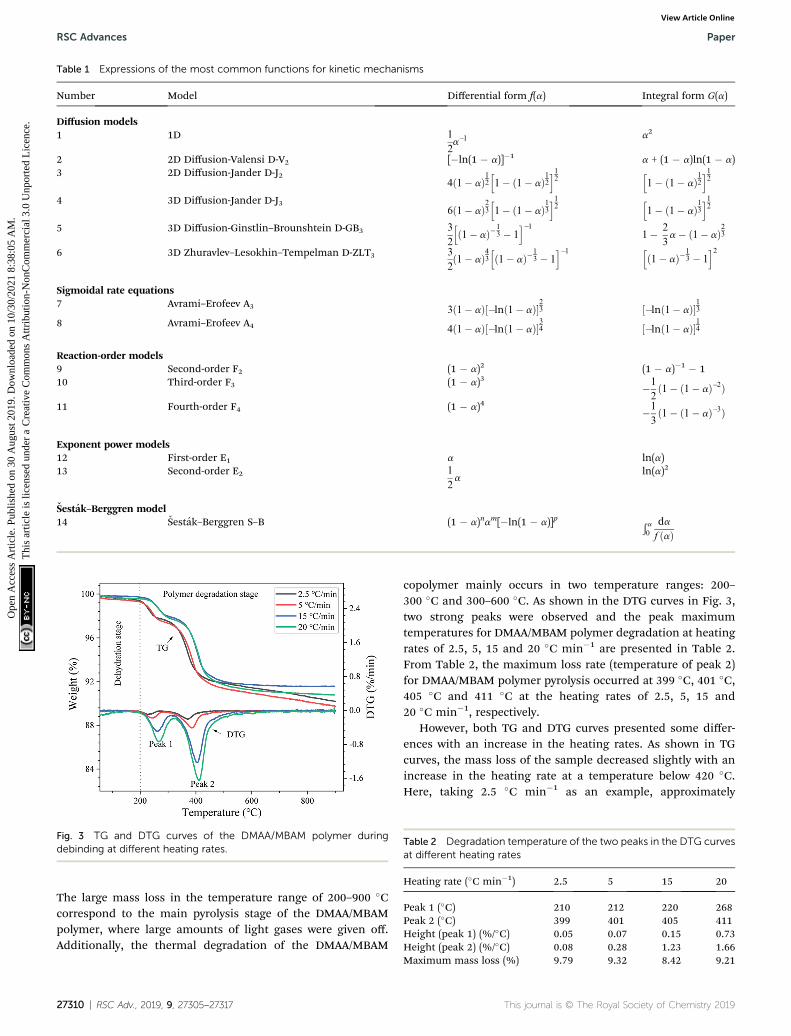
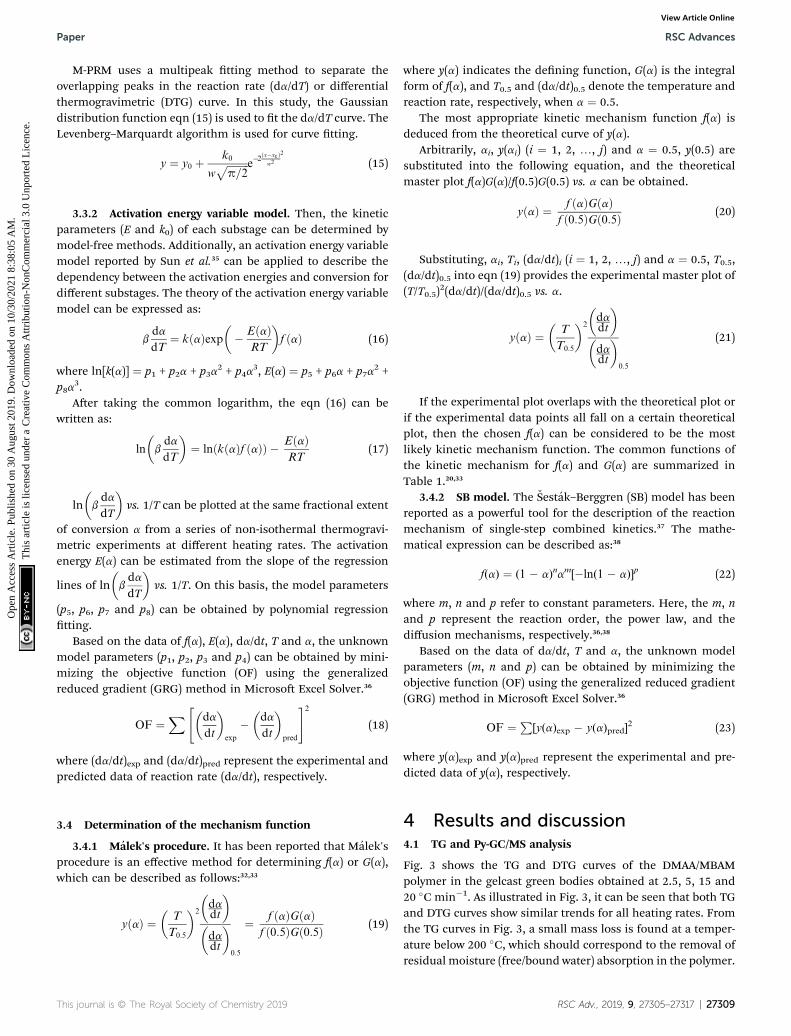
Table 1 Expressions of the most common functions for kinetic mechanisms
Number Model Differential form f(a) Integral form G(a)
Diffusion models1 1D 1
2a�1 a2
2 2D Diffusion-Valensi D-V2 [�ln(1 � a)]�1 a + (1 � a)ln(1 � a)3 2D Diffusion-Jander D-J2
4ð1� aÞ12h1� ð1� aÞ12
i12
h1� ð1� aÞ12
i12
4 3D Diffusion-Jander D-J36ð1� aÞ23
h1� ð1� aÞ13
i12
h1� ð1� aÞ13
i12
5 3D Diffusion-Ginstlin–Brounshtein D-GB3 3
2
hð1� aÞ�1
3 � 1i�1
1� 2
3a� ð1� aÞ23
6 3D Zhuravlev–Lesokhin–Tempelman D-ZLT3 3
2ð1� aÞ43
hð1� aÞ�1
3 � 1i�1 h
ð1� aÞ�13 � 1
i2
Sigmoidal rate equations7 Avrami–Erofeev A3 3ð1� aÞ½�lnð1� aÞ�23 ½�lnð1� aÞ�138 Avrami–Erofeev A4 4ð1� aÞ½�lnð1� aÞ�34 ½�lnð1� aÞ�14
Reaction-order models9 Second-order F2 (1 � a)2 (1 � a)�1 � 110 Third-order F3 (1 � a)3 �1
2ð1� ð1� aÞ�2Þ
11 Fourth-order F4 (1 � a)4 �1
3ð1� ð1� aÞ�3Þ
Exponent power models12 First-order E1 a ln(a)13 Second-order E2 1
2a
ln(a)2
Sestak–Berggren model14 Sestak–Berggren S–B (1 � a)nam[�ln(1 � a)]p Ð a
0
daf ðaÞ
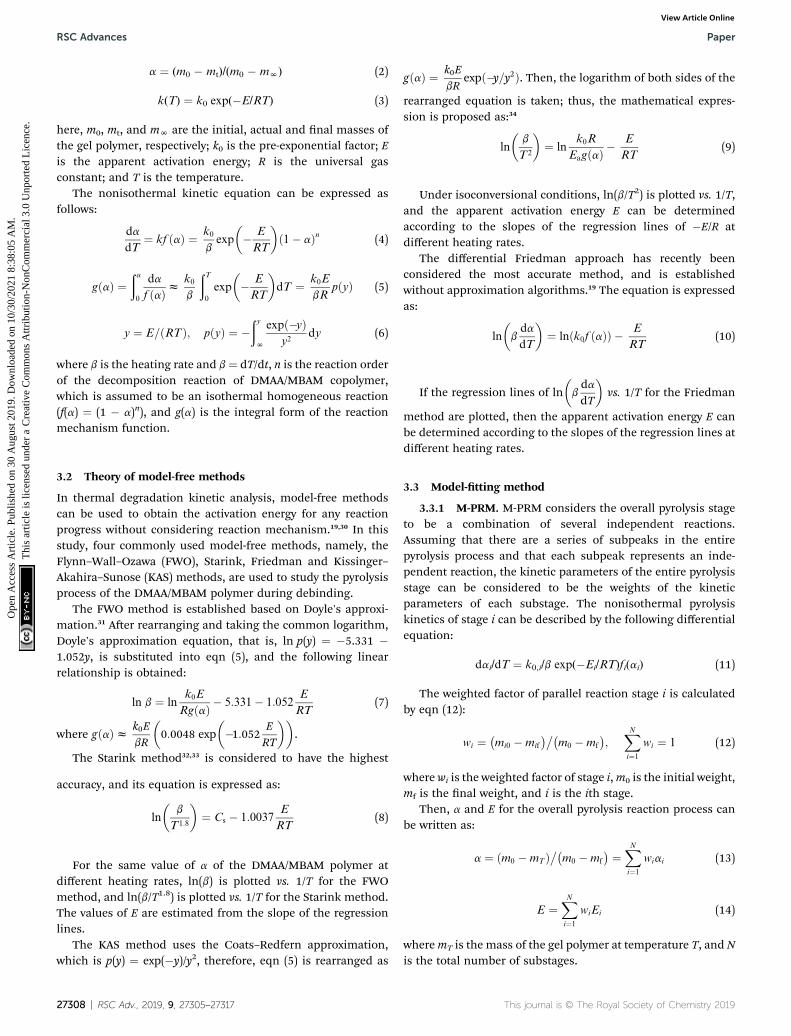
Fig. 3 TG and DTG curves of the DMAA/MBAM polymer duringdebinding at different heating rates.
Table 2 Degradation temperature of the two peaks in the DTG curvesat different heating rates
Heating rate (�C min�1) 2.5 5 15 20
Peak 1 (�C) 210 212 220 268Peak 2 (�C) 399 401 405 411Height (peak 1) (%/�C) 0.05 0.07 0.15 0.73Height (peak 2) (%/�C) 0.08 0.28 1.23 1.66
RSC Advances Paper
Ope
n A
cces
s A
rtic
le. P
ublis
hed
on 3
0 A
ugus
t 201
9. D
ownl
oade
d on
10/
30/2
021
8:38
:05
AM
. T
his
artic
le is
lice
nsed
und
er a
Cre
ativ
e C
omm
ons
Attr
ibut
ion-
Non
Com
mer
cial
3.0
Unp
orte
d L
icen
ce.
View Article Online
The large mass loss in the temperature range of 200–900 �Ccorrespond to the main pyrolysis stage of the DMAA/MBAMpolymer, where large amounts of light gases were given off.Additionally, the thermal degradation of the DMAA/MBAM
27310 | RSC Adv., 2019, 9, 27305–27317
copolymer mainly occurs in two temperature ranges: 200–300 �C and 300–600 �C. As shown in the DTG curves in Fig. 3,two strong peaks were observed and the peak maximumtemperatures for DMAA/MBAM polymer degradation at heatingrates of 2.5, 5, 15 and 20 �C min�1 are presented in Table 2.From Table 2, the maximum loss rate (temperature of peak 2)for DMAA/MBAM polymer pyrolysis occurred at 399 �C, 401 �C,405 �C and 411 �C at the heating rates of 2.5, 5, 15 and20 �C min�1, respectively.
However, both TG and DTG curves presented some differ-ences with an increase in the heating rates. As shown in TGcurves, the mass loss of the sample decreased slightly with anincrease in the heating rate at a temperature below 420 �C.Here, taking 2.5 �C min�1 as an example, approximately
Maximum mass loss (%) 9.79 9.32 8.42 9.21
This journal is © The Royal Society of Chemistry 2019
Paper RSC Advances
Ope
n A
cces
s A
rtic
le. P
ublis
hed
on 3
0 A
ugus
t 201
9. D
ownl
oade
d on
10/
30/2
021
8:38
:05
AM
. T
his
artic
le is
lice
nsed
und
er a
Cre
ativ
e C
omm
ons
Attr
ibut
ion-
Non
Com
mer
cial
3.0
Unp
orte
d L
icen
ce.
View Article Online
76.5 wt% polymer in the sample was burnt out, and the massloss of is approximately 7.5%. But there is no obvious trend ofthe ultimate maximum mass loss with an increase the heatingrate in the temperature range of 420–900 �C. As shown in Table2, the ultimate mass loss observed at 900 �C for heating rate of2.5, 5, 15 and 20 �C min�1 are 9.79%, 9.32%, 8.42% and 9.21%,respectively. The reasons for this phenomenon might beattributed to the following two points: (1) the sample is moresusceptible to cracking at high heating rates, leading to thepyrolysis gas of the polymer to be released more quickly, whichmay not occur at a lower heating rate. (2) When the heatingrates are increased, the partial polymer cannot adequatelyrapidly pyrolyze and release their volatiles, thereby resulting inhysteresis. Moreover, as seen from Fig. 3, the DTG curves areoffset to a high temperature area with an increase in the heatingrate, and the degradation temperature was delayed as theheating rate increased. This phenomenon should be due to thefact that more thermal energy was provided for the pyrolysis atthe higher heating rate.
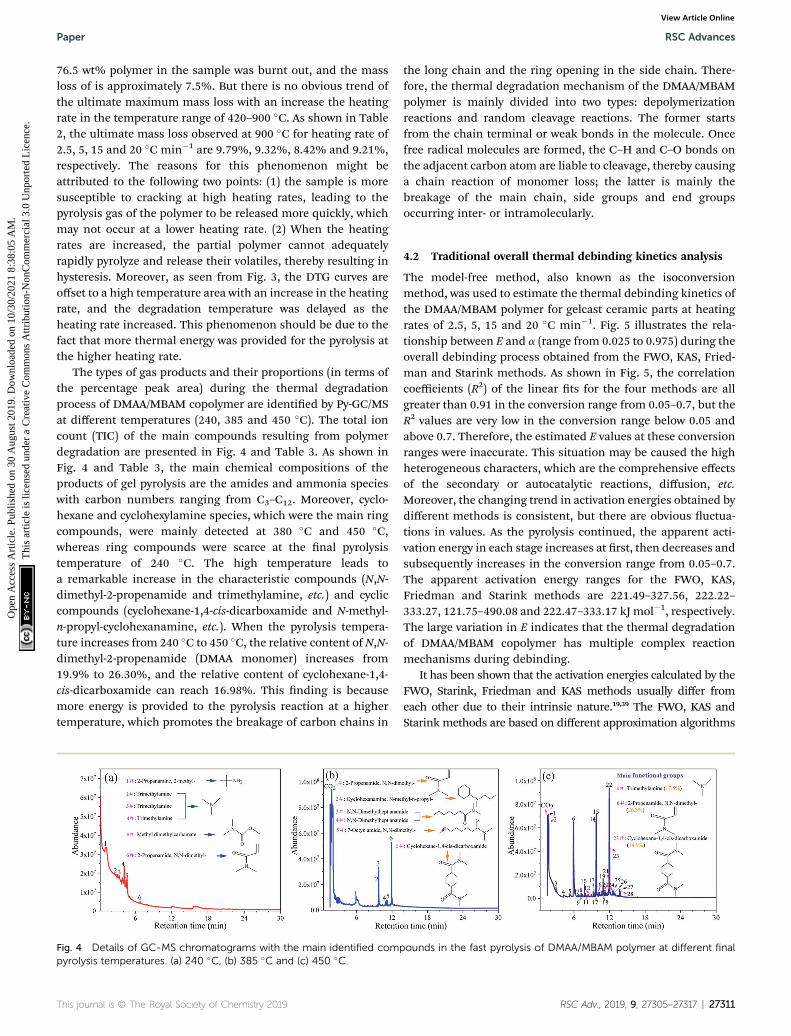
The types of gas products and their proportions (in terms ofthe percentage peak area) during the thermal degradationprocess of DMAA/MBAM copolymer are identied by Py-GC/MSat different temperatures (240, 385 and 450 �C). The total ioncount (TIC) of the main compounds resulting from polymerdegradation are presented in Fig. 4 and Table 3. As shown inFig. 4 and Table 3, the main chemical compositions of theproducts of gel pyrolysis are the amides and ammonia specieswith carbon numbers ranging from C3–C12. Moreover, cyclo-hexane and cyclohexylamine species, which were the main ringcompounds, were mainly detected at 380 �C and 450 �C,whereas ring compounds were scarce at the nal pyrolysistemperature of 240 �C. The high temperature leads toa remarkable increase in the characteristic compounds (N,N-dimethyl-2-propenamide and trimethylamine, etc.) and cycliccompounds (cyclohexane-1,4-cis-dicarboxamide and N-methyl-n-propyl-cyclohexanamine, etc.). When the pyrolysis tempera-ture increases from 240 �C to 450 �C, the relative content of N,N-dimethyl-2-propenamide (DMAA monomer) increases from19.9% to 26.30%, and the relative content of cyclohexane-1,4-cis-dicarboxamide can reach 16.98%. This nding is becausemore energy is provided to the pyrolysis reaction at a highertemperature, which promotes the breakage of carbon chains in
Fig. 4 Details of GC-MS chromatograms with the main identified compyrolysis temperatures. (a) 240 �C, (b) 385 �C and (c) 450 �C.
This journal is © The Royal Society of Chemistry 2019
the long chain and the ring opening in the side chain. There-fore, the thermal degradation mechanism of the DMAA/MBAMpolymer is mainly divided into two types: depolymerizationreactions and random cleavage reactions. The former startsfrom the chain terminal or weak bonds in the molecule. Oncefree radical molecules are formed, the C–H and C–O bonds onthe adjacent carbon atom are liable to cleavage, thereby causinga chain reaction of monomer loss; the latter is mainly thebreakage of the main chain, side groups and end groupsoccurring inter- or intramolecularly.
4.2 Traditional overall thermal debinding kinetics analysis
The model-free method, also known as the isoconversionmethod, was used to estimate the thermal debinding kinetics ofthe DMAA/MBAM polymer for gelcast ceramic parts at heatingrates of 2.5, 5, 15 and 20 �C min�1. Fig. 5 illustrates the rela-tionship between E and a (range from 0.025 to 0.975) during theoverall debinding process obtained from the FWO, KAS, Fried-man and Starink methods. As shown in Fig. 5, the correlationcoefficients (R2) of the linear ts for the four methods are allgreater than 0.91 in the conversion range from 0.05–0.7, but theR2 values are very low in the conversion range below 0.05 andabove 0.7. Therefore, the estimated E values at these conversionranges were inaccurate. This situation may be caused the highheterogeneous characters, which are the comprehensive effectsof the secondary or autocatalytic reactions, diffusion, etc.Moreover, the changing trend in activation energies obtained bydifferent methods is consistent, but there are obvious uctua-tions in values. As the pyrolysis continued, the apparent acti-vation energy in each stage increases at rst, then decreases andsubsequently increases in the conversion range from 0.05–0.7.The apparent activation energy ranges for the FWO, KAS,Friedman and Starink methods are 221.49–327.56, 222.22–333.27, 121.75–490.08 and 222.47–333.17 kJ mol�1, respectively.The large variation in E indicates that the thermal degradationof DMAA/MBAM copolymer has multiple complex reactionmechanisms during debinding.
It has been shown that the activation energies calculated by theFWO, Starink, Friedman and KAS methods usually differ fromeach other due to their intrinsic nature.19,39 The FWO, KAS andStarink methods are based on different approximation algorithms
pounds in the fast pyrolysis of DMAA/MBAM polymer at different final
RSC Adv., 2019, 9, 27305–27317 | 27311
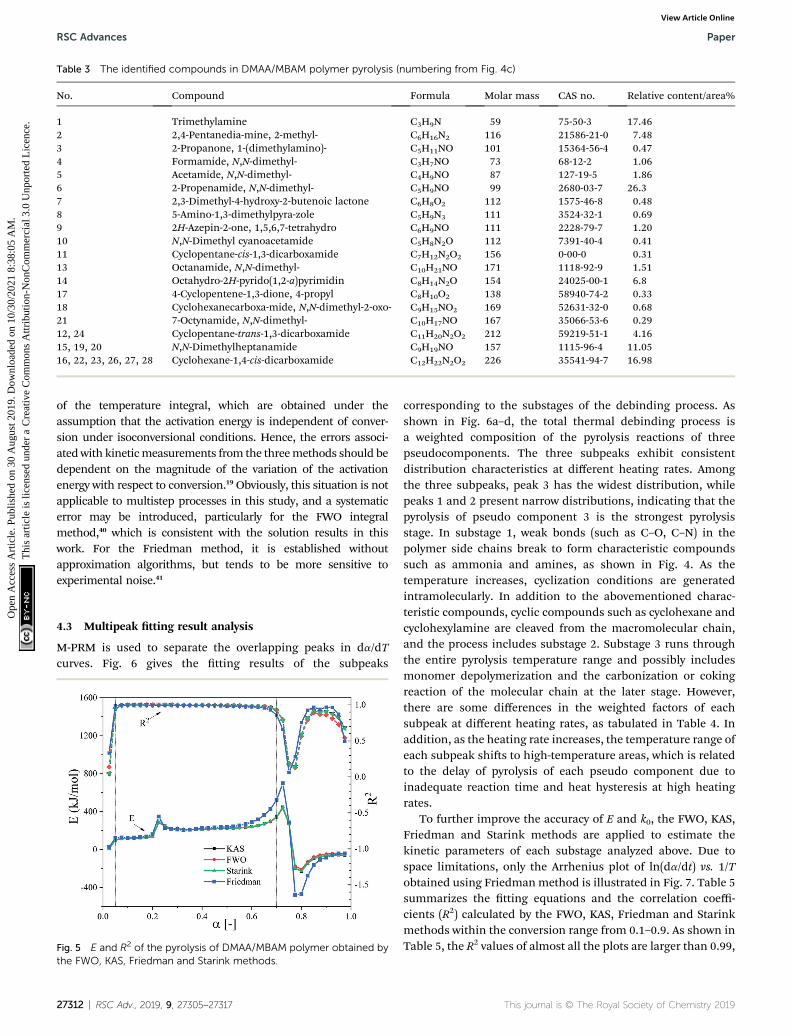
Table 3 The identified compounds in DMAA/MBAM polymer pyrolysis (numbering from Fig. 4c)
No. Compound Formula Molar mass CAS no. Relative content/area%
1 Trimethylamine C3H9N 59 75-50-3 17.462 2,4-Pentanedia-mine, 2-methyl- C6H16N2 116 21586-21-0 7.483 2-Propanone, 1-(dimethylamino)- C5H11NO 101 15364-56-4 0.474 Formamide, N,N-dimethyl- C3H7NO 73 68-12-2 1.065 Acetamide, N,N-dimethyl- C4H9NO 87 127-19-5 1.866 2-Propenamide, N,N-dimethyl- C5H9NO 99 2680-03-7 26.37 2,3-Dimethyl-4-hydroxy-2-butenoic lactone C6H8O2 112 1575-46-8 0.488 5-Amino-1,3-dimethylpyra-zole C5H9N3 111 3524-32-1 0.699 2H-Azepin-2-one, 1,5,6,7-tetrahydro C6H9NO 111 2228-79-7 1.2010 N,N-Dimethyl cyanoacetamide C5H8N2O 112 7391-40-4 0.4111 Cyclopentane-cis-1,3-dicarboxamide C7H12N2O2 156 0-00-0 0.3113 Octanamide, N,N-dimethyl- C10H21NO 171 1118-92-9 1.5114 Octahydro-2H-pyrido(1,2-a)pyrimidin C8H14N2O 154 24025-00-1 6.817 4-Cyclopentene-1,3-dione, 4-propyl C8H10O2 138 58940-74-2 0.3318 Cyclohexanecarboxa-mide, N,N-dimethyl-2-oxo- C9H15NO2 169 52631-32-0 0.6821 7-Octynamide, N,N-dimethyl- C10H17NO 167 35066-53-6 0.2912, 24 Cyclopentane-trans-1,3-dicarboxamide C11H20N2O2 212 59219-51-1 4.1615, 19, 20 N,N-Dimethylheptanamide C9H19NO 157 1115-96-4 11.0516, 22, 23, 26, 27, 28 Cyclohexane-1,4-cis-dicarboxamide C12H22N2O2 226 35541-94-7 16.98
RSC Advances Paper
Ope
n A
cces
s A
rtic
le. P
ublis
hed
on 3
0 A
ugus
t 201
9. D
ownl
oade
d on
10/
30/2
021
8:38
:05
AM
. T
his
artic
le is
lice
nsed
und
er a
Cre
ativ
e C
omm
ons
Attr
ibut
ion-
Non
Com
mer
cial
3.0
Unp
orte
d L
icen
ce.
View Article Online
of the temperature integral, which are obtained under theassumption that the activation energy is independent of conver-sion under isoconversional conditions. Hence, the errors associ-ated with kineticmeasurements from the threemethods should bedependent on the magnitude of the variation of the activationenergy with respect to conversion.19 Obviously, this situation is notapplicable to multistep processes in this study, and a systematicerror may be introduced, particularly for the FWO integralmethod,40 which is consistent with the solution results in thiswork. For the Friedman method, it is established withoutapproximation algorithms, but tends to be more sensitive toexperimental noise.41
4.3 Multipeak tting result analysis
M-PRM is used to separate the overlapping peaks in da/dTcurves. Fig. 6 gives the tting results of the subpeaks
Fig. 5 E and R2 of the pyrolysis of DMAA/MBAM polymer obtained bythe FWO, KAS, Friedman and Starink methods.
27312 | RSC Adv., 2019, 9, 27305–27317
corresponding to the substages of the debinding process. Asshown in Fig. 6a–d, the total thermal debinding process isa weighted composition of the pyrolysis reactions of threepseudocomponents. The three subpeaks exhibit consistentdistribution characteristics at different heating rates. Amongthe three subpeaks, peak 3 has the widest distribution, whilepeaks 1 and 2 present narrow distributions, indicating that thepyrolysis of pseudo component 3 is the strongest pyrolysisstage. In substage 1, weak bonds (such as C–O, C–N) in thepolymer side chains break to form characteristic compoundssuch as ammonia and amines, as shown in Fig. 4. As thetemperature increases, cyclization conditions are generatedintramolecularly. In addition to the abovementioned charac-teristic compounds, cyclic compounds such as cyclohexane andcyclohexylamine are cleaved from the macromolecular chain,and the process includes substage 2. Substage 3 runs throughthe entire pyrolysis temperature range and possibly includesmonomer depolymerization and the carbonization or cokingreaction of the molecular chain at the later stage. However,there are some differences in the weighted factors of eachsubpeak at different heating rates, as tabulated in Table 4. Inaddition, as the heating rate increases, the temperature range ofeach subpeak shis to high-temperature areas, which is relatedto the delay of pyrolysis of each pseudo component due toinadequate reaction time and heat hysteresis at high heatingrates.
To further improve the accuracy of E and k0, the FWO, KAS,Friedman and Starink methods are applied to estimate thekinetic parameters of each substage analyzed above. Due tospace limitations, only the Arrhenius plot of ln(da/dt) vs. 1/Tobtained using Friedmanmethod is illustrated in Fig. 7. Table 5summarizes the tting equations and the correlation coeffi-cients (R2) calculated by the FWO, KAS, Friedman and Starinkmethods within the conversion range from 0.1–0.9. As shown inTable 5, the R2 values of almost all the plots are larger than 0.99,
This journal is © The Royal Society of Chemistry 2019
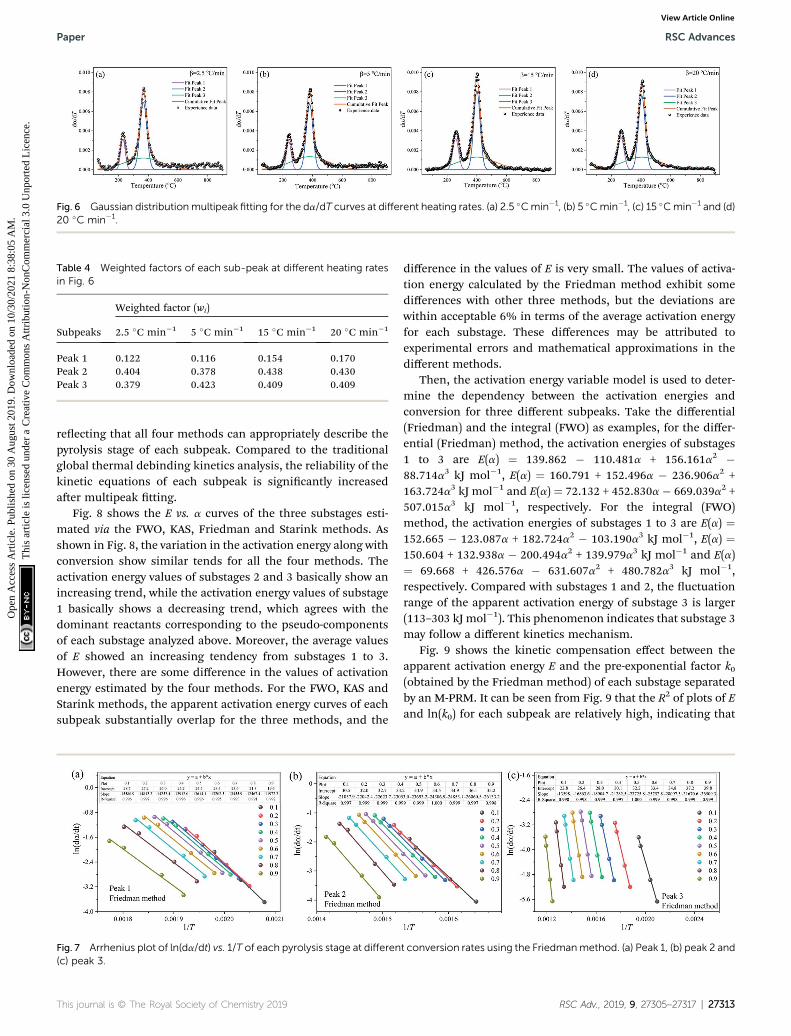
Fig. 6 Gaussian distributionmultipeak fitting for the da/dT curves at different heating rates. (a) 2.5 �Cmin�1, (b) 5 �Cmin�1, (c) 15 �Cmin�1 and (d)20 �C min�1.
Table 4 Weighted factors of each sub-peak at different heating ratesin Fig. 6
Subpeaks
Weighted factor (wi)
2.5 �C min�1 5 �C min�1 15 �C min�1 20 �C min�1
Peak 1 0.122 0.116 0.154 0.170Peak 2 0.404 0.378 0.438 0.430Peak 3 0.379 0.423 0.409 0.409
Paper RSC Advances
Ope
n A
cces
s A
rtic
le. P
ublis
hed
on 3
0 A
ugus
t 201
9. D
ownl
oade
d on
10/
30/2
021
8:38
:05
AM
. T
his
artic
le is
lice
nsed
und
er a
Cre
ativ
e C
omm
ons
Attr
ibut
ion-
Non
Com
mer
cial
3.0
Unp
orte
d L
icen
ce.
View Article Online
reecting that all four methods can appropriately describe thepyrolysis stage of each subpeak. Compared to the traditionalglobal thermal debinding kinetics analysis, the reliability of thekinetic equations of each subpeak is signicantly increasedaer multipeak tting.
Fig. 8 shows the E vs. a curves of the three substages esti-mated via the FWO, KAS, Friedman and Starink methods. Asshown in Fig. 8, the variation in the activation energy along withconversion show similar tends for all the four methods. Theactivation energy values of substages 2 and 3 basically show anincreasing trend, while the activation energy values of substage1 basically shows a decreasing trend, which agrees with thedominant reactants corresponding to the pseudo-componentsof each substage analyzed above. Moreover, the average valuesof E showed an increasing tendency from substages 1 to 3.However, there are some difference in the values of activationenergy estimated by the four methods. For the FWO, KAS andStarink methods, the apparent activation energy curves of eachsubpeak substantially overlap for the three methods, and the
Fig. 7 Arrhenius plot of ln(da/dt) vs. 1/T of each pyrolysis stage at differen(c) peak 3.
This journal is © The Royal Society of Chemistry 2019
difference in the values of E is very small. The values of activa-tion energy calculated by the Friedman method exhibit somedifferences with other three methods, but the deviations arewithin acceptable 6% in terms of the average activation energyfor each substage. These differences may be attributed toexperimental errors and mathematical approximations in thedifferent methods.
Then, the activation energy variable model is used to deter-mine the dependency between the activation energies andconversion for three different subpeaks. Take the differential(Friedman) and the integral (FWO) as examples, for the differ-ential (Friedman) method, the activation energies of substages1 to 3 are E(a) ¼ 139.862 � 110.481a + 156.161a2 �88.714a3 kJ mol�1, E(a) ¼ 160.791 + 152.496a � 236.906a2 +163.724a3 kJ mol�1 and E(a) ¼ 72.132 + 452.830a � 669.039a2 +507.015a3 kJ mol�1, respectively. For the integral (FWO)method, the activation energies of substages 1 to 3 are E(a) ¼152.665 � 123.087a + 182.724a2 � 103.190a3 kJ mol�1, E(a) ¼150.604 + 132.938a � 200.494a2 + 139.979a3 kJ mol�1 and E(a)¼ 69.668 + 426.576a � 631.607a2 + 480.782a3 kJ mol�1,respectively. Compared with substages 1 and 2, the uctuationrange of the apparent activation energy of substage 3 is larger(113–303 kJ mol�1). This phenomenon indicates that substage 3may follow a different kinetics mechanism.
Fig. 9 shows the kinetic compensation effect between theapparent activation energy E and the pre-exponential factor k0(obtained by the Friedman method) of each substage separatedby an M-PRM. It can be seen from Fig. 9 that the R2 of plots of Eand ln(k0) for each subpeak are relatively high, indicating that
t conversion rates using the Friedmanmethod. (a) Peak 1, (b) peak 2 and
RSC Adv., 2019, 9, 27305–27317 | 27313
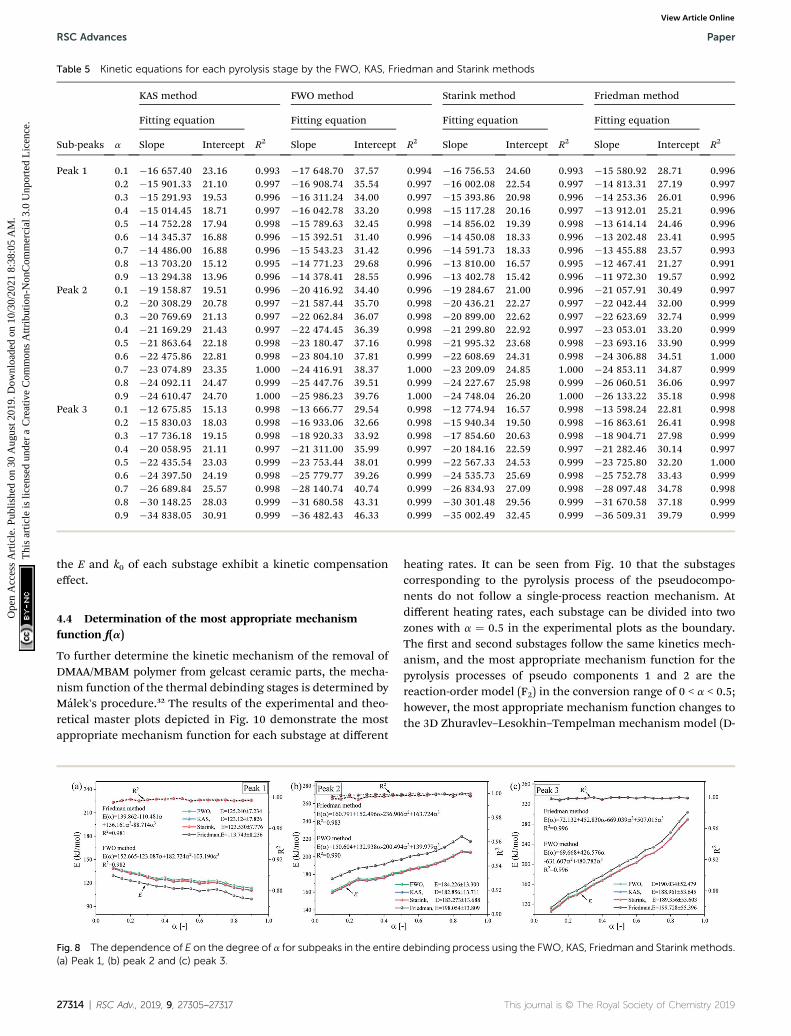
Table 5 Kinetic equations for each pyrolysis stage by the FWO, KAS, Friedman and Starink methods
Sub-peaks a
KAS method FWO method Starink method Friedman method
Fitting equation
R2
Fitting equation
R2
Fitting equation
R2
Fitting equation
R2Slope Intercept Slope Intercept Slope Intercept Slope Intercept
Peak 1 0.1 �16 657.40 23.16 0.993 �17 648.70 37.57 0.994 �16 756.53 24.60 0.993 �15 580.92 28.71 0.9960.2 �15 901.33 21.10 0.997 �16 908.74 35.54 0.997 �16 002.08 22.54 0.997 �14 813.31 27.19 0.9970.3 �15 291.93 19.53 0.996 �16 311.24 34.00 0.997 �15 393.86 20.98 0.996 �14 253.36 26.01 0.9960.4 �15 014.45 18.71 0.997 �16 042.78 33.20 0.998 �15 117.28 20.16 0.997 �13 912.01 25.21 0.9960.5 �14 752.28 17.94 0.998 �15 789.63 32.45 0.998 �14 856.02 19.39 0.998 �13 614.14 24.46 0.9960.6 �14 345.37 16.88 0.996 �15 392.51 31.40 0.996 �14 450.08 18.33 0.996 �13 202.48 23.41 0.9950.7 �14 486.00 16.88 0.996 �15 543.23 31.42 0.996 �14 591.73 18.33 0.996 �13 455.88 23.57 0.9930.8 �13 703.20 15.12 0.995 �14 771.23 29.68 0.996 �13 810.00 16.57 0.995 �12 467.41 21.27 0.9910.9 �13 294.38 13.96 0.996 �14 378.41 28.55 0.996 �13 402.78 15.42 0.996 �11 972.30 19.57 0.992
Peak 2 0.1 �19 158.87 19.51 0.996 �20 416.92 34.40 0.996 �19 284.67 21.00 0.996 �21 057.91 30.49 0.9970.2 �20 308.29 20.78 0.997 �21 587.44 35.70 0.998 �20 436.21 22.27 0.997 �22 042.44 32.00 0.9990.3 �20 769.69 21.13 0.997 �22 062.84 36.07 0.998 �20 899.00 22.62 0.997 �22 623.69 32.74 0.9990.4 �21 169.29 21.43 0.997 �22 474.45 36.39 0.998 �21 299.80 22.92 0.997 �23 053.01 33.20 0.9990.5 �21 863.64 22.18 0.998 �23 180.47 37.16 0.998 �21 995.32 23.68 0.998 �23 693.16 33.90 0.9990.6 �22 475.86 22.81 0.998 �23 804.10 37.81 0.999 �22 608.69 24.31 0.998 �24 306.88 34.51 1.0000.7 �23 074.89 23.35 1.000 �24 416.91 38.37 1.000 �23 209.09 24.85 1.000 �24 853.11 34.87 0.9990.8 �24 092.11 24.47 0.999 �25 447.76 39.51 0.999 �24 227.67 25.98 0.999 �26 060.51 36.06 0.9970.9 �24 610.47 24.70 1.000 �25 986.23 39.76 1.000 �24 748.04 26.20 1.000 �26 133.22 35.18 0.998
Peak 3 0.1 �12 675.85 15.13 0.998 �13 666.77 29.54 0.998 �12 774.94 16.57 0.998 �13 598.24 22.81 0.9980.2 �15 830.03 18.03 0.998 �16 933.06 32.66 0.998 �15 940.34 19.50 0.998 �16 863.61 26.41 0.9980.3 �17 736.18 19.15 0.998 �18 920.33 33.92 0.998 �17 854.60 20.63 0.998 �18 904.71 27.98 0.9990.4 �20 058.95 21.11 0.997 �21 311.00 35.99 0.997 �20 184.16 22.59 0.997 �21 282.46 30.14 0.9970.5 �22 435.54 23.03 0.999 �23 753.44 38.01 0.999 �22 567.33 24.53 0.999 �23 725.80 32.20 1.0000.6 �24 397.50 24.19 0.998 �25 779.77 39.26 0.999 �24 535.73 25.69 0.998 �25 752.78 33.43 0.9990.7 �26 689.84 25.57 0.998 �28 140.74 40.74 0.999 �26 834.93 27.09 0.998 �28 097.48 34.78 0.9980.8 �30 148.25 28.03 0.999 �31 680.58 43.31 0.999 �30 301.48 29.56 0.999 �31 670.58 37.18 0.9990.9 �34 838.05 30.91 0.999 �36 482.43 46.33 0.999 �35 002.49 32.45 0.999 �36 509.31 39.79 0.999
RSC Advances Paper
Ope
n A
cces
s A
rtic
le. P
ublis
hed
on 3
0 A
ugus
t 201
9. D
ownl
oade
d on
10/
30/2
021
8:38
:05
AM
. T
his
artic
le is
lice
nsed
und
er a
Cre
ativ
e C
omm
ons
Attr
ibut
ion-
Non
Com
mer
cial
3.0
Unp
orte
d L
icen
ce.
View Article Online
the E and k0 of each substage exhibit a kinetic compensationeffect.
4.4 Determination of the most appropriate mechanismfunction f(a)
To further determine the kinetic mechanism of the removal ofDMAA/MBAM polymer from gelcast ceramic parts, the mecha-nism function of the thermal debinding stages is determined byMalek's procedure.32 The results of the experimental and theo-retical master plots depicted in Fig. 10 demonstrate the mostappropriate mechanism function for each substage at different
Fig. 8 The dependence of E on the degree of a for subpeaks in the entire(a) Peak 1, (b) peak 2 and (c) peak 3.
27314 | RSC Adv., 2019, 9, 27305–27317
heating rates. It can be seen from Fig. 10 that the substagescorresponding to the pyrolysis process of the pseudocompo-nents do not follow a single-process reaction mechanism. Atdifferent heating rates, each substage can be divided into twozones with a ¼ 0.5 in the experimental plots as the boundary.The rst and second substages follow the same kinetics mech-anism, and the most appropriate mechanism function for thepyrolysis processes of pseudo components 1 and 2 are thereaction-order model (F2) in the conversion range of 0 < a < 0.5;however, the most appropriate mechanism function changes tothe 3D Zhuravlev–Lesokhin–Tempelman mechanism model (D-
debinding process using the FWO, KAS, Friedman and Starinkmethods.
This journal is © The Royal Society of Chemistry 2019
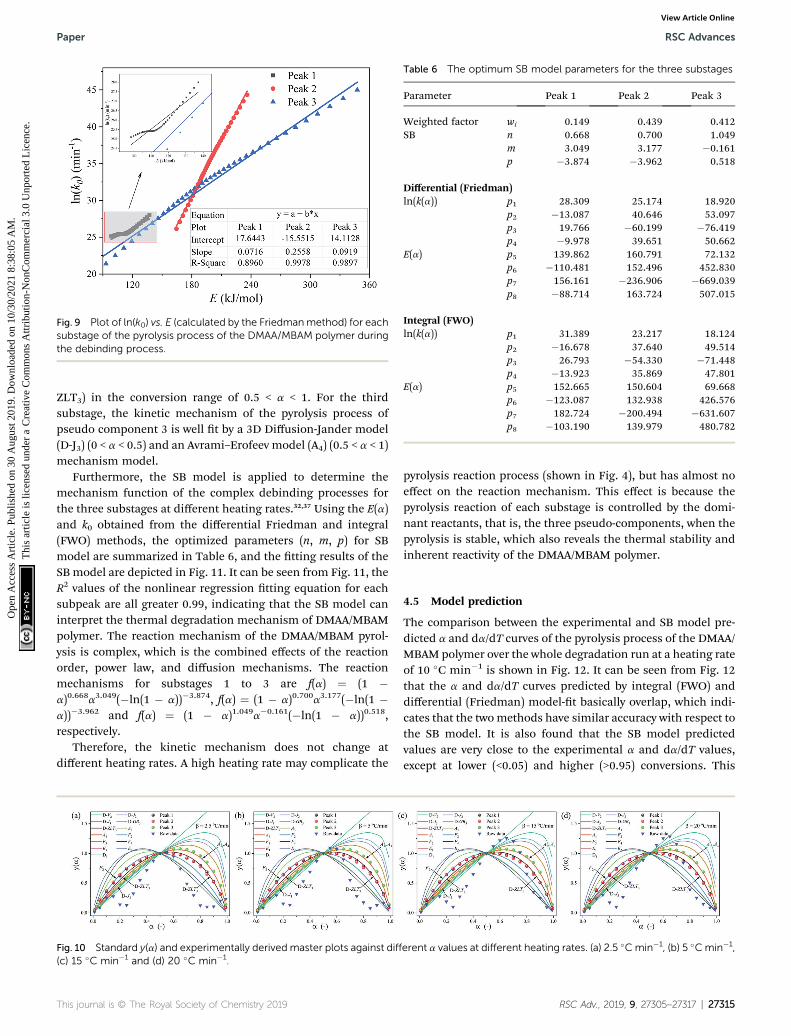
Fig. 9 Plot of ln(k0) vs. E (calculated by the Friedmanmethod) for eachsubstage of the pyrolysis process of the DMAA/MBAM polymer duringthe debinding process.
Table 6 The optimum SB model parameters for the three substages
Parameter Peak 1 Peak 2 Peak 3
Weighted factor wi 0.149 0.439 0.412SB n 0.668 0.700 1.049
m 3.049 3.177 �0.161p �3.874 �3.962 0.518
Differential (Friedman)ln(k(a)) p1 28.309 25.174 18.920
p2 �13.087 40.646 53.097p3 19.766 �60.199 �76.419p4 �9.978 39.651 50.662
E(a) p5 139.862 160.791 72.132p6 �110.481 152.496 452.830p7 156.161 �236.906 �669.039p8 �88.714 163.724 507.015
Integral (FWO)ln(k(a)) p1 31.389 23.217 18.124
p2 �16.678 37.640 49.514p3 26.793 �54.330 �71.448p4 �13.923 35.869 47.801
E(a) p5 152.665 150.604 69.668p6 �123.087 132.938 426.576p7 182.724 �200.494 �631.607p8 �103.190 139.979 480.782
Paper RSC Advances
Ope
n A
cces
s A
rtic
le. P
ublis
hed
on 3
0 A
ugus
t 201
9. D
ownl
oade
d on
10/
30/2
021
8:38
:05
AM
. T
his
artic
le is
lice
nsed
und
er a
Cre
ativ
e C
omm
ons
Attr
ibut
ion-
Non
Com
mer
cial
3.0
Unp
orte
d L
icen
ce.
View Article Online
ZLT3) in the conversion range of 0.5 < a < 1. For the thirdsubstage, the kinetic mechanism of the pyrolysis process ofpseudo component 3 is well t by a 3D Diffusion-Jander model(D-J3) (0 < a < 0.5) and an Avrami–Erofeev model (A4) (0.5 < a < 1)mechanism model.
Furthermore, the SB model is applied to determine themechanism function of the complex debinding processes forthe three substages at different heating rates.32,37 Using the E(a)and k0 obtained from the differential Friedman and integral(FWO) methods, the optimized parameters (n, m, p) for SBmodel are summarized in Table 6, and the tting results of theSB model are depicted in Fig. 11. It can be seen from Fig. 11, theR2 values of the nonlinear regression tting equation for eachsubpeak are all greater 0.99, indicating that the SB model caninterpret the thermal degradation mechanism of DMAA/MBAMpolymer. The reaction mechanism of the DMAA/MBAM pyrol-ysis is complex, which is the combined effects of the reactionorder, power law, and diffusion mechanisms. The reactionmechanisms for substages 1 to 3 are f(a) ¼ (1 �a)0.668a3.049(�ln(1 � a))�3.874, f(a) ¼ (1 � a)0.700a3.177(�ln(1 �a))�3.962 and f(a) ¼ (1 � a)1.049a�0.161(�ln(1 � a))0.518,respectively.
Therefore, the kinetic mechanism does not change atdifferent heating rates. A high heating rate may complicate the
Fig. 10 Standard y(a) and experimentally derived master plots against diff(c) 15 �C min�1 and (d) 20 �C min�1.
This journal is © The Royal Society of Chemistry 2019
pyrolysis reaction process (shown in Fig. 4), but has almost noeffect on the reaction mechanism. This effect is because thepyrolysis reaction of each substage is controlled by the domi-nant reactants, that is, the three pseudo-components, when thepyrolysis is stable, which also reveals the thermal stability andinherent reactivity of the DMAA/MBAM polymer.
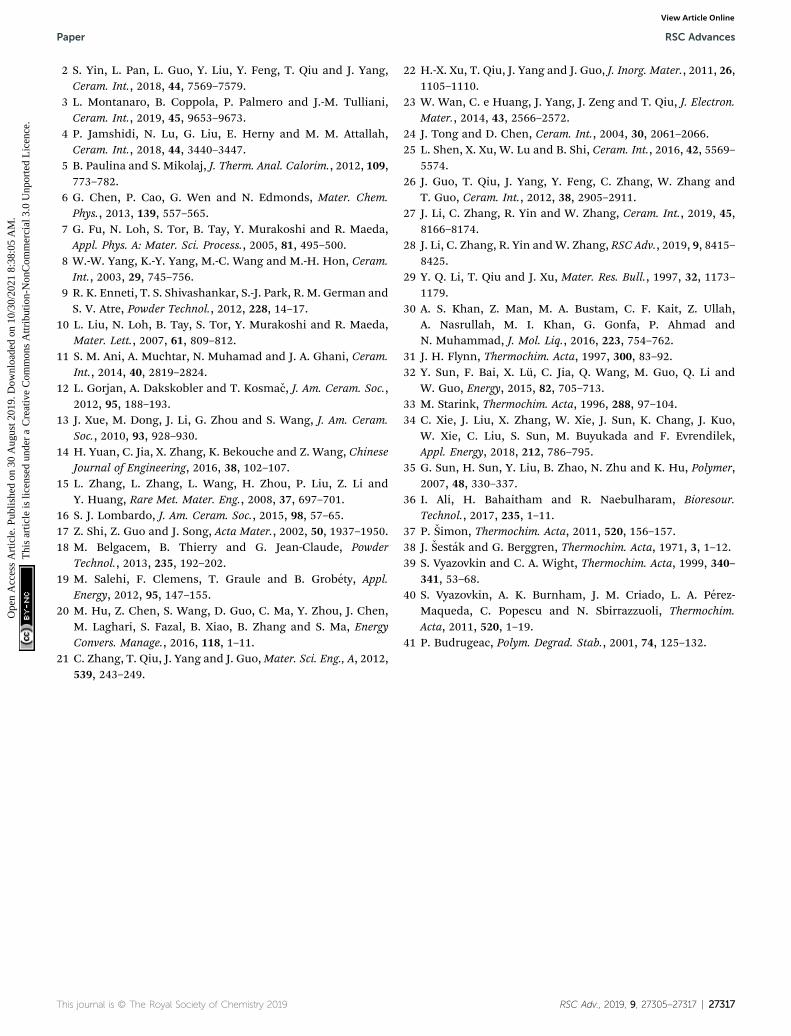
4.5 Model prediction
The comparison between the experimental and SB model pre-dicted a and da/dT curves of the pyrolysis process of the DMAA/MBAM polymer over the whole degradation run at a heating rateof 10 �C min�1 is shown in Fig. 12. It can be seen from Fig. 12that the a and da/dT curves predicted by integral (FWO) anddifferential (Friedman) model-t basically overlap, which indi-cates that the twomethods have similar accuracy with respect tothe SB model. It is also found that the SB model predictedvalues are very close to the experimental a and da/dT values,except at lower (<0.05) and higher (>0.95) conversions. This
erent a values at different heating rates. (a) 2.5 �Cmin�1, (b) 5 �Cmin�1,
RSC Adv., 2019, 9, 27305–27317 | 27315
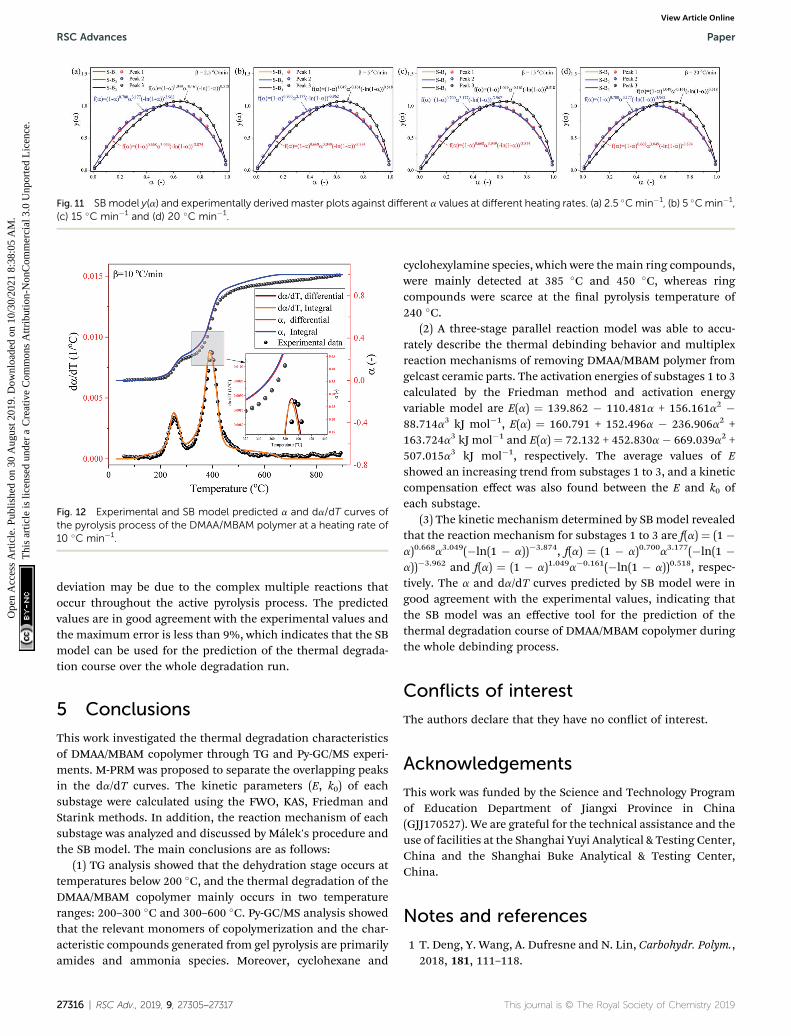
Fig. 11 SBmodel y(a) and experimentally derivedmaster plots against different a values at different heating rates. (a) 2.5 �Cmin�1, (b) 5 �Cmin�1,(c) 15 �C min�1 and (d) 20 �C min�1.
Fig. 12 Experimental and SB model predicted a and da/dT curves ofthe pyrolysis process of the DMAA/MBAM polymer at a heating rate of10 �C min�1.
RSC Advances Paper
Ope
n A
cces
s A
rtic
le. P
ublis
hed
on 3
0 A
ugus
t 201
9. D
ownl
oade
d on
10/
30/2
021
8:38
:05
AM
. T
his
artic
le is
lice
nsed
und
er a
Cre
ativ
e C
omm
ons
Attr
ibut
ion-
Non
Com
mer
cial
3.0
Unp
orte
d L
icen
ce.
View Article Online
deviation may be due to the complex multiple reactions thatoccur throughout the active pyrolysis process. The predictedvalues are in good agreement with the experimental values andthe maximum error is less than 9%, which indicates that the SBmodel can be used for the prediction of the thermal degrada-tion course over the whole degradation run.
5 Conclusions
This work investigated the thermal degradation characteristicsof DMAA/MBAM copolymer through TG and Py-GC/MS experi-ments. M-PRM was proposed to separate the overlapping peaksin the da/dT curves. The kinetic parameters (E, k0) of eachsubstage were calculated using the FWO, KAS, Friedman andStarink methods. In addition, the reaction mechanism of eachsubstage was analyzed and discussed by Malek's procedure andthe SB model. The main conclusions are as follows:
(1) TG analysis showed that the dehydration stage occurs attemperatures below 200 �C, and the thermal degradation of theDMAA/MBAM copolymer mainly occurs in two temperatureranges: 200–300 �C and 300–600 �C. Py-GC/MS analysis showedthat the relevant monomers of copolymerization and the char-acteristic compounds generated from gel pyrolysis are primarilyamides and ammonia species. Moreover, cyclohexane and
27316 | RSC Adv., 2019, 9, 27305–27317
cyclohexylamine species, which were the main ring compounds,were mainly detected at 385 �C and 450 �C, whereas ringcompounds were scarce at the nal pyrolysis temperature of240 �C.
(2) A three-stage parallel reaction model was able to accu-rately describe the thermal debinding behavior and multiplexreaction mechanisms of removing DMAA/MBAM polymer fromgelcast ceramic parts. The activation energies of substages 1 to 3calculated by the Friedman method and activation energyvariable model are E(a) ¼ 139.862 � 110.481a + 156.161a2 �88.714a3 kJ mol�1, E(a) ¼ 160.791 + 152.496a � 236.906a2 +163.724a3 kJ mol�1 and E(a) ¼ 72.132 + 452.830a � 669.039a2 +507.015a3 kJ mol�1, respectively. The average values of Eshowed an increasing trend from substages 1 to 3, and a kineticcompensation effect was also found between the E and k0 ofeach substage.
(3) The kinetic mechanism determined by SB model revealedthat the reaction mechanism for substages 1 to 3 are f(a) ¼ (1 �a)0.668a3.049(�ln(1 � a))�3.874, f(a) ¼ (1 � a)0.700a3.177(�ln(1 �a))�3.962 and f(a) ¼ (1 � a)1.049a�0.161(�ln(1 � a))0.518, respec-tively. The a and da/dT curves predicted by SB model were ingood agreement with the experimental values, indicating thatthe SB model was an effective tool for the prediction of thethermal degradation course of DMAA/MBAM copolymer duringthe whole debinding process.
Conflicts of interest
The authors declare that they have no conict of interest.
Acknowledgements
This work was funded by the Science and Technology Programof Education Department of Jiangxi Province in China(GJJ170527). We are grateful for the technical assistance and theuse of facilities at the Shanghai Yuyi Analytical & Testing Center,China and the Shanghai Buke Analytical & Testing Center,China.
Notes and references
1 T. Deng, Y. Wang, A. Dufresne and N. Lin, Carbohydr. Polym.,2018, 181, 111–118.
This journal is © The Royal Society of Chemistry 2019
Paper RSC Advances
Ope
n A
cces
s A
rtic
le. P
ublis
hed
on 3
0 A
ugus
t 201
9. D
ownl
oade
d on
10/
30/2
021
8:38
:05
AM
. T
his
artic
le is
lice
nsed
und
er a
Cre
ativ
e C
omm
ons
Attr
ibut
ion-
Non
Com
mer
cial
3.0
Unp
orte
d L
icen
ce.
View Article Online
2 S. Yin, L. Pan, L. Guo, Y. Liu, Y. Feng, T. Qiu and J. Yang,Ceram. Int., 2018, 44, 7569–7579.
3 L. Montanaro, B. Coppola, P. Palmero and J.-M. Tulliani,Ceram. Int., 2019, 45, 9653–9673.
4 P. Jamshidi, N. Lu, G. Liu, E. Herny and M. M. Attallah,Ceram. Int., 2018, 44, 3440–3447.
5 B. Paulina and S. Mikolaj, J. Therm. Anal. Calorim., 2012, 109,773–782.
6 G. Chen, P. Cao, G. Wen and N. Edmonds, Mater. Chem.Phys., 2013, 139, 557–565.
7 G. Fu, N. Loh, S. Tor, B. Tay, Y. Murakoshi and R. Maeda,Appl. Phys. A: Mater. Sci. Process., 2005, 81, 495–500.
8 W.-W. Yang, K.-Y. Yang, M.-C. Wang and M.-H. Hon, Ceram.Int., 2003, 29, 745–756.
9 R. K. Enneti, T. S. Shivashankar, S.-J. Park, R. M. German andS. V. Atre, Powder Technol., 2012, 228, 14–17.
10 L. Liu, N. Loh, B. Tay, S. Tor, Y. Murakoshi and R. Maeda,Mater. Lett., 2007, 61, 809–812.
11 S. M. Ani, A. Muchtar, N. Muhamad and J. A. Ghani, Ceram.Int., 2014, 40, 2819–2824.
12 L. Gorjan, A. Dakskobler and T. Kosmac, J. Am. Ceram. Soc.,2012, 95, 188–193.
13 J. Xue, M. Dong, J. Li, G. Zhou and S. Wang, J. Am. Ceram.Soc., 2010, 93, 928–930.
14 H. Yuan, C. Jia, X. Zhang, K. Bekouche and Z. Wang, ChineseJournal of Engineering, 2016, 38, 102–107.
15 L. Zhang, L. Zhang, L. Wang, H. Zhou, P. Liu, Z. Li andY. Huang, Rare Met. Mater. Eng., 2008, 37, 697–701.
16 S. J. Lombardo, J. Am. Ceram. Soc., 2015, 98, 57–65.17 Z. Shi, Z. Guo and J. Song, Acta Mater., 2002, 50, 1937–1950.18 M. Belgacem, B. Thierry and G. Jean-Claude, Powder
Technol., 2013, 235, 192–202.19 M. Salehi, F. Clemens, T. Graule and B. Grobety, Appl.
Energy, 2012, 95, 147–155.20 M. Hu, Z. Chen, S. Wang, D. Guo, C. Ma, Y. Zhou, J. Chen,
M. Laghari, S. Fazal, B. Xiao, B. Zhang and S. Ma, EnergyConvers. Manage., 2016, 118, 1–11.
21 C. Zhang, T. Qiu, J. Yang and J. Guo,Mater. Sci. Eng., A, 2012,539, 243–249.
This journal is © The Royal Society of Chemistry 2019
22 H.-X. Xu, T. Qiu, J. Yang and J. Guo, J. Inorg. Mater., 2011, 26,1105–1110.
23 W. Wan, C. e Huang, J. Yang, J. Zeng and T. Qiu, J. Electron.Mater., 2014, 43, 2566–2572.
24 J. Tong and D. Chen, Ceram. Int., 2004, 30, 2061–2066.25 L. Shen, X. Xu, W. Lu and B. Shi, Ceram. Int., 2016, 42, 5569–
5574.26 J. Guo, T. Qiu, J. Yang, Y. Feng, C. Zhang, W. Zhang and
T. Guo, Ceram. Int., 2012, 38, 2905–2911.27 J. Li, C. Zhang, R. Yin and W. Zhang, Ceram. Int., 2019, 45,
8166–8174.28 J. Li, C. Zhang, R. Yin andW. Zhang, RSC Adv., 2019, 9, 8415–
8425.29 Y. Q. Li, T. Qiu and J. Xu, Mater. Res. Bull., 1997, 32, 1173–
1179.30 A. S. Khan, Z. Man, M. A. Bustam, C. F. Kait, Z. Ullah,
A. Nasrullah, M. I. Khan, G. Gonfa, P. Ahmad andN. Muhammad, J. Mol. Liq., 2016, 223, 754–762.
31 J. H. Flynn, Thermochim. Acta, 1997, 300, 83–92.32 Y. Sun, F. Bai, X. Lu, C. Jia, Q. Wang, M. Guo, Q. Li and
W. Guo, Energy, 2015, 82, 705–713.33 M. Starink, Thermochim. Acta, 1996, 288, 97–104.34 C. Xie, J. Liu, X. Zhang, W. Xie, J. Sun, K. Chang, J. Kuo,
W. Xie, C. Liu, S. Sun, M. Buyukada and F. Evrendilek,Appl. Energy, 2018, 212, 786–795.
35 G. Sun, H. Sun, Y. Liu, B. Zhao, N. Zhu and K. Hu, Polymer,2007, 48, 330–337.
36 I. Ali, H. Bahaitham and R. Naebulharam, Bioresour.Technol., 2017, 235, 1–11.
37 P. Simon, Thermochim. Acta, 2011, 520, 156–157.38 J. Sestak and G. Berggren, Thermochim. Acta, 1971, 3, 1–12.39 S. Vyazovkin and C. A. Wight, Thermochim. Acta, 1999, 340–
341, 53–68.40 S. Vyazovkin, A. K. Burnham, J. M. Criado, L. A. Perez-
Maqueda, C. Popescu and N. Sbirrazzuoli, Thermochim.Acta, 2011, 520, 1–19.
41 P. Budrugeac, Polym. Degrad. Stab., 2001, 74, 125–132.
RSC Adv., 2019, 9, 27305–27317 | 27317