Embed Size (px)
Citation preview
Multiple Phases of Chondrocyte Enlargement Underlie Differences in Skeletal Proportions
CitationCooper, Kimberly L., Seungeun Oh, Yongjin Sung, Ramachandra R. Dasari, Marc W. Kirschner, and Clifford J. Tabin. 2013. “Multiple Phases of Chondrocyte Enlargement Underlie Differences in Skeletal Proportions.” Nature 495 (7441): 375-378. doi:10.1038/nature11940. http://dx.doi.org/10.1038/nature11940.
Published Versiondoi:10.1038/nature11940
Permanent linkhttp://nrs.harvard.edu/urn-3:HUL.InstRepos:11877135
Terms of UseThis article was downloaded from Harvard University’s DASH repository, and is made available under the terms and conditions applicable to Other Posted Material, as set forth at http://nrs.harvard.edu/urn-3:HUL.InstRepos:dash.current.terms-of-use#LAA
Share Your StoryThe Harvard community has made this article openly available.Please share how this access benefits you. Submit a story .
Accessibility
Multiple Phases of Chondrocyte Enlargement UnderlieDifferences in Skeletal Proportions
Kimberly L. Cooper1,‡,*, Seungeun Oh2,*, Yongjin Sung3, Ramachandra R. Dasari3, Marc W.Kirschner2, and Clifford J. Tabin1
1Department of Genetics, Harvard Medical School, Boston, Massachusetts 02115, USA2Department of Systems Biology, Harvard Medical School, Boston, Massachusetts 02115, USA3George R. Harrison Spectroscopy Laboratory, Massachusetts Institute of Technology,Cambridge, Massachusetts 02139, USA
AbstractEven a casual pass through the great halls of mammals in the world’s natural history museumshighlights the wide diversity of skeletal proportions that allow us to distinguish between specieseven when reduced to their calcified components. Similarly each individual is comprised of avariety of bones of differing lengths. The largest contribution to the lengthening of a skeletalelement, and to the differential elongation of elements, comes from a dramatic increase in thevolume of hypertrophic chondrocytes in the growth plate as they undergo terminaldifferentiation1–7. Despite this recognized importance, the mechanisms of chondrocyte volumeenlargement have remained a mystery8–11. Here we use quantitative phase microscopy12 to showthat chondrocytes undergo three distinct phases of volume increase, including a phase of massivecell swelling in which the cellular dry mass is significantly diluted. In light of the tight fluidregulatory mechanisms known to control volume in many cell types13, this stands as a remarkablemechanism for increasing cell size and regulating growth rate. It is, however, the duration of thefinal phase of volume enlargement by proportional dry mass increase at low density that variesmost between rapidly and slowly elongating growth plates. Moreover, we find that this third phaseis locally regulated through an Insulin-like Growth Factor-dependent mechanism. This studyprovides a framework for understanding how skeletal size is regulated and for exploring how cellssense, modify, and establish a volume set point.
Each of the long bones initially forms in the embryo as a similarly sized cartilage rudimentthat only subsequently undergoes differential regulation of growth. The elongation of askeletal element occurs at the growth plate14,15, each consisting of three distinct zones:resting round chondrocytes near the end of an element give rise to clonal columns offlattened proliferating chondrocytes that then terminally differentiate into hypertrophicchondrocytes nearest the bony center of an element. While multiple cellular parameterscontribute to lengthening of skeletal elements - including proliferation, matrix deposition,and hypertrophic cell enlargement - the greatest contribution to growth rate in mammals isdue to the massive volume enlargement of hypertrophic chondrocytes expanding the skeletal
‡Author for correspondence: [email protected].*These authors contributed equally to this work.
K.L.C. and S.O. conceived of the project and carried out the majority of the experiments. Y.S. and D.R. carried out criticalspectroscopic experiments validating the primary approaches taken. C.J.T. and M.W.K. supervised the project. K.L.C., S.O., M.W.K.and C.J.T. wrote the manuscript.
The authors declare no competing financial interests.
NIH Public AccessAuthor ManuscriptNature. Author manuscript; available in PMC 2013 September 21.
Published in final edited form as:Nature. 2013 March 21; 495(7441): 375–378. doi:10.1038/nature11940.
NIH
-PA Author Manuscript
NIH
-PA Author Manuscript
NIH
-PA Author Manuscript
tissue in the direction of longitudinal growth within laterally restricting matrix channels1–3.In addition to being the largest contributor to the elongation rate of a given skeletal element,this parameter is largely responsible for the difference in growth rates between differentskeletal elements within an individual, between homologous elements in different species,and within a single element as an animal ages4–7. Surprisingly, however, given its criticalimportance in determining the growth rate of each bone and the overall stature of theindividual, the mechanism is poorly understood. It even remains unclear whetherhypertrophic chondrocyte volume increases by true hypertrophy, maintaining constantdensity during growth through an increase in macromolecules and organelles, or by cellswelling via disproportionate fluid uptake which is ordinarily a hallmark of disease13.
To determine whether hypertrophic chondrocytes enlarge by cellular hypertrophy and/orswelling, we applied methods of diffraction phase microscopy to measure the dry mass ofindividual unstained live cells dissociated from growth plate cartilage. (Fig. 1a;Supplementary Methods)16. Together with volume information about the sample, calculatedhere based on a well-supported spherical approximation for dissociated chondrocytes(Supplementary Methods), this allows the calculation of dry mass density. Diffraction phasemicroscopy measurements of a variety of cell types consistently reflect a “normal” dry massdensity for healthy living cells at approximately 0.182 pg/fl in agreement with theconcentration of cytoplasm previously determined by index matching in human oralepithelial cells17. This includes maturing megakaryocytes that reach volumes comparable tothe largest hypertrophic chondrocytes and ten-times the average somatic cell volume(Supplementary Fig. S1).
In contrast, analysis of chondrocytes from the rapidly elongating mouse proximal tibiareveals that there are three distinct phases of hypertrophic cell enlargement. 1) An initialincrease of about 3-fold from approximately 600 fl to 2000 fl is characterized by truehypertrophy - a proportionate increase in dry mass production and fluid uptake thusmaintaining the normal dry mass density at 0.183 pg/fl (Fig. 1b, c). 2) A second phase wherea 4-fold enlargement from about 2000 fl to 8000 fl is characterized by cell swelling. Volumeincreases at a rate disproportionate to the continuing rate of dry mass production resulting ina dramatic dilution of dry mass density to approximately 0.07 pg/fl (Fig. 1c). 3) At volumeslarger than 8000 fl, the dry mass density once again stabilizes, and cells continue to enlargeanother 2-fold to about 14,000 fl by proportionately increasing dry mass and fluid volume atthis lower density (Fig. 1d). Swelling in Phase 2 allows cells to reach volumes two to threetimes greater in Phase 3 than if they relied entirely on the proportionate increase in dry massat high density (Fig. 1b, linear regression).
To verify that this decrease in density is characteristic of hypertrophic differentiation, weimaged a subset of the small high-density cells and large low-density cells using regularizedtomographic phase microscopy to generate a refractive index map of dry mass density inthree-dimensions (Supplementary Methods). This independent approach confirms that thelargest cells reduce their dry mass density by approximately 60%, and moreover indicatesthat dry mass is low throughout the cytoplasm with a slightly higher density ring around thenucleus (Fig. 1e, f; Supplementary Fig. S14).
Understanding the cellular process by which hypertrophic cells enlarge provides aframework for considering how that process is modulated to achieve differential growth ofindividual elements within a species and of homologous elements between species. Incontrast to the large hypertrophic chondrocytes of the rapidly elongating proximal tibia, theslowly elongating proximal radius has much smaller hypertrophic chondrocytes1. We findthat these cells go through Phase 1 and enter Phase 2 similar to the cells of the proximaltibia, reaching a volume of approximately 5,000 fl. However, they truncate the remainder of
Cooper et al. Page 2
Nature. Author manuscript; available in PMC 2013 September 21.
NIH
-PA Author Manuscript
NIH
-PA Author Manuscript
NIH
-PA Author Manuscript
Phase 2 after dilution of dry mass density to approximately 0.10 pg/fl and completelyeliminate Phase 3 (Fig. 2a).
We next compared growth plates of the mouse to those of the jerboa, a small bipedal rodentwith greatly elongated hindlimbs. In particular, the metatarsals of the feet rapidly elongateduring early postnatal development to approximately 2.5 times the relative proportion ofmouse metatarsals18. The mouse distal metatarsal growth plate is intermediate in its growthrate and hypertrophic chondrocyte size relative to the proximal tibia and radius (Fig. 2b;Supplementary Fig. S2). While other aspects of the jerboa distal metatarsal growth plate arealso altered, including the total cell number in each zone (Supplementary Fig. S3), the heightof individual hypertrophic chondrocytes is increased by 58% compared to those in thehomologous growth plate of the mouse suggesting a significant contribution of hypertrophicchondrocyte volume to the increased rate of growth of this element (Fig. 2b, e, f). Incontrast, the jerboa tibia hypertrophic chondrocytes are only slightly larger than theircounterparts in the mouse (Fig. 2b, c, d). Unlike the metatarsals, the metacarpals of thejerboa forelimb, as well as other bones of the forelimb, are similar in size and proportions tothose of the mouse with hypertrophic chondrocytes of comparable size (Fig. 2b).
The hypertrophic chondrocytes of the jerboa proximal tibia show very similar growthproperties to those of the mouse when examined by diffraction phase microscopy, includingall three phases of volume enlargement (Supplementary Fig. S4). However, there is astriking difference between the metatarsal chondrocytes of the two species. Mousemetatarsal hypertrophic chondrocytes are indeed intermediate in size between the proximalradius and proximal tibia, reaching a maximum volume of about 8000 fl by completingPhases 1 and 2 and truncating Phase 3 (Fig. 2g). Hypertrophic chondrocytes of the jerboametatarsals increase almost 40-fold from their initial volume to approximately 23,000 fl,greater than the volume of tibia chondrocytes in either species (Fig. 2h). This isaccomplished by following the same tri-phasic growth trajectory common to chondrocytesof other growth plates and then extending Phase 3 to reach a maximal volume by continuedproportionate increase in dry mass and fluid volume at low dry mass density.
Little is known about the molecular mechanisms that control chondrocyte enlargement, orthe regulation of final cell size, since few of the mutants affecting skeletal development havebeen examined for size of individual hypertrophic chondrocytes. An intriguing exception isthe null mutation of the gene encoding Insulin-like Growth Factor 1 (Igf1)19. Igf1 functionsin a variety of target tissues to promote protein synthesis and cell growth19,20 and is stronglyexpressed in both proliferating and pre-hypertrophic chondrocytes. Igf1-deficient mice are35% smaller than controls but have the same number of hypertrophic chondrocytes, thougheach cell is 30% shorter in the direction of elongation, a finding we confirmed in mice wherethe floxed Igf1tm1Dlr allele21 was conditionally deleted from the hindlimb using HoxB6-Cre22 (Fig. 3a–c). It is additionally intriguing to note that there is no distinction between theheights of chondrocytes in the proximal tibia and distal metatarsal of this mutant (Fig. 3c)indicating that Igf1 may play an important role in the establishment of growth platedependent cell size. While this effect could be modulated by any member of the Igf1signaling pathway, evidence suggests a possible role for the receptor, Igf1R, that maintainshigher levels of expression over time in growth plates that continue to elongate at faster ratesin maturing mice23.
We employed diffraction phase microscopy to determine which phase(s) of volumeenlargement are affected by Igf1. Igf1-deficient hypertrophic chondrocytes undergo normalPhase 1 and Phase 2 of enlargement, reaching approximately 7000 fl largely by cellswelling, but do not progress to Phase 3 and thus fail to further double their volume by thecontinued production of dry mass at low density (Fig. 3d–f). Taken together, our results
Cooper et al. Page 3
Nature. Author manuscript; available in PMC 2013 September 21.
NIH
-PA Author Manuscript
NIH
-PA Author Manuscript
NIH
-PA Author Manuscript
indicate that there are three distinct phases of chondrocyte hypertrophy, and it is regulationof the Igf1-dependent third phase that is responsible for much of the variation in skeletalelongation rate.
Finally, previous studies of the neonatal bat and mouse forelimb suggested that the entirehypertrophic zone of each growth plate turns over once in about 24 hours regardless of themaximum volume attained by individual chondrocytes, the number of hypertrophicchondrocytes, or rate of growth plate elongation7. This suggests that growth plateselongating at different rates adjust the rate of cell volume increase to fall within a 24-hourlifespan constraint. To assess the pace of cellular maturation and enlargement, we markedproliferating chondrocytes with BrdU and followed the progression of the first labeled cellsto emerge into the postmitotic hypertrophic columns onward to the chondro-osseousjunction (Supplementary Fig. S5). We find that the rate of cell height increase in bothgrowth plates is extremely rapid, more than tripling the height of proximal tibiachondrocytes within approximately 12 hours (Fig. 4a). Once cells reach their average finalheight, with a steeper slope in the larger cells of the tibia, they remain at this terminal size inthe hypertrophic growth columns for an additional 12 hours before turnover at the chondro-osseous junction.
Through coordination of this multiphase process, cell swelling allows chondrocytes toenlarge extraordinarily rapidly while presumably lowering the energetic cost of growth, andvolumes are subsequently amplified in the most rapidly elongating skeletal elements by thecontinued Igf1-dependent production of mass. This unique mechanism of volumeenlargement suggests that chondrocyte hypertrophy will serve as a valuable model for cellvolume homeostasis, in addition to our findings that provide insight into skeletalmorphogenesis and evolution.
Full MethodsAnimals
CD-1 was chosen as the wild type mouse strain for this study. Igf1tm1Dlr conditional mice21
and HoxB6-Cre transgenic mice22 were previously described. Jerboas were housed andreared as previously described24. All animal protocols were approved by the HarvardMedical Area Standing Committee on Animals.
Sectioning and histologyDissected skeletal elements were fixed overnight at 4°C in 4% paraformaldehyde and thencarried through a graded series of ethanol dehydration washes before transition throughxylenes and into paraffin wax. Sections were cut at 10–12 μm thickness and stained withhematoxylin and eosine. Average maximum cell heights were measured in the axis of lineargrowth through the lacunae surrounding the largest cells with a clear nuclear profile fromdigital images of the hypertrophic zone and averaged across at least 4 sections from at least3 individuals. Bromodeoxyuridine (100 mg/kg) or oxytetracycline hydrochloride (20 mg/kg)was injected into the peritoneum of postnatal day 5 mice before harvest. BrdU was detectedusing a rat anti BrdU (AbD Serotech) followed by goat anti-rat Alexa594 (Invitrogen) inparaffin sections. Oxytetracycline was detected by fluorescence in bisected skeletalelements.
Chondrocyte and megakaryocyte isolationPostnatal day 5 animals were chosen for this study because the tibia and metatarsal growthplates are rapidly elongating in both species, but the metatarsal epiphysis (secondaryossification center) has not yet formed. While the epiphysis of the metatarsal forms by P7 in
Cooper et al. Page 4
Nature. Author manuscript; available in PMC 2013 September 21.
NIH
-PA Author Manuscript
NIH
-PA Author Manuscript
NIH
-PA Author Manuscript
the mouse, it appears later in the jerboa (Fig. S3). Since the hypertrophic chondrocytesreside in a small domain nearest the chondro-osseous junction, we enriched for these cellsby using a razor blade to remove a majority of the cartilage containing resting andproliferative chondrocytes leaving the cells closest to the chondro-osseous junction and asmall amount of the adjacent trabecular bone. Growth plates were bisected longitudinallyand incubated for 45 minutes at 37°C in 2 mg/ml Collagenase D (Roche) in DMEM/F12(Invitrogen, 290–330 mOsm) plus 10% fetal calf serum. After the initial incubation, thebone collar, trabecular bone, and loosened connective tissues were manually removed withforceps, and the remaining cartilage fragments were transferred to a fresh dish ofcollagenase digestion media. Cells were incubated for an additional 2–3 hours withoccasional swirling until cells mostly dissociated from the surrounding matrix. Dissociatedchondrocytes were transferred to 35 mm dishes with a 14 mm diameter, 1.5-thickness glassbottom (MatTek) and imaged immediately. The largest hypertrophic chondrocytes are asmall population of the most mature cells, therefore we further enriched for this populationin our data analysis by scanning for fields of view containing the largest cells in the dish andquantified all of the intact spherical neighbors.
There has been a longstanding discussion in the literature regarding the extracellularosmolarity of chondrocytes, primarily in the articular cartilage9,10,25,26. Much of this data isbased on the theoretical ionic environment in association with charged glycosaminoglycansaccording to the Donnan-Gibbs equilibrium, though to our knowledge the extracellularosmolarity of growth plate cartilage has not been directly measured. While serum osmolarityis approximately 280 mOsm, the osmolarity in association with cartilage may be upwards of400 mOsm. To address the possibility that the swelling we observe in chondrocytes at largervolumes may be the response to media of low osmolarity, we repeated the diffraction phasemicroscopy measurements in mouse proximal tibia growth plates dissociated in 424 mOsmDMEM/F12 raised with sucrose. Media osmolarity was measured using the Vapro Model5600 (Wescor, Inc). We find the same three phases, including the phase of cell swelling,indicating this is an inherent property of growth plate chondrocytes and not the passiveresponse to an abnormal osmotic environment (Fig. S6). We presume that the 4 hours fromdissection to imaging is enough time for volume regulatory mechanisms to compensate forany response to osmotic stress that may have occurred. Indeed, 4-D confocal imaging of insitu porcine articular chondrocytes after osmotic stress shows a mean recovery rate of 4.1%±1.8%/min with 96% volume recovery after about 12 minutes27.
Fetal megakaryocytes were isolated from embryonic day 14.5 mouse livers according topreviously published protocols28,29 or generously donated by Dr. Annouck Luyten and Dr.Ramesh Shivdasani. Cells were imaged by DPM one day after harvest or at maturity afterfive days in culture.
Supplementary MaterialRefer to Web version on PubMed Central for supplementary material.
AcknowledgmentsWe would like to thank T.J. Mitchison, C.E. Farnum, and members of the Developmental Bone Morphogenesisprogram project grant (NIH) for helpful discussions. We also thank the Nikon Imaging Center at Harvard MedicalSchool for technical support, A. Luyten and R. Shivdasani for providing mouse megakaryocytes, and P. Ramirezfor jerboa care. This work was supported by National Institutes of Health (NIH) grants P01DK056246 to C.J.T,R01GM026875 to M.W.K., and by NIH grant P41RR02594, National Science Foundation (NSF) grantDBI0754339 and support from the Hamamatsu Corporation to R.R.D.
Cooper et al. Page 5
Nature. Author manuscript; available in PMC 2013 September 21.
NIH
-PA Author Manuscript
NIH
-PA Author Manuscript
NIH
-PA Author Manuscript
References1. Wilsman NJ, Farnum CE, Leiferman EM, Fry M, Barreto C. Differential growth by growth plates as
a function of multiple parameters of chondrocytic kinetics. J Orthop Res. 1996; 14:927–36.[PubMed: 8982136]
2. Hunziker EB, Schenk RK, Cruz-Orive LM. Quantitation of chondrocyte performance in growth-plate cartilage during longitudinal bone growth. J Bone Joint Surg Am. 1987; 69:162–173.[PubMed: 3543020]
3. Hunziker EB, Schenk RK. Physiological mechanisms adopted by chondrocytes in regulatinglongitudinal bone growth in rats. J Physiol (Lond ). 1989; 414:55–71. [PubMed: 2607442]
4. Breur GJ, VanEnkevort BA, Farnum CE, Wilsman NJ. Linear relationship between the volume ofhypertrophic chondrocytes and the rate of longitudinal bone growth in growth plates. J Orthop Res.1991; 9:348–359. [PubMed: 2010838]
5. Kuhn JL, Delacey JH, Leenellett EE. Relationship between bone growth rate and hypertrophicchondrocyte volume in new zealand white rabbits of varying ages. Journal of Orthopaedic Research.1996; 14:706–711. [PubMed: 8893762]
6. Wilsman NJ, Bernardini ES, Leiferman E, Noonan K, Farnum CE. Age and pattern of the onset ofdifferential growth among growth plates in rats. J Orthop Res. 2008; 26:1457–1465. [PubMed:18404738]
7. Farnum CE, Tinsley M, Hermanson JW. Forelimb versus Hindlimb Skeletal Development in the BigBrown Bat, Eptesicus fuscus: Functional Divergence Is Reflected in Chondrocytic Performance inAutopodial Growth Plates. Cells Tissues Organs. 2008; 187:35–47. [PubMed: 18160801]
8. Buckwalter JA, Mower D, Ungar R, Schaeffer J, Ginsberg B. Morphometric analysis of chondrocytehypertrophy. J Bone Joint Surg Am. 1986; 68:243–255. [PubMed: 3944163]
9. Farnum CE, Lee R, O’Hara K, Urban JPG. Volume increase in growth plate chondrocytes duringhypertrophy: the contribution of organic osmolytes. Bone. 2002; 30:574–581. [PubMed: 11934648]
10. Bush PG, Parisinos CA, Hall AC. The osmotic sensitivity of rat growth plate chondrocytes in situ;clarifying the mechanisms of hypertrophy. J Cell Physiol. 2008; 214:621–629. [PubMed:17786946]
11. Bush PG, Pritchard M, Loqman MY, Damron TA, Hall AC. A key role for membrane transporterNKCC1 in mediating chondrocyte volume increase in the mammalian growth plate. J Bone MinerRes. 2010; 25:1594–1603. [PubMed: 20200963]
12. Barer R. Interference microscopy and mass determination. Nature. 1952; 169:366–367. [PubMed:14919571]
13. Hoffmann EK, Lambert IH, Pedersen SF. Physiology of cell volume regulation in vertebrates.Physiol Rev. 2009; 89:193–277. [PubMed: 19126758]
14. Hunziker EB. Mechanism of longitudinal bone growth and its regulation by growth platechondrocytes. Microsc Res Tech. 1994; 28:505–519. [PubMed: 7949396]
15. Kronenberg H. Developmental regulation of the growth plate. Nature. 2003; 423:332–336.[PubMed: 12748651]
16. Popescu G, Ikeda T, Dasari RR, Feld MS. Diffraction phase microscopy for quantifying cellstructure and dynamics. Opt Lett. 2006; 31:775–777. [PubMed: 16544620]
17. Barer R. Determination of Dry Mass, Thickness, Solid and Water Concentration in Living Cells.Nature. 1953; 172:1097–1098. [PubMed: 13111263]
18. Cooper KL. The lesser Egyptian jerboa, Jaculus jaculus: a unique rodent model for evolution anddevelopment. Cold Spring Harb Protoc. 2011; 2011:1451–1456. [PubMed: 22135653]
19. Wang J, Zhou J, Bondy CA. Igf1 promotes longitudinal bone growth by insulin-like actionsaugmenting chondrocyte hypertrophy. FASEB J. 1999; 13:1985–1990. [PubMed: 10544181]
20. Oldham S, Hafen E. Insulin/IGF and target of rapamycin signaling: a TOR de force in growthcontrol. Trends in Cell Biology. 2003; 13:79–85. [PubMed: 12559758]
21. Yakar S. Normal growth and development in the absence of hepatic insulin-like growth factor I.Proceedings of the National Academy of Sciences. 1999; 96:7324–7329.
Cooper et al. Page 6
Nature. Author manuscript; available in PMC 2013 September 21.
NIH
-PA Author Manuscript
NIH
-PA Author Manuscript
NIH
-PA Author Manuscript
22. Lowe LA, Yamada S, Kuehn MR. HoxB6-Cre transgenic mice express Cre recombinase in extraembryonic mesoderm, in lateral plate and limb mesoderm and at the midbrain/hindbrain junction.genesis. 2000; 26:118–120. [PubMed: 10686603]
23. Serrat MA, Lovejoy CO, King D. Age- and site-specific decline in insulin-like growth factor-Ireceptor expression is correlated with differential growth plate activity in the mouse hindlimb.Anat Rec (Hoboken). 2007; 290:375–381. [PubMed: 17514762]
24. Jordan B, Vercammen P, Cooper KL. Husbandry and breeding of the lesser Egyptian Jerboa,Jaculus jaculus. Cold Spring Harb Protoc. 2011; 2011:1457–1461. [PubMed: 22135654]
25. Maroudas A, Evans H. A Study of Ionic Equilibria in Cartilage. Connective Tissue Research.1972; 1:69–77.
26. Urban JPG, Hall AC, Gehl KA. Regulation of matrix synthesis rates by the ionic and osmoticenvironment of articular chondrocytes. Journal of Cellular Physiology. 1993; 154:262–270.[PubMed: 8425907]
27. Errington RJ, Fricker MD, Wood JL, Hall AC, White NS. Four-dimensional imaging of livingchondrocytes in cartilage using confocal microscopy: a pragmatic approach. Am J Physiol. 1997;272:C1040–1051. [PubMed: 9124506]
28. Lecine P, Blank V, Shivdasani R. Characterization of the hematopoietic transcription factor NF-E2in primary murine megakaryocytes. J Biol Chem. 1998; 273:7572–7578. [PubMed: 9516460]
29. Shivdasani, RA.; Schulze, H. Culture, Expansion, and Differentiation of Murine Megakaryocytes.
Cooper et al. Page 7
Nature. Author manuscript; available in PMC 2013 September 21.
NIH
-PA Author Manuscript
NIH
-PA Author Manuscript
NIH
-PA Author Manuscript
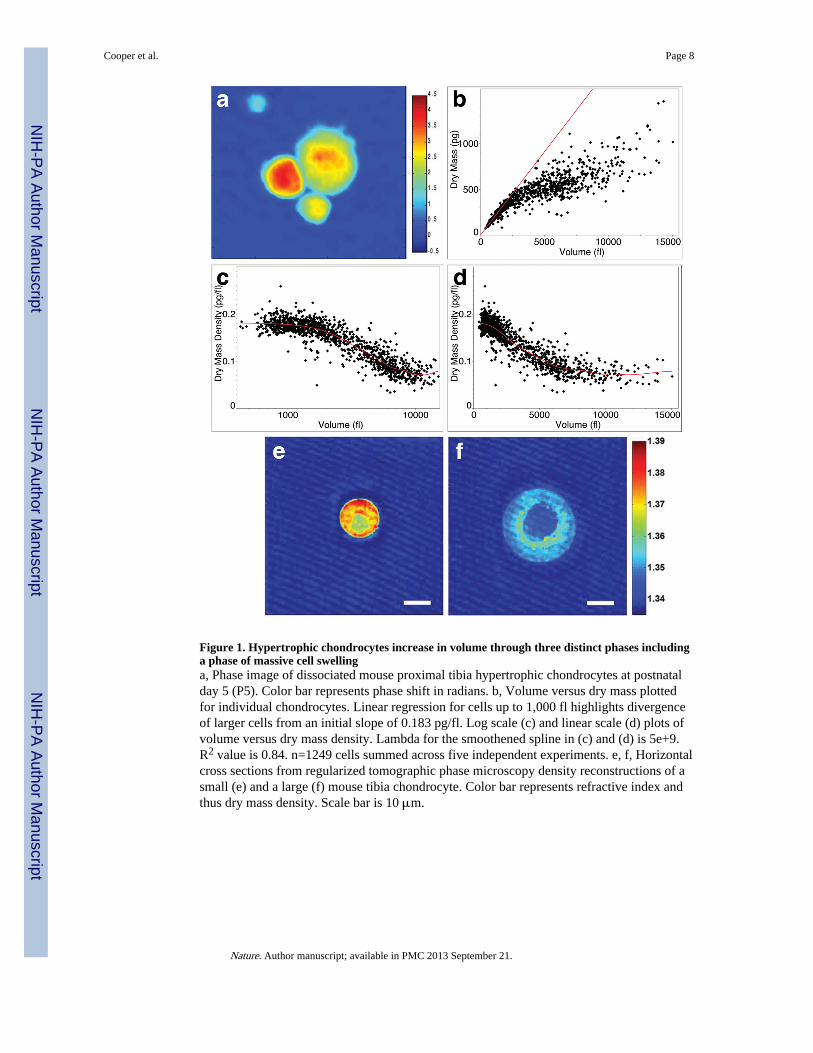
Figure 1. Hypertrophic chondrocytes increase in volume through three distinct phases includinga phase of massive cell swellinga, Phase image of dissociated mouse proximal tibia hypertrophic chondrocytes at postnatalday 5 (P5). Color bar represents phase shift in radians. b, Volume versus dry mass plottedfor individual chondrocytes. Linear regression for cells up to 1,000 fl highlights divergenceof larger cells from an initial slope of 0.183 pg/fl. Log scale (c) and linear scale (d) plots ofvolume versus dry mass density. Lambda for the smoothened spline in (c) and (d) is 5e+9.R2 value is 0.84. n=1249 cells summed across five independent experiments. e, f, Horizontalcross sections from regularized tomographic phase microscopy density reconstructions of asmall (e) and a large (f) mouse tibia chondrocyte. Color bar represents refractive index andthus dry mass density. Scale bar is 10 μm.
Cooper et al. Page 8
Nature. Author manuscript; available in PMC 2013 September 21.
NIH
-PA Author Manuscript
NIH
-PA Author Manuscript
NIH
-PA Author Manuscript
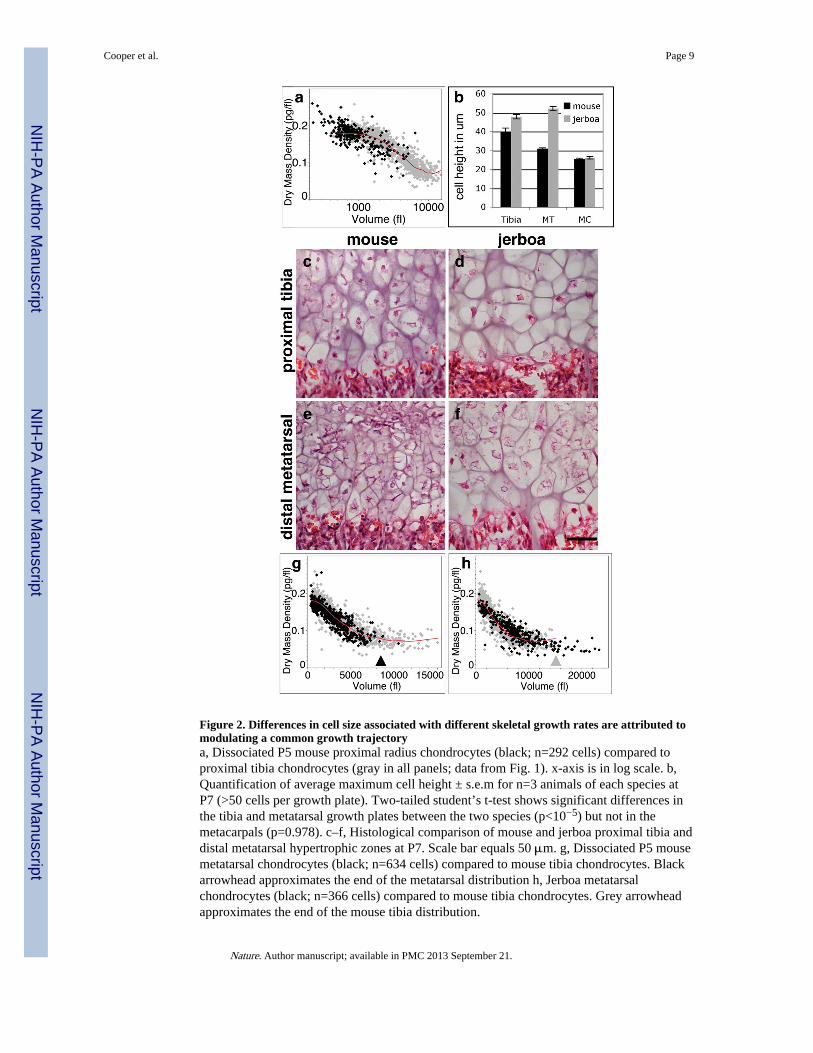
Figure 2. Differences in cell size associated with different skeletal growth rates are attributed tomodulating a common growth trajectorya, Dissociated P5 mouse proximal radius chondrocytes (black; n=292 cells) compared toproximal tibia chondrocytes (gray in all panels; data from Fig. 1). x-axis is in log scale. b,Quantification of average maximum cell height ± s.e.m for n=3 animals of each species atP7 (>50 cells per growth plate). Two-tailed student’s t-test shows significant differences inthe tibia and metatarsal growth plates between the two species (p<10−5) but not in themetacarpals (p=0.978). c–f, Histological comparison of mouse and jerboa proximal tibia anddistal metatarsal hypertrophic zones at P7. Scale bar equals 50 μm. g, Dissociated P5 mousemetatarsal chondrocytes (black; n=634 cells) compared to mouse tibia chondrocytes. Blackarrowhead approximates the end of the metatarsal distribution h, Jerboa metatarsalchondrocytes (black; n=366 cells) compared to mouse tibia chondrocytes. Grey arrowheadapproximates the end of the mouse tibia distribution.
Cooper et al. Page 9
Nature. Author manuscript; available in PMC 2013 September 21.
NIH
-PA Author Manuscript
NIH
-PA Author Manuscript
NIH
-PA Author Manuscript
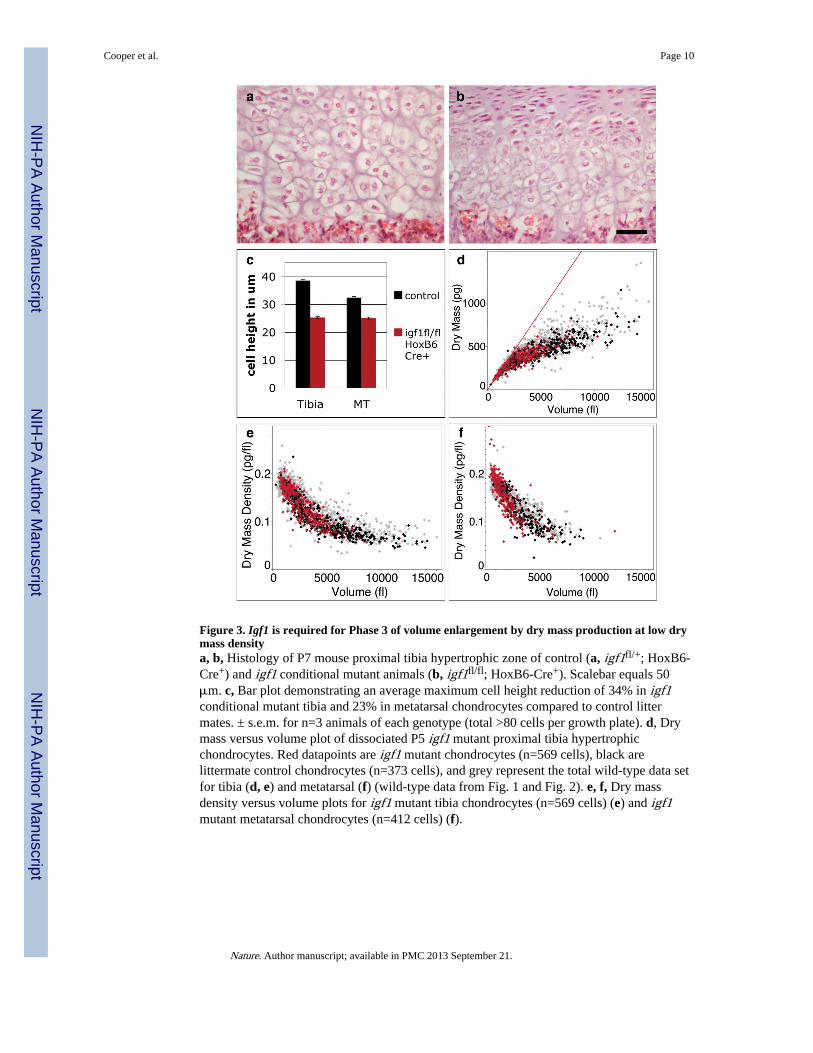
Figure 3. Igf1 is required for Phase 3 of volume enlargement by dry mass production at low drymass densitya, b, Histology of P7 mouse proximal tibia hypertrophic zone of control (a, igf1fl/+; HoxB6-Cre+) and igf1 conditional mutant animals (b, igf1fl/fl; HoxB6-Cre+). Scalebar equals 50μm. c, Bar plot demonstrating an average maximum cell height reduction of 34% in igf1conditional mutant tibia and 23% in metatarsal chondrocytes compared to control littermates. ± s.e.m. for n=3 animals of each genotype (total >80 cells per growth plate). d, Drymass versus volume plot of dissociated P5 igf1 mutant proximal tibia hypertrophicchondrocytes. Red datapoints are igf1 mutant chondrocytes (n=569 cells), black arelittermate control chondrocytes (n=373 cells), and grey represent the total wild-type data setfor tibia (d, e) and metatarsal (f) (wild-type data from Fig. 1 and Fig. 2). e, f, Dry massdensity versus volume plots for igf1 mutant tibia chondrocytes (n=569 cells) (e) and igf1mutant metatarsal chondrocytes (n=412 cells) (f).
Cooper et al. Page 10
Nature. Author manuscript; available in PMC 2013 September 21.
NIH
-PA Author Manuscript
NIH
-PA Author Manuscript
NIH
-PA Author Manuscript
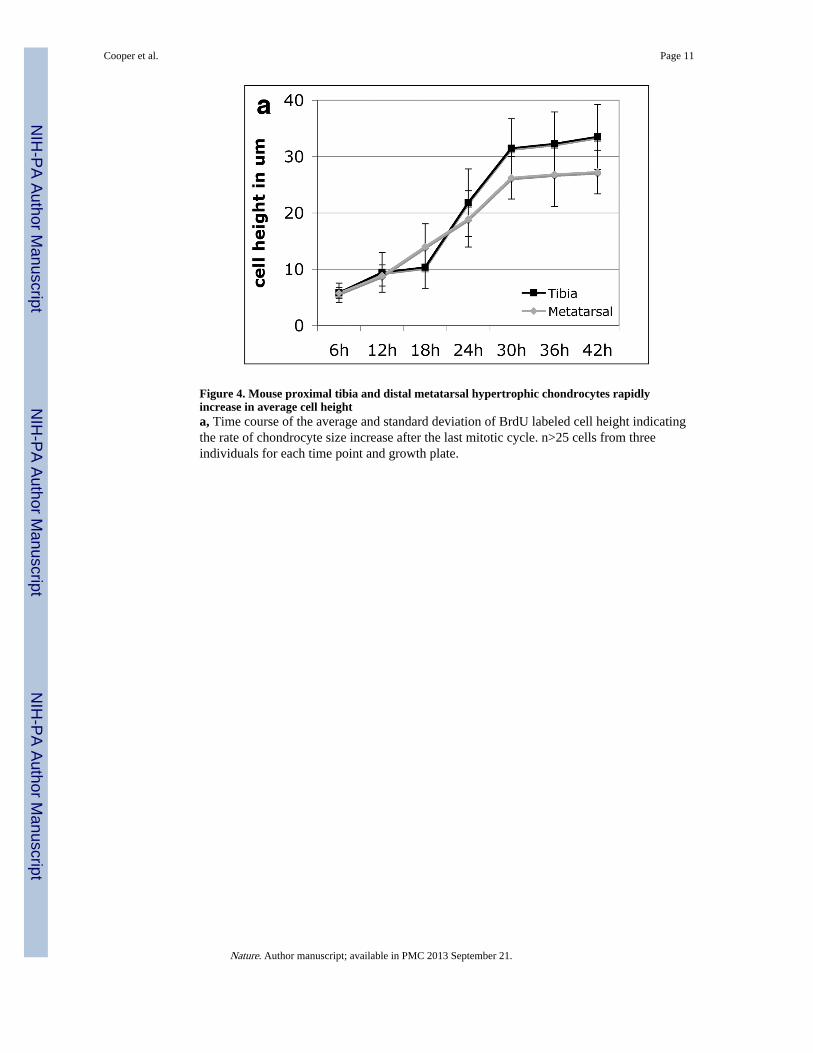
Figure 4. Mouse proximal tibia and distal metatarsal hypertrophic chondrocytes rapidlyincrease in average cell heighta, Time course of the average and standard deviation of BrdU labeled cell height indicatingthe rate of chondrocyte size increase after the last mitotic cycle. n>25 cells from threeindividuals for each time point and growth plate.
Cooper et al. Page 11
Nature. Author manuscript; available in PMC 2013 September 21.
NIH
-PA Author Manuscript
NIH
-PA Author Manuscript
NIH
-PA Author Manuscript