Embed Size (px)
Citation preview
Multiple Imputation (MI) Technique Using a Sequence of Regression Models OJOC Cohort 15Veronika N. Stiles, BSDHUniversity of Michigan September’2012
BIOSTATISTICS 590
Basis for Presentation
• This presentation is based on an article by:
• T.E. Raghunathan• J.M. Lepkowski • J.V. Hoewyk• P. Solenberger
“A multivariate Technique for Multiply Imputing Missing Values Using a Sequence of Regression Models”
Survey Methodology, June 2001Vol. 27, No. 1, pp. 85-95
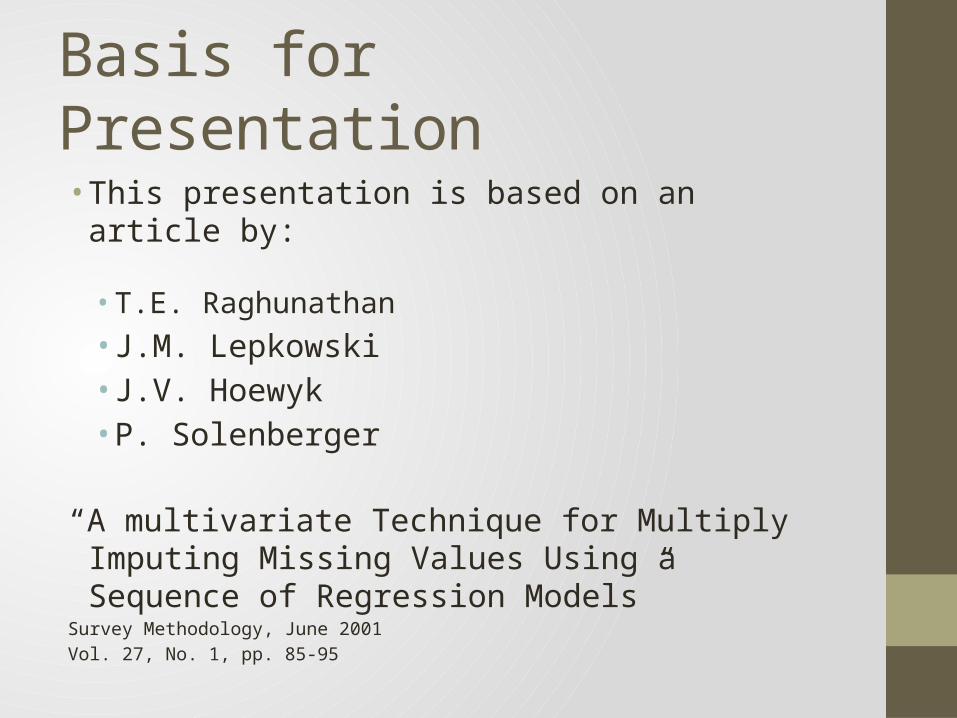
Rationale for Multiple Imputation • Incomplete data is a common problem
• Allows to use an existing complete-data software, once the missing values have been imputed
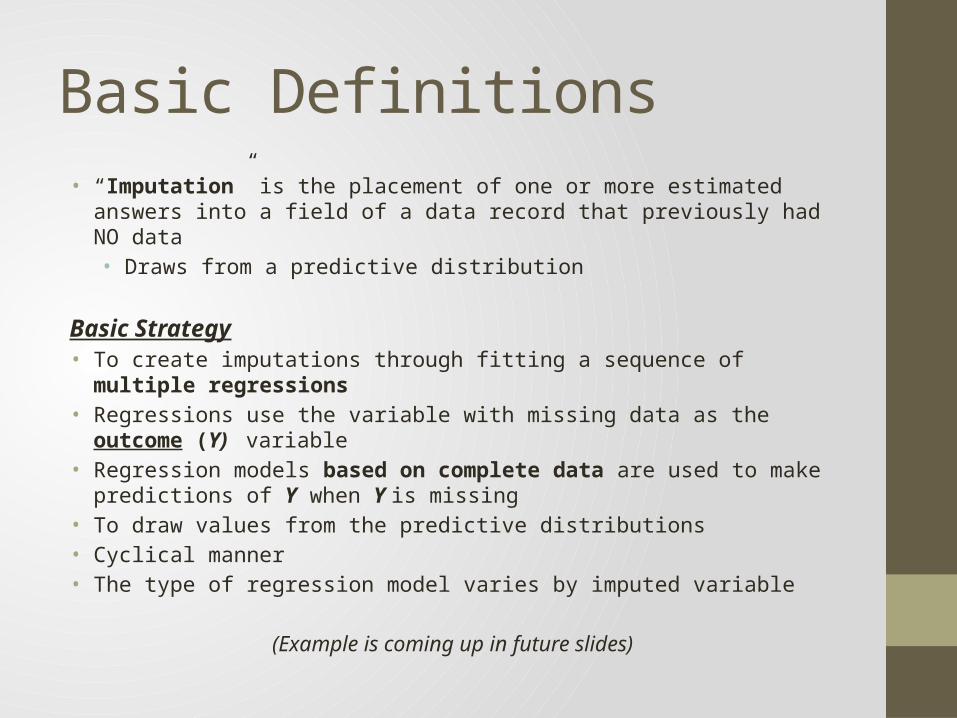
Basic Definitions• “Imputation” is the placement of one or more estimated answers
into a field of a data record that previously had NO data• Draws from a predictive distribution
Basic Strategy• To create imputations through fitting a sequence of multiple
regressions • Regressions use the variable with missing data as the outcome (Y)
variable• Regression models based on complete data are used to make
predictions of Y when Y is missing• To draw values from the predictive distributions• Cyclical manner• The type of regression model varies by imputed variable
(Example is coming up in future slides)
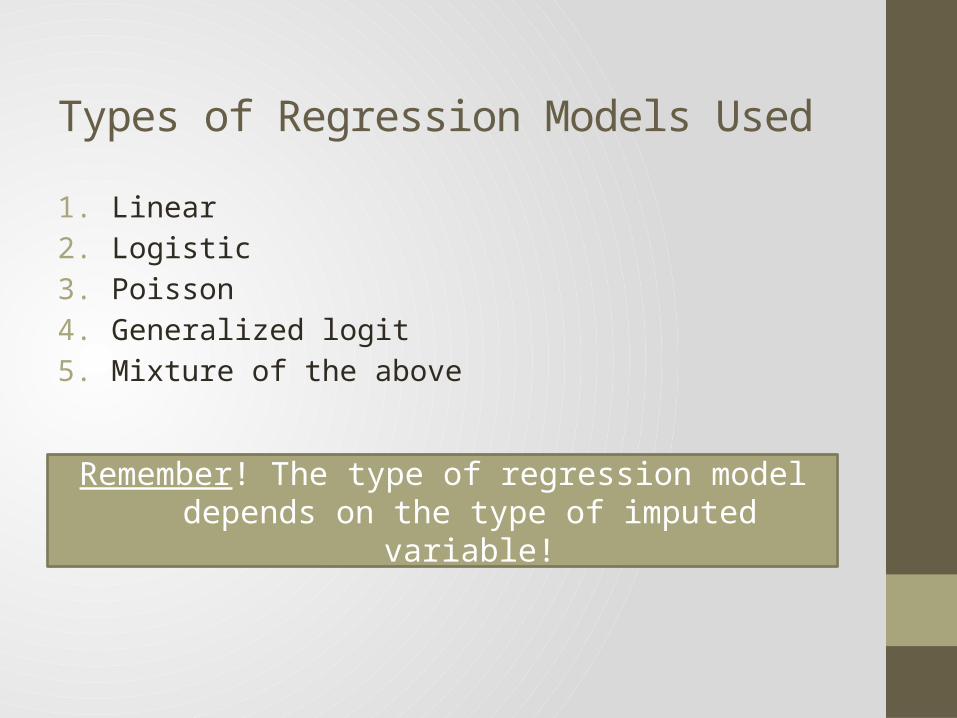
Types of Regression Models Used
1. Linear 2. Logistic 3. Poisson4. Generalized logit5. Mixture of the above
Remember! The type of regression model depends on the type of imputed variable!
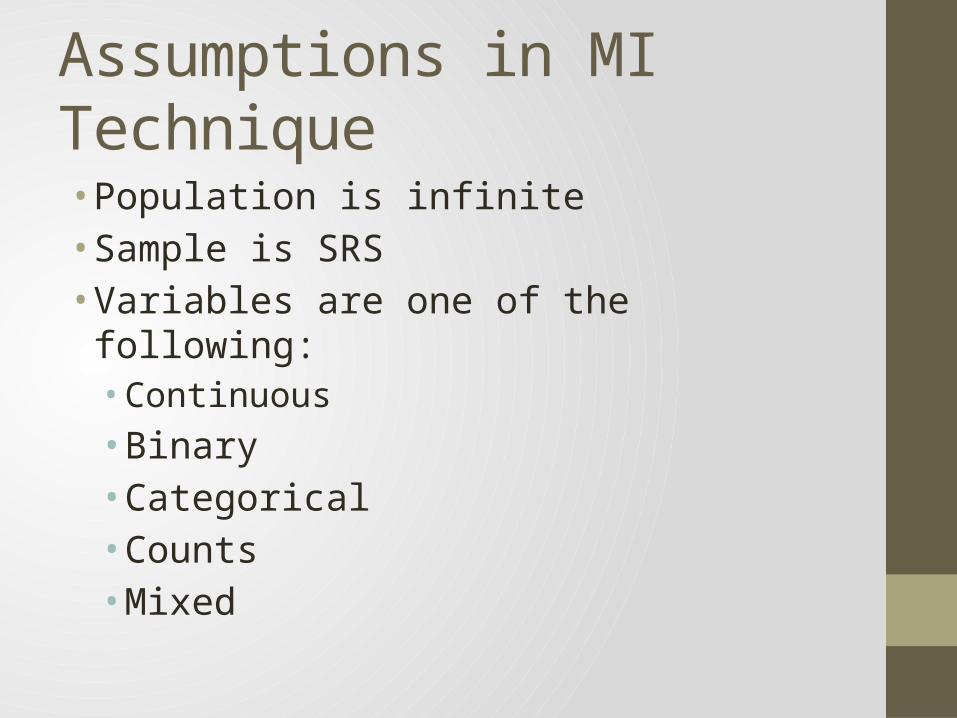
Assumptions in MI Technique• Population is infinite • Sample is SRS• Variables are one of the following:• Continuous• Binary• Categorical • Counts• Mixed
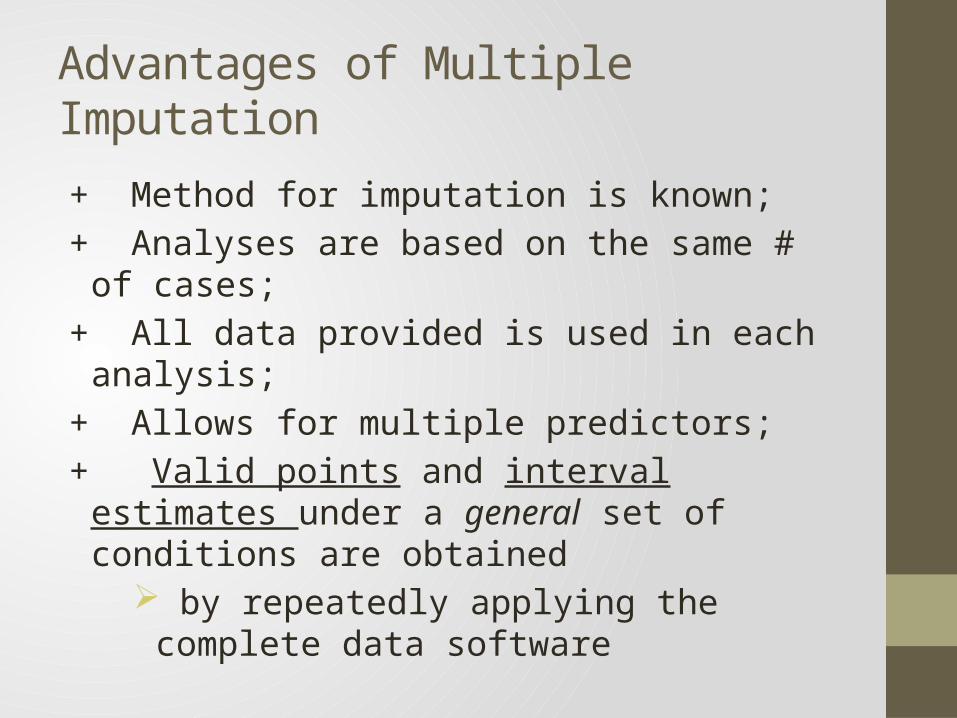
Advantages of Multiple Imputation
+ Method for imputation is known;+ Analyses are based on the same # of
cases;+ All data provided is used in each
analysis;+ Allows for multiple predictors;+ Valid points and interval estimates
under a general set of conditions are obtained
by repeatedly applying the complete data software
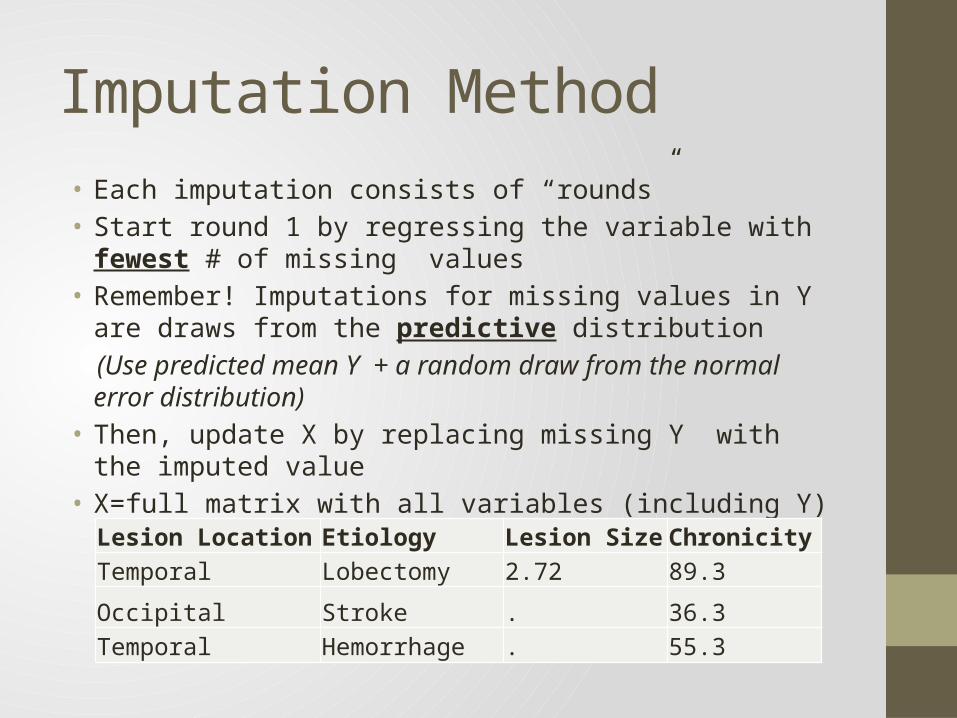
Imputation Method • Each imputation consists of “rounds”• Start round 1 by regressing the variable with fewest
# of missing values • Remember! Imputations for missing values in Y are
draws from the predictive distribution (Use predicted mean Y + a random draw from the
normal error distribution) • Then, update X by replacing missing Y with the
imputed value• X=full matrix with all variables (including Y)
Lesion Location Etiology Lesion Size ChronicityTemporal Lobectomy 2.72 89.3
Occipital Stroke . 36.3Temporal Hemorrhage . 55.3
Imputation Method
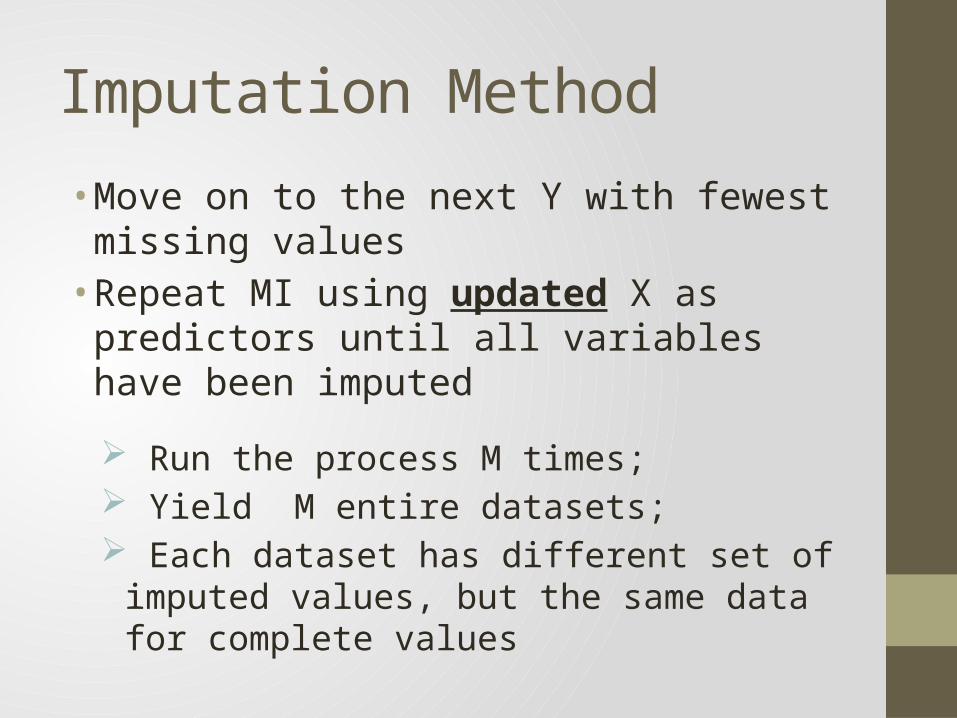
• Move on to the next Y with fewest missing values• Repeat MI using updated X as
predictors until all variables have been imputed
Run the process M times; Yield M entire datasets; Each dataset has different set of
imputed values, but the same data for complete values

Example Time
Effect of Smoking on Primary Cardiac Arrest (CA)
• Case-control study• Examine relationship between
smoking and CA
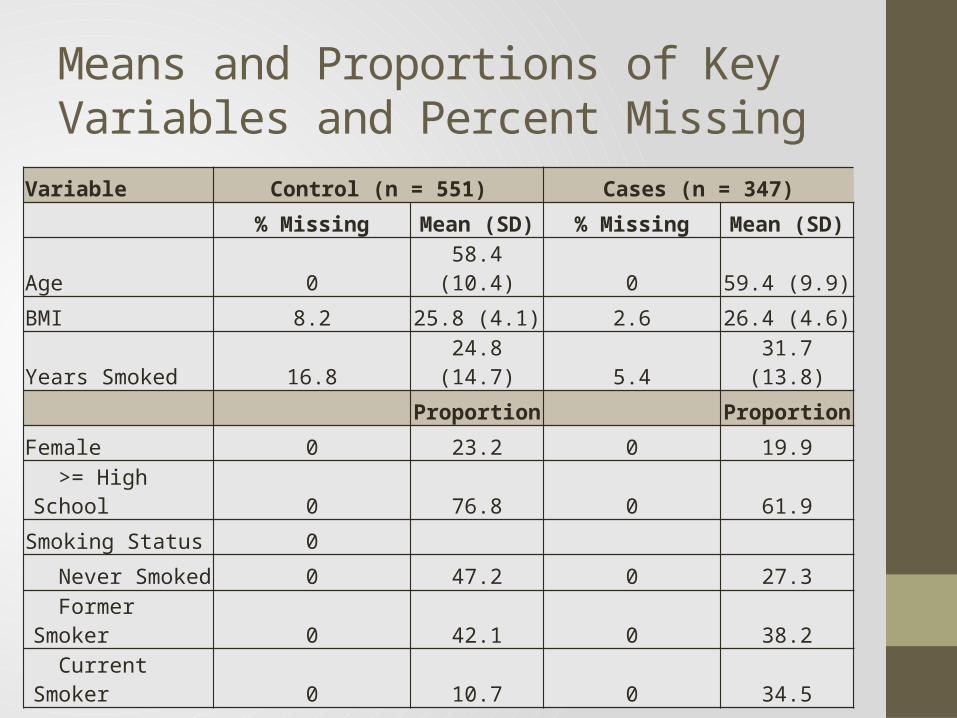
Means and Proportions of Key Variables and Percent Missing
Variable Control (n = 551) Cases (n = 347)
% Missing Mean (SD) % Missing Mean (SD)
Age 0 58.4 (10.4) 0 59.4 (9.9)
BMI 8.2 25.8 (4.1) 2.6 26.4 (4.6)
Years Smoked 16.8 24.8 (14.7) 5.4 31.7 (13.8)
Proportion Proportion
Female 0 23.2 0 19.9 >= High School 0 76.8 0 61.9
Smoking Status 0
Never Smoked 0 47.2 0 27.3 Former Smoker 0 42.1 0 38.2 Current Smoker 0 10.7 0 34.5
Intuitively…
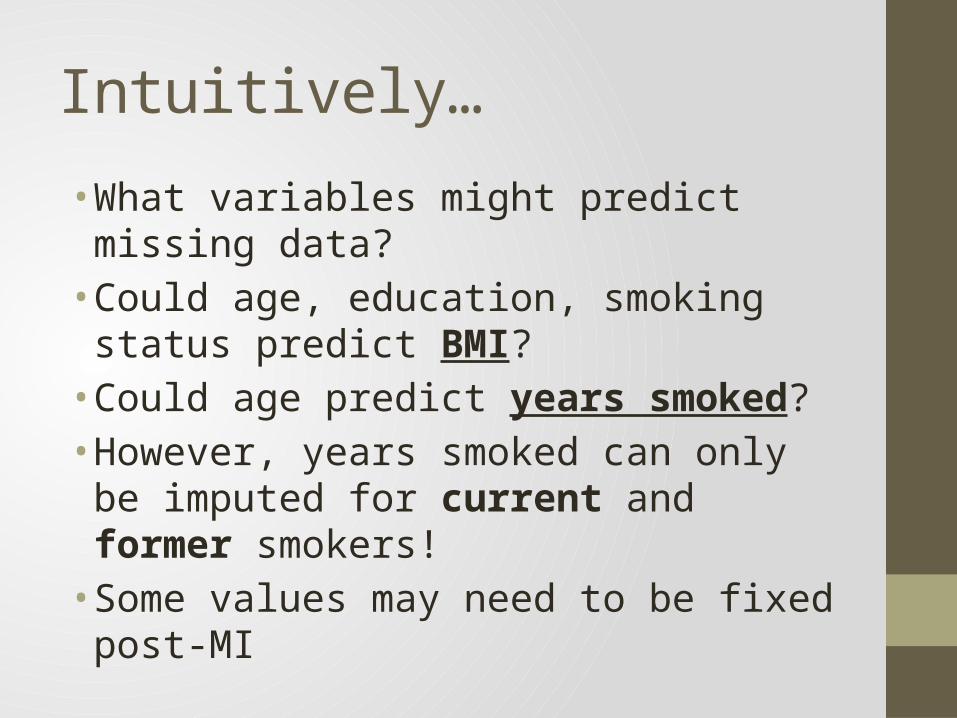
• What variables might predict missing data?• Could age, education, smoking status predict BMI?• Could age predict years smoked?• However, years smoked can only be imputed for current and former smokers!• Some values may need to be fixed post-MI
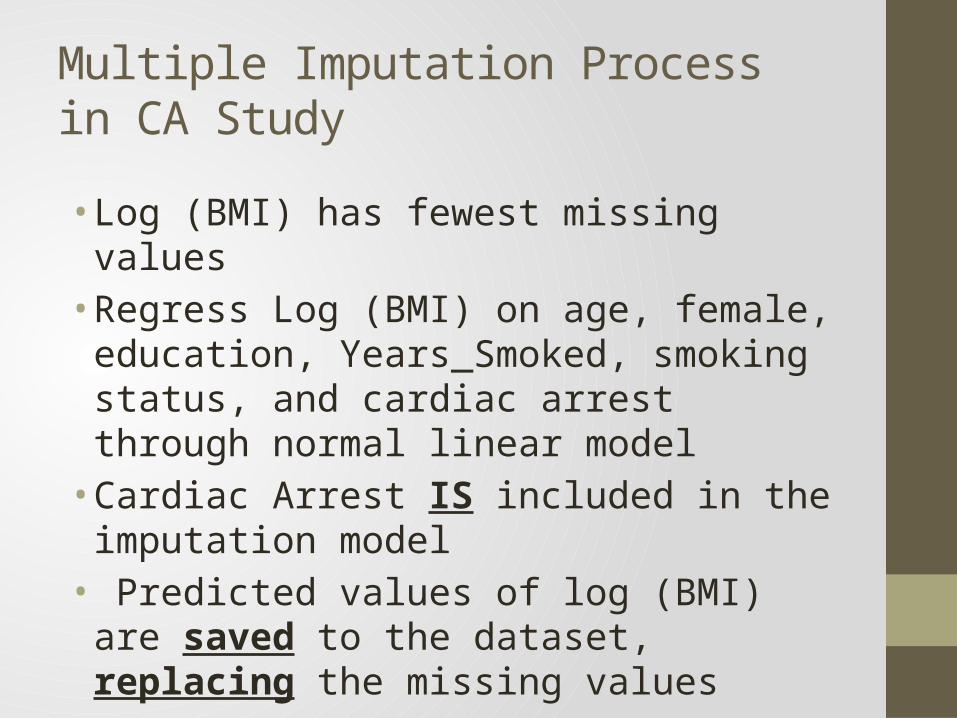
Multiple Imputation Process in CA Study
• Log (BMI) has fewest missing values • Regress Log (BMI) on age, female,
education, Years_Smoked, smoking status, and cardiac arrest through normal linear model• Cardiac Arrest IS included in the
imputation model• Predicted values of log (BMI) are saved to the dataset, replacing the missing values
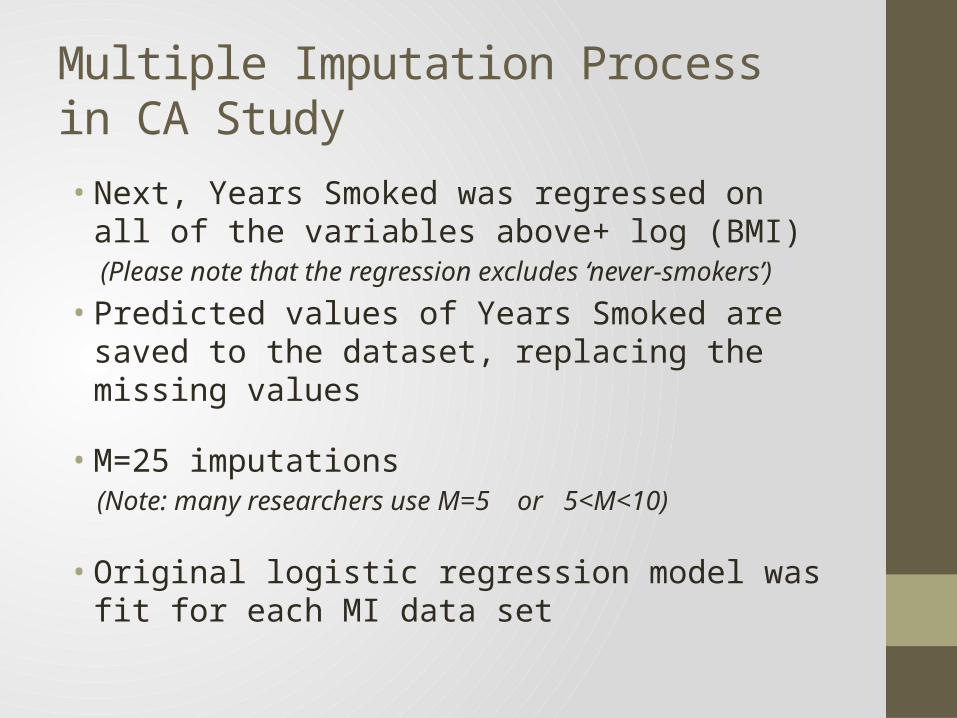
Multiple Imputation Process in CA Study• Next, Years Smoked was regressed on all of
the variables above+ log (BMI) (Please note that the regression excludes ‘never-smokers’)
• Predicted values of Years Smoked are saved to the dataset, replacing the missing values
• M=25 imputations (Note: many researchers use M=5 or 5<M<10)
• Original logistic regression model was fit for each MI data set

How were estimates of coefficients and covariance matrices obtained?
• IVEware software performs calculations, using estimates and covariance matrix• Combines the results from 5-25 regressions• Combines both within-regression and between-
regression error
• IVEware: Imputation and Variance Estimation Software
http://www.isr.umich.edu/src/smp/ive/
• Developed by our own Dr. Raghunathan & researchers at the Survey Methodology Program
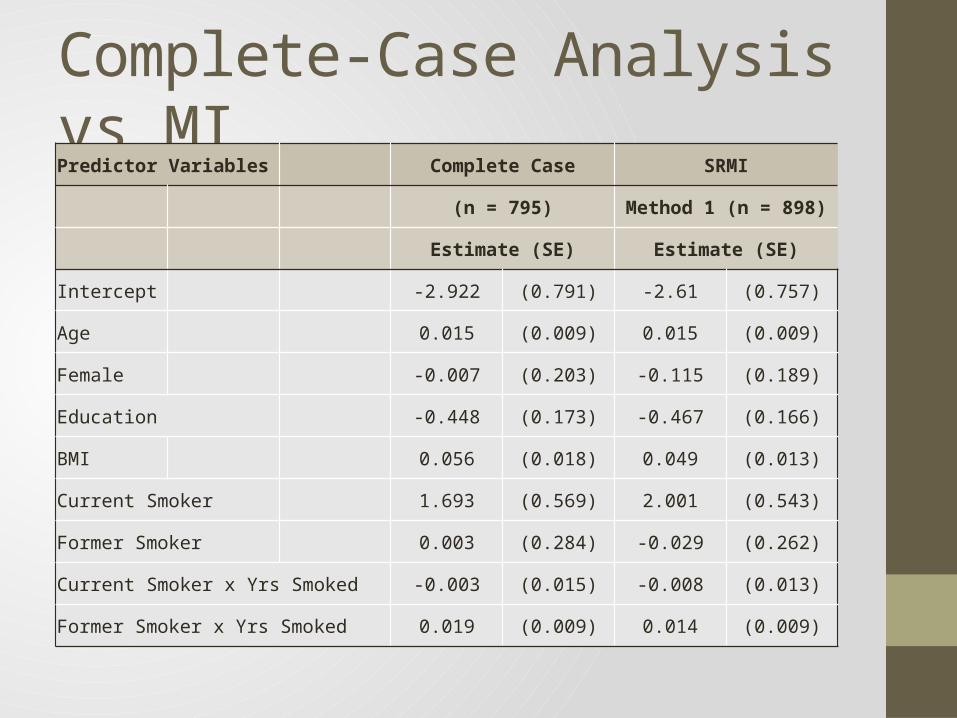
Complete-Case Analysis vs MIPredictor Variables Complete Case SRMI
(n = 795) Method 1 (n = 898)
Estimate (SE) Estimate (SE)
Intercept -2.922 (0.791) -2.61 (0.757)
Age 0.015 (0.009) 0.015 (0.009)
Female -0.007 (0.203) -0.115 (0.189)
Education -0.448 (0.173) -0.467 (0.166)
BMI 0.056 (0.018) 0.049 (0.013)
Current Smoker 1.693 (0.569) 2.001 (0.543)
Former Smoker 0.003 (0.284) -0.029 (0.262)
Current Smoker x Yrs Smoked -0.003 (0.015) -0.008 (0.013)
Former Smoker x Yrs Smoked 0.019 (0.009) 0.014 (0.009)
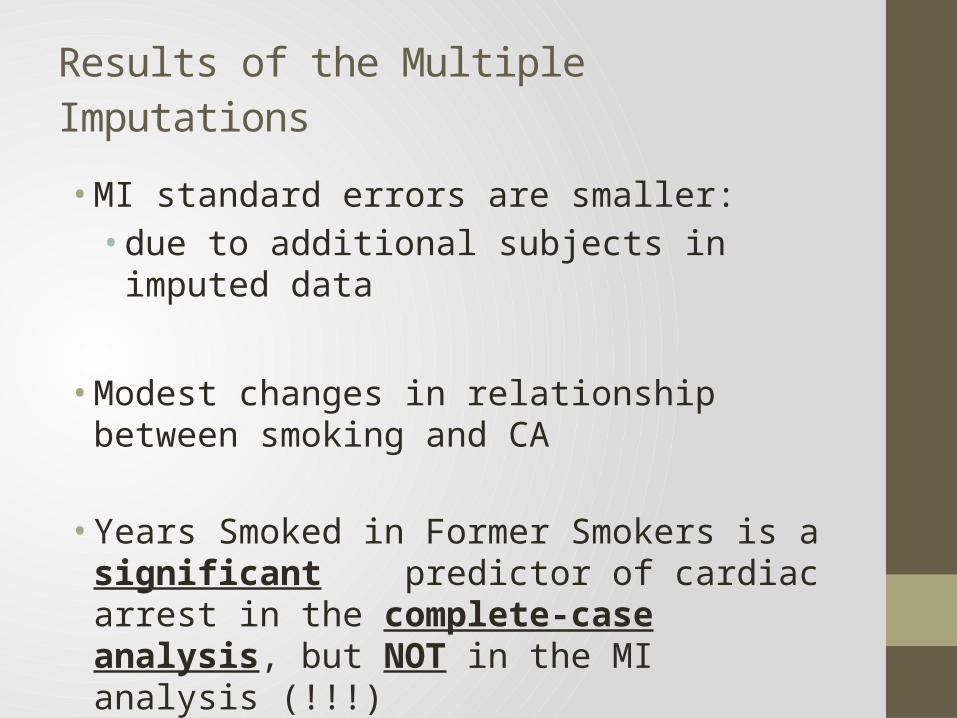
Results of the Multiple Imputations• MI standard errors are smaller:• due to additional subjects in imputed
data
• Modest changes in relationship between smoking and CA
• Years Smoked in Former Smokers is a significant predictor of cardiac arrest in the complete-case analysis, but NOT in the MI analysis (!!!)
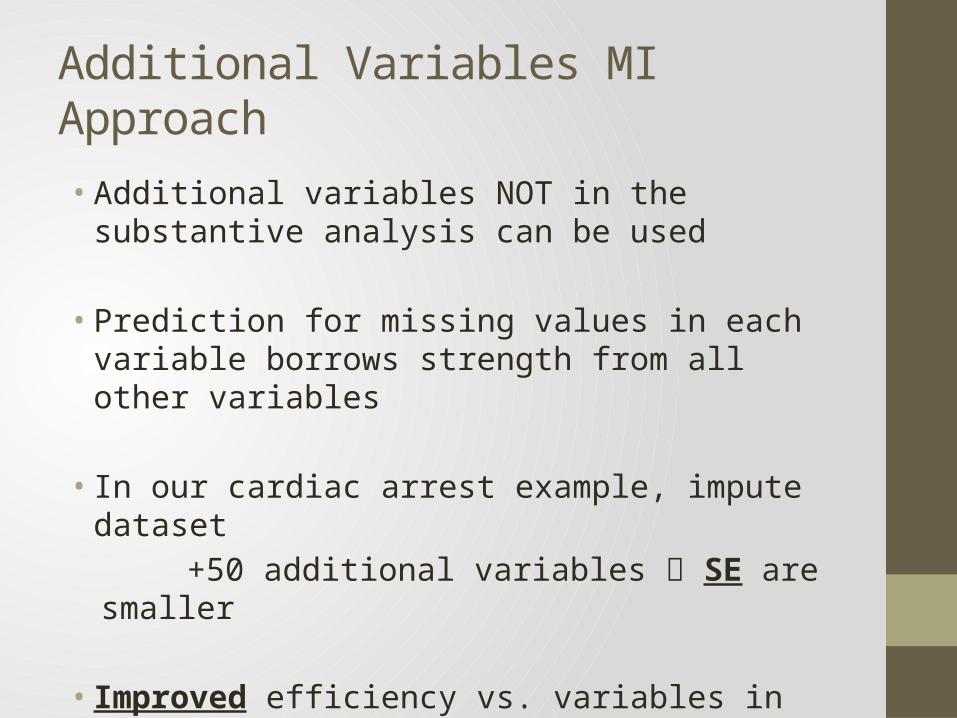
Additional Variables MI Approach
• Additional variables NOT in the substantive analysis can be used
• Prediction for missing values in each variable borrows strength from all other variables
• In our cardiac arrest example, impute dataset
+50 additional variables SE are smaller
• Improved efficiency vs. variables in model only
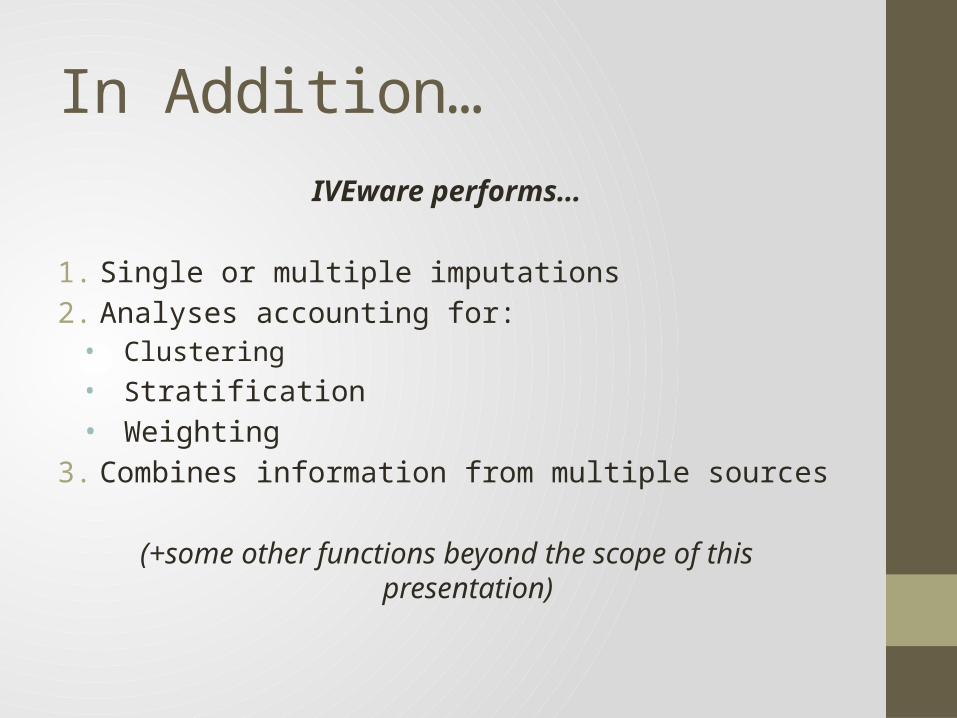
In Addition…
IVEware performs…
1. Single or multiple imputations2. Analyses accounting for:• Clustering• Stratification• Weighting
3. Combines information from multiple sources
(+some other functions beyond the scope of this presentation)
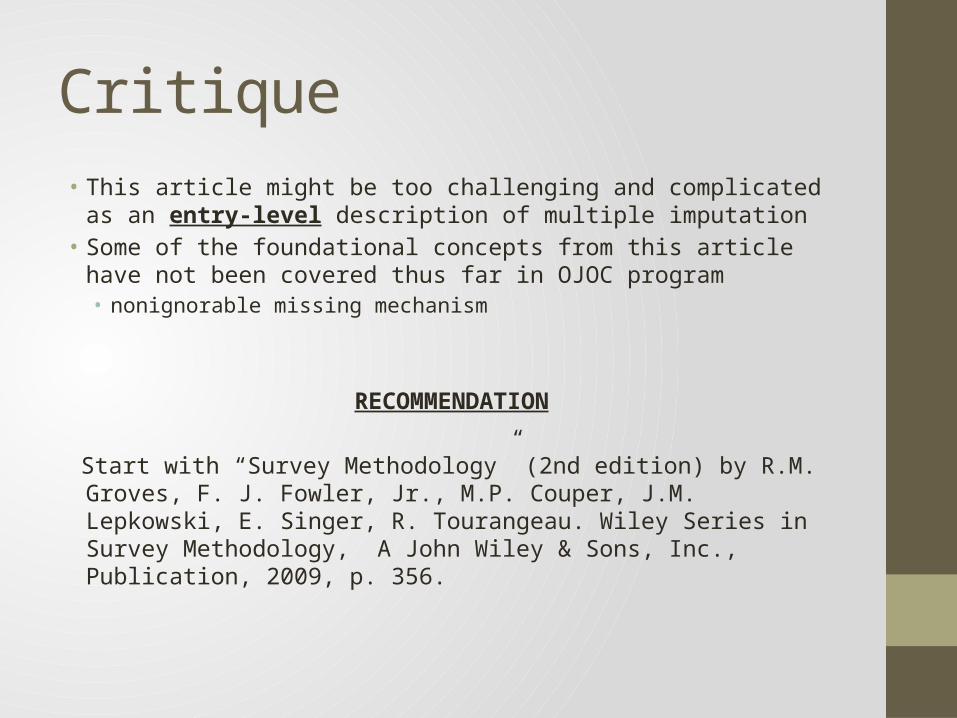
Critique• This article might be too challenging and complicated as
an entry-level description of multiple imputation • Some of the foundational concepts from this article have
not been covered thus far in OJOC program• nonignorable missing mechanism
RECOMMENDATION
Start with “Survey Methodology” (2nd edition) by R.M. Groves, F. J. Fowler, Jr., M.P. Couper, J.M. Lepkowski, E. Singer, R. Tourangeau. Wiley Series in Survey Methodology, A John Wiley & Sons, Inc., Publication, 2009, p. 356.

Thank You for Your Attention!