Embed Size (px)
Citation preview
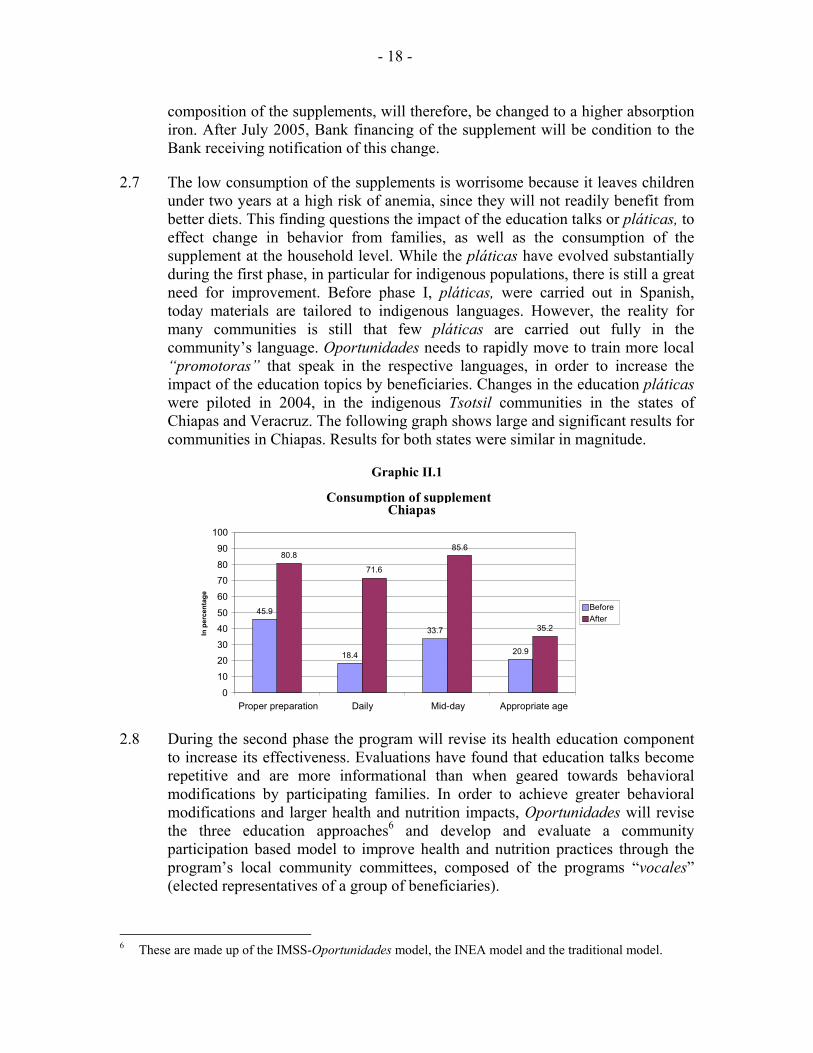
DOCUMENT OF THE INTER-AMERICAN DEVELOPMENT BANK
MEXICO
MULTIPHASE PROGRAM FOR THE CONSOLIDATION AND EXPANSION OF THE OPORTUNIDADES HUMAN DEVELOPMENT
PROGRAM, PHASE II
(ME-L1007)
EVALUATION REPORT
This document was prepared by the project team consisting of: Maristella Aldana (LEG); Carola Álvarez (RE2/RE2) Project Team Leader; Sandra Bartels (RE2/SC2); Florencia Devoto (RE2/RE2); Marie Gaarder (RE2/SO2); Ferdinando Regalia (RE2/SO2); Yuri Soares (OVE); Ana Santiago and Rafael Flores (consultants). Claudia Cox (RE2/SO2) was in charge of document production.
TABLE OF CONTENTS
PROJECT SUMMARY ............................................................................................................... 1
I. PHASE I RESULTS ......................................................................................................... 1
A. Frame of reference............................................................................................. 1 B. Oportunidades in the development strategy of the country and the Bank ........ 1 C. Achievement of triggers agreed upon for the transition to phase II .................. 2 D. Impact Evaluation and lessons learned from phase I. ....................................... 5
II. PHASE II ..................................................................................................................... 17
A. Objectives and description .............................................................................. 17 B. Proposed changes to the program.................................................................... 17 C. Cost and financing........................................................................................... 21
III. PROGRAM EXECUTION................................................................................................ 22
A. The borrower and executing agency................................................................ 22 B. Program execution, administration and operating rules .................................. 22 C. Procurement..................................................................................................... 22 D. Execution, retroactive financing and disbursement schedule.......................... 23 E. External auditing of the program..................................................................... 24 F. Monitoring and evaluation .............................................................................. 24
Electronic Links and References
Basic Socioeconomic Data http://www.iadb.org/RES/index.cfm?fuseaction=externallinks.countrydata Status of Loan in Execution & Loans Approved http://opsws3.reg.iadb.org/idbdocswebservices/getDocument.aspx?DOCNUM=482581Tentative Lending Program http://opsws3.reg.iadb.org/idbdocswebservices/getDocument.aspx?DOCNUM=482579Annex I. Executive Summary, Phase I http://opsws3.reg.iadb.org/idbdocswebservices/getDocument.aspx?DOCNUM=472607
- ii -
ABBREVIATIONS CIESAS Centro de Investigación y Estudios Superiores en Antropología Social ENCASEH Encuesta de Caracterización Socioeconómica de los Hogares ENCEL Rural Evaluation Surveys ENCELURB Urban Evaluation Surveys FPM Family Planning Methods GME Government of Mexico IFPRI International Food Policy Research Institute IMSS Mexican Institute of Social Security INEA Instituto Nacional para la Educación de Adultos INSP Instituto Nacional de Salud Pública NAFIN Nacional Financiera, SNC OC Ordinary Capital PC Prenatal Care PTI Poverty Targeted Investment QDC Qualified Delivery Care SEDESOL Social Development Secretariat SEP Secretariat of Public Education SHCP Secretariat of Finance SIIOP Program Monitoring Indicators System SSA Secretariat of Public Health
- iii -
INFORMATION AVAILABLE IN THE FILES OF RE2/SO2
Angelucci M., Orazio Attanasio, and Jonathan Shaw. (2004) “The effect of Oportunidades on the level and composition of consumption in urban areas.” Mimeo. Instituto Nacional de Salud Pública de México.
Attanasio, O. and Vincenzo Di Maro. (2004) “Long and short-run effects of
Oportunidades on consumption in rural areas.” Mimeo. Instituto Nacional de Salud Pública de México.
Bautista, S., Sebastián Martínez, Stefano Bertozzi y Paul Gertler. (2004) “Evaluación del
efecto de Oportunidades sobre la utilización de servicios de salud en el medio rural.” Mimeo. Instituto Nacional de Salud Pública de México.
Behrman, J., Susan W. Parker and Petra E. Todd. (2004) “Medium-term effects of the
Oportunidades Program Package, including Nutrition, on Education of Rural Children Age 0-8 in 1997.” Mimeo. Instituto Nacional de Salud Pública de México.
Coady, D., and Susan Parker. (2004) “An Evaluation of Targeting of the Oportunidades
Program in Urban Areas.” Mimeo. Instituto Nacional de Salud Pública de México.
Devoto, F. (2004) “Informe de Evaluación de Eficiencia Operativa del Programa de
Desarrollo Humano Oportunidades de México.” Nota Técnica No.2. Banco Interamericano de Desarrollo.
Duarte, M. B., Sonia Morales, Sandra Ochoa, Simeón Bult Van der Wal, Alvaro Hidrovo,
Marta Caballero y Mauricio Hernández. (2004) “Evaluación del componente de sesiones de educación para la salud del Programa Oportunidades – Impacto sobre conocimientos y prácticas de las madres beneficiarias y los jóvenes becarios-.” Mimeo. Instituto Nacional de Salud Pública de México.
Escobar Latapí, A., y Mercedes González de la Rocha. (2003) “Evaluación Cualitativa
del Programa Oportunidades en zonas urbanas.” Mimeo. Centro de Investigación y Estudios Superiores en Antropología Social (CIESAS).
Fernald, L., Paul J. Gertler and Gustavo Olaiz. (2004) “The Medium Term Impact of
Oportunidades on Obesity and Chronic Disease in Rural Areas.” Mimeo. Instituto Nacional de Salud Pública de México.
Gaarder, M. (2004) “Desempeño de los mecanismos de auditoría operativa del Programa
de Desarrollo Humano Oportunidades.” Nota Técnica No.4. Banco Interamericano de Desarrollo.
- iv -
Gaarder, M. (2004) “La eficiencia operativa del sistema de distribución de suplementos alimenticios del Programa de Desarrollo Humano Oportunidades.” Nota Técnica #5. Banco Interamericano de Desarrollo.
Gertler, P. and Lia Fernald. (2004) “Medium Term Impact of Oportunidades on Child
Development in Rural Areas.” Mimeo. Instituto Nacional de Salud Pública de México.
Gertler, P. Sebastian Martinez and Marta Rubio. (2004) “The Impact of Oportunidades
on Micro-enterprise and Agricultural Production Activities in Rural Mexico.” Mimeo. Instituto Nacional de Salud Pública de México.
Gutierrez, J.P., Serfio Bautista, Paul Gertler, Mauricio Hernández y Stefano Bertozzi.
(2004) “Impacto de Oportunidades en el estado salud, morbilidad, y utilización de los servicios de salud de la población beneficiaria: resultados de corto plazo en zonas urbanas y de mediano plazo en zonas rurales.” Mimeo. Instituto Nacional de Salud Pública de México.
Gutierrez, J.P., Paul Gertler, Mauricio Hernández y Stefano Bertozzi. (2004) “Impacto de
Oportunidades en comportamiento de riesgo de los adolescentes y en sus consecuencias inmediatas: resultados de corto plazo en zonas urbanas y de mediano plazo en zonas rurales.” Mimeo. Instituto Nacional de Salud Pública de México.
Hernández, B., José Edmundo Uquieta, Maria Dolores Ramírez, José Luis Figueroa.
(2004) “Impacto de Oportunidades en la salud reproductiva de la población beneficiaria.” Mimeo. Instituto Nacional de Salud Pública de México.
Hernández, B., Dolores Ramírez, Hortensia Moreno y Nan Laird. (2003) “Evaluación del
impacto de Oportunidades en la mortalidad materna e infantil.” Mimeo. Instituto Nacional de Salud Pública de México.
Hernández, M., Fernando Meneses, Martha Téllez y Abigail Manzano. (2004)
“Evaluación de la calidad de la atención médica en población diabética usuaria del Programa Oportunidades.” Mimeo. Instituto Nacional de Salud Pública de México.
Meneses F., Bernardo Hernández, Mary Carmen Baltazar, Araceli Camacho, María
Beatriz Duarte, José Urquiete, Martha Téllez y Mauricio Hernández. (2003) “Evaluación del cumplimiento de metas, costos unitarios y apego del Programa Oportunidades a las reglas de Operación.” Evaluación Externa del Programa de Desarrollo Humano Oportunidades. Secretaría de Desarrollo Social, México.
Neufeld, L., Daniela Sotres, Lourdes Flores, Lizbeth Tolentino, Jorge Jiménez y Juan
Rivera. (2004) “Consumo del suplemento alimenticio Nutrisano y Nutrivida de
- v -
niños y mujeres beneficiarias de Oportunidades en zonas urbanas.” Mimeo. Instituto Nacional de Salud Pública de México.
Neufeld, L., Daniel Sotres, Raquel García, Armando García, Lisbeth Tolentino, Lía
Fernald, Juan Rivera. (2004) “Evaluación del estado nutricional y adquisición de lenguaje en niños de localidades urbanas con y sin el Programa Oportunidades.” Mimeo. Instituto Nacional de Salud Pública de México.
Parker, S., Jere R. Behrman and Petra Todd. (2004) “Medium-term effects of
Oportunidades on Education and Work of Rural Youth Aged 9-15 in 1997.” Mimeo. Instituto Nacional de Salud Pública de México.
Parker, S. (2003) “Evaluación del impacto de Oportunidades sobre la inscripción,
reprobación y abandono escolar.” Evaluación Externa del Programa de Desarrollo Humano Oportunidades. Secretaría de Desarrollo Social, México.
Parker, S. (2004) “Evaluación del impacto de Oportunidades sobre la inscripción escolar:
primaria, secundaria y media superior.” Evaluación Externa del Programa de Desarrollo Humano Oportunidades. Secretaría de Desarrollo Social, México.
Regalia, F. (2004) “Modelo de Puntajes para la focalización del Programa de Desarrollo
Humano Oportunidades.” Nota Técnica #6. Banco Interamericano de Desarrollo. Rivera, J., Daniela Sotres, Jean-Pierre Habicht, Teresa Shamah, Salvador Villalpando.
(2004) “Impact of the Mexican Program for Education, Health and Nutrition (Progresa) on Rates of Growth and Anemia in Infants and Young Children. A Randomized Effectiveness Study.” Journal of the American Medical Association. Vol. 291, No.21.
Rubalcava, L., y Graciela Teurel. (2003) “El efecto de Oportunidades sobre la
composición demográfica de los hogares.” Mimeo. Instituto Nacional de Salud Pública de México.
Rubalcava, L., y Graciela Teruel. (2004) “Análisis sobre el cambio en variables
demográficas y económicas de los hogares beneficiarios del Programa Oportunidades 1997-2002.” Mimeo. Instituto Nacional de Salud Pública de México.
Soares, Y. (2004) “Results of a micro-simulation of the impact of different
Oportunidades transfer amounts in urban areas.” Technical Note #1. Inter-American Development Bank.
Todd, P., Jorge Gallardo-Garcia, Jere R. Behrman and Susan W. Parker. (2004)
“Oportunidades Impacts on education in urban areas after one-year of program participation.” Mimeo. Instituto Nacional de Salud Pública de México.
Page 1
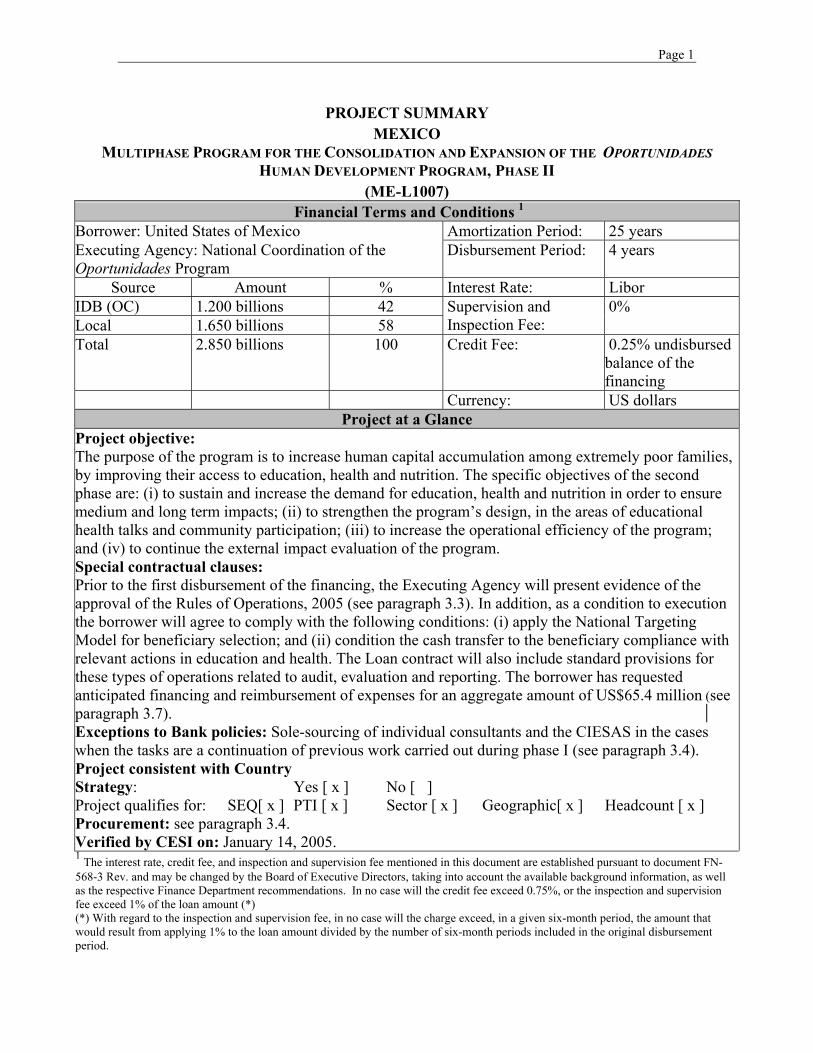
PROJECT SUMMARY MEXICO
MULTIPHASE PROGRAM FOR THE CONSOLIDATION AND EXPANSION OF THE OPORTUNIDADES HUMAN DEVELOPMENT PROGRAM, PHASE II
(ME-L1007) Financial Terms and Conditions 1
Borrower: United States of Mexico Amortization Period: 25 years Executing Agency: National Coordination of the Oportunidades Program
Disbursement Period: 4 years
Source Amount % Interest Rate: Libor IDB (OC) 1.200 billions 42 Local 1.650 billions 58
Supervision and Inspection Fee:
0%
Total 2.850 billions 100 Credit Fee: 0.25% undisbursed balance of the financing
Currency: US dollars Project at a Glance
Project objective: The purpose of the program is to increase human capital accumulation among extremely poor families, by improving their access to education, health and nutrition. The specific objectives of the second phase are: (i) to sustain and increase the demand for education, health and nutrition in order to ensure medium and long term impacts; (ii) to strengthen the program’s design, in the areas of educational health talks and community participation; (iii) to increase the operational efficiency of the program; and (iv) to continue the external impact evaluation of the program. Special contractual clauses: Prior to the first disbursement of the financing, the Executing Agency will present evidence of the approval of the Rules of Operations, 2005 (see paragraph 3.3). In addition, as a condition to execution the borrower will agree to comply with the following conditions: (i) apply the National Targeting Model for beneficiary selection; and (ii) condition the cash transfer to the beneficiary compliance with relevant actions in education and health. The Loan contract will also include standard provisions for these types of operations related to audit, evaluation and reporting. The borrower has requested anticipated financing and reimbursement of expenses for an aggregate amount of US$65.4 million (see paragraph 3.7). Exceptions to Bank policies: Sole-sourcing of individual consultants and the CIESAS in the cases when the tasks are a continuation of previous work carried out during phase I (see paragraph 3.4). Project consistent with Country Strategy: Yes [ x ] No [ ] Project qualifies for: SEQ[ x ] PTI [ x ] Sector [ x ] Geographic[ x ] Headcount [ x ] Procurement: see paragraph 3.4. Verified by CESI on: January 14, 2005. 1 The interest rate, credit fee, and inspection and supervision fee mentioned in this document are established pursuant to document FN-568-3 Rev. and may be changed by the Board of Executive Directors, taking into account the available background information, as well as the respective Finance Department recommendations. In no case will the credit fee exceed 0.75%, or the inspection and supervision fee exceed 1% of the loan amount (*) (*) With regard to the inspection and supervision fee, in no case will the charge exceed, in a given six-month period, the amount that would result from applying 1% to the loan amount divided by the number of six-month periods included in the original disbursement period.
I. PHASE I RESULTS
A. Frame of reference
1.1 The multiphase program for the consolidation and expansion of the Human Development Program Oportunidades (1388/OC-ME) was approved by the Bank’s Board of Executive Directors on January 16 20021. The purpose of the program is to increase human capital accumulation among extremely poor families, by improving their access to education, health and nutrition. The Bank appraised the program as a two-phase operation, with an estimated total cost of US$4.755 billion. The Bank would finance up to US$2.000 billion in two separate loans of a billion each.
1.2 The Government of Mexico (GME) and the Bank agreed that approval of phase II would be contingent upon an evaluation of benchmarks defined for phase I, including: (i) disbursement of at least 50% of the loan proceeds; (ii) achievement of coverage targets; (iii) proposed changes to the program resulting from diagnostic studies; and (iv) impact evaluation of the urban expansion. The impact evaluation of the urban expansion required measuring the impact on schooling levels, the demand for health services and nutritional behavior, among others. In addition to the global evaluation, the following actions were also required: (i) adjustments to procedures for obtaining information concerning the identification, selection and incorporation of beneficiaries; (ii) operational evaluation of the distribution system for medicines and food supplements; (iii) the implementation of the Program Monitoring Indicators System (SIIOP); and (iv) evaluation and approval of the new National Targeting Model.
1.3 The objectives of this document is to: (i) report on the performance of triggers for the transition to phase II; (ii) present a summary of evaluation findings for phase I; and (iii) present to the Board of Directors, for approval, the proposal for phase II of the Human Development Program Oportunidades.
B. Oportunidades in the development strategy of the country and the Bank
1.4 Mexico exhibits disproportionate levels of poverty given its income per capita levels. However, poverty and extreme poverty rates have been falling in recent years, even on the face of negative per capita growth. This trend can be explained in part by improvements in income distribution associated with: (a) increased coverage of targeted social programs; (b) increased purchasing power in a context of declining inflation; (c) larger inflows of remittances; and (d) lower prices for some basic staples of consumption (GN-2251-3). Programs like Oportunidades and Habitat are pillars in the GME’s social development strategy (known as Contigo), and its “National Development Plan, 2001-2006” which focuses on: (i) increasing welfare levels; (ii) promoting equity in access to programs and
1 Annex I contains the executive summary of the loan proposal for the first phase, document PR-2650.
- 2 -
opportunities; and (iii) fostering initiatives among citizens to complement public ones.
1.5 This program is in line with the Bank’s mandates and strategies on the inclusion of groups living in poverty. The Bank’s Eight Replenishment called for broader inclusion of groups living in poverty, through an integrated approach to interventions aimed at human capital formation (par. 2.8, 2.12-2.14). In this framework, the Bank’s Poverty Reduction and Promotion of Social Equity Strategy recognized that “the fight against poverty shows that while sustainable economic growth, macroeconomic stability, and governance are key ingredients for poverty reduction, they are not sufficient. What is needed, also, are specific actions to promote greater equity and to increase the impact of growth on poverty”. The Bank’s country paper for Mexico (GN-2181), focused in its first pillar support for programs and initiatives for the modernization of social sectors and reduction of extreme poverty, as well as, specially targeted programs to the poor, indigenous and other vulnerable groups (par. 4.5).
C. Achievement of triggers agreed upon for the transition to phase II
1.6 In 2001, the GME decided to expand its well-known and effective poverty alleviation program, Progresa2, from the rural areas, where it traditionally had operated, to urban areas of the country. This decision presented a considerable set of challenges that ranged from operational to fundamental design issues including the potential relevance of the program in such a different environment as the urban. In this context, the Bank provided technical assistance and financing to the GME through its loan 1388/OC-ME.
1.7 With the support of the Bank’s program, Oportunidades has reached close to 100% of families living in extreme poverty in the country during its phase I. It has significantly updated its operational processes in the urban areas and updated rural processes as well. At the same time, the program undertook a rigorous impact evaluation of its interventions in the urban area and of the medium term effects of the program in the rural areas.
1.8 The program started implementing its National Targeting Model, which was a condition for eligibility of phase I, and changed its beneficiary incorporation mechanisms to adapt them to the urban areas. Table I.1 shows that during the first year of implementation the program incorporated 660,000 families in the semi-urban and urban areas3, and 460,000 new families in rural areas. Rural families that qualified were made up by new families (by marriage or migration) in localities were the program was already operating and in new rural localities that had not benefited from the program.
2 In 2001, Progresa was renamed Oportunidades. 3 Semi-urban are localities that range in size from 2,500 to 15,000 people. Urban localities are defined as
>than 15,000 inhabitants.
- 3 -
1.9 This front-loading of the expansion of coverage created substantial strains on the operational capacity of the program, and revealed operational processes that were obsolete and needed reengineering. The program spent most of the second year of program execution realigning operational processes in order to increase its operational efficiency.
Table I.1 Program coverage - flow and stock (millions of households)
1997 1998 1999 2000 2001 2002 2003 2004 2005 2006 2007
Flows Incorporated families 0.30 1.29 0.71 0.17 0.64 1.12 0.00 0.76 Rural 0.30 1.29 0.71 0.17 0.07 0.46 0.01 0.44 Semi-urban - - - - 0.57 0.16 0.01 0.12 Urban - - - - - 0.50 0.02 0.20 Recertification by cohort
0.30 1.29 0.71 0.17 0.64 1.12 0.00 0.76
EDA4 0.004 0.06 0.03 0.001 n.d. Stock of beneficiaries 0.30 1.60 2.31 2.48 3.12 4.24 4.24 5.00 5.00 5.00 5.00
1.10 The program’s targets for operational procedures, design adaptations and expected impacts in the areas of education, health and food consumption have been achieved. Thus, we conclude that conditions set forth in the loan proposal (document PR-2650) for the approval of phase II have been met. Table I.2 reports on indicators and benchmarks that the borrower and the Bank agreed upon for the program’s first phase, their achievement level and source of verification.
Table I.2 Phase I – Agreed Indicators for Processing the Second Phase of the Program
Second Phase Triggers and Indicators Indicators Targets Achieved and Verification Sources
• Disbursement >50%. • Coverage Target >4.8 million.
99.7% disbursed. 5,000,000 families by end of 2004.
• Impact Evaluation of short-term effects for urban beneficiaries shows significant impacts compared to the control group.
• Impact Evaluation of medium-term effects on rural beneficiaries completed.
Achieved. Baseline carried out on urban sample during 2002, second round measurement in 2004. See Table I.3, 4 and 5 for results. Achieved. Panel follow-up survey in 2003. See Table I.6, and 7 for results.
• Adaptation to urban design according to diagnostic studies implemented. Unit for geographic targeting defined. Size of monetary support to fit urban poverty profile. Size of education grant by grade level and gender adjusted.
Achieved. Geographic targeting for the urban areas was adapted to concentration of poor households by blocks to determine the poverty level of locality. Bank analyses showed a potential worsening of income distribution among beneficiaries if these changes were applied. (Soares, Y. “Results of a micro-simulation of the
4 EDA stands for Esquema Diferenciado de Apoyos. In 2003, a new graduation scheme was approved by
which families that did not qualify under recertification will continue to receive the education subsidies only, until their children graduate from 9th Grade.
- 4 -
Second Phase Triggers and Indicators Indicators Targets Achieved and Verification Sources
impact of different Oportunidades transfer amounts in urban areas.” Technical Note 11).
• Adjustments to incorporation process in urban environment implemented.
Achieved. (Devoto, F. “Informe de Evaluación de Eficiencia Operativa del Programa de Desarrollo Humano Oportunidades de México.” Nota Técnica No.22).
• Operational audit mechanism put in operation. Achieved. Audit sample expanded to achieve representativeness at the state level. (Gaarder, M. “Desempeño de los mecanismos de auditoría operativa del Programa de Desarrollo Humano Oportunidades.” Nota Técnica No.43).
• Operational efficiency of food supplement distribution system increased since the start of the project as evidenced by SIIOP indicators. % of children under nutritional surveillance. % of children suffering from malnutrition by age group. % of children receiving food supplements. % of pregnant women under prenatal control. % of breast-feeding women receiving prenatal care. % of pregnant and breast-feeding women receiving food supplement. Average number of food supplement packages received by beneficiaries (12 packages recommended provision for women, and 10 for children). Qualitative assessment of food supplement production, distribution and delivery chains by entity responsible presented.
Achieved (base 2001 to 2004). Increase from 90% to 98% (age 2-4 years old). Increase from 91% to 98% (< than 2 years old). Decrease from 28% to 24% (age 2-4 years old). Decrease from 16% to 15% (< than 2 years old). Increase from 70% to 82% (< than 2 years old4). Increase from 93% to 98%. Increase from 93% to 98%. Increase from 82% to 91% (pregnant5). Approximately 87% (breast-feeding6). Decrease from 17 packages to 12 (breast-feeding). Decrease from 16 packages to 12 (pregnant). Decrease from 10.13 packages to 10.07 (< than 5 years old7). Achieved. (Gaarder, M. “La eficiencia operativa del sistema de distribución de suplementos alimenticios del Programa de Desarrollo Humano Oportunidades.” Nota Técnica No.58).
• Coordination with other social programs implemented.
Achieved.
66% of Oportunidades high school students participate in Jóvenes con Oportunidades program.
11,000 women participate in Adult Education programs run by the Instituto Nacional para la Educación de Adultos (INEA).
- 5 -
Second Phase Triggers and Indicators Indicators Targets Achieved and Verification Sources
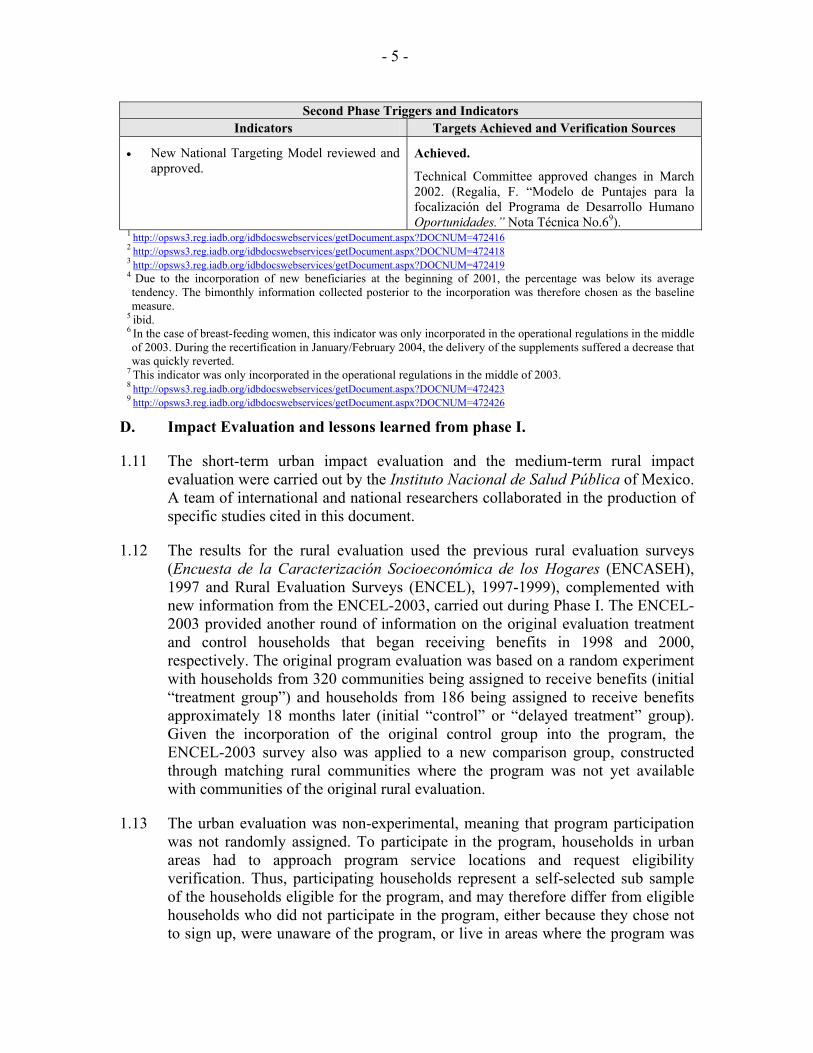
• New National Targeting Model reviewed and approved.
Achieved.
Technical Committee approved changes in March 2002. (Regalia, F. “Modelo de Puntajes para la focalización del Programa de Desarrollo Humano Oportunidades.” Nota Técnica No.69).
1 http://opsws3.reg.iadb.org/idbdocswebservices/getDocument.aspx?DOCNUM=472416 2 http://opsws3.reg.iadb.org/idbdocswebservices/getDocument.aspx?DOCNUM=472418 3 http://opsws3.reg.iadb.org/idbdocswebservices/getDocument.aspx?DOCNUM=472419 4 Due to the incorporation of new beneficiaries at the beginning of 2001, the percentage was below its average tendency. The bimonthly information collected posterior to the incorporation was therefore chosen as the baseline measure.
5 ibid. 6 In the case of breast-feeding women, this indicator was only incorporated in the operational regulations in the middle of 2003. During the recertification in January/February 2004, the delivery of the supplements suffered a decrease that was quickly reverted.
7 This indicator was only incorporated in the operational regulations in the middle of 2003. 8 http://opsws3.reg.iadb.org/idbdocswebservices/getDocument.aspx?DOCNUM=472423
9 http://opsws3.reg.iadb.org/idbdocswebservices/getDocument.aspx?DOCNUM=472426
D. Impact Evaluation and lessons learned from phase I.
1.11 The short-term urban impact evaluation and the medium-term rural impact evaluation were carried out by the Instituto Nacional de Salud Pública of Mexico. A team of international and national researchers collaborated in the production of specific studies cited in this document.
1.12 The results for the rural evaluation used the previous rural evaluation surveys (Encuesta de la Caracterización Socioeconómica de los Hogares (ENCASEH), 1997 and Rural Evaluation Surveys (ENCEL), 1997-1999), complemented with new information from the ENCEL-2003, carried out during Phase I. The ENCEL-2003 provided another round of information on the original evaluation treatment and control households that began receiving benefits in 1998 and 2000, respectively. The original program evaluation was based on a random experiment with households from 320 communities being assigned to receive benefits (initial “treatment group”) and households from 186 being assigned to receive benefits approximately 18 months later (initial “control” or “delayed treatment” group). Given the incorporation of the original control group into the program, the ENCEL-2003 survey also was applied to a new comparison group, constructed through matching rural communities where the program was not yet available with communities of the original rural evaluation.
1.13 The urban evaluation was non-experimental, meaning that program participation was not randomly assigned. To participate in the program, households in urban areas had to approach program service locations and request eligibility verification. Thus, participating households represent a self-selected sub sample of the households eligible for the program, and may therefore differ from eligible households who did not participate in the program, either because they chose not to sign up, were unaware of the program, or live in areas where the program was
- 6 -
not available yet. In view of these potential differences, the impact evaluation used the method of matching to take into account preexisting differences between participating and nonparticipating households so that the effect of the program could be isolated. The method of matching compares outcomes of individuals or households that participate in the program to those of similar “matched” individuals or households that do not participate.
1.14 Short-term Urban evaluation. Tables I.3 through I.5 show the performance of phase I with respect to targeting efficiency, impacts on education, health, nutrition and food consumption indicators, for new beneficiary families in the urban areas. Results show that the program performed well in the urban areas, achieving results similar to those reported for rural areas by the International Food Policy Research Institute (IFPRI), and summarized in the loan proposal for phase I.
1.15 The performance of the National Targeting Model and the new operational procedures for incorporation of beneficiaries in the urban areas yielded targeting rates that were effective compared to those previously obtained in the rural area (rate of 16% for the rural areas). It is important to note that it was expected that the proxy means model would perform less effectively in the urban areas. That is, that its power of prediction would be less than in rural areas. However, the model not only performed well, but most of the “inclusion errors”, beneficiaries above the poverty line, were families whose welfare was not much greater than those below the line. Of the 22% inclusion errors in the urban areas, 70% are quasi-poor families right above the poverty line.
1.16 Another measure of performance of targeting in the urban areas is the percentage of benefits that would reach beneficiaries under the current targeting scheme compared to a random assignment of program participation, or no targeting. For the urban areas, the percentage of benefits that reach the poor is 88% higher than with random assignment. This indicator also fares well compared to previous results for the rural areas, where the percentage of benefits that reached the poor were close to a 100% higher than with random assignments.
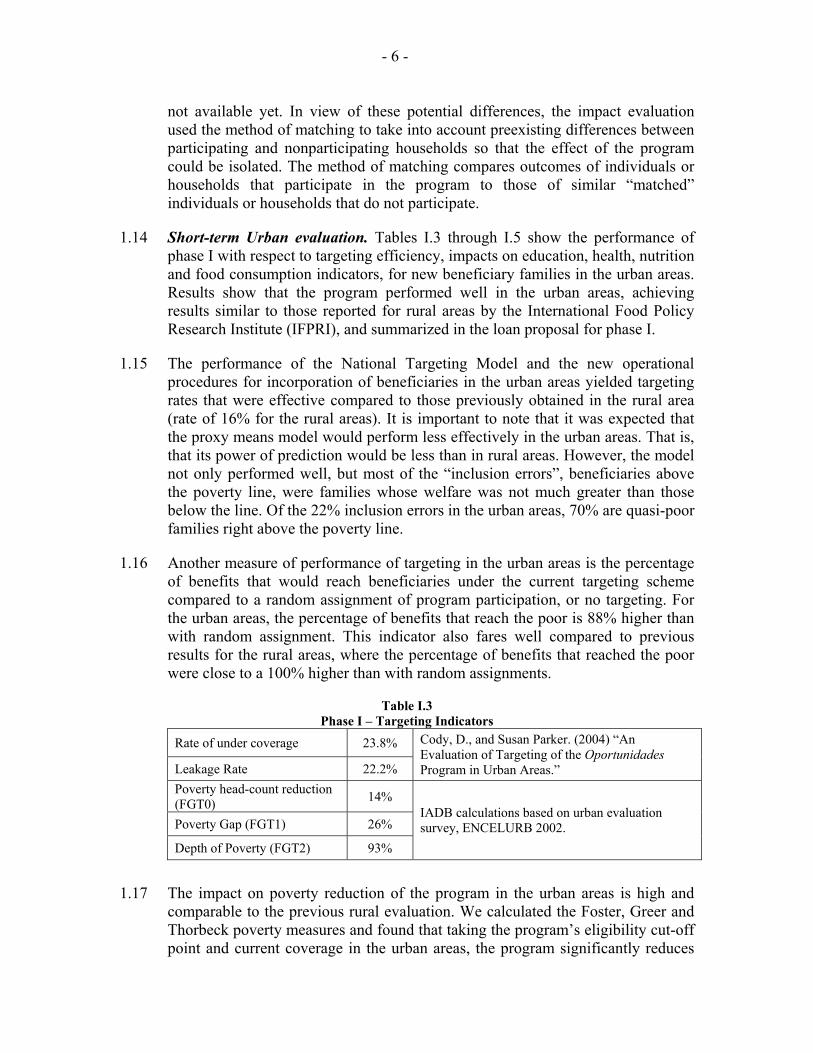
Table I.3 Phase I – Targeting Indicators
Rate of under coverage 23.8%
Leakage Rate 22.2%
Cody, D., and Susan Parker. (2004) “An Evaluation of Targeting of the Oportunidades Program in Urban Areas.”
Poverty head-count reduction (FGT0) 14%
Poverty Gap (FGT1) 26%
Depth of Poverty (FGT2) 93%
IADB calculations based on urban evaluation survey, ENCELURB 2002.
1.17 The impact on poverty reduction of the program in the urban areas is high and comparable to the previous rural evaluation. We calculated the Foster, Greer and Thorbeck poverty measures and found that taking the program’s eligibility cut-off point and current coverage in the urban areas, the program significantly reduces
- 7 -
not only the percentage of people under the line, but also improves the distribution of income among the poor.
1.18 Education performance indicators showed that the program performed well compared to the rural areas. The program had statistically significant impacts on the educational attainment levels of boys, ages 8-18, with the largest impacts observed in the 12-14 age range. Educational attainment increases by about 0.12 to 0.20 grades of additional schooling. For girls, the program significantly impacts educational attainment at ages 6-18, with the largest impacts also observed for ages 12-14. Estimates range from 0.08 to 0.15 grades of additional education.
1.19 The evaluation found some evidence of impact on enrollment rates for the 2002-2003 school year. These estimates may understate the impacts of the program, due to the fact that many families did not know in the fall of 2002, when they enrolled their children in school, whether they had qualified for the program. Enrollment rates are significantly higher for participating children (5.7 percentage points for girls and 9.6 percentage points for boys) at age 6, suggesting that the program encourages on-time enrollment5. In addition, the evidence shows the program led to a substantial decrease (9 percentage points) in the drop-out rate for older boys (ages 15-18).
1.20 The program also increased the amount of time that children/youth devote to studying, both for both girls and boys. Boys spend about one hour more time per week studying. Girls age 6-11 spend about 49 minutes more per week and girls age 15-18 spend about 1.5 hours more per week studying.
1.21 Indicators of child labor show that boys age 12 and older experience a significant decrease in the percentage currently working. For girls, the impacts on the percentage working are generally less pronounced. For 15-18 year old girls, the program reduces the percentage that works by around 5 percentage points.
1.22 Table I.4 shows that there is little scope for an effect of the program on enrollment rates at primary grades where they are already very high. The program considered whether decreasing or eliminating the subsidies at the lower grades and using the resources to increase the level of payments to higher-grade levels would lead to larger education effects on enrollment. However, changing the subsidy schedule in this way would have had distributional consequences, shifting resources towards families whose children have higher educational attainment levels, and thus are more likely to be less poor and closer to the poverty line.
1.23 Additionally, shifting payment schedules to potentially increase the impact on enrollments would diminish other important educational effects the program is having, even in the short-term in the urban areas. Table I.4 shows that the program has important age at entry and progression effects for both girls and boys in the first years of basic education. It is well known in the educational literature
5 Children from poor families tend to start school at older ages than the mandatory age.
- 8 -
that, among the poor, the first years of basic education have the greatest risks of drop-out and repetition.
Table I.4 Phase I – Short-term Urban Net Impact Indicators. Education by gender
Indicators Boys Girls
Proportion enrolled at age 61 Increase of 10% points Increase of 6% points All enrollment2 Ages 7-11 Ages 12-14 Ages 15-18
None None Increase of 6% points
None None None
Proportion progressing2 Ages 6-7 Ages 8-11 Ages 12-14 Ages 15-18
Increase of 7% points Increase of 12% points Increase of 14% points Increase of 11% points
Increase of 10% points Increase of 13% points Increase of 15% points None
Incidence of labor Ages 8-11 Ages 12-14 Ages 15-18 Ages 19-21
None Decrease of 5% points Decrease of 7% points Decrease of 24% points
None None Decrease of 5% points None
Sources: Results are from Todd, Gallardo-Garcia, Behrman and Parker, December 2004 (all estimates). 1 Estimators reported are difference in difference with nearest neighbor matching. Reported results are
significant at least at the 10% level. 2 Progression is defined as having accumulated a grade during the year.
1.24 Nutrition indicators for the urban areas show that total consumption increased significantly for program families. In particular, we note that total food consumption and consumption of protein rich foods, like meat increased in a higher proportion than total consumption. These results seem to point to the same pattern of effects on consumption observed for the rural areas; where families tend to increase their food consumption in the short term and increase their savings in the medium term. The evaluation reports no impact on stunting which is not surprising given its low prevalence in the urban areas.
1.25 Health indicators point to a clear increase in the utilization of ambulatory and preventive health services for children and adults, and a slight decrease in the utilization of curative services (hospitalizations). In particular, a 16% increase in the number of health check-ups during the last 6 months have been observed in children ages 0-5, reflecting that households are complying with the program co-responsibilities in relation to preventive consultation. The decrease of 8% and 6% in the number of hospitalizations in the last 12 months among children ages 6-15 and adults ages 16-49, respectively, may be early indications that the increase in preventive actions is having positive health impacts.
1.26 This tendency of a positive health impact after only one year of execution is further confirmed in the self-reported sick days and days incapacitated. In the first case, a 23.5% decrease in sick days is noted for children ages 6-15, whereas
- 9 -
in the latter, a decrease of 58.3% and 49.7% is found for children ages 6-17 and adults ages 18-50, respectively.
1.27 The program had a net positive impact on the prevalence of anemia, as a function of better diets based on consumption of protein rich foods. Although access to diabetes detection tests (glucose level tests) and health services more generally increased for ages 40+ by about 22%, this increased accessibility to early diagnostic services was not reflected in a higher prevalence of diabetes in the group incorporated in the program. This finding could be due to the program population being relatively healthy and requesting the test in a preventive manner, possibly as a result of the information that has been disseminated during the health talks (pláticas) or due to the increased access to basic health services.
1.28 Although the level of knowledge of modern Family Planning Methods (FPM) is high in urban areas, the program succeeded in having a positive effect (6% increase) on the proportion of women with knowledge of modern FPM. Use of FPM increased overall in the urban population but not significantly more in the beneficiary population. As for prenatal care, the program has had a significant positive effect on the quality of the attention, whereas initial bottlenecks in access to health posts may explain the half-month delay (0.53) in the month prenatal care was initiated.
Table I.5 Phase I – Short-term Urban Net Impact Indicators. Health and Nutrition
Short-term Urban Net Impacts Indicators Total Source
Service Utilization
Number of health check-ups during last 6 months:
Ages 0-5
Has attended health check-ups during last 12 months:
Ages 18-49 50+
# of hospitalizations in the last 12 months:
Ages 6-15 Ages 16-49
Has been hospitalized during last 12 months:
Ages 50-+
16% increase
19% increase 16% increase
8% decrease 6% decrease
4% decrease
Gutiérrez, J.P., Bautista, S., Gertler, P., Hernández, M. y S. Bertozzi, “Impacto de Oportunidades en el estado de salud, morbilidad y utilización de servicios de salud de la población beneficiaria: resultados de corto plazo en zonas urbanas y de mediano plazo en zonas rurales.” December 15, 2004.
Morbidity/ Diabetes
Glucose level greater than 126 for ages 40+
Access to detection and health
No significant effect on glucose level of incorporated diabetics after 1 year of incorporation
7.3 percentage points or 21.7%
Hernández-Avila, M., Meneses-González, F., Téllez-Rojo, M., Manzano, A. Y R. López, “Evaluación de la calidad de la atención médica en población diabética usuaria del Programa
- 10 -
Short-term Urban Net Impacts Indicators Total Source
services for ages 40+ increase in use of glucose level test 1
Oportunidades. México, 2003.” December 1, 2004.
Anemia Prevalence of anemia
Infants 6-23 months
54% decrease
Neufeld L., Sotres-Álvarez, García R., García P., Tolentino L., Fernald L. y Rivera J., “Evaluación del estado nutricional y adquisición de lenguaje en niños de localidades urbanas con y sin el programa Oportunidades.” December 2004.
Health of adults
Number of sick days (last 30 days, self-reported)
<6 6-15 16-49 50+
Number of days incapacitated (last 30 days, self-reported)
6-17 18-50 50+
None 23.5% decrease2 None None
58.3% decrease3 49.7% decrease4 None
Gutiérrez, J.P., Bautista, S., Gertler, P., Hernández, M. y S. Bertozzi, “Impacto de Oportunidades en el estado de salud, morbilidad y utilización de servicios de salud de la población beneficiaria: resultados de corto plazo en zonas urbanas y de mediano plazo en zonas rurales.” December 2004.
Reproductive Health
Family Planning Methods (FPM)
Prenatal care (PC)
2.96 percentage points increase (or 6% increase) in the proportion of women with knowledge of modern FPM.
0.53 months of 15.8% delay in the month prenatal care was initiated5. 8.32 percentage points or 32% increase in the proportion of births with adequate PC (Kessner index).
13.55 percentage points or 21.8% increase in the proportion of births with an adequate PC (index modified by Oportunidades).
Hernández Prado, B., Urquieta Salomón, J., Ramírez Villalobos, M. y J. Figueroa, 2004, “Impacto de Oportunidades en la salud reproductiva de la población beneficiaria.” December 1, 2004.
Risk Behavior
Ever smoked a cigarette (age 15-21)
Occasional consumption of alcohol (age 15-21)
Unprotected sex (age 15-21)
4% decrease
1.7% decrease
None
Bertozzi, S, Gutiérrez, J.P., Gertler, P. y M. Hernández, 2004, “Impacto de Oportunidades en comportamientos de riesgo de los adolescentes y en sus consecuencias inmediatas: resultados de corto plazo en zonas urbanas y de mediano plazo en zonas rurales.” December, 2004.
- 11 -
Short-term Urban Net Impacts Indicators Total Source
Nutritional Status
Stunting (Height for Age Z score < -2.00)
6-23 months Supplement Consumption
None 50% of beneficiary children consume Nutrisano at least once per week. The median consumption was 20 g/day, significantly less than the expected 44 g/d. 25% of lactating women consume Nutrivida.
Neufeld L., Sotres-Álvarez, García R., García P., Tolentino L., Fernald L. y Rivera J., “Evaluación del estado nutricional y adquisición de lenguaje en niños de localidades urbanas con y sin el programa Oportunidades.” December, 2004.
Neufeld L., Sotres-Álvarez, Flores L., Tolentino L., Jiménez J. y Rivera J., “Consumo del suplemento alimenticio Nutrisano y Nutrivida de niños y mujeres beneficiarias de Oportunidades en zonas urbanas.” December, 2004.
Family Consumption
Total Consumption Total Food Consumption Food Consumption of meat (proteins) Food Consumption of fruits and vegetables
Increase of 5.8% Increase of 7.5% Increase of 11% Increase of 7.9%
Angelucci, M., Orazio Atanasio, and Jonathan Shaw. “The effect of Oportunidades on the level and composition of consumption in urban areas.” December, 2004.
1 IADB calculations using available information in source. 2 ibid. 3ibid. 4 ibid. 5 ibid.
1.29 Medium-term rural evaluation. Tables I.6 through I.7 show the performance of phase I with respect to medium-term impacts on education, health, and nutrition indicators, for beneficiary families in the rural areas. Impact indicators show that the program results are lasting and that several medium-term effects are becoming manifest. In particular, it is worth mentioning those related to improvements in educational achievement, physical and behavioral development and nutritional status of children. Children from program families are performing substantially better than children in control communities. Furthermore, impact indicators show that the program is having positive effects on maternal health, with a significant decrease (11%) in maternal mortality in program incorporated communities as compared to non-incorporated ones, and an increase in the utilization and quality of prenatal and qualified delivery care, as well as of Family Planning Methods (17% increase).
1.30 In education, these impacts are reflected on increases in on-time promotion rates, completed years of schooling, and in some instances increases in performance on test scores. In the case of completed years of schooling, the observed effects are in the neighborhood of one full year of additional completed schooling for program participants after five years in the program. On-time promotion improvements
- 12 -
vary between 30 and 60 percent, particularly for those who were of a younger age in 1997. In both cases results vary by age and gender and overall tend to be stronger for boys. For test scores, boys who were 10 in 1997, saw increases in raw scores of between 7 and 10 percent, depending on the test subject. Girls of age 12 in 1997 show significant improvements in raw reading scores. In other age groups test results are generally not significant. However, it should be noted that a limitation of the test scores analysis is the lack of a baseline for achievement tests. Without a baseline to control for pre-program differences between treatment and control groups, it is possible that test results for other age and gender combinations would not be measured, particularly if the control group’s education endowments before the program were better than those of the treatment group.
1.31 As for morbidity indicators, results show a high prevalence of obesity, hypertension and diabetes in the entire study population. However, participation in Oportunidades resulted in reduced prevalence of obesity, hypertension and hypertension symptoms.
Table I.6 Phase I – Medium-term (1997 – 2003) Net Impacts Rural Indicators. Education by gender
Indicators Boys Girls Grades of schooling completed1 Children’s age in 1997
9 10 11 12 13
Increase (0.95 grades) Increase (1.14 grades) Increase (1.31 grades) Increase (1.11 grades) Increase (0.87 grades)
Increase (0.96 grades) Increase (0.93 grades) Increase (0.87 grades) Increase (0.74 grades) None
Proportion of students progressing on time2 Children’s age in 1997
9 10 11 12 13
Increase of 37.7% Increase of 51.5% Increase of 63.6% Increase of 52.3% None
Increase of 38.8% Increase of 30.4% None None None
Sources: Behrman, Parker and Todd, 2004 (all estimates). 1 A 1 grade increase means that beneficiary children accumulated one extra grade compared to children’s belonging to the control group.
2 On time progression is defined as completion of five grades during the 1997-2003 period.
- 13 -
Table I.7 Phase I –Medium-term Rural Net Impact Indicators. Health and Nutrition
Indicators Total Source
Service Utilization
Number of health check-ups in the last 6 months:
0-5 Has attended health check-ups in last 12 months:
18-49 50+
% Weighed during last visit Ages 0-5
# of hospitalizations in the last 3 years:
Ages 6-15 Ages 16-49
Has been hospitalized during last 3 years
Ages 50+
12% increase 12% increase 18% increase
1.7% increase
None 9% decrease1
2% decrease
Gutiérrez, J.P., Bautista, S., Gertler, P., Hernández, M. y S. Bertozzi, “Impacto de Oportunidades en el estado de salud, morbilidad y utilización de servicios de salud de la población beneficiaria: resultados de corto plazo en zonas urbanas y de mediano plazo en zonas rurales.” December, 2004.
Mortality
Maternal Mortality
Infant Mortality
11 % lower in incorporated Municipalities2 (average of 79 maternal deaths avoided).
15% lower if looking at Municipalities that have between 4% and 35% of population incorporated.
2 % decrease in incorporated Municipalities.
6% decrease if looking at Municipalities with more than 35% of the population participating.
Hernández, B., Ramírez, D., Moreno, H. y N. Laird, “Evaluación del Impacto de Oportunidades en la Mortalidad Materna e Infantil.” March, 2004.
Morbidity
Overweight and obesity Ages 21-70
Hypertension Ages 21-70
6.4 percentage points reduction in prevalence (from 24 to 17.6% of the population) or a 26.7% reduction in prevalence.
7.2 percentage points reduction in prevalence (from 39 to 31.8 % of the population) or an 18.5% reduction in prevalence.
Decrease of 0.222 in the number of symptoms related to
Fernald, L., Gertler, P. and G. Olaiz, “The Medium Term Impact of Oportunidades on Obesity and Chronic Disease in Rural Areas.” March, 2004.
- 14 -
Indicators Total Source
Diabetes (defined as glucose level greater than 126)
Ages 21-70
hypertension3 (from 1.68 to 1.46) or a 13% reduction in prevalence.
Decrease of 0.131 in the number of symptoms related to diabetes4 (from 1.2 to 1.07) or a 10.9% reduction in prevalence.
Anemia
Mean hemoglobin values Ages 3-6
Prevalence of anemia Ages 3-6
Females: 2.6% decrease Males: None Females: 26.1 % decrease Males: None
Gertler P. and Fernald L. ”The Medium Term Impact of Oportunidades in Child Development in Rural Areas.” Mimeo, October, 2004.
Health of children, adolescents and adults
Number of sick days (last 30 days)
<6 6-15 16-49 50+ Number of days incapacitated 6-15 16-49 50+
20.4% decrease5 None 21.2 % decrease6 None 33.1% decrease7 13.6% decrease8 None
Gutiérrez, J.P., Bautista, S., Gertler, P., Hernández, M. y S. Bertozzi, “Impacto de Oportunidades en el estado de salud, morbilidad, y utilización de servicios de salud de la población beneficiaria: resultados de corto plazo en zonas urbanas y de mediano plazo en zonas rurales.” December, 2004.
Cognitive development: Woodcock-Johnson tests
(3-6 years old)9
Peabody Picture Vocabulary Test Language (3-6 years old)
Mac Arthur Communicative Development Inventories
(2 years old)10
Girls: None
Boys: score about 5 % better across all tests11
Physical Development
McCarthy Scales of Children’s Abilities (3-6 years old)8
Girls: 10% increase Boys: 15% increase
Behavioral development
Achenbach Child Behavior Checklist (3-6 years old)
Girls: 9% decrease in socio-emotional problems
Gertler, P. and L. Fernald, “The Medium Term Impact of Oportunidades on Child Development in Rural Areas.” November, 2004.
- 15 -
Indicators Total Source
Reproductive Health
Family Planning Method (FPM)
14% increase in knowledge of FPM (or almost one method (75) of 8 possible ones). 17.23% increase in use of modern FPM.
Prado, B., Urquieta Salomón, J., Ramírez Villalobos, M. y J. Figueroa, “Impacto de Oportunidades en la salud reproductiva de la población beneficiaria.” December, 2004.
Prenatal Care (PC)
Qualified Delivery Care (QDC)
6.74% increase in proportion of pregnancies with prenatal care.
Prenatal care initiated approximately 14 days earlier in the pregnancy.
11.86% increase in number of PC visits.
61% increase in proportion of births with satisfactory PC index (Kessner).
Approximately 20% increase in number of procedures received (Mexican Norms for PC).
20% increase in the proportion of women who received QDC.
Risk Behavior
Ever smoked a cigarette (age 15-21)
Occasional consumption of alcohol
(age 15-21)
Unprotected sex (age 15-21)
15.4% decrease.
11.4% decrease.
None.
Bertozzi, S, Gutiérrez, J.P., Gertler, P. y M. Hernández, “Efecto de Oportunidades en la prevalencia de comportamientos de riesgo en la adolescencia.” December, 2004.
- 16 -
Indicators Total Source
Nutritional Status
Stunting (Height for Age Z score < -2.00) 2-6 months
Females 39.3% decrease Males 19.4% decrease
Gertler P. and Fernald L. “Medium Term Impact of Oportunidades on Child Development in Rural Areas.” October, 2004.
1 IADB calculation using available information in source. 2 i.e. with at least one incorporated locality. 3 E.g. headaches, dizziness, or buzzing in the ears. 4 E.g. thirstiness, hunger, loss of weight or blurred vision. 5 IADB calculation using available information in source. 6 ibid. 7 ibid. 8 ibid. 9 Test of long-term and short-term memory and visual integration. 10 Improvement in language development. 11All effects are positive but sample sizes too small to determine significance.
1.32 These results tell a coherent story – that Oportunidades is having substantial and positive impacts on education, nutrition and health indicators of beneficiary families. These results are sustained and increased with greater exposure to the program. Thus, we conclude that the program has successfully achieved the goals set out for the first phase: (i) expanding coverage to the urban areas; (ii) ensuring the relatively same level of benefits to urban beneficiaries as those achieved for rural families; and (iii) sustaining and increasing program benefits for rural families already in the program.
1.33 The Bank has played a key role in last years in the program’s design and evaluation. In particular, the Bank provided technical expertise in the following areas: (i) incorporation of beneficiaries in the urban areas, building on Chile’s Ficha CAS, and Colombia’s SISBEN model; (ii) designing a quasi-experimental evaluation design, which allowed the government to maintain control groups; (iii) peer reviewing each evaluation document in the areas of targeting, education, health, nutrition, and consumption, among others; (iv) maintain the original design of the program by analyzing the justification for each proposed change; and (v) strengthening the operational audit of the program by shifting the representativeness of the audit’s sample from the national to the state level, among others.

II. PHASE II
A. Objectives and description
2.1 The purpose of the program is to increase human capital accumulation among extremely poor families, by improving their access to education, health and nutrition.
2.2 The specific objectives of the second phase are: (i) to sustain and increase the demand for education, health and nutrition in order to ensure medium and long term impacts; (ii) to strengthen the program’s design, in the areas of educational health talks and community participation; (iii) to increase the operational efficiency of the program; and (iv) to continue the external impact evaluation of the program.
B. Proposed changes to the program
2.3 The second phase will have the same components as the first phase with the following changes in activities:
a) Targeting of beneficiaries, operational audits and monitoring indicators
2.4 Geographic targeting of localities will follow operational processes developed during phase I. Households will qualify under the National Targeting Model, which will be reviewed periodically to ensure the continued relevance of proxy means variables. The program will require the written non-objection of the Bank of any updates to the methodology of the National Targeting Model.
2.5 The program will continue to use as its source of information for targeting the household surveys relevant for each process, ENCASEH and ENCASURB for new families, and ENCRECEH for the recertification of old families according to the schedule set out in the Rules of Operations of the program.
b) Health and nutrition
2.6 One of the most important lessons from phase I relates to the composition of the micronutrient supplements provided to infants and pregnant and lactating mothers. Impact evaluation studies found a significant reduction in the prevalence of anemia, even though the consumption of the supplements by pregnant and breast-feeding mothers and children under 2, was quite low. These studies found that, even if consumption had been higher, absorption of the type of iron included in the supplements is extremely low. Thus, the impact obtained on anemia is a result of better diets and not necessarily a result of supplement consumption. These studies have concluded that the impact on anemia could have been twice as large had the supplements contained ferrous sulfate or gluconate sulfate instead of reduced iron and families consume them on the appropriate schedule. The
- 18 -
Consumption of supplementChiapas
45.9
18.4
33.7
20.9
80.8 71.6
85.6
35.2
0 10 20 30 40 50 60 70 80 90
100
Proper preparation Daily Mid-day Appropriate age
In p
erce
ntag
e
Before After
composition of the supplements, will therefore, be changed to a higher absorption iron. After July 2005, Bank financing of the supplement will be condition to the Bank receiving notification of this change.
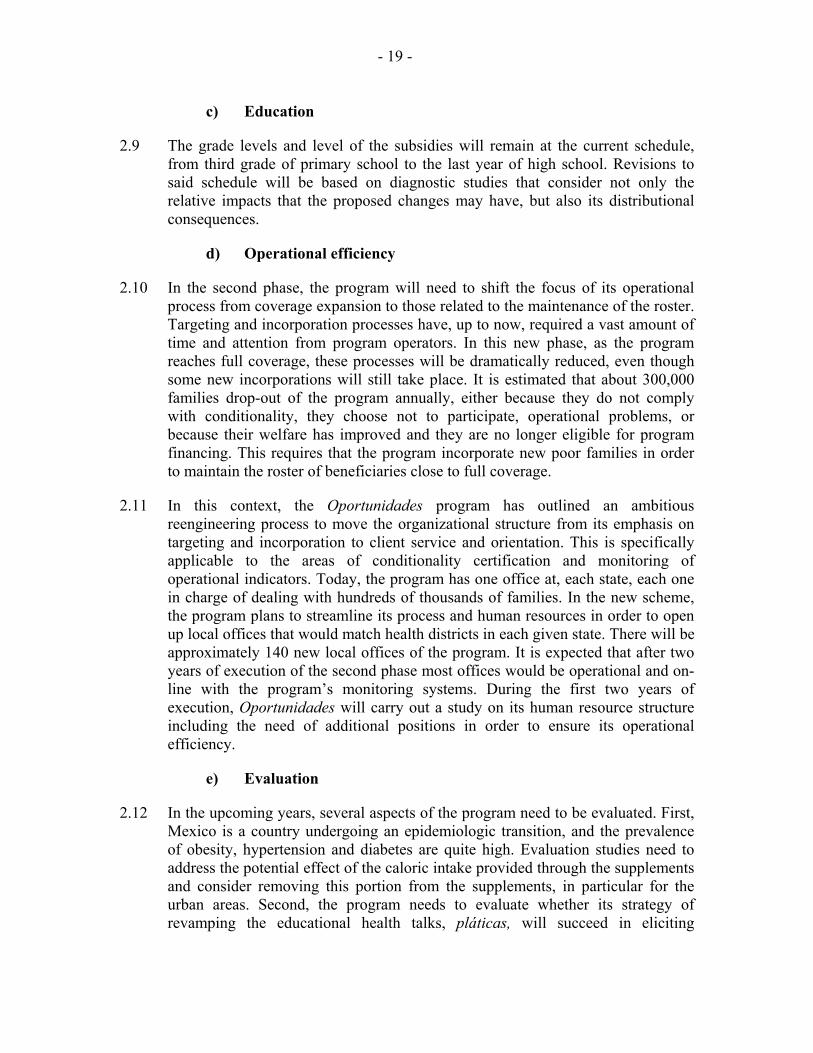
2.7 The low consumption of the supplements is worrisome because it leaves children under two years at a high risk of anemia, since they will not readily benefit from better diets. This finding questions the impact of the education talks or pláticas, to effect change in behavior from families, as well as the consumption of the supplement at the household level. While the pláticas have evolved substantially during the first phase, in particular for indigenous populations, there is still a great need for improvement. Before phase I, pláticas, were carried out in Spanish, today materials are tailored to indigenous languages. However, the reality for many communities is still that few pláticas are carried out fully in the community’s language. Oportunidades needs to rapidly move to train more local “promotoras” that speak in the respective languages, in order to increase the impact of the education topics by beneficiaries. Changes in the education pláticas were piloted in 2004, in the indigenous Tsotsil communities in the states of Chiapas and Veracruz. The following graph shows large and significant results for communities in Chiapas. Results for both states were similar in magnitude.
Graphic II.1
2.8 During the second phase the program will revise its health education component to increase its effectiveness. Evaluations have found that education talks become repetitive and are more informational than when geared towards behavioral modifications by participating families. In order to achieve greater behavioral modifications and larger health and nutrition impacts, Oportunidades will revise the three education approaches6 and develop and evaluate a community participation based model to improve health and nutrition practices through the program’s local community committees, composed of the programs “vocales” (elected representatives of a group of beneficiaries).
6 These are made up of the IMSS-Oportunidades model, the INEA model and the traditional model.
- 19 -
c) Education
2.9 The grade levels and level of the subsidies will remain at the current schedule, from third grade of primary school to the last year of high school. Revisions to said schedule will be based on diagnostic studies that consider not only the relative impacts that the proposed changes may have, but also its distributional consequences.
d) Operational efficiency
2.10 In the second phase, the program will need to shift the focus of its operational process from coverage expansion to those related to the maintenance of the roster. Targeting and incorporation processes have, up to now, required a vast amount of time and attention from program operators. In this new phase, as the program reaches full coverage, these processes will be dramatically reduced, even though some new incorporations will still take place. It is estimated that about 300,000 families drop-out of the program annually, either because they do not comply with conditionality, they choose not to participate, operational problems, or because their welfare has improved and they are no longer eligible for program financing. This requires that the program incorporate new poor families in order to maintain the roster of beneficiaries close to full coverage.
2.11 In this context, the Oportunidades program has outlined an ambitious reengineering process to move the organizational structure from its emphasis on targeting and incorporation to client service and orientation. This is specifically applicable to the areas of conditionality certification and monitoring of operational indicators. Today, the program has one office at, each state, each one in charge of dealing with hundreds of thousands of families. In the new scheme, the program plans to streamline its process and human resources in order to open up local offices that would match health districts in each given state. There will be approximately 140 new local offices of the program. It is expected that after two years of execution of the second phase most offices would be operational and on-line with the program’s monitoring systems. During the first two years of execution, Oportunidades will carry out a study on its human resource structure including the need of additional positions in order to ensure its operational efficiency.
e) Evaluation
2.12 In the upcoming years, several aspects of the program need to be evaluated. First, Mexico is a country undergoing an epidemiologic transition, and the prevalence of obesity, hypertension and diabetes are quite high. Evaluation studies need to address the potential effect of the caloric intake provided through the supplements and consider removing this portion from the supplements, in particular for the urban areas. Second, the program needs to evaluate whether its strategy of revamping the educational health talks, pláticas, will succeed in eliciting
- 20 -
behavioral change in beneficiary families, comparing it to the baseline situation, and to the other two models currently in the field (Preven- IMSS-rural and INEA).
2.13 The second phase will finance evaluation costs related to the following areas, among others: (i) a follow-up round of surveys for the rural panel; (ii) a follow-up round of surveys for the urban panel; (iii) analysis of the patterns of migration of the beneficiary population; (iv) a randomized trials evaluation of micronutrient and caloric supplementation of beneficiaries; (v) analysis of improvements in welfare in beneficiary families overtime and graduation schemes (EDA); and (vi) an impact evaluation of the health component comparing the IMSS-Oportunidades model, the State Health Secretariats model and INEA education model.
f) Monitoring
2.14 In the second phase the program will review the stock of monitoring indicators of the SIIOP to ensure their continued relevance. It is also expected that local offices will be able to access SIIOP information of their beneficiary families in real time so as to enable immediate remedial steps where necessary. The program has already implemented such a system to monitor dropouts. In addition, sentinel points will include information related to the indicators of nutrition described below.
2.15 During the first year of execution, the executing agency will develop a model for the continuous operational improvements, that will allow measuring several operational aspects, such as: (i) timeliness, security and physical conditions in relation to payments; (ii) corrections of operational errors and response time to requests; and (iii) information and orientation services to the beneficiaries of the program.
2.16 The following analysis will guide the evaluation of phase II of the Bank’s program:
Table II.1 Results Framework for Phase II
Areas Targeting • Analysis of the performance of the National Targeting Model. Nutrition • Supplement iron composition changed. • Recommendation about the supplement’s caloric composition for urban areas. • Randomized trials evaluation on micronutrient and caloric supplementation of beneficiaries. • Number of health posts with Oportunidades new community-based model implemented by state and municipality. • Number of health posts that carry out pláticas in indigenous languages/total number of health posts in indigenous
communities. Client Orientation • Proposal for a model of continuous improvements of program operations that includes indicators for measuring
timeliness, physical conditions of payment points, corrections of operational errors, among other aspects. Program Graduation • Analysis of welfare improvement in beneficiary families that are included in the EDA scheme.
- 21 -
C. Cost and financing
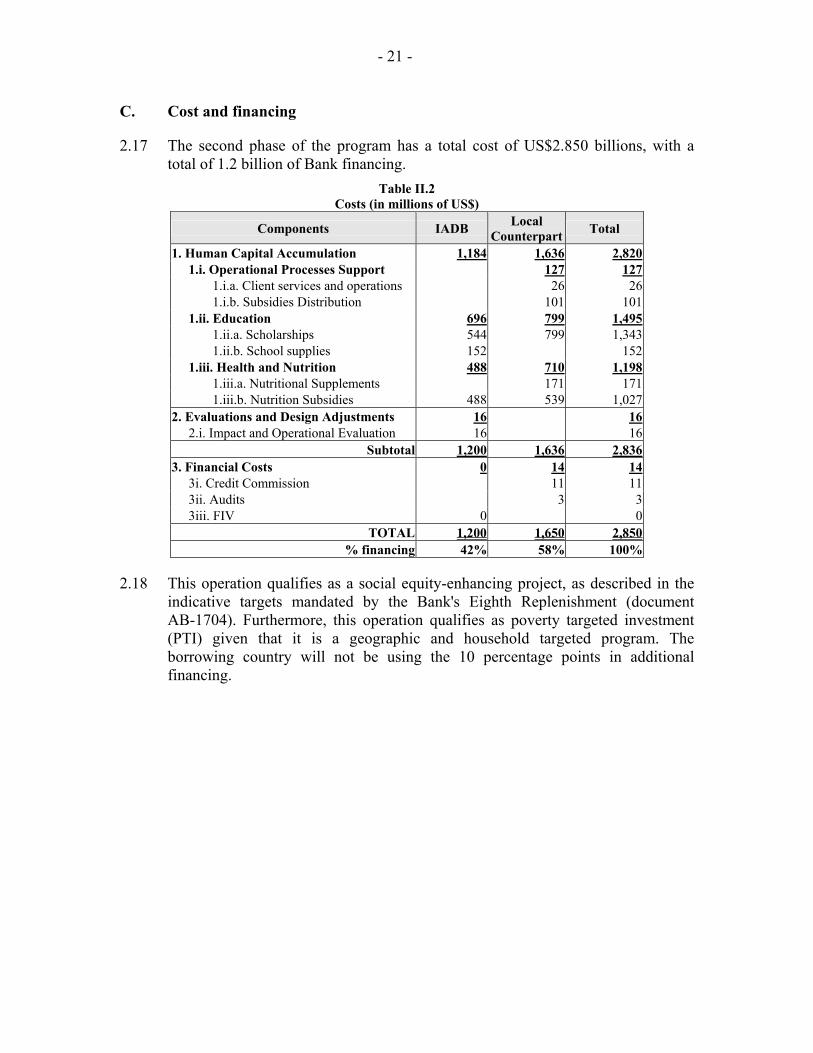
2.17 The second phase of the program has a total cost of US$2.850 billions, with a total of 1.2 billion of Bank financing.
Table II.2 Costs (in millions of US$)
Components IADB Local Counterpart Total
1. Human Capital Accumulation 1,184 1,636 2,820 1.i. Operational Processes Support 127 127 1.i.a. Client services and operations 26 26 1.i.b. Subsidies Distribution 101 101 1.ii. Education 696 799 1,495 1.ii.a. Scholarships 544 799 1,343 1.ii.b. School supplies 152 152 1.iii. Health and Nutrition 488 710 1,198 1.iii.a. Nutritional Supplements 171 171 1.iii.b. Nutrition Subsidies 488 539 1,027 2. Evaluations and Design Adjustments 16 16 2.i. Impact and Operational Evaluation 16 16
Subtotal 1,200 1,636 2,836 3. Financial Costs 0 14 14 3i. Credit Commission 11 11 3ii. Audits 3 3 3iii. FIV 0 0
TOTAL 1,200 1,650 2,850 % financing 42% 58% 100%
2.18 This operation qualifies as a social equity-enhancing project, as described in the indicative targets mandated by the Bank's Eighth Replenishment (document AB-1704). Furthermore, this operation qualifies as poverty targeted investment (PTI) given that it is a geographic and household targeted program. The borrowing country will not be using the 10 percentage points in additional financing.
III. PROGRAM EXECUTION
A. The borrower and executing agency
3.1 The borrower will be the United States of Mexico. The executing agency of the program will be the Secretariat of Social Development (Secretaría de Desarrollo Social, SEDESOL), through its deconcentrated entity the Program for Human Development Oportunidades. Nacional Financiera, SNC (NAFIN) will act as managing agent for the program.
B. Program execution, administration and operating rules
3.2 The program execution and administration remains as described in the program proposal (PR-2650). The proposed structure has proven to be a highly effective execution scheme.
3.3 The program will be governed by the operating rules of the Oportunidades program, which will be published in the Official Gazette and updated annually. National legislation requires the annual approval and publication of operating rules for all programs funded by the federal government. These operating rules contain specific guidelines for complying with technical, financial, environmental, and internal control requirements criteria. The operating rules of Oportunidades are approved annually by the Technical Council of the program. This Council is composed by representatives of SEDESOL, Secretariat of Finance, (SHCP), Secretariat of Public Education (SEP), Secretariat of Public Health (SSA), and the IMSS. Oportunidades annually prepares a proposal for changes to the rules for submission to the Council. Prior to submission to the technical Council, Oportunidades will need to obtain the Bank’s written non-objection. Prior to the first disbursement of the financing, the Executing agency will present evidence of the approval and entry into force of the Rules of Operations for 2005.
C. Procurement
3.4 The program does not include civil works, goods or related services. Consulting services will be procured in accordance with the “Policies for selection and contracting of consultants financed by the IDB”, (GN-2350-4 (hereinafter the Consultant Policies)). Unless otherwise provided, services of consulting firms shall be procured under contracts awarded under the quality-based selection method. The short list for consultant services estimated to cost less than US$500,000 equivalent per contract may comprise entirely national consultants. The services of the Centro de Investigación y Estudios Superiores en Antropología Social (CIESAS) for the qualitative evaluation of the program may be hired on a sole source basis7. Individual consultants shall be selected through comparison of qualifications as provided in the Consultant Policies. Individual
7 See paragraph 3.9 to 3.11 of the Consultant Polices

- 23 -
consultants may be selected on a sole-source basis with due justification in exceptional cases such as the case of consultants been rehired for the impact evaluation of the program8 or with the prior written approval of the Bank9.
3.5 Prior to the issuance of any RFP or the hiring of any consulting services, the Borrower shall provide the Bank for approval and review a plan for the selection of consultants that shall cover an 18-month period and that shall include contract cost estimates, contract packaging and applicable selection criteria and procedures. An update of such plan covering an 18-month period shall be presented to the Bank annually for review and approval and all selection of consultants’ services shall be undertaken in accordance with the latest update of the selection plan as approved by the Bank. Each contract for the hiring of consulting firms with an estimated cost of US$200,000 equivalent or more and each contract for individual consultants hired pursuant to the provisions of paragraph 5.4(b) or (d), shall be subject to the prior review of the Bank as provided in Appendix 1 of the Consultant Policies. All other contracts for the hiring of consultants’ services shall be subject to the ex-post review of the Bank as provided in Appendix 1 of the Consultant Policies. Consulting services for the evaluation may be hired by the Executing Agency or the Instituto Nacional de Salud Pública (INSP). For the latter, the INSP and the Executing agency shall enter into a inter-institutional agreement for the transfer of resources that shall also include provisions to guarantee that the INSP will apply the Consultant Policies and procurement procedures agreed upon in the Loan Contract, and will maintain adequate records and accounting of expenditures.
D. Execution, retroactive financing and disbursement schedule
3.6 The Bank supervision of disbursements for payments of scholarships, school supplies and nutrition subsidies will be carried out in an ex post modality, pursuant to the methodology used during phase I, which consists in a stratified random sample of expenditures, representative at the state and municipality’s level. The average monthly exchange rate will be applied to calculate the dollar equivalent of expenditures.
3.7 The Borrower has requested that up to the equivalent of US$31,200,000 of the resources of the financing be used to reimburse expenditures incurred after November 1, 2004 by the program for payments of education, nutrition and school supplies subsidies for the beneficiaries of the project. The Borrower has also requested that up to the equivalent of US$34,200,000 incurred after the same date in project expenditures for the payment of education and nutrition supplements for the beneficiaries of the Project and for the subsidies’ distribution fees be recognized by the Bank as part of the local contribution. Such anticipated financing and reimbursement of expenses shall be subject to the fulfillment of requirements substantially similar to those set forth in the Loan Contract.
8 See paragraph 5.4 (a) of the Consultant Policies. 9 See paragraph 5.4 (b) and (d) of the Consultant Policies.
- 24 -
3.8 The loan disbursement period will be 48 months. Cash transfers financing will be on a decreasing basis in accordance to the following schedule for each cohort of eligible families: 100% the first year of incorporation or recertification, 90% in the second year, 80% the third year, and 70% the forth year of incorporation. Eligible families are those new beneficiaries that qualified under the National Targeting Model in any given year and families that under the recertification process continue to receive full benefits from the program given their poverty classification.
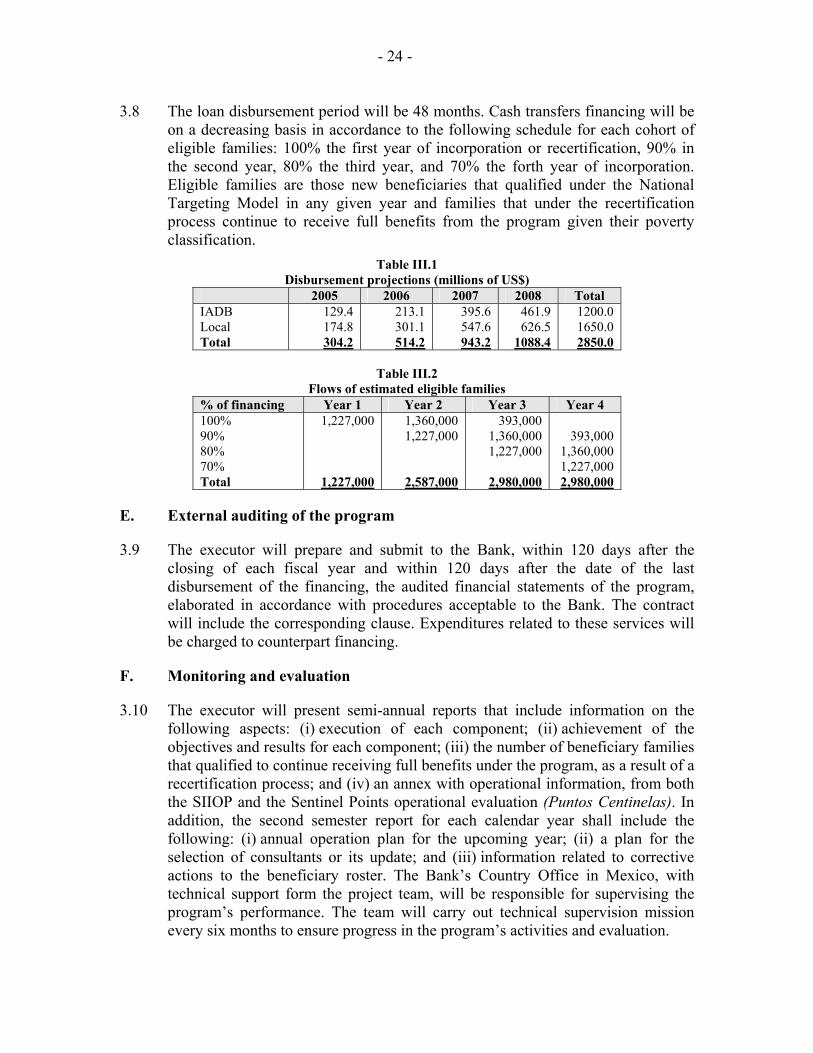
Table III.1 Disbursement projections (millions of US$)
2005 2006 2007 2008 Total IADB Local Total
129.4 174.8 304.2
213.1 301.1 514.2
395.6 547.6 943.2
461.9 626.5
1088.4
1200.0 1650.0 2850.0
Table III.2
Flows of estimated eligible families % of financing Year 1 Year 2 Year 3 Year 4 100% 90% 80% 70% Total
1,227,000
1,227,000
1,360,000 1,227,000
2,587,000
393,000 1,360,000 1,227,000
2,980,000
393,000
1,360,000 1,227,000 2,980,000
E. External auditing of the program
3.9 The executor will prepare and submit to the Bank, within 120 days after the closing of each fiscal year and within 120 days after the date of the last disbursement of the financing, the audited financial statements of the program, elaborated in accordance with procedures acceptable to the Bank. The contract will include the corresponding clause. Expenditures related to these services will be charged to counterpart financing.
F. Monitoring and evaluation
3.10 The executor will present semi-annual reports that include information on the following aspects: (i) execution of each component; (ii) achievement of the objectives and results for each component; (iii) the number of beneficiary families that qualified to continue receiving full benefits under the program, as a result of a recertification process; and (iv) an annex with operational information, from both the SIIOP and the Sentinel Points operational evaluation (Puntos Centinelas). In addition, the second semester report for each calendar year shall include the following: (i) annual operation plan for the upcoming year; (ii) a plan for the selection of consultants or its update; and (iii) information related to corrective actions to the beneficiary roster. The Bank’s Country Office in Mexico, with technical support form the project team, will be responsible for supervising the program’s performance. The team will carry out technical supervision mission every six months to ensure progress in the program’s activities and evaluation.

- 25 -
3.11 The Borrower and the Bank will meet annually during the first semester of each year to analyze progress in execution, based on the information reported in the semi-annual reports. The first meeting will take place after the loan is eligible for disbursements. The initial report will contain the annual plan of execution for the first year. The Borrower will present to the Bank a mid-term evaluation related to progress made in proposed reengineering of the program described in par. 2.11.