Embed Size (px)
Citation preview
Multinationals, Competition and Productivity Spillovers
through Worker Mobility∗
Katariina Nilsson-Hakkala
(Aalto University and Government Institute for Economic Research)
Alessandro Sembenelli
(University of Torino and Collegio Carlo Alberto)
September 6, 2011
Abstract
Spillovers can arise when foreign multinational firms (MNEs) train local employeeswho later join domestic firms, bringing with them part of the technological, marketingand managerial knowledge that they have acquired. Theoretical models by Fosfuri et al(2001) and Glass and Saggi (2002) suggest that the direction and the intensity of the mo-bility of trained workers is affected by market conditions including the degree of productmarket competition. This, in turn, details an additional channel through which compe-tition is likely to affect total factor productivity. In this paper, we take this hypothesisto the data for the first time by using the Finnish longitudinal employeer-employee data.We first quantify the importance of spillovers via worker mobility by estimating aug-mented production functions. Second, we estimate several competing risks model to assesthe impact of product market competition and absorptive capacity on worker mobility.Our results point out that the lack of competition reduces worker mobility, this in turnnegatively affecting the productivity of purely domestic plants.
∗Very preminary and incomplete. Not to be cited.
1
1 Introduction
A striking feature of the globalization in developed countries is that an increasing number of
domestic firms have become multinational either through foreign acquisitions or through an
expansion of greenfield activities abroad. This development has attracted interest both from
researchers and policy-makers. Policy-makers tend to be skeptical towards foreign acquisitions
as the “footloose” nature of multinationals is regarded as a threat to domestic jobs and
job security. However, multinational firms and inward foreign direct investments are known
to have many positive effects. In particular, multinationals tend to have some competitive
advantage based on superior technology or other firm-specific knowledge and, therefore, inward
FDI is believed to generate knowledge spillovers and productivity improvements which benefit
the domestic economy.
The objective of this paper is to analyze whether multinational activity generates positive
technology and under which conditions these spillovers occur. As it is well known, spillovers
from multinationals may take several forms such as i) backward and forward linkages between
foreign-owned and domestic firms, ii) demonstration effects which implies that domestic firms
imitate the technology of MNEs and iii) worker mobility as former employees of MNEs join
domestic firms and bring with them technological or other firm-specific knowledge (Blomström
and Kokko, 1998). In this paper we focus on this third channel and we provide evidence on
its economic importance as well as on whether this specific mechanism of technology diffusion
responds to the degree of competition in the product market. Our paper departs from a
theoretical formalization of spillovers by Fosfuri et al. (2001). In the context of a simple
but useful two-stage oligopoly model they predict that the degree of competition is likely to
play an important role in the occurrence of technology spillovers since the competitive stance
in an industry affects differently the incentives multinationals have to keep trained workers
2
as opposed to the incentives domestic firms have to hire them by paying higher wages. In
addition, they also show that the absorptive capacity of the local firm affects the potential
for FDI generating spillovers.
Our contribution to the scant literature on this issue is twofold. Firstly, we quantify the
productivity differential in local plants between workers with multinational experience and
workers without such experience (see also Görg and Strobl (2005) and Balsvik (2011)). This
exercise allows us to provide a preliminary test of whether the transmission mechanism we
are analyzing is indeed present in our data. Secondly, by estimating a set of multivariate
duration models, we are the first to provide rigorous empirical evidence on the impact of
product market competition on technology spillovers through worker mobility.
To reach our goals we exploit the availability of employer-employee panel data from Finland
(FLEED) for 1990-2006. Our empirical results can be summarized as follow. Firstly, when
applying the standard "within-group" methodology adopted in this literature, we find both
economically large and statistically significant productivity differentials. Our estimates point
out that workers with former multinational experience are 47.7% more productivity than
their colleagues without such an experience. Also, our qualitative findings are robust to less
restrictive estimation methods which are consistent without assuming strict exogeneity for
the inputs in the production function. Secondly, and contrary to the predictions put forward
by Fosfuri et al, we find that a more competitive environment seems to be conducive to more
technology spillovers.
The structure of the paper is as follows. In Section 2 we provide a brief critical discussion
on both the theoretical and the empirical literature on the specific issue we deal with in our
paper. In Section 3 we describe the data sets we use and provide descriptive evidence on
differ aspects of worker mobility. Section 4 briefly illustrates our empirical strategy whereas
3
in section 5 we present the econometric results. Section 6 concludes.
2 Relevant Literature
In their influential survey book on multinational firms, Barba Navaretti and Venables (2004)
state that the link between the degree of product competition and the extent of technology
spillovers from multinationals to domestic firms has "rarely been explored in the literature as
it raises complex methodological problems". This turns out to be the case since the entry of
multinationals in a given domestic market potentially can bring about both the potential for
technology spillovers to local firms and a change in the nature of competition in the industry.
In their view this makes it very difficult to disentangle empirically the two effects on, let’s
say, the Total Factor Productivity (TFP) of local firms.
A potential solution to this problem, which has not been explored so far, is to look directly
at the effect of product market competition on observables proxying for technology spillovers
more directly, as opposed to more standard output measures such as firm TFP. This approach
is supported by a limited number of theoretical papers which provide explicit mechanisms
through which product market competition can affect technology transfers from multinationals
to local firms. Along this line, Fosfuri et al (2001) develop a simple but very instructive two-
period oligopoly model. In the first period, a multinational firm provides training to a local
worker and gains monopoly profits by using a superior technology. If the multinational keeps
the trained worker in the second period, it also keeps gaining monopoly profits. However, in
the second period the multinational firm faces competition for the trained worker from a local
firm. If the latter is willing to pay a higher salary and therefore to hire the worker, it will
enter the market and therefore compete with the multinational firm.
Clearly, the incentive for the latter to keep the worker depends on the toughness of
4
competition in the second period. In particular, technological spillovers are more likely to
materialize—and therefore the monopoly ceases to exist—only when the “joint profit” effect
does not hold, that is when industry profits are higher if both firms can use the technology.
This is more likely to happen when the local and the multinational firm do not compete
fiercely in the product market or sell in independent or vertically related markets. Further-
more, their model also predicts that worker mobility, and therefore technology transfer, is
more likely to occur when the absorptive capacity of the local firm is sufficiently high and
when on-the-job training is general rather than specific.1 As noted by Fosfuri et al (2001),
however, testing such predictions requires very disaggregated data, which explains why at the
time of publication of their paper they claimed, and rightly so, that "this analysis has not
been undertaken".2
In the last decade, however, the increased availability of linked employer-employee data-
sets has allowed researchers to start opening the black box of technology spillovers and, in
particular, to study the relevance of the worker mobility channel much more precisely. In fact,
on the one hand, data availability makes it possible to build plant (or firm) specific measures
1Albeit not directly focussing on the role played by product market competion, Glass and Saggi (2002) alsodevelop a theoretical model along similar lines. Their main conclusions can be summarized as follow. Firstly,the MNE has the incentive to prevent workers’ mobility only when technology transfer is incomplete since therequired wage premium would be larger - the more complete is technology transfer. Secondly, and possiblymore interestingly, the presence of multiple MNEs increases the likelihood of workers’ mobility whereas thepresence of multiple local firms decreases it. The intuition for this second result is obvious. The incentiveto prevent technology transfers is weakened by the presence of multiple MNEs since each of them has thetemptation not to offer a wage premium given that all other foreign subsidiaries are doing so. On the otherhand, with many local firms competing in the same market, the benefit of restricting technology transfers islarge since the MNE can increase the cost of all local competitors by paying the wage premium.
2A preliminary, albeit informal, attempt to shed some light on this issue is in Smarszinka (2004). Byusing a firm-level data set from Lithuania, she finds evidence consistent with the presence of positive spilloverstaking place only through backward linkages but she does not find evidence of spillovers occurring througheither forward and, more importantly, horizontal linkage channel. She rationalizes her finding as follows:"Since multinationals have an incentive to prevent information leakage that would enhance the performanceof local competitors, but at the same time may benefit from transferring knowledge to their local suppliers,spillovers from FDI are more likely to be vertical than horizontal in nature". Interestingly she also mentionsin the conclusions the need for better data which allow the identification of individual firms as suppliers tomultinationals as well as the need to learn more about host country and investor characteristics that determinethe extent of spillovers operating through different channels.
5
for the share of workers in domestic plants with recent experience from multinationals. This
measure can then be used in augmented productivity equations as a replacement for the
standard, and far less accurate, proxy used in the older literature based on the share of output
produced by multinationals operating in the same industry and/or in the same geographical
area. On the other hand, and much more importantly for the purpose of this paper, the
possibility of following workers over time opens a completely new research dimension since
mobility patterns from multinationals to local firms can be modelled in a multivariate duration
framework and hypotheses of interest can then be tested in a rigorous way.
Gorg and Strobl (2005) is probably the first empirical paper which looks directly at the
effect of worker mobility on the performance of domestic firms. Unfortunately, the firm-level
data from Ghana they exploit do not provide information on all workers in a firm since they
only relate to the entrepreneurs. Still, their overall analysis provides evidence that domestic
firms run by entrepreneurs who acquired experience by working for multinationals in the same
industry are more productive than other firms. Balsvik (2011) is closer in spirit to our work.
She exploits a fully fledged employer-employee data-set for Norway and is able to provide
a number of complementary pieces of empirical evidence which are broadly consistent with
the existence of a channel for technology spillovers through worker mobility. In particular
she finds a large productivity differential (20%) in local plants between workers with MNE
experience compared to their colleagues without such experience, even after controlling for
unobserved characteristics of the workers. Coupled with the finding of a 5 percent premium
for movers from MNEs to domestic plants, when compared to stayers in local plants with
similar characteristics, she concludes that local firms do not fully pay for the value of the
workers to the firm and thus worker mobility from MNEs to non-MNEs is found to be a
source of knowledge externality in Norwegian manufacturing.
6
Albeit less directly related to the topic we investigate in this paper, the availability of linked
employer-employee data sets has also allowed researchers to investigate the wage policies set
up by multinationals in host economies in a more rigorous way. By using detailed panel
data for Portugal, Martin (2008) finds that movements from domestic to foreign firms are
associated to sensible average pay increases of more than 10 percent. In addition, he also
detects a—much smaller in size—selection effect arising from the fact that foreign firms typically
hire workers that already enjoy an higher than average wage in their domestic firms. Finally,
Pesola (2007) exploits the same Finnish linked employer-employee data set as we use in our
paper to analyze the extent to which employees with a multinational background benefit
from the knowledge they acquire in foreign-owned firms when moving to domestic firms and,
in particular, whether this rent is associated to their educational level. Her main finding
suggests that previous tenure in a foreign firm has a positive effect on wages but only for
workers located at the top of the distribution of educational levels. In turn, this is consistent
with the idea that domestic firms may want to pay higher wages to workers with multinational
experience in order to gain access to their knowledge.
3 Data and Descriptive Statistics
3.1 Data
We use data from four different databases from Statistics Finland for the years 1990 to 2004.
The main database is the Finnish Longitudinal Employer-Employee Data (FLEED). The data
includes all Finnish firms and a random sample including one third of all individuals of ages
15-70. The FLEED data is complemented with plant-level statistics from Longitudinal Data
on Plants in Manufacturing (LDPM), which include all manufacturing plants with at least
five employees, and with firm register information on whether the firm is foreign or domestic-
7

owned and if the firm is multinational. Firm and plant-level statistics include variables such
as value added, capital stock, number of employees, wages, sales and industry. We restrict our
analysis to manufacturing firms with at least 20 employees and to the period of 1997-2004.3
The number of individuals in the sample is about 1 200 000 each year. Each individual is
followed over time. Individuals exit the data if he/she turns 70 year, leaves the country or
dies. Each year one third of individuals turning 15 and one third of individuals moving to the
country are added to the sample. The individual-level statistics contain detailed information
on characteristics including education, occupation, annual earnings, gender, family status,
work status and previous work history. All data sets are linked together with unique plant
and firm identifiers.
3.2 Descriptive Statistics
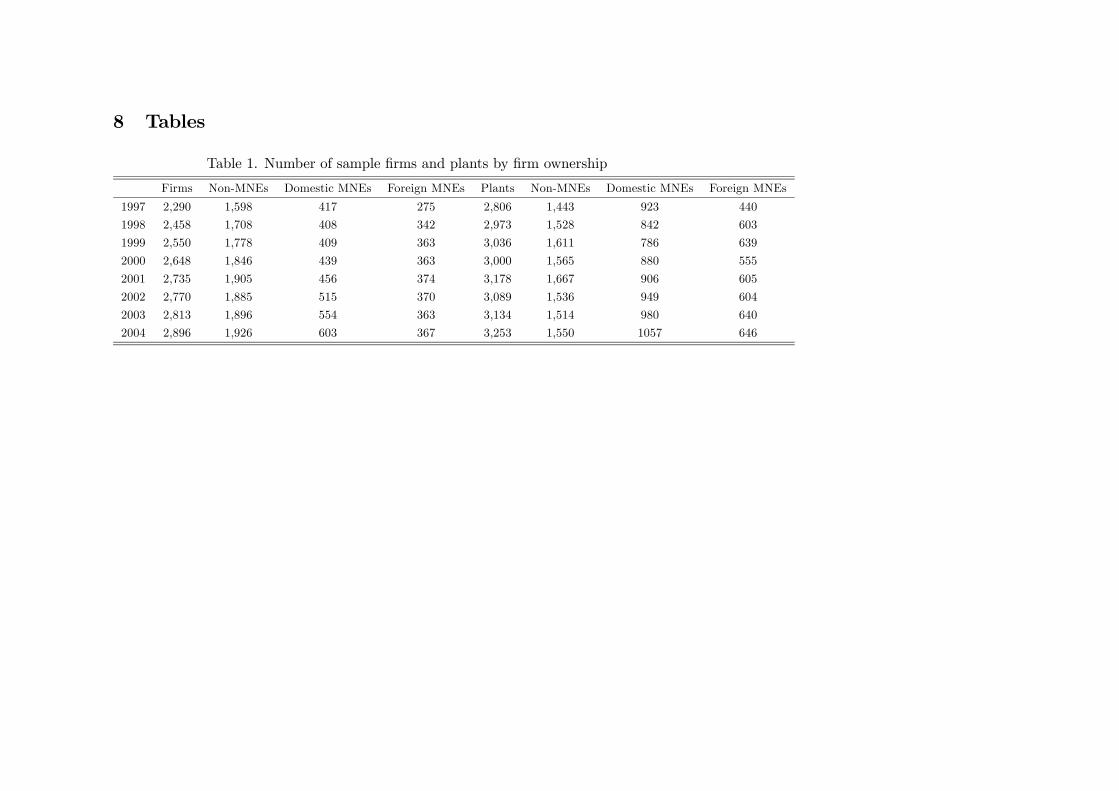
Tables 1 and 2 present some preliminary features of domestic and foreign ownership in Finland
both at firm and plant level. As it can be seen from a close inspection of Table 1, the
vast majority of manufacturing firms with more than 20 employees is domestically owned.
This is obviously not to be unexpected since foreign multinationals tend to concentrate in a
limited number of industries in which they can exploit their managerial expertise and superior
technological skills. For instance, in our first sample year, foreign multinationals account for
12.0 percent of the total number of firms and 15.7 percent of the total number of plants (see
Table 1). As to domestically owned firms, those with some multinational activity account for
an additional 18.2 percent and 32.9 percent of total firms and plants respectively. Despite
the short time dimension of our panel, this initial picture changes substantially over the years
since both foreign and domestic multinationals experience a much stronger growth rate in
3Register information whether the firm is multinational is available from 1997 which restrict the period ofanalysis to 1997-2004.
8
the number of firms (33.5 percent and 44.6 percent respectively) and plants (14.5 percent and
46.8 percent respectively) compared to their domestic non-multinational counterparts (20.5
percent and 7.4 percent respectively).
[Table 1 and 2 here]
As unanimously found in the literature, multinational firms, both foreign and domestic,
appear to run much larger plants (from four to six times) than purely local firms in terms
of both turnover and value added (see Table 2). When computed as a share of turnover,
foreign multinationals are also found to use labor—as proxied by the wage bill—less intensively
than domestic firms, regardless of their multinational status. As to capital—as proxied by
fixed capital computed by using the perpetual inventory methodology—the overall picture is
less clear-cut. Still, when focusing on the median, foreign firms are found to use capital
less intensively than domestic firms especially if we confine the comparison to those with
some multinational activities. Furthermore, foreign multinationals invest in R&D more than
purely domestic local firms but less than domestic multinational firms. This is not surprising,
since multinational firms tend to concentrate the bulk of their R&D activities in their home
country. Finally, our data do not suggest any striking difference in the mean or median
accounting price-cost margins among the three group of firms. This turns out to be the
case since the lower wage shares which characterize both domestic and foreign multinationals
are counterbalanced by proportionally similar higher shares of consumption of intermediate
inputs, as documented by the value added to turnover ratio.
[Tables 3 and 4 here]
Table 3 displays statistics quantifying employees entering domestic firms, domestic MNEs
and foreign MNEs in the sample. We distinguish all entrants including entrants from previous
9
years as early as the data set allows (since 1990) and new entrants in the current year. It
may be noticed that the share of all entrants increases over the period, suggesting that worker
mobility increases during the period. For instance, the share of all entrants increases from
15.5% to 21.9% in foreign firms between 1997 and 2004. Similar pattern, although not as
monotonous may be observed for the share of new entrants. In our productivity estimations
we include a share of entrants from previous years, but in the mobility estimations we focus
on the worker exit mobility in current year.
Table 4 displays worker characteristics of the entrants in different type of firms at the
entry year. The MNEs, both foreign and domestic, employ a larger share of female workers,
workers with longer education and longer previous tenure than domestic non-MNEs.
[Tables 5a and 5b here]
In Tables 5a and 5b, we display statistics quantifying the entrants to domestic firms
and the separators from foreign firms, respectively. We focus on these statistics since our
primary interest is to analyse whether worker mobility from MNEs to domestic firms generate
productivity spillovers in the domestic firms. Most entrants seem to come from other domestic
firms. For most years the share of entrants from foreign firms is the smallest, but once again,
it is increasing over the time period. These differences may reflect the ownership structure
of the firms operating in Finland. The share of foreign firms is smaller than the share of
domestic firms and domestic MNEs. However, the share of foreign owned firms is increasing,
and consequently, the pool of workers with experience from foreign firms is increasing. Thus,
the scope for positive productivity spillovers may be increasing as well. In the following
sections, we first aim to establish whether worker mobility generates productivity spillovers
and then we analyse factors affecting worker mobility.
10
4 Empirical Strategy
Our empirical strategy consists of two complementary sets of econometric estimates. Firstly,
we estimate an augmented Cobb-Douglas production function with firm-level data. This first
step serves two different purposes. On the one hand, it allows us to establish whether worker
mobility from multinationals to local firms has a positive effect on the total factor productivity
of local firms. This is obviously of paramount importance given the purpose of this paper.
Indeed, finding no effect in our data would make the analysis of the effect of competition and
absorptive capacity on worker mobility far less interesting simply because the transmission
channel going from competition to productivity via worker mobility would not be there.
On the other hand, the estimation of production functions allows us to recover firm level
measures of the technological distance of local firms from their multinational counterparts,
this in turn being a proxy for absorptive capacity. In the second step, we apply the competing
risks framework to the analysis of the effect of product market competition and absorptive
capacity on worker mobiliy from multinationals to local firms. This general transition model
accomodates situations like ours that involve more than one destination and can be therefore
interpreted as a multivariate duration model involving the joint specification and estimation
of two or more hazard functions.4
4.1 Productivity Equations
We start from the following Cobb-Douglas production function:
Yit = AitMβmit L
∗βlit K
βkit i = 1, 2, ..., N ; t = 1, 2, ...T (1)
4 In our application a worker employed by a multinational firm could in fact alternatively: i) move to a localfirm in the same industry or in a different industry, ii) move to a different multinational firm, iii) turn intoselfemployment, iv) enter unemployment, v) exit the labor market.
11
where Yit, Mit, Kit and L∗it denote respectively production, consumption of materials and
services, capital stock and quality adjusted labor of firm i at time t. Quality adjusted labor
is equal to
L∗it = LNit + LM
it (1 + γ) = Lit(1 + γsit) (2)
where LMit and LN
it denote labor with MNE experience and labor without such experience,
Lit = LNit +LM
it and sit is the share of total labour, Lit with MNE experience. In this context,
the unknown parameter, γ can be interpreted as a positive productivity premium (Balsvik,
2011) generated by the technology spillover embodied in LMit . The productivity term Ait is
modelled as follows:
Ait = eδt+ηi+uit (3)
where δt is a time specific intercept, ηi is the individual effect which in the present context
can be thought of as unobserved firm characteristics that can be viewed as constant over the
sample period, and uit is the serially uncorrelated idiosyncratic error.5 By using equations
(1), (2) and (3), by taking logs and by using the approximation βl lnL∗βlit = βl lnL
βlit +βlγsit,
equation (1) can be rewritten in the following representation:
yit = βmmit + βllit + βlγsit + βkkit + δt + ηi + uit (4)
where yit, mit, lit, and kit are the logarithms of Yit, Mit, Lit, Kit respectively. To recover
consistent estimates of the expected effect on productivity of the share of labor with MNE
experience, sit, holding all other variables fixed, reasonable identification assumptions have
to be made. In particular, it seems sensible to assume that both standard input factors
5We also allow for a less restrictive characterization of the idiosyncratic component of the error term. Seeequations (5) and (6).
12
(mit, lit, kit) and the labor share (sit) are correlated with the individual effect (ηi). This al-
lows for the possibility that firm heterogeneity–if observable to managers even if not to the
econometrician—matter in hiring decisions of workers with MNE experience. To take this en-
dogeneity problem into account, we estimate equation (4) by using the standard within group
transformation. This approach does not put any restriction on the conditional distribution of
ηi with respect to all past, present and future input levels. It requires however that all inputs
are strictly exogenous with respect to the idiosyncratic component, uit thus ruling out the
possibility that managers adjust their input levels after observing past or present idiosyncratic
productivity shocks.6
Although within-group estimation of equation (4) controls for unobserved heterogeneity,
the share of employees with MNE experience—as well as other input factors—are unlikely to be
orthogonal to present and past idiosyncratic shocks. In order to obtain consistent estimates
of the impact of labour mobility on productivity, controlling for unobserved heterogeneity, in-
puts’ simultaneity and measurement errors, we rely on the GMM-system technique developed
by Arellano and Bover (1995) and Blundell and Bond (1998).7 This approach has become
common in the empirical literature measuring productivity of MNEs and has been used by
Griffith (1999a,b), Harris (2002), Harris and Robinson (2003) and Benfratello and Sembenelli
(2006). As compared to previous papers (e.g. Görg and Strobl (2005) and Balsvik (2011)),
we therefore contribute to this strand of literature by allowing for the share of workers with
MNE experience to be sequentially exogenous as opposed to strictly exogenous.
Operationally, the idiosyncratic error uit in equation (3) is redefined as the sum of a first
6Note that this is the benchmark identification strategy adopted in Balsvik (2011).7GMM estimators have been found to produce large finite-sample biases when using the standard first-
differenced estimator (Arellano and Bond, 1991) in the context of the estimation of production functions. Thesebiases can be dramatically reduced by exploiting reasonable stationarity restrictions on the initial conditionsprocess. See, for instance, Blundell and Bond (2000) and Blundell et al (2000).
13
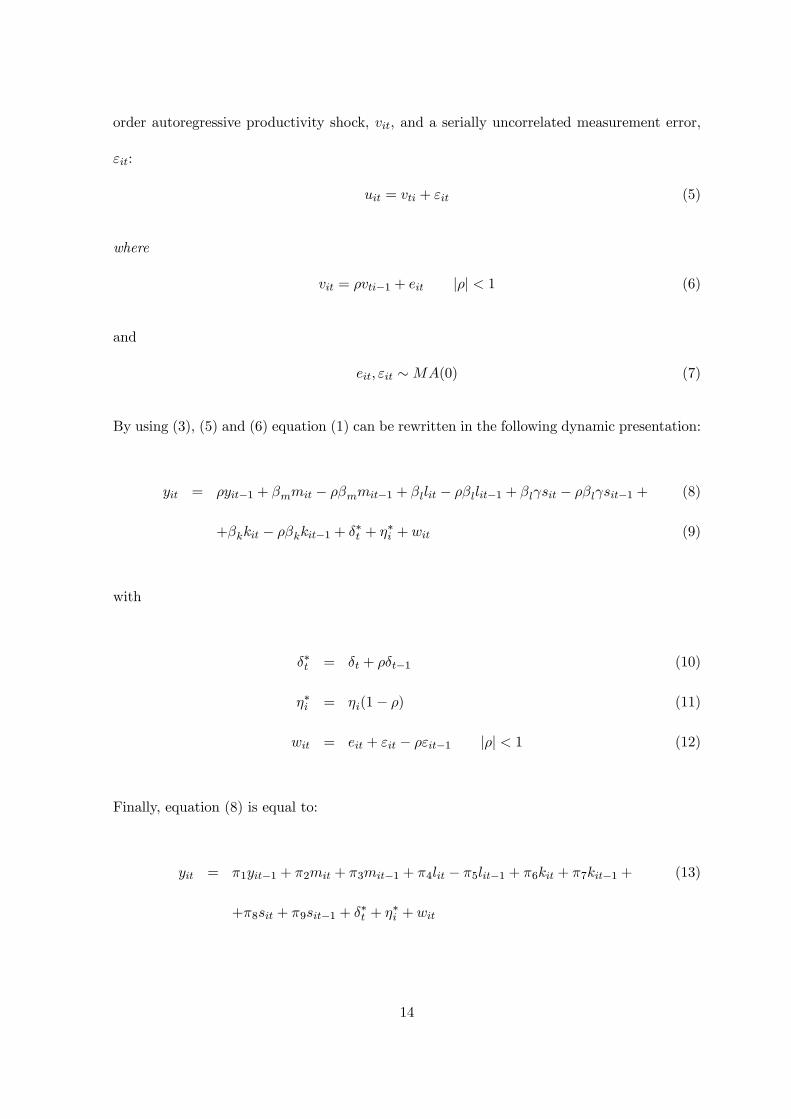
order autoregressive productivity shock, vit, and a serially uncorrelated measurement error,
εit:
uit = vti + εit (5)
where
vit = ρvti−1 + eit |ρ| < 1 (6)
and
eit, εit ∼MA(0) (7)
By using (3), (5) and (6) equation (1) can be rewritten in the following dynamic presentation:
yit = ρyit−1 + βmmit − ρβmmit−1 + βllit − ρβllit−1 + βlγsit − ρβlγsit−1 + (8)
+βkkit − ρβkkit−1 + δ∗t + η∗i + wit (9)
with
δ∗t = δt + ρδt−1 (10)
η∗i = ηi(1− ρ) (11)
wit = eit + εit − ρεit−1 |ρ| < 1 (12)
Finally, equation (8) is equal to:
yit = π1yit−1 + π2mit + π3mit−1 + π4lit − π5lit−1 + π6kit + π7kit−1 + (13)
+π8sit + π9sit−1 + δ∗t + η∗i + wit
14
subject to four non-linear restrictions π1π2 = −π3, π1π4 = −π5, π1π6 = −π7, π1π8 = −π9.
We test whether these restrictions are rejected and choose the model accordingly. If the
restrictions are not rejected we estimate the structural parameters by using minimum distance
estimation techniques, and if they are rejected we estimate long-term effects treating equation
(12) as an unrestricted autoregressive-distributed lag model.
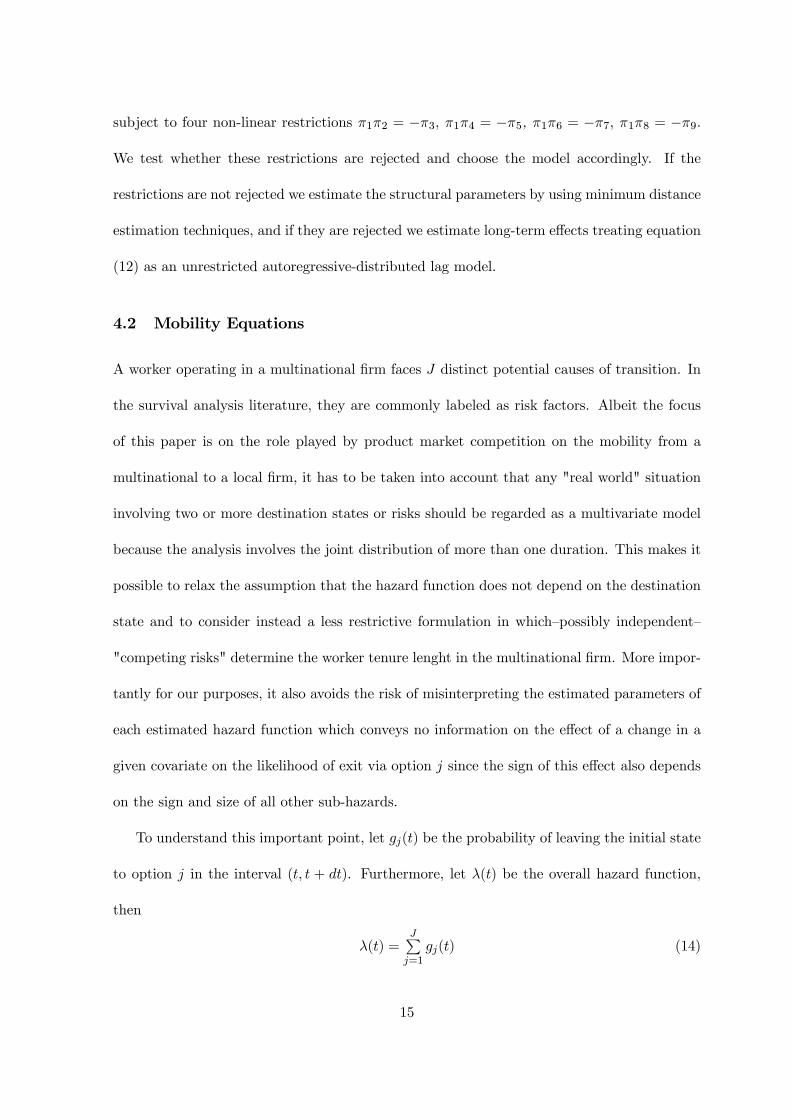
4.2 Mobility Equations
A worker operating in a multinational firm faces J distinct potential causes of transition. In
the survival analysis literature, they are commonly labeled as risk factors. Albeit the focus
of this paper is on the role played by product market competition on the mobility from a
multinational to a local firm, it has to be taken into account that any "real world" situation
involving two or more destination states or risks should be regarded as a multivariate model
because the analysis involves the joint distribution of more than one duration. This makes it
possible to relax the assumption that the hazard function does not depend on the destination
state and to consider instead a less restrictive formulation in which—possibly independent—
"competing risks" determine the worker tenure lenght in the multinational firm. More impor-
tantly for our purposes, it also avoids the risk of misinterpreting the estimated parameters of
each estimated hazard function which conveys no information on the effect of a change in a
given covariate on the likelihood of exit via option j since the sign of this effect also depends
on the sign and size of all other sub-hazards.
To understand this important point, let gj(t) be the probability of leaving the initial state
to option j in the interval (t, t + dt). Furthermore, let λ(t) be the overall hazard function,
then
λ(t) =JPj=1
gj(t) (14)
15
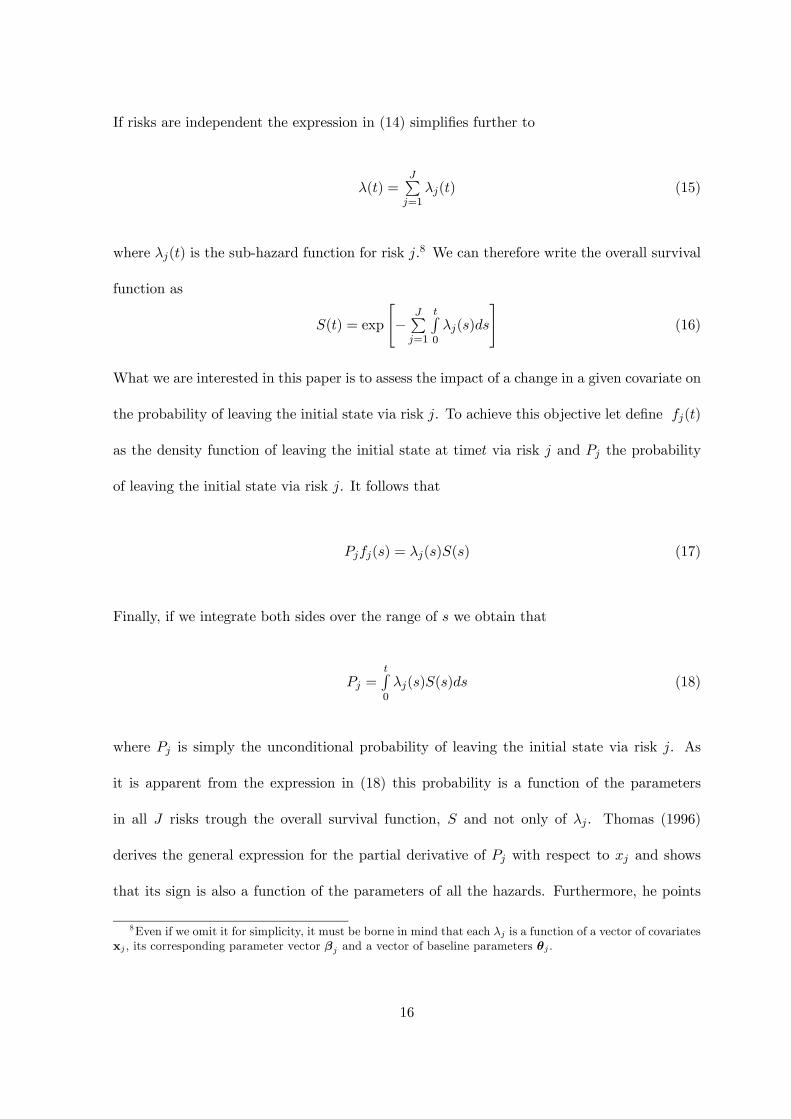
If risks are independent the expression in (14) simplifies further to
λ(t) =JP
j=1λj(t) (15)
where λj(t) is the sub-hazard function for risk j.8 We can therefore write the overall survival
function as
S(t) = exp
"−
JPj=1
tR0
λj(s)ds
#(16)
What we are interested in this paper is to assess the impact of a change in a given covariate on
the probability of leaving the initial state via risk j. To achieve this objective let define fj(t)
as the density function of leaving the initial state at timet via risk j and Pj the probability
of leaving the initial state via risk j. It follows that
Pjfj(s) = λj(s)S(s) (17)
Finally, if we integrate both sides over the range of s we obtain that
Pj =tR0
λj(s)S(s)ds (18)
where Pj is simply the unconditional probability of leaving the initial state via risk j. As
it is apparent from the expression in (18) this probability is a function of the parameters
in all J risks trough the overall survival function, S and not only of λj . Thomas (1996)
derives the general expression for the partial derivative of Pj with respect to xj and shows
that its sign is also a function of the parameters of all the hazards. Furthermore, he points
8Even if we omit it for simplicity, it must be borne in mind that each λj is a function of a vector of covariatesxj , its corresponding parameter vector βj and a vector of baseline parameters θj .
16
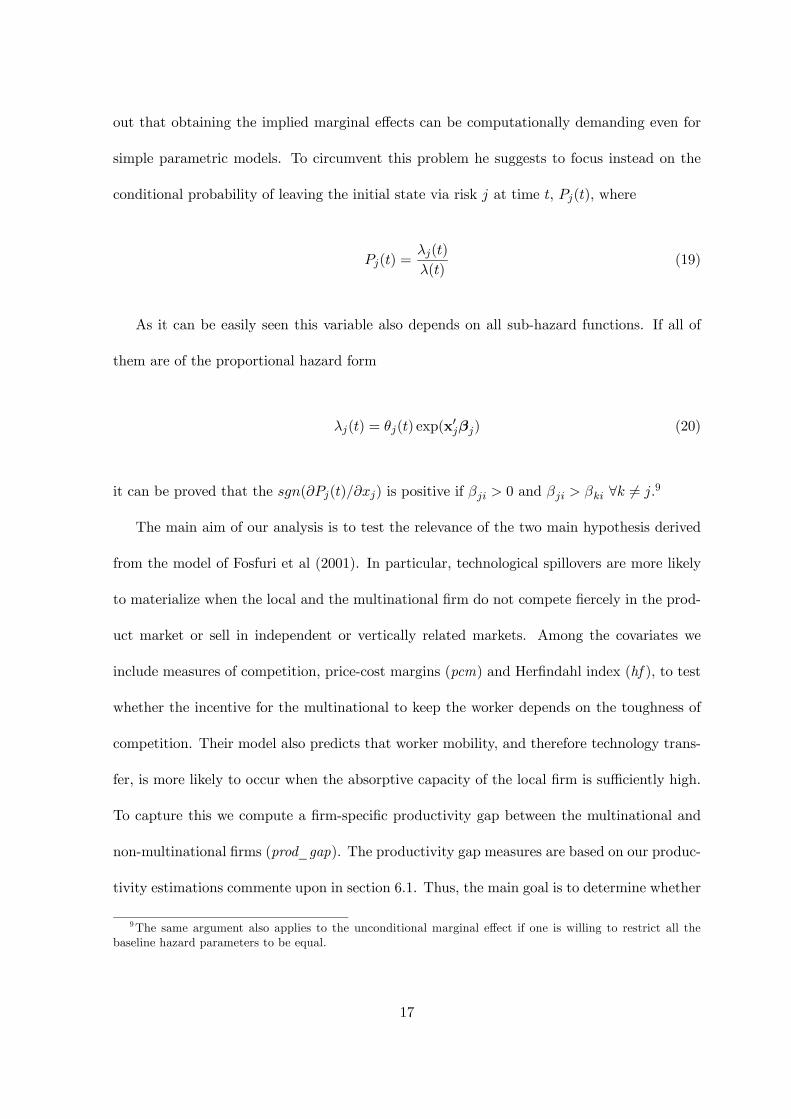
out that obtaining the implied marginal effects can be computationally demanding even for
simple parametric models. To circumvent this problem he suggests to focus instead on the
conditional probability of leaving the initial state via risk j at time t, Pj(t), where
Pj(t) =λj(t)
λ(t)(19)
As it can be easily seen this variable also depends on all sub-hazard functions. If all of
them are of the proportional hazard form
λj(t) = θj(t) exp(x0jβj) (20)
it can be proved that the sgn(∂Pj(t)/∂xj) is positive if βji > 0 and βji > βki ∀k 6= j.9
The main aim of our analysis is to test the relevance of the two main hypothesis derived
from the model of Fosfuri et al (2001). In particular, technological spillovers are more likely
to materialize when the local and the multinational firm do not compete fiercely in the prod-
uct market or sell in independent or vertically related markets. Among the covariates we
include measures of competition, price-cost margins (pcm) and Herfindahl index (hf ), to test
whether the incentive for the multinational to keep the worker depends on the toughness of
competition. Their model also predicts that worker mobility, and therefore technology trans-
fer, is more likely to occur when the absorptive capacity of the local firm is sufficiently high.
To capture this we compute a firm-specific productivity gap between the multinational and
non-multinational firms (prod_gap). The productivity gap measures are based on our produc-
tivity estimations commente upon in section 6.1. Thus, the main goal is to determine whether
9The same argument also applies to the unconditional marginal effect if one is willing to restrict all thebaseline hazard parameters to be equal.
17
pcm, hf and prod_gap influence the probability of moving to a domestic firm, controlling for
the other individual- and firm-specific covariates. As controlling covariates we include age,
gender, marital and parenthood status, education level, income and location.
5 Econometric Results
5.1 Productivity Equations
Table (6) reports productivity equations for the sample of domestic non-multinational firms
and the sample of multinational firms, including both foreign and domestically owned. In
addition to the standard input variables (materials, labor and capital) each equation includes
several additional regressors, which represent the share of workers who have previously worked
in a multinational (s MNE, s domestic MNE and s foreign MNE, respectively) and the share
of other workers previously worked in other type of firms (s non-MNE, s non-domestic MNE
and s non-foreign MNE, respectively). We believe that gaining experience that may become
useful for the another firm takes some time, and include workers with a previous tenure of at
least 3 years in the shares. Obviously, we are mostly interested in the sign and size of γmne,
γdmne and γfmneas estimated on the sample of non-multinational firms since this is technology
transmission channel we are focusing on. Indeed, two of these three coefficients turn out to
be positive and statistically significant, γmne and γfmne. Since the coefficient for the share
of workers with experience from domestic multinationals γdmne is not significant, the effect
of workers with experience from multinationals seems to be driven by the workers previously
working in foreign multinationals. Furthermore, the magnitude of γfmne is economically
sizeable since it implies a productivity premium as large as 0.553. This means that workers
hired from foreign MNEs contribute on average 55.3% more to the productivity of the plant
than the incumbent workers.
18
[Table 6 here]
However, in order for our identification approach to be convincing we also have to show
that the productivity premium we estimate is peculiar to the type of worker mobility we are
focusing on, that is the transitions from (foreign) multinationals to domestic non-multinational
firms. The first alternative explanation we have to rule out is therefore the possibility that
what matters for the productivity of domestic non-multinational firms is simply the hiring of
new employees, regardless of the characteristics of their previous work place. This might be
the case, for instance, because new hires have better skills or are likely to put more effort in
order to get tenure or, more simply, to reveal their unknown ability type. This alternative
hypothesis can be tested by looking at the parameters γnon−MNE and γnon−foreignMNE as
estimated in the sample of domestic non-multinational firms. It turns out that the estimated
parameters are much smaller in size (0.027 and 0.033, respectively) and not different from zero
at conventional statistical levels. Taken at its face value, these overall findings corroborate
the hypothesis that technology spillovers though worker mobility is associated to transitions
from foreign multinationals to domestic non-multinational firms.
The basic assumption of our approach so far has been that the direction of spillovers
through worker mobility is from (foreign) multinationals to non-multinationals, and conse-
quently that spillovers are not relevant in the opposite direction. This has not to be necessarily
be the case, however, because, for instance, foreign and domestic firms might have comple-
mentary comparative advantages. If this is the case, foreign multinational could benefit from
hiring workers with a more pronounced local background. If this is the case γnon−MNE and
γnon−foreignMNE should enter with a positive sign in the equation estimated on the sam-
ple of multinational firms. This conjecture, however, is not supported by the data since
these estimated parameters are not statistically different from zero, albeit γnon−MNE and
19
γnon−foreignMNE are positively signed (0.169 and 0.074).
All the results reported so far are based on the crucial assumption that inputs can be
treated as strictly exogenous. This in turn rules out the possibility that firm managers may
adjust input levels—including the share of workers with previous MNE experience—after ob-
serving present or past productivity shocks. In order to address this legitimate concern and to
test—at least qualitatively—for the robustness of our previous findings to violations of the strict
exogeneity assumption, we also report the GMM-system estimations of the dynamic model
specified by equation (13) on the samples of multinational (column (i)) and non-multinational
firms (column (ii)). Each equation includes regressors for the share of workers who have pre-
viously worked in a foreign multinational (s foreign MNE) and the share of other workers
previously worked in non-foreign firms (s non-foreign MNE).
Table (7) shows the results for the model using earlier instruments dated t-2 for the
equations in first differences and instruments dated t-1 for the equations in level. In both
columns the test statistics indicate, as expected, that there is evidence of first but not of
second order serial correlation. As for the Sargan-Hansen test, the validity of the instrument
set is not rejected at the 1% significance level in both equations. However, the common factor
restrictions implied by the theory are rejected in the equation estimated on the sample of non-
multinational firms (column (i)). This in turn implies that we cannot impose these restrictions
to our data and consequently we cannot recover the implied structural parameters. Neverthe-
less, we can still interpret our estimated model as an unrestricted autoregressive-distributed
lag structure and compute the corresponding long-run effects. Rather comfortingly, only the
effect on the s foreign variable in the sample of non-multinational firms turns out to be posi-
tive and significant at conventional statistical levels (0.838 with an associated standard error
of 0.196). Needless to say, this additional finding is fully consistent with our previous results
20
obtained with more restrictive estimation methods.
5.2 Mobility Equations
In assessing the effect of product market competition and absorptive capacity on worker
mobility from foreign multinationals to purely domestic firms, we first identify those workers
who are employed in a foreign multinational in 1997—that is our first sample year—and we trace
them over the entire sample period. In the first set of equations (Table 8) we distinguish two
destination states: to a purely domestic firm (columns (i)-(iv)) and to a different multinational
firm, regardless of its nationality (columns (v)-(viii)). All other individuals are therefore
treated as censored. Overall we have a sample of 21,092 individuals. Of those 1,146 are found
to move to a purely domestic firm and 2,101 to a different multinational firm.
In order to test the predictions of Fosfuri et al (2001), we compute the time varying two-
digit price-cost margin (PCM) and Herfindahl index (HF) of the foreign firm a given worker
is employed by as proxies of the competitive environment. As proxy for absorptive capacity,
we use the productivity gap between the same foreign firm and the average domestic non-
MNE firm in the same two-digit industry. We apply two measures of productivity gap, based
respectively on WG (see Table 6) and GMM-system production function estimations (see
Table 7). The number of observations is reduced in the latter by the use of lagged variables
in productivity estimations. Predictions from received theory suggest that PCM and HF
should enter with a positive sign and productivity gap with a negative sign in the purely
domestic destination state sub-hazard function. In all regressions, we also include several
standard individual level variables: age, gender, marital and parenthood status, educational
level, income and location. Finally, this baseline model is augmented with a set of categorical
variables proxying for foreign MNE size and with a set of aggregate time dummies capturing
21
aggregate business cycle effects.
Results in Table 8 only partly confirm received theoretical predictions. In the sub-hazard
function for the purely domestic firm destination state, the coefficient on the productivity
gap is indeed negative and statistically significant in all columns ((i)-(iv)). This result is
therefore robust to both WG (columns (i) and (ii)) and GMM-system (columns (iii) and (iv))
based productivity gap measures. The only difference is that the coefficient on GMM-system
based productivity gap measures is larger. However, the sign on the PCM variable is also
negative and statistically significant in all columns and thus not consistent with theoretical
predictions. When included, the Herfindahl index has a positive, although insignificant, sign.
The estimated parameters on age, gender, number of small children and income are negative
in all columns, implying that all these variables slow down the transition to purely domestic
firms. On the other hand, the educational level and the Helsinki location, both enter with a
positive sign. This in turn suggests that the increase in these two variables accelerates the
transition to purely domestic firms.
As explained in section 4.2, the sign of the impact of a covariate on the probability of
leaving the initial state via mobility to a purely domestic firm is not given by the sign on
the same covariate in the purely domestic firm destination state sub-hazard function. For
this reason, we also report (column (v)-(viii)) the sub-hazard functions for the multinational
destination state. As it can be easily seen, the estimated parameters on PCM are never
statistically different from zero, whereas the estimated parameters on the productivity gap
are not statistically different from zero in the equations based on WG estimates (columns
(v) and (vi)). They are negative, statistically significant, but smaller in size—compared to the
alternative destination state—in the equations based on GMM-system estimation (columns (vi)
and (vii)). These additional findings show therefore that the absorptive capacity of purely
22
domestic firms in an industry not only increases the independent sub-hazard ratio for the
purely domestic firm destination but also the probability of leaving the initial state via this
destination state. Analogously, more competition (that is a lower PCM) increases both the
independent sub-hazard ratio and the probability of moving to a purely domestic firm. The
prediction that worker mobility, and therefore technology transfer, is more likely to occur
when the local and the multinational firm do not compete fiercely in the product market,
does not seem to be supported by our results. On the contrary, the more competitive the
industry where the foreign firm operates the more likely are the workers to move. However,
our results are consistent with the other prediction, that worker mobility is more likely when
the absorptive capacity of the local firm is sufficiently high.
[Table 8 here]
In the second set of estimates, we further distinguish between destination to a domestic
firm operating in the same two-digit industry and to a domestic firm operating in a different
two-digit industry. In this way we aim to capture whether the effect of competition and
absorptive capacity on worker mobility differ when the destination firm is competing in the
same as opposed to a different two-digit industry. Indeed, Fosfuri et al (2001) predict that
technological spillovers are more likely to materialize when the local and the multinational
firm do not compete fiercely in the same product market or sell in independent or vertically
related markets. Thus, the degree of competition—as measured by the industry level price cost
margin—should indeed have a greater effect on worker mobility in the same industry.
[Table 9 here]
The results for inter-industry mobility are displayed in columns (i)-(iv) and for intra-
industry in columns (v)-(viii) in Table 9. Once again, the results concerning competition
23
go against the theoretical predictions. Competition measured by price-cost margin does not
have any significant effect on worker mobility within the same industry. However, the sign
on the price-cost margin variable is negative and statistically significant in the inter-industry
estimations. The latter suggest that workers are less likely to move to other industries if
they are employed in a industry with high price-cost margins. On the other hand, our other
competition measure, Herfindahl index, suggests that workers are more likely to move to
other industries from more concentrated and less competitive industries. The latter does
not, however, apply to intra-industry mobility where we would expect larger impact of level
of competition on mobility. Results concerning absorptive capacity are more intuitive in
the sense that technological distance deters intra-industry mobility more than inter-industry
mobility.
6 Conclusions
24
References
[1] Arellano, M. and Bond, S. (1991), Some Tests of Specification for Panel Data: Monte
Carlo Evidence and an Application to Employment Equations, Review of Economic Stud-
ies, 58, 277-297
[2] Balsvik R. (2011), Is Labor Mobility a Channel for Spillovers from Multinationals? Evi-
dence from Norwegian Manufacturing." Review of Economics and Statistics, 93, 285-297
[3] Barba Navaretti G. and A. J. Venables (2004), Multinational Firms in the World Econ-
omy, Princeton University Press
[4] Benfratello L. and A. Sembenelli (2006), Foreign Direct Investment and Productivity, Is
the Direction of Causality so Obvious?, International Journal of Industrial Organization,
24, 733-751
[5] Blomström M and A. Kokko (1998), Multinational Corporations and Spillovers, Journal
of Economic Surveys, 12, 247-277
[6] Blundell, R. and Bond, S. (1998), Initial Conditions and Moment Restrictions in Dynamic
Panel Data models”, Journal of Econometrics, 87, 115-143
[7] Blundell, R. and Bond, S. (2000), GMM Estimation with Persistent Panel Data: an
Application to Production Functions, Econometric Reviews, 19(3), 321-340
[8] Blundell, R., Bond, S. and Windmeijer, F. (2000), Estimation in Dynamic Panel Data
Models: Improving the Performance of the Standard GMM Estimators”, Advances in
Econometrics, 15, 53-91
[9] Fosfuri A, M. Motta and T. Rende (2001), Foreign Direct Investment and Spillovers
through Workers’ Mobility, Journal of International Economics, 53, 205-222
25
[10] Glass A. J. and K. Saggi (2002), Multinational Firms and Technology Transfers, Scan-
dinavian Journal of Economics, 104, 495-513
[11] Gorg H and E Strobl (2005), Spillovers from Foreign Firms through Workers Mobility:
An Empirical Investigation, Scandinavian Journal of Economics, 107, 693-709
[12] Griffith R. (1999a), Productivity and Foreign Ownership in the UK Car industry”, IFS
working paper 99/11.
[13] Griffith R. (1999b), Using the ARD Establishment Data to Looking at Foreign Ownership
and Productivity in the United Kingdom, Economic Journal, 109, 416-442.
[14] Harris, R. (2002), Foreign Ownership and Productivity in the United Kingdom - Some
Issues When Using the ARD Establishment Level Data, Scottish Journal of Political
Economy, 47, 318-335.
[15] Harris, R. and Robinson, C. (2003), Foreign Ownership and Productivity in the United
Kingdom. Estimates for U.K. Manufacturing Using the ARD, Review of Industrial Or-
ganization, 22, 207-223
[16] Ilmakunnas, P, M. Maliranta and H. Pesola (2009), Spillovers From Multinationals to
Domestic Firms: An Empirical Analysis of the Profitability Effects of Labor Flows,
Helsinki School of Economics, Mimeo
[17] Martins P. S (2008), Paying More to Hire the Best? Foreign Firms, Wages and Worker
Mobility, IZA Discussion Paper, 3607
[18] Pesola, H. (2007), Foreign Ownership, Labour Mobility and Wages, HECER Discussion
paper, 175
26

[19] Smarzynska Javorcik B. (2004), Does Foreign Direct Investment Increase the Productiv-
ity of Domestic Firms? In search of Spillovers through Backward Linkages, American
Economic Review, 94, 605-627
[20] Thomas, J.M. (1996), On the Interpretation of Covariate Estimates in Independent Com-
peting Risks Models, Bulletin of Economic Research, 48, 27-39
27

7 Data Appendix
28
8 Tables
Table 1. Number of sample firms and plants by firm ownership
Firms Non-MNEs Domestic MNEs Foreign MNEs Plants Non-MNEs Domestic MNEs Foreign MNEs
1997 2,290 1,598 417 275 2,806 1,443 923 440
1998 2,458 1,708 408 342 2,973 1,528 842 603
1999 2,550 1,778 409 363 3,036 1,611 786 639
2000 2,648 1,846 439 363 3,000 1,565 880 555
2001 2,735 1,905 456 374 3,178 1,667 906 605
2002 2,770 1,885 515 370 3,089 1,536 949 604
2003 2,813 1,896 554 363 3,134 1,514 980 640
2004 2,896 1,926 603 367 3,253 1,550 1057 646
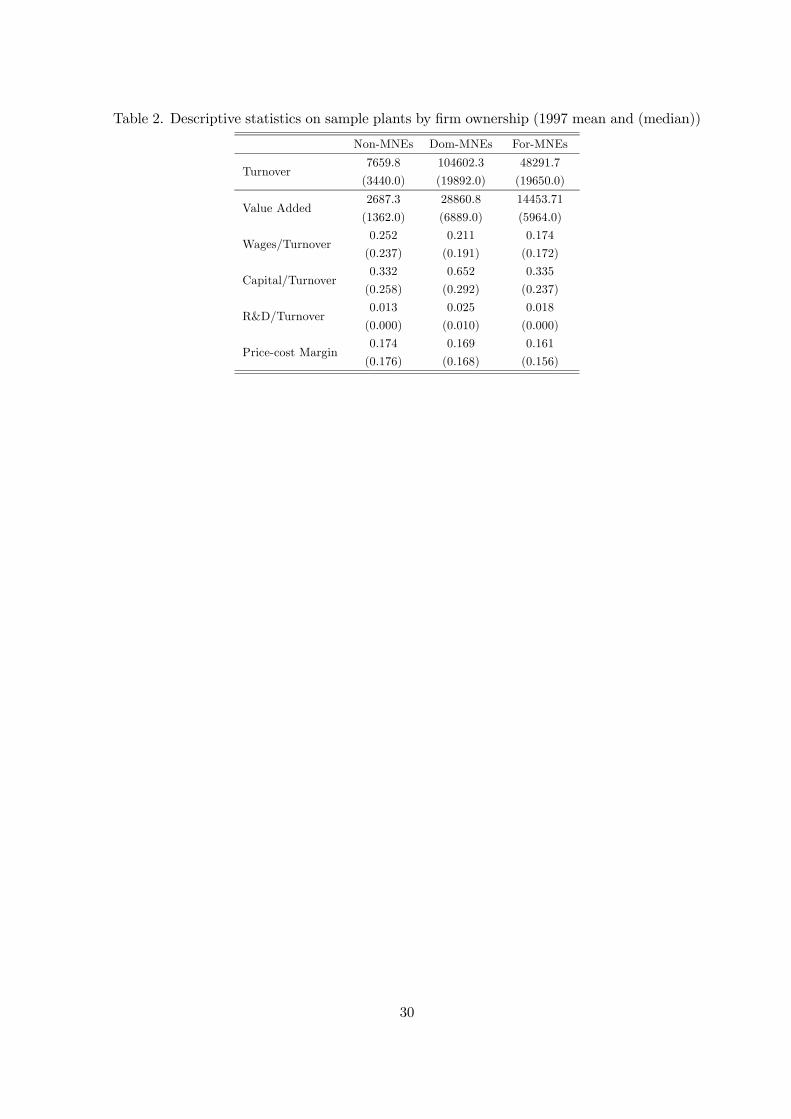
Table 2. Descriptive statistics on sample plants by firm ownership (1997 mean and (median))
Non-MNEs Dom-MNEs For-MNEs
Turnover7659.8
(3440.0)
104602.3
(19892.0)
48291.7
(19650.0)
Value Added2687.3
(1362.0)
28860.8
(6889.0)
14453.71
(5964.0)
Wages/Turnover0.252
(0.237)
0.211
(0.191)
0.174
(0.172)
Capital/Turnover0.332
(0.258)
0.652
(0.292)
0.335
(0.237)
R&D/Turnover0.013
(0.000)
0.025
(0.010)
0.018
(0.000)
Price-cost Margin0.174
(0.176)
0.169
(0.168)
0.161
(0.156)
30
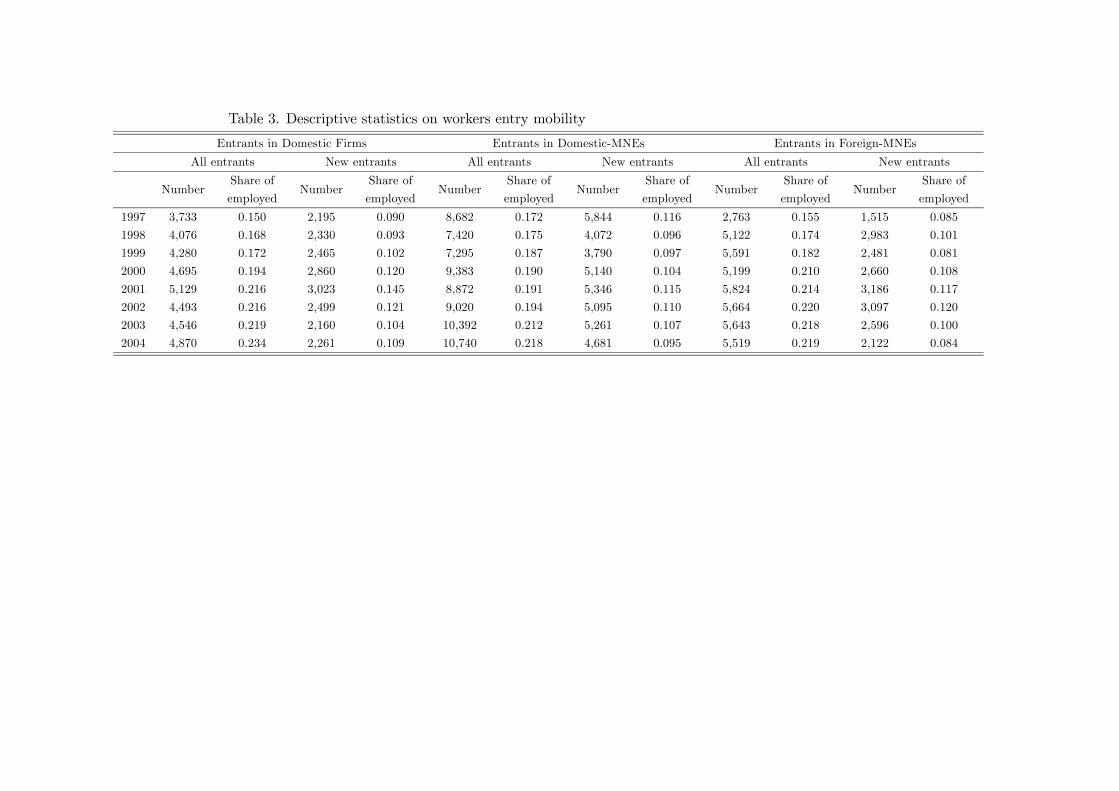
Table 3. Descriptive statistics on workers entry mobility
Entrants in Domestic Firms Entrants in Domestic-MNEs Entrants in Foreign-MNEs
All entrants New entrants All entrants New entrants All entrants New entrants
NumberShare of
employedNumber
Share of
employedNumber
Share of
employedNumber
Share of
employedNumber
Share of
employedNumber
Share of
employed
1997 3,733 0.150 2,195 0.090 8,682 0.172 5,844 0.116 2,763 0.155 1,515 0.085
1998 4,076 0.168 2,330 0.093 7,420 0.175 4,072 0.096 5,122 0.174 2,983 0.101
1999 4,280 0.172 2,465 0.102 7,295 0.187 3,790 0.097 5,591 0.182 2,481 0.081
2000 4,695 0.194 2,860 0.120 9,383 0.190 5,140 0.104 5,199 0.210 2,660 0.108
2001 5,129 0.216 3,023 0.145 8,872 0.191 5,346 0.115 5,824 0.214 3,186 0.117
2002 4,493 0.216 2,499 0.121 9,020 0.194 5,095 0.110 5,664 0.220 3,097 0.120
2003 4,546 0.219 2,160 0.104 10,392 0.212 5,261 0.107 5,643 0.218 2,596 0.100
2004 4,870 0.234 2,261 0.109 10,740 0.218 4,681 0.095 5,519 0.219 2,122 0.084
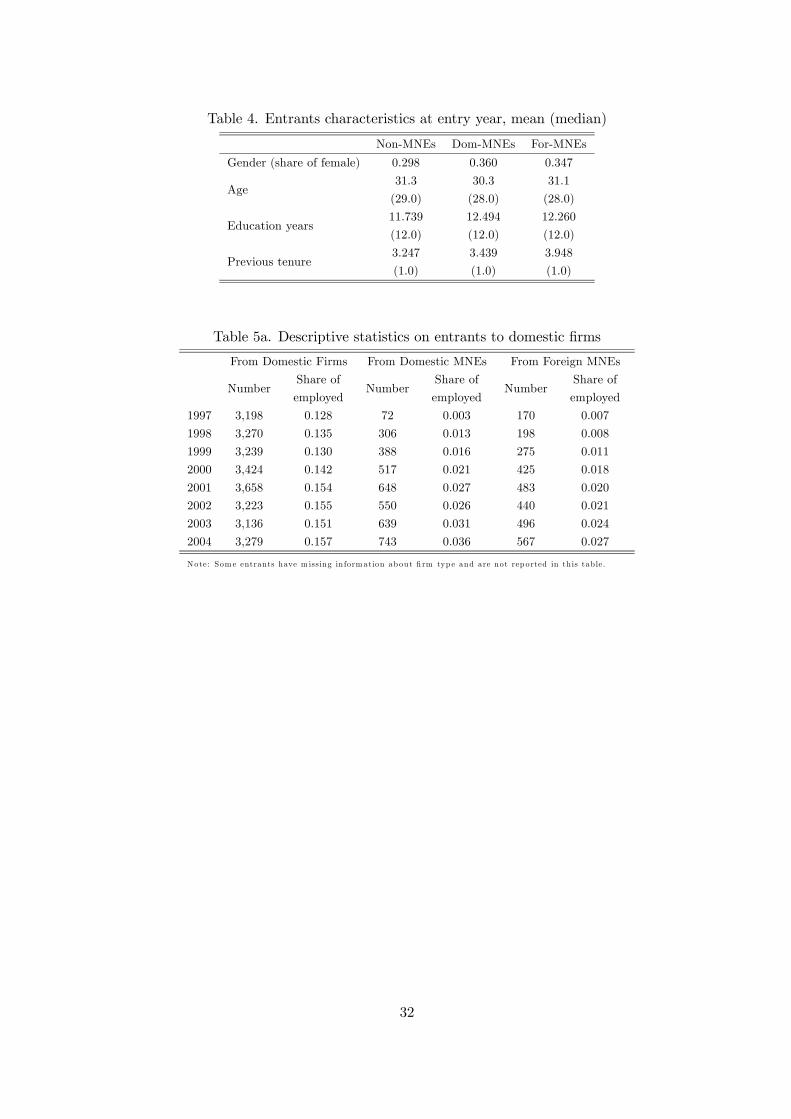
Table 4. Entrants characteristics at entry year, mean (median)
Non-MNEs Dom-MNEs For-MNEs
Gender (share of female) 0.298 0.360 0.347
Age31.3
(29.0)
30.3
(28.0)
31.1
(28.0)
Education years11.739
(12.0)
12.494
(12.0)
12.260
(12.0)
Previous tenure3.247
(1.0)
3.439
(1.0)
3.948
(1.0)
Table 5a. Descriptive statistics on entrants to domestic firms
From Domestic Firms From Domestic MNEs From Foreign MNEs
NumberShare of
employedNumber
Share of
employedNumber
Share of
employed
1997 3,198 0.128 72 0.003 170 0.007
1998 3,270 0.135 306 0.013 198 0.008
1999 3,239 0.130 388 0.016 275 0.011
2000 3,424 0.142 517 0.021 425 0.018
2001 3,658 0.154 648 0.027 483 0.020
2002 3,223 0.155 550 0.026 440 0.021
2003 3,136 0.151 639 0.031 496 0.024
2004 3,279 0.157 743 0.036 567 0.027
Note: Som e entrants have m issing in formation about fi rm type and are not rep orted in this table .
32
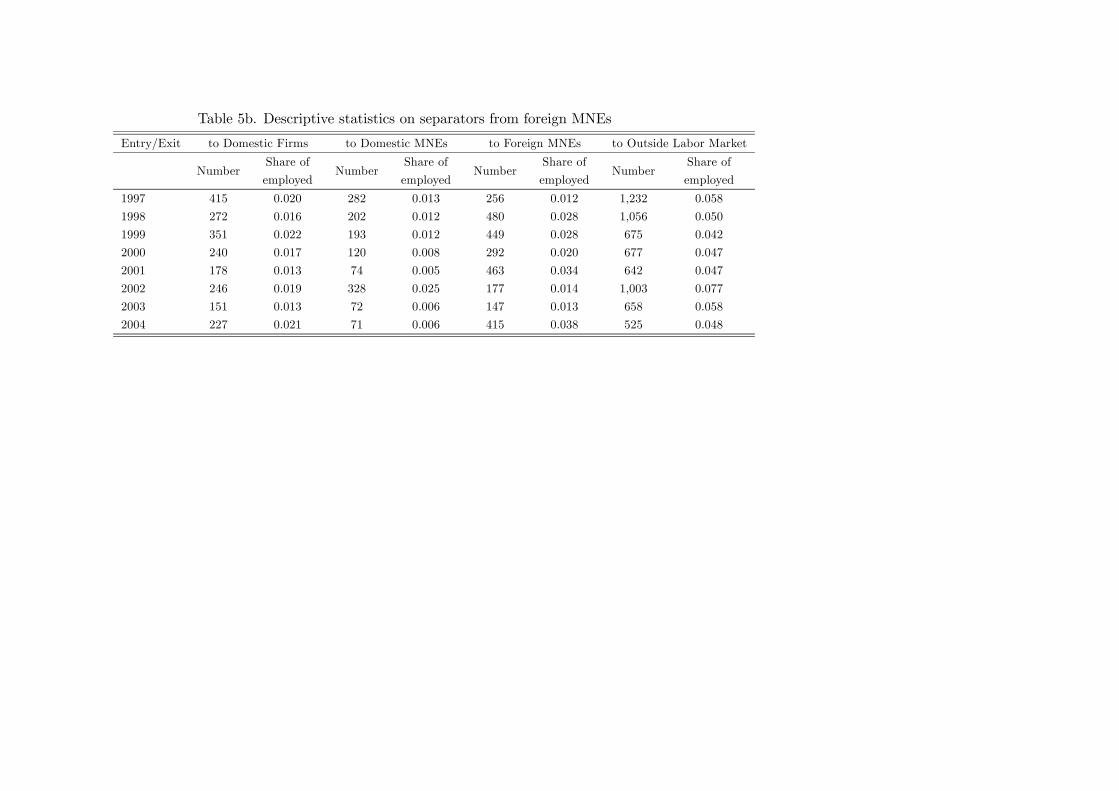
Table 5b. Descriptive statistics on separators from foreign MNEs
Entry/Exit to Domestic Firms to Domestic MNEs to Foreign MNEs to Outside Labor Market
NumberShare of
employedNumber
Share of
employedNumber
Share of
employedNumber
Share of
employed
1997 415 0.020 282 0.013 256 0.012 1,232 0.058
1998 272 0.016 202 0.012 480 0.028 1,056 0.050
1999 351 0.022 193 0.012 449 0.028 675 0.042
2000 240 0.017 120 0.008 292 0.020 677 0.047
2001 178 0.013 74 0.005 463 0.034 642 0.047
2002 246 0.019 328 0.025 177 0.014 1,003 0.077
2003 151 0.013 72 0.006 147 0.013 658 0.058
2004 227 0.021 71 0.006 415 0.038 525 0.048
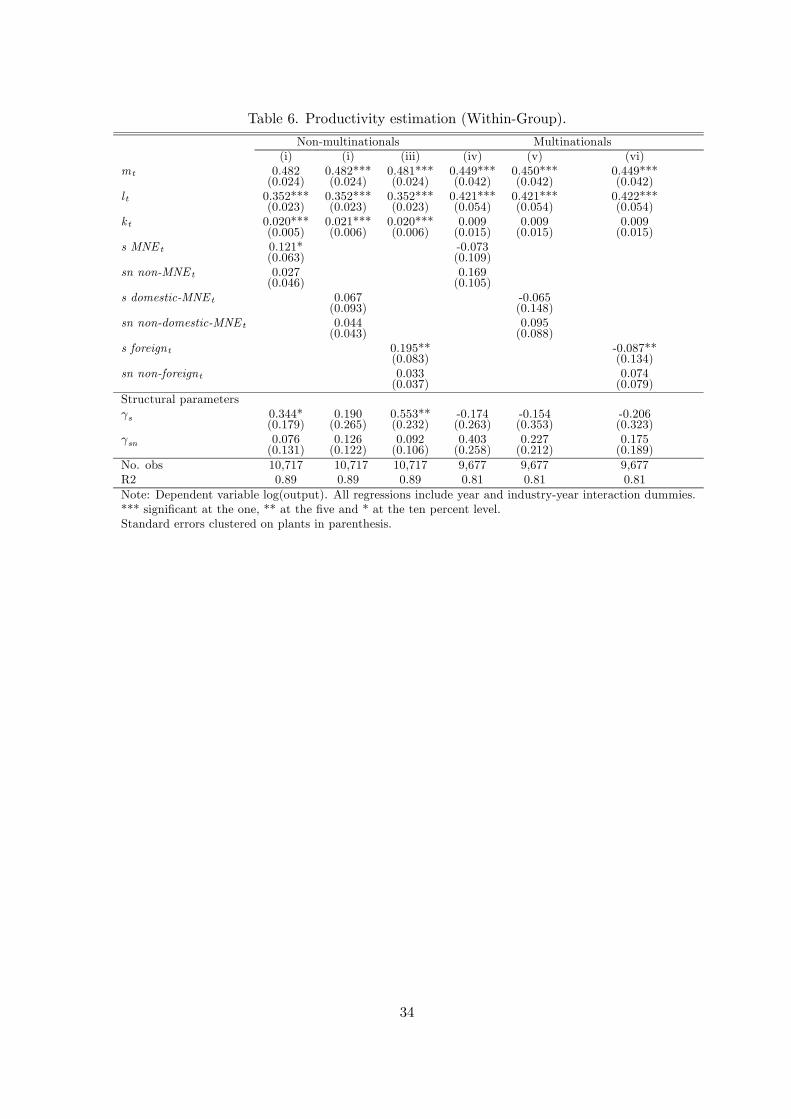
Table 6. Productivity estimation (Within-Group).
Non-multinationals Multinationals(i) (i) (iii) (iv) (v) (vi)
mt 0.482 0.482*** 0.481*** 0.449*** 0.450*** 0.449***(0.024) (0.024) (0.024) (0.042) (0.042) (0.042)
l t 0.352*** 0.352*** 0.352*** 0.421*** 0.421*** 0.422***(0.023) (0.023) (0.023) (0.054) (0.054) (0.054)
k t 0.020*** 0.021*** 0.020*** 0.009 0.009 0.009(0.005) (0.006) (0.006) (0.015) (0.015) (0.015)
s MNE t 0.121* -0.073(0.063) (0.109)
sn non-MNE t 0.027 0.169(0.046) (0.105)
s domestic-MNE t 0.067 -0.065(0.093) (0.148)
sn non-domestic-MNE t 0.044 0.095(0.043) (0.088)
s foreignt 0.195** -0.087**(0.083) (0.134)
sn non-foreignt 0.033 0.074(0.037) (0.079)
Structural parametersγs 0.344* 0.190 0.553** -0.174 -0.154 -0.206
(0.179) (0.265) (0.232) (0.263) (0.353) (0.323)γsn 0.076 0.126 0.092 0.403 0.227 0.175
(0.131) (0.122) (0.106) (0.258) (0.212) (0.189)No. obs 10,717 10,717 10,717 9,677 9,677 9,677R2 0.89 0.89 0.89 0.81 0.81 0.81Note: Dependent variable log(output). All regressions include year and industry-year interaction dummies.*** significant at the one, ** at the five and * at the ten percent level.Standard errors clustered on plants in parenthesis.
34
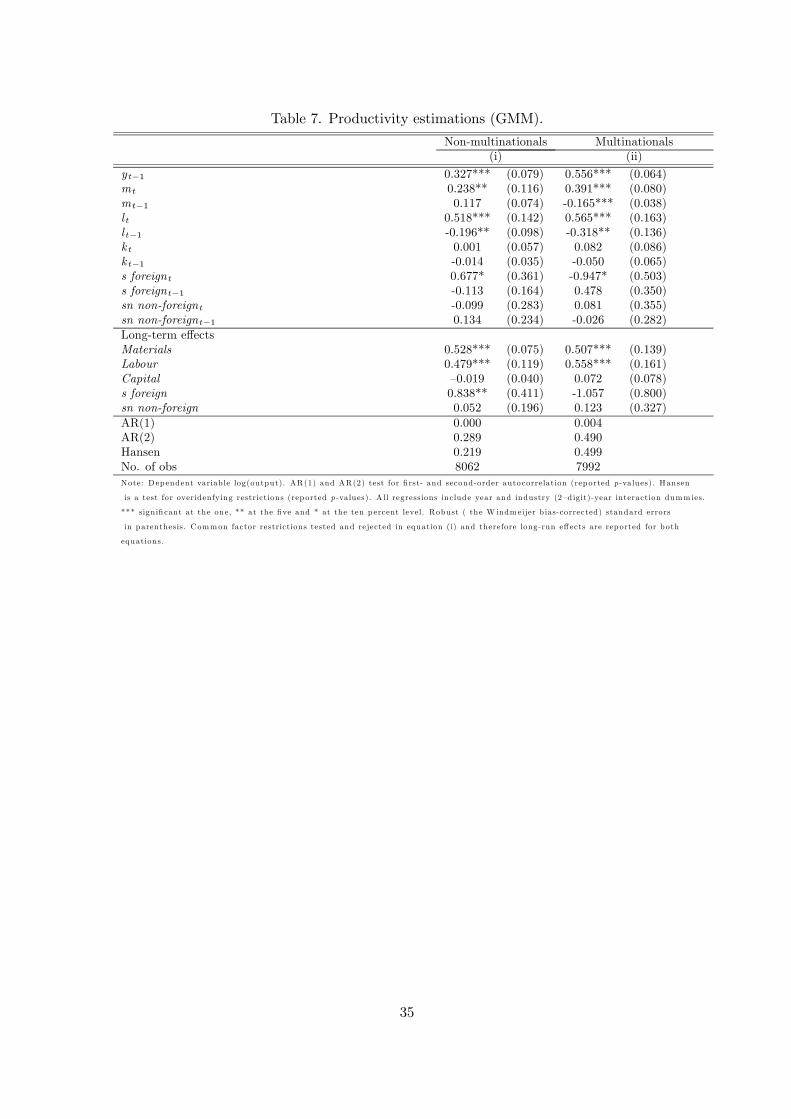
Table 7. Productivity estimations (GMM).
Non-multinationals Multinationals(i) (ii)
y t−1 0.327*** (0.079) 0.556*** (0.064)mt 0.238** (0.116) 0.391*** (0.080)mt−1 0.117 (0.074) -0.165*** (0.038)l t 0.518*** (0.142) 0.565*** (0.163)l t−1 -0.196** (0.098) -0.318** (0.136)k t 0.001 (0.057) 0.082 (0.086)k t−1 -0.014 (0.035) -0.050 (0.065)s foreignt 0.677* (0.361) -0.947* (0.503)s foreignt−1 -0.113 (0.164) 0.478 (0.350)sn non-foreignt -0.099 (0.283) 0.081 (0.355)sn non-foreignt−1 0.134 (0.234) -0.026 (0.282)Long-term effectsMaterials 0.528*** (0.075) 0.507*** (0.139)Labour 0.479*** (0.119) 0.558*** (0.161)Capital —0.019 (0.040) 0.072 (0.078)s foreign 0.838** (0.411) -1.057 (0.800)sn non-foreign 0.052 (0.196) 0.123 (0.327)AR(1) 0.000 0.004AR(2) 0.289 0.490Hansen 0.219 0.499No. of obs 8062 7992Note: Dependent variab le log(output). AR(1) and AR(2) test for fi rst- and second-order auto corre lation (reported p -values). Hansen
is a test for overidenfy ing restrictions (rep orted p -values). A ll regressions include year and industry (2—d igit)-year interaction dumm ies.
*** signifi cant at the one, ** at the five and * at the ten p ercent level. Robust ( the W indmeijer b ias-corrected) standard errors
in parenthesis. Common factor restrictions tested and rejected in equation (i) and therefore long-run eff ects are rep orted for both
equations.
35
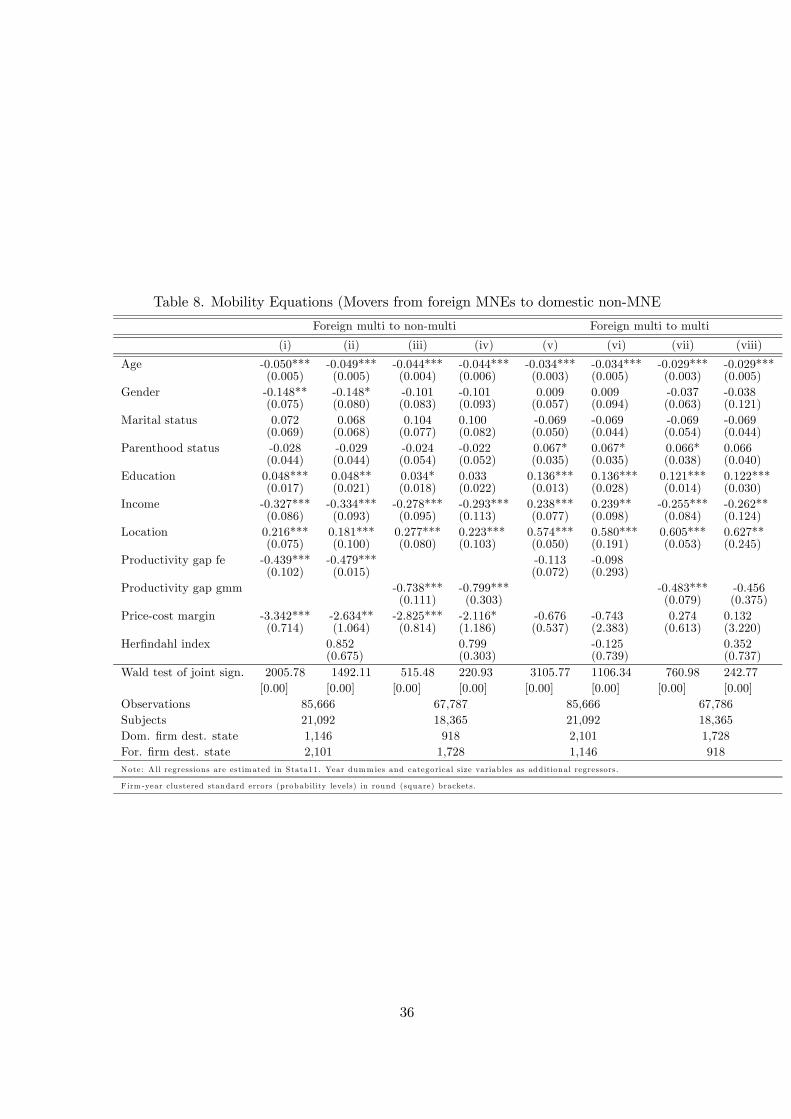
Table 8. Mobility Equations (Movers from foreign MNEs to domestic non-MNE
Foreign multi to non-multi Foreign multi to multi
(i) (ii) (iii) (iv) (v) (vi) (vii) (viii)
Age -0.050*** -0.049*** -0.044*** -0.044*** -0.034*** -0.034*** -0.029*** -0.029***(0.005) (0.005) (0.004) (0.006) (0.003) (0.005) (0.003) (0.005)
Gender -0.148** -0.148* -0.101 -0.101 0.009 0.009 -0.037 -0.038(0.075) (0.080) (0.083) (0.093) (0.057) (0.094) (0.063) (0.121)
Marital status 0.072 0.068 0.104 0.100 -0.069 -0.069 -0.069 -0.069(0.069) (0.068) (0.077) (0.082) (0.050) (0.044) (0.054) (0.044)
Parenthood status -0.028 -0.029 -0.024 -0.022 0.067* 0.067* 0.066* 0.066(0.044) (0.044) (0.054) (0.052) (0.035) (0.035) (0.038) (0.040)
Education 0.048*** 0.048** 0.034* 0.033 0.136*** 0.136*** 0.121*** 0.122***(0.017) (0.021) (0.018) (0.022) (0.013) (0.028) (0.014) (0.030)
Income -0.327*** -0.334*** -0.278*** -0.293*** 0.238*** 0.239** -0.255*** -0.262**(0.086) (0.093) (0.095) (0.113) (0.077) (0.098) (0.084) (0.124)
Location 0.216*** 0.181*** 0.277*** 0.223*** 0.574*** 0.580*** 0.605*** 0.627**(0.075) (0.100) (0.080) (0.103) (0.050) (0.191) (0.053) (0.245)
Productivity gap fe -0.439*** -0.479*** -0.113 -0.098(0.102) (0.015) (0.072) (0.293)
Productivity gap gmm -0.738*** -0.799*** -0.483*** -0.456(0.111) (0.303) (0.079) (0.375)
Price-cost margin -3.342*** -2.634** -2.825*** -2.116* -0.676 -0.743 0.274 0.132(0.714) (1.064) (0.814) (1.186) (0.537) (2.383) (0.613) (3.220)
Herfindahl index 0.852 0.799 -0.125 0.352(0.675) (0.303) (0.739) (0.737)
Wald test of joint sign. 2005.78 1492.11 515.48 220.93 3105.77 1106.34 760.98 242.77[0.00] [0.00] [0.00] [0.00] [0.00] [0.00] [0.00] [0.00]
Observations 85,666 67,787 85,666 67,786Subjects 21,092 18,365 21,092 18,365Dom. firm dest. state 1,146 918 2,101 1,728For. firm dest. state 2,101 1,728 1,146 918Note: A ll regressions are estimated in Stata11. Year dumm ies and categorica l size variables as additional regressors.
F irm -year clustered standard errors (probability levels) in round (square) brackets.
36
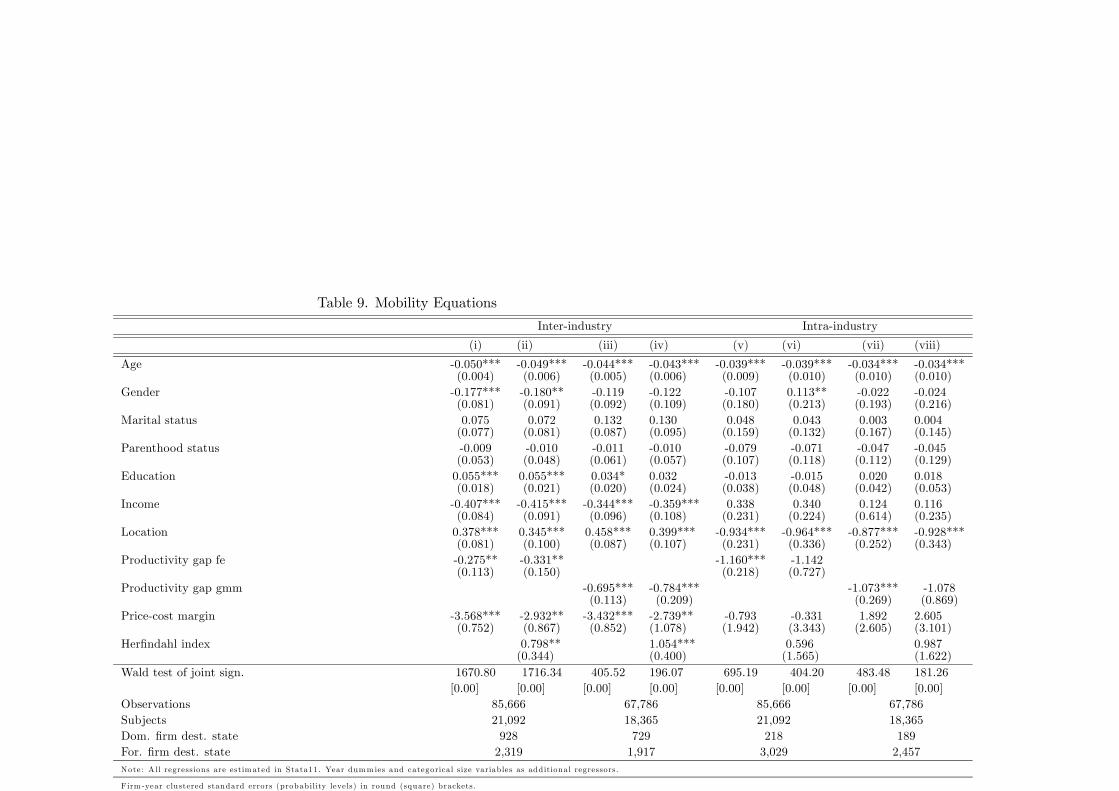
Table 9. Mobility Equations
Inter-industry Intra-industry
(i) (ii) (iii) (iv) (v) (vi) (vii) (viii)
Age -0.050*** -0.049*** -0.044*** -0.043*** -0.039*** -0.039*** -0.034*** -0.034***(0.004) (0.006) (0.005) (0.006) (0.009) (0.010) (0.010) (0.010)
Gender -0.177*** -0.180** -0.119 -0.122 -0.107 0.113** -0.022 -0.024(0.081) (0.091) (0.092) (0.109) (0.180) (0.213) (0.193) (0.216)
Marital status 0.075 0.072 0.132 0.130 0.048 0.043 0.003 0.004(0.077) (0.081) (0.087) (0.095) (0.159) (0.132) (0.167) (0.145)
Parenthood status -0.009 -0.010 -0.011 -0.010 -0.079 -0.071 -0.047 -0.045(0.053) (0.048) (0.061) (0.057) (0.107) (0.118) (0.112) (0.129)
Education 0.055*** 0.055*** 0.034* 0.032 -0.013 -0.015 0.020 0.018(0.018) (0.021) (0.020) (0.024) (0.038) (0.048) (0.042) (0.053)
Income -0.407*** -0.415*** -0.344*** -0.359*** 0.338 0.340 0.124 0.116(0.084) (0.091) (0.096) (0.108) (0.231) (0.224) (0.614) (0.235)
Location 0.378*** 0.345*** 0.458*** 0.399*** -0.934*** -0.964*** -0.877*** -0.928***(0.081) (0.100) (0.087) (0.107) (0.231) (0.336) (0.252) (0.343)
Productivity gap fe -0.275** -0.331** -1.160*** -1.142(0.113) (0.150) (0.218) (0.727)
Productivity gap gmm -0.695*** -0.784*** -1.073*** -1.078(0.113) (0.209) (0.269) (0.869)
Price-cost margin -3.568*** -2.932** -3.432*** -2.739** -0.793 -0.331 1.892 2.605(0.752) (0.867) (0.852) (1.078) (1.942) (3.343) (2.605) (3.101)
Herfindahl index 0.798** 1.054*** 0.596 0.987(0.344) (0.400) (1.565) (1.622)
Wald test of joint sign. 1670.80 1716.34 405.52 196.07 695.19 404.20 483.48 181.26[0.00] [0.00] [0.00] [0.00] [0.00] [0.00] [0.00] [0.00]
Observations 85,666 67,786 85,666 67,786Subjects 21,092 18,365 21,092 18,365Dom. firm dest. state 928 729 218 189For. firm dest. state 2,319 1,917 3,029 2,457Note: A ll regressions are estimated in Stata11. Year dumm ies and categorica l size variables as additional regressors.
F irm -year clustered standard errors (probability levels) in round (square) brackets.