Embed Size (px)
Citation preview
COMPETITION AND PRODUCTIVITY IN THE US TRUCKING INDUSTRY SINCE DEREGULATION
Veiko Paul Parming. Advised by Dr. Chris Caplice
1
Executive Summary
In 1980 Congress passed the Motor Carrier Act, substantially liberating trucking carriers from a
federal regulatory structure that had imposed broad economic controls on the industry for more
than four decades. Changes in the industry were swift and extensive.
This study returns to the transformational period encompassing the deregulatory and
post-deregulatory years, examining industry trends and their underlying forces. Special attention
is paid to quantifying and contextualizing changes in physical productivity. This brief report is a
condensed version of a thesis completed for the Master of Science in Transportation program,
MIT (Parming, 2013). Most of the methodology and discussion is left to the thesis; this report
summarizes the key findings and trends.
The primary original data analysis is of the Motor Carrier Annual Reports (Form M)
dataset for the years 1977-1992 (the baseline for cumulative analysis is set as 1979, the eve of
the Motor Carrier Act). Data quality and representativeness declined over time, so an extension
to the present day is not possible. The analysis is at the firm level, and truckload (TL) and less-
than-truckload (LTL) sectors are studied separately.
Physical multifactor productivity (MFP) growth in the years 1979-1992 is found to
average 1.6% per annum for TL and 1.0% p.a. for LTL. After initial productivity stagnation,
MFP growth from 1983 on was 2.0% and 1.7% p.a. for TL and LTL, respectively. This suggests
steady improvement in efficiency, although not a productivity revolution.
While productivity growth was modest, it played a significant role in cutting unit costs.
Between 1979 and 1992, real unit costs declined by 39% for the truckload sector; productivity
factors were associated with a 17% reduction while input price factors were responsible for a
20% reduction. For the LTL sector, the decline in unit costs was 17%, with productivity
responsible for a 7% drop and input price factors, an 11% drop. The unit cost savings enabled
carriers to offer lower real output prices to shippers.
2
1 Regulation and Deregulation in Trucking
In 1980, Congress undertook deregulation of the interstate motor carrier industry, as part of a
wider movement of deregulation and regulatory reform across the domestic transportation
industries. The Motor Carrier Act of 1980 (MCA) was a product more of the general
deregulatory wave than of any particular agitation within the industry. Notable contemporary
acts included the Railroad Revitalization and Regulatory Reform Act (1976), the Airline
Deregulation Act (1978), and the Staggers Rail Act (1980).
The regulatory agency in charge of the trucking industry – the now-defunct Interstate
Commerce Commission (ICC) – had already begun to liberalize entry and operating policies in
the late 1970s, cognizant of evolving Congressional sentiment. The MCA built on this
momentum, seeking to unleash further the forces of competition. This subsection details three
central components of deregulation: relaxation of pricing controls, greater entry/operational
freedom, and easing of restrictions on firm classification.
Pricing Controls (Ratemaking)
Prior to deregulation, the ICC’s mandate was to ensure trucking rates did not violate its
standards of fairness and reflected a reasonable balance between the interests of the various
parties. Upon finding a rate unreasonable or unjust, the ICC could variously prescribe minimum,
maximum, and/or actual rates depending on the category of carriage. The justification for
minimum and maximum rates was, respectively, the avoidance of “cutthroat” or ruinous
competition and the protection of small, remote, or otherwise disadvantaged shippers (Lieb,
1994).
In practice, most common carriers belonged to rate bureaus and set rates collectively.
Exempted from antitrust laws by the Reed-Bulwinkle Act of 1948, rate bureaus were regional
groups that developed freight classifications and corresponding rates, taking into account
changes in carrier costs and needs. The ICC’s disposition was to provide little resistance to
decisions reached by rate bureaus (Teske, 1995).
Deregulation had the effect of liberalizing pricing. Although deregulation did not
dispossess rate bureaus of their antitrust exemption, it diminished their power. Rate bureaus were
forbidden from voting on single-line rates. A zone of pricing freedom was established, within
3
which rates were to be free of ICC interference and rate bureau involvement. Rates were still
required to be filed with the ICC, but tariff discounts became increasingly common as carriers
sought to compete with one another. Trucking firms often failed to notify the ICC of rate
reductions and the increasingly marginalized ICC did not aggressively pursue the matter (Teske,
1995). With the abolition of the ICC in 1995, rate regulations and tariff filing were finally
eliminated, with small exceptions.
Entry and Operational Freedom
Entry questions were, according to Rothenberg (1994), the ICC’s most time-consuming
issue, demanding 80%-85% of the commission’s time. The 1935 Motor Carrier Act (not to be
confused with the 1980 MCA) had mandated that common carriers hold operating certificates,
issued according to a test of “public convenience and necessity.” In practice, prospective entrants
found it very difficult to prove public necessity where existing markets were already served by
incumbents (Teske, 1995). The result was a long-term decline in the number of ICC-regulated
motor carriers.
The certificate system controlled not only entry into the industry but also entry into
particular markets. Operating certificates specifically enumerated the particular commodities that
could be carried and the routes that had to be followed. The certificates were sellable, and by
some estimates the aggregate market value of the certificates had reached $2-4 billion in 1977
(Teske, 1995).
Along with the ICC initiatives preceding it, the 1980 MCA substantially loosened entry
controls. The common carriers’ “public necessity and convenience” standard was replaced with a
test of “useful public purpose,” and the burden of proof was transferred to opponents to
demonstrate that a new proposed service would not be beneficial. The ICC began to consider
competition and rate levels in approving entry applications. Congress directed the commission to
reduce operating burdens, such as unreasonable or narrow territorial limitations and restrictions
on round-trip authority and service to intermediate points on routes (Lieb, 1994).
With the ICC Termination Act of 1995, requirements for operating authority were
eliminated and the states were pre-empted from imposing economic control over the industry.
Carriers could now transport virtually any commodities; their only entry requirements were to
4
register with the Federal Motor Carrier Safety Administration and to furnish proof of insurance
(Coyle, 2006).
Firm Classification
The pre-deregulatory period had spawned a very particular segmentation scheme among
motor carriers. To simplify, carriers could be for-hire (providing services to the public) or private
(moving the owner’s own freight). Among for-hire carriers there were “common” carriers,
providing service upon demand; and “contract” carriers, engaging shippers in continuing
contracts. Private carriers were not under the control of the ICC; most for-hire carriers were, but
there were also some “exempt” carriers that for one reason or another had managed to obtain
freedom from ICC influence: for example, agricultural lobbyists had secured an exemption for
farm commodities as early as 1935 (Lieb, 1994).
Understood within the context of a regulated market, such a classification scheme
appeared to be supported by reason, but it also necessitated a bureaucratic web of restrictions.
For example, common carriers had incentives to sign low-rate contracts with favored shippers (to
the detriment of disadvantaged shippers), so carriers were forbidden from offering both common
and contract service. Contract carriers, then, might have poached all the favored shippers from
common carriers, so contract carriers were restricted to a maximum of eight customers (the
“Rule of Eight.”)
When Congress determined that it no longer needed to protect small and remote shippers
from the forces of competition, the rationale for many of the restrictions disappeared. Through
the ICC’s late-1970s initiatives and the MCA, dual common-contract carriers became lawful, the
Rule of Eight was eliminated, private trucking firms were permitted to operate for-hire services,
and truckers were authorized to carry regulated and exempt commodities simultaneously in the
same vehicle.
During the 1980s, economic rationale replaced bureaucratic rationale in the
categorization of industry sectors. As the distinction between common and contract carriers
became increasingly obsolete, motor carriers adopted the more logical classifications of
truckload (TL) and less-than-truckload (LTL).
5
Intrastate Deregulation
Even after federal deregulation in 1980, states continued to exercise regulatory authority
over motor carriers well into the 1990s. In 1994, 41 states continued to regulate intrastate
trucking, and 31 states had rate bureaus operating under antitrust immunity (Teske, 1995). The
large disconnect between federal and state regulatory structures created inefficiencies and
perverse incentives for shippers. One notable example: Reno, Nevada became a distribution
capital for California because trips between Reno and California enjoyed the benefit of interstate
status. Unexpectedly, it was the deregulation of airlines that led to congressional pre-emption of
state regulation. Air freight carriers (such as FedEx) had been freed of state air regulation but
became increasingly frustrated with state trucking restrictions that impeded their burgeoning
ground parcel operations. Fearful of losing ground to the parcel carriers, LTL carriers too
became supporters of state deregulation. In 1994, Congress directed states’ regulations to be no
more stringent than ICC rules. The restrictions on state power were retained after the ICC was
abolished a year later (Teske, 1995).
2 Industry Trends since Deregulation
Industry Bifurcation into TL and LTL Sectors
Since deregulation, there has been a bifurcation in the motor carrier industry: firms have come to
specialize in either truckload (TL) or less-than-truckload (LTL) operations. Prior to deregulation
most large carriers were hybrids, performing both TL and LTL operations. Practically, this meant
that they had physical LTL networks but also provided some truckload service, for example on
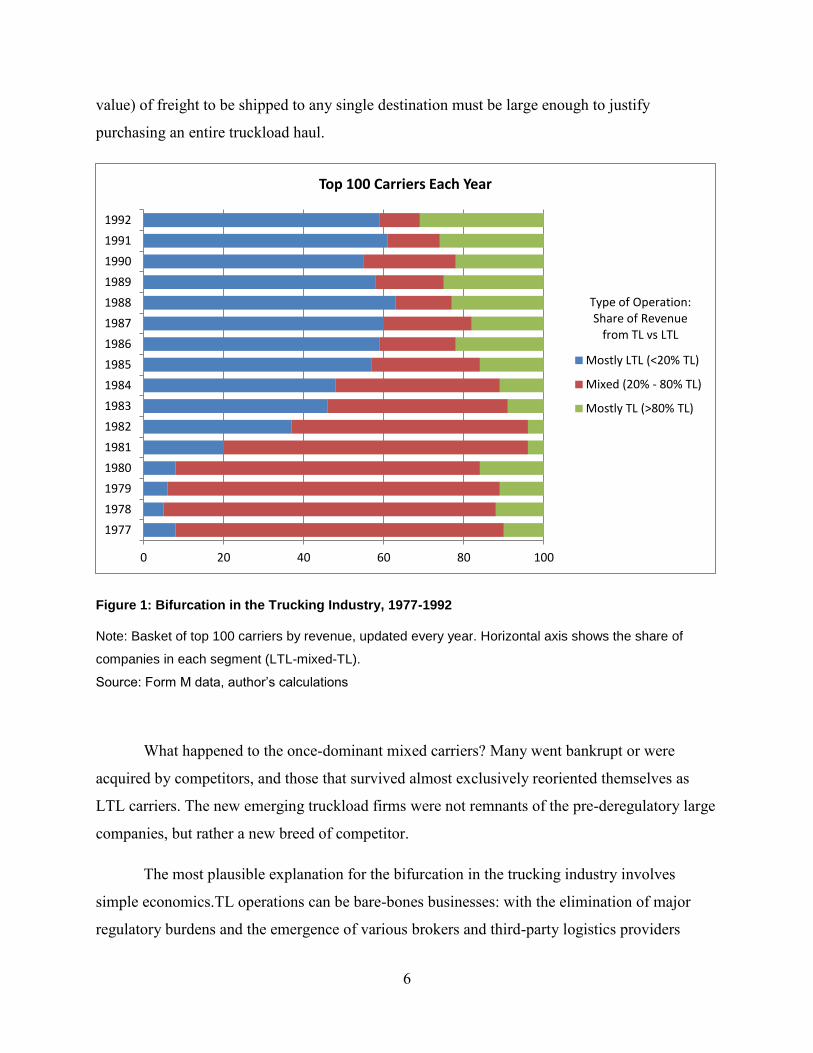
backhauls. Figure 1 shows the extent and speed of the bifurcation. Between 1977 and 1992, the
share of the top 100 firms (by revenue) earning between 20%-80% of their revenues from TL
operations plummeted from 82% to 10%.
Truckload operations entail direct shipments from shipper to consignee. LTL operations
are much more intensive: they involve aggregation of many small shipments and are broadly
similar to package parcel or postal operations, except with larger shipments. Shipping by
truckload is almost always faster and cheaper (on a per unit basis) than LTL, but the quantity (or
6
value) of freight to be shipped to any single destination must be large enough to justify
purchasing an entire truckload haul.
Figure 1: Bifurcation in the Trucking Industry, 1977-1992
Note: Basket of top 100 carriers by revenue, updated every year. Horizontal axis shows the share of
companies in each segment (LTL-mixed-TL).
Source: Form M data, author’s calculations
What happened to the once-dominant mixed carriers? Many went bankrupt or were
acquired by competitors, and those that survived almost exclusively reoriented themselves as
LTL carriers. The new emerging truckload firms were not remnants of the pre-deregulatory large
companies, but rather a new breed of competitor.
The most plausible explanation for the bifurcation in the trucking industry involves
simple economics.TL operations can be bare-bones businesses: with the elimination of major
regulatory burdens and the emergence of various brokers and third-party logistics providers
0 20 40 60 80 100
1977
1978
1979
1980
1981
1982
1983
1984
1985
1986
1987
1988
1989
1990
1991
1992
Top 100 Carriers Each Year
Mostly LTL (<20% TL)
Mixed (20% - 80% TL)
Mostly TL (>80% TL)
Type of Operation: Share of Revenue
from TL vs LTL
7
(3PLs), little prevents even a single person with a leased truck from entering the market and
successfully competing for freight. In contrast, LTL operations demand a physical network of
terminals and a greater number of processes (e.g., picking up freight, aggregating, and sorting).
In economic terms, the bifurcation implies negligible or negative economies of scope or
“cost complementarities.” This is to say that a carrier producing Service X cannot reduce its unit
costs for X by starting to offer (more of) Service Y. Such economies do exist, for example, in the
air passenger industry, where an airline – already paying for aircraft, fuel, and crew for the
passenger movement – can also carry some freight in the cargo hold at very little marginal
expense.
It is intuitively logical that scope economies (in terms of service offering) do not exist for
truckload firms: to start providing LTL service would require TL firms to construct costly
terminals and would not in any way reduce TL unit costs. The argument is a little less intuitive in
the case of LTL carriers, which would not seem to confront major impediments in adding some
truckload service. However, the post-deregulation history has shown that while an LTL firm may
more readily broaden its offerings, it does not enjoy any particular economic advantage from
doing so. Another factor could be that hybrid/LTL carriers have retained high unionization rates,
whereas TL carriers tend to be non-union.
Rapid Growth of New Entrants
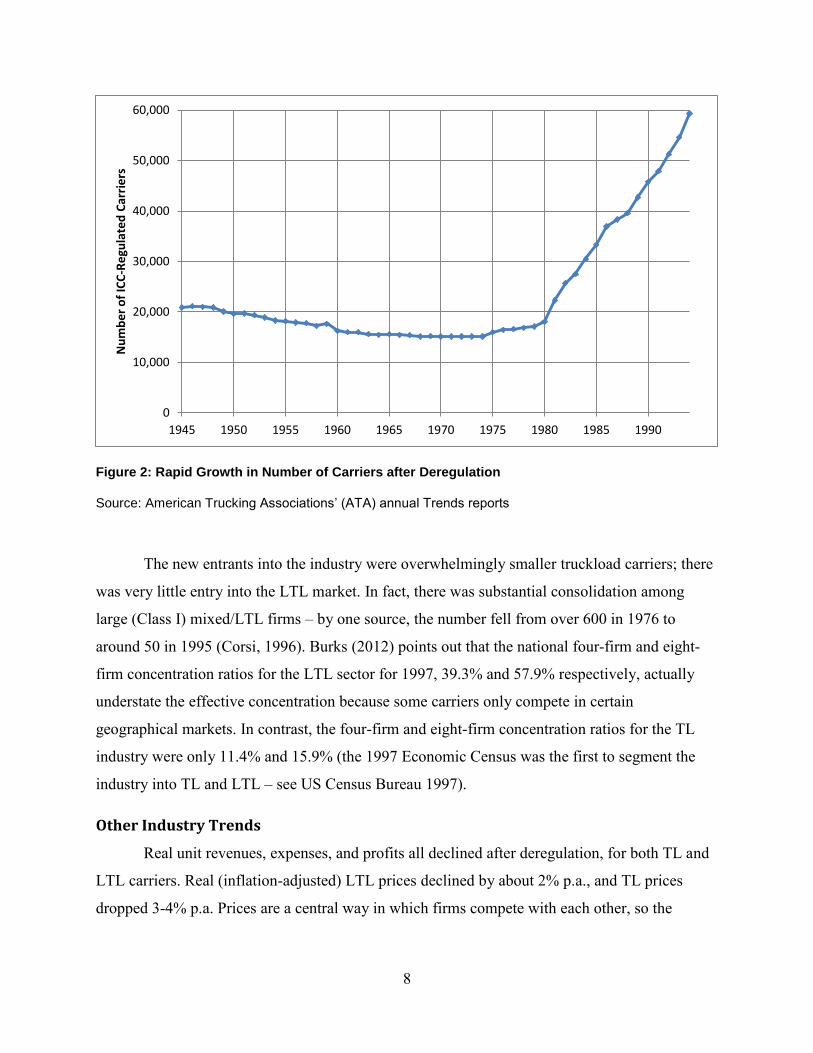
In the late 1970s, the ICC’s internal policy shift in favor of easier entry helped arrest a
long-term decline in the number of carriers. However, the growth in that period was minuscule
compared to the proliferation of carriers after the passage of the MCA (Figure 2).
8
Figure 2: Rapid Growth in Number of Carriers after Deregulation
Source: American Trucking Associations’ (ATA) annual Trends reports
The new entrants into the industry were overwhelmingly smaller truckload carriers; there
was very little entry into the LTL market. In fact, there was substantial consolidation among
large (Class I) mixed/LTL firms – by one source, the number fell from over 600 in 1976 to
around 50 in 1995 (Corsi, 1996). Burks (2012) points out that the national four-firm and eight-
firm concentration ratios for the LTL sector for 1997, 39.3% and 57.9% respectively, actually
understate the effective concentration because some carriers only compete in certain
geographical markets. In contrast, the four-firm and eight-firm concentration ratios for the TL
industry were only 11.4% and 15.9% (the 1997 Economic Census was the first to segment the
industry into TL and LTL – see US Census Bureau 1997).
Other Industry Trends
Real unit revenues, expenses, and profits all declined after deregulation, for both TL and
LTL carriers. Real (inflation-adjusted) LTL prices declined by about 2% p.a., and TL prices
dropped 3-4% p.a. Prices are a central way in which firms compete with each other, so the
0
10,000
20,000
30,000
40,000
50,000
60,000
1945 1950 1955 1960 1965 1970 1975 1980 1985 1990
Nu
mb
er
of
ICC
-Re
gula
ted
Car
rie
rs
9
reduction in output prices is consistent with the hypothesis that competition increased after
deregulation.
Since deregulation, trucking has gained dominance among modes of freight
transportation. Between 1980 and 2005, trucking more than doubled its ton-miles. Rail, too,
nearly doubled its ton-miles, whereas pipelines stagnated and water declined. According to the
2007 Commodity Flow Survey, 41% of ton-miles move by truck, and another 9% by intermodal
modes involving trucks. The trucking industry is responsible for nearly three-quarters of the
nation’s freight transportation by value (this does not even include air and parcel shipments,
which also tend to rely partly on trucking). About the only commodities that rely lightly on
trucking are coal/petroleum and cereal grains; most commodities rely predominantly on trucking.
3 Productivity in Trucking since Deregulation
Productivity is, most fundamentally, how much output can be obtained from one or more inputs.
Maximizing productivity is thus about minimizing the amount of inputs required to produce an
output or, alternatively, maximizing the output from a given set of inputs. For a firm,
productivity is one of the keys to maintaining profitable operations, while for a society
productivity is a major long-term driving force of prosperity. Productivity analysis can be
performed at just about any level: process, firm, or industry.
For this study, productivity is conceived of as physical productivity: the relationship
between physical inputs (employees, trucks and fuel) and physical output (ton-miles). (Ton-
miles, which can also be called loaded ton-miles or revenue ton-miles, is computed by
multiplying the weight of each haul by its distance, and summing over all hauls.) The focus on
physical metrics means that changes in the prices of inputs and outputs are factored out. Hence,
the computed productivity only reflects changes in the physical production process.
The data for this study are from the Motor Carrier Annual Reports (also called “Form
M”), which were submitted annually by the largest trucking firms to the Interstate Commerce
Commission. The dataset contains a wealth of financial and operating statistics at the firm level.
Unfortunately, the data quality declined over time, and the form was eventually discontinued.
10
The data obtained cover the years 1977-1992, the deregulatory and immediate post-deregulatory
years.
Both the industry and the dataset present methodological challenges. Firm concentration
is low, so one cannot perform an industry-level analysis by simply aggregating inputs and
outputs over companies; further, the unavailability of small carrier data must be accepted as a
limitation. As well, in the study period there is considerable overturn in the industry: limiting the
study to survivors severely restricts the dataset and is unrepresentative of the typical company.
With regard to the dataset, some variables are underreported, which creates an obstacle to using
the traditional growth accounting productivity formula. Furthermore, because the ICC began to
rely on voluntary compliance, some companies did not file reports. So the data, though accurate
on the whole, contain some observations of uncertain accuracy, and their selective elimination
would likely introduce analyst error.
Because of these issues, a transformed growth-accounting productivity equation, built
around partial productivities, is used. The method is designed to prioritize robustness over
precision (for a detailed description of the methodology, see Parming, 2013). Note that the
results reflect changes in individual companies from year to year; the effects of new entrants or
dropouts is necessarily not reflected (new entrants are taken into account only once they report
for two successive years). The analysis takes the median performance over the top 50 TL and top
50 LTL companies for every year, giving no greater weight to larger companies.
Figure 3 presents cumulative multifactor productivity findings for the trucking industry.
1979, the eve of the MCA, is selected as the base year. The productivity is multifactor
productivity (MFP), which is essentially a weighted average of partial (or single-factor)
productivities, where the weights reflect the relative importance of the inputs.
11
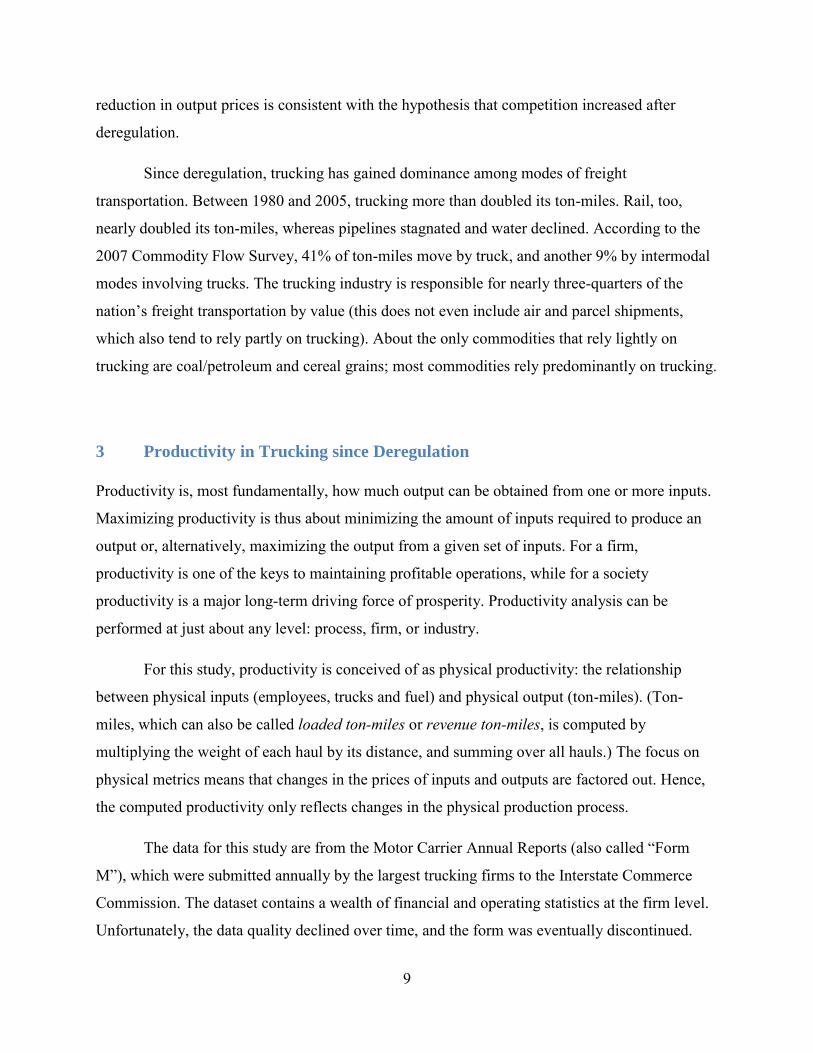
Figure 3: TL vs. LTL Multifactor Productivity Growth (Cumulative)
Source: Form M data, author’s calculations
The truckload sector exhibits superior productivity performance compared to LTL:
between 1979 and 1992, productivity growth is 23% for TL and 13% for LTL. This corresponds
to a growth rate of 1.6% p.a. for TL and 1.0% p.a. for LTL.
The early years appear to be the source of much of the divergence between the two
sectors. Whereas truckload productivity improved in 1980 and 1981, LTL productivity stalled.
During the subsequent 10 years, both sectors exhibited comparable positive MFP growth: 2%
p.a. for TL and 1.7% p.a. for LTL.
Both sectors experienced negative productivity performance in 1982, 1985 and 1989.
Since the quality of the data is not perfect, interpreting year-to-year changes is not as safe as
assessing the cumulative, long-term trends. Because of these concerns, this paper does not delve
deeply into the underlying causes of productivity performance. However, it seems very likely
that recession had something to do with the reduction in productivity in 1982. This is because
there is a “stickiness” with which firms can and do reduce workforce and physical capital in
-10%
-5%
0%
5%
10%
15%
20%
25%
1979 1981 1983 1985 1987 1989 1991
LTL
TL
12
response to declining production. The flip side is that companies may be expected to emerge
leaner and more competitive after recession. Indeed, the data tend to show that years of poor
productivity performance are followed by years of exceptional performance.
Overall, productivity growth is positive, but not spectacular. It would be more than a
stretch to claim some kind of productivity revolution in the trucking industry after deregulation.
The more likely explanation is that carriers were better able to pursue operational efficiencies
after burdensome restrictions were removed, and as competition heightened the incentive for
exploiting technological advances.
That productivity performance would be superior in the truckload sector is not entirely
surprising. LTL carriers tended to be unionized, and may have been more resistant to change. In
addition, productivity performance may have been hurt by excess capacity given the seeming
oversupply of LTL companies.
4 Unit Costs Decomposed into Productivity and Prices
Perhaps the most striking indicator of increased competition in the trucking industry after
deregulation was the rapid decline in trucking prices. This, in turn, was largely explained by a
corresponding decrease in unit costs. But how were these cost reductions obtained? Improved
productivity was a factor, but input prices also played a role.
In this section, unit costs are decomposed using a method that is essentially one of partial
derivatives. The dependent variable is unit cost (expense per ton-mile), and this can be equated
to independent variables using simple structural relationships that are true by definition. If we
know the relationships and the changes in the variables over time, we can ascertain the relative
impacts of the dependent variables on unit costs over time. Note that no statistical estimation is
necessary, because the relationship between dependent and independent variables is known
exactly.
For example, unit expense can be decomposed into unit labor expense, unit capital
expense, etc., and then unit labor expense can be further decomposed into labor productivity and
the labor input price. Some additional complexity is introduced because of the use of industry
13
medians; the full stepwise procedure is described in the thesis (Parming 2013). At the final step,
some dependent variables are partial productivity factors (i.e. physical ratios) and some are input
price factors. There are also some other factors containing expense items that cannot be
decomposed into productivity and price (e.g. taxes and administrative expenses), because a
physical basis for measurement either does not exist or is not available.
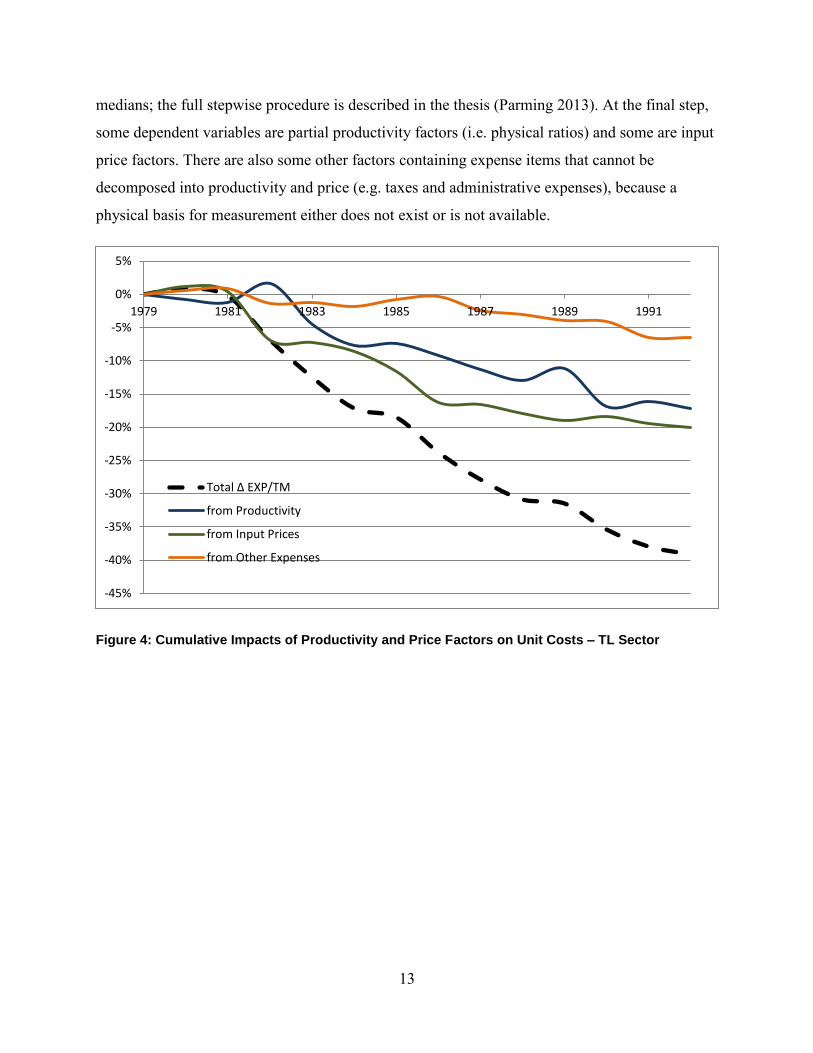
Figure 4: Cumulative Impacts of Productivity and Price Factors on Unit Costs – TL Sector
-45%
-40%
-35%
-30%
-25%
-20%
-15%
-10%
-5%
0%
5%
1979 1981 1983 1985 1987 1989 1991
Total ∆ EXP/TM
from Productivity
from Input Prices
from Other Expenses
14
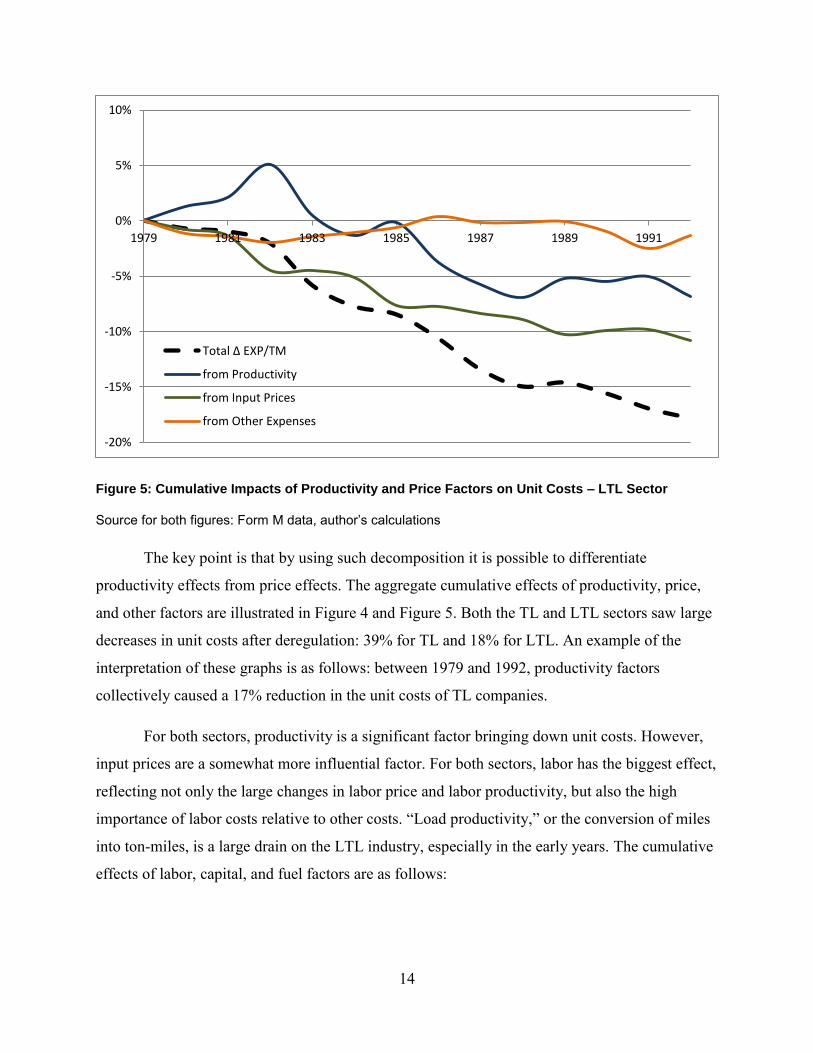
Figure 5: Cumulative Impacts of Productivity and Price Factors on Unit Costs – LTL Sector
Source for both figures: Form M data, author’s calculations
The key point is that by using such decomposition it is possible to differentiate
productivity effects from price effects. The aggregate cumulative effects of productivity, price,
and other factors are illustrated in Figure 4 and Figure 5. Both the TL and LTL sectors saw large
decreases in unit costs after deregulation: 39% for TL and 18% for LTL. An example of the
interpretation of these graphs is as follows: between 1979 and 1992, productivity factors
collectively caused a 17% reduction in the unit costs of TL companies.
For both sectors, productivity is a significant factor bringing down unit costs. However,
input prices are a somewhat more influential factor. For both sectors, labor has the biggest effect,
reflecting not only the large changes in labor price and labor productivity, but also the high
importance of labor costs relative to other costs. “Load productivity,” or the conversion of miles
into ton-miles, is a large drain on the LTL industry, especially in the early years. The cumulative
effects of labor, capital, and fuel factors are as follows:
-20%
-15%
-10%
-5%
0%
5%
10%
1979 1981 1983 1985 1987 1989 1991
Total ∆ EXP/TM
from Productivity
from Input Prices
from Other Expenses
15
Table 1: Cumulative Effect of Productivity and Price Factors on Unit Costs
Variable Variable Name TL Sector LTL Sector
TOTAL Change in Unit Cost EXP/TM -39% -18%
from Load Productivity MILE/TM +1% +12%
from Labor Costs LABEXP/MILE -19% -19%
from Per Mile Labor Productivity LAB/MILE -10% -13%
from Labor Input Prices LABEXP/LAB -12% -8%
from Capital Costs CAPEXP/MILE -9% -3%
from Per Mile Capital Productivity CAP/MILE -4% -1%
from Capital Input Prices CAPEXP/CAP -6% -2%
from Fuel Costs FUELEXP/MILE -5% -3%
from Per Mile Fuel Productivity FUEL/MILE -3% -3%
from Fuel Input Prices FUELEXP/FUEL -3% -1%
from Other Costs OTHEXP/MILE -7% -1%
SUBTOTAL, from Productivity Factors -17% -7%
SUBTOTAL, from Input Price Factors -20% -11%
SUBTOTAL, from Other Factors -7% -1%
5 Conclusion
Deregulation had both a direct and an indirect impact on the performance of firms. The direct
effect was that it reduced routing circuity and other inefficiencies; it let firms take advantage of
geographic or other economies by expanding their operations into new markets or new service
offerings. The indirect effect was even more profound: in liberalizing pricing and entry and
opening up the industry to greater competition, deregulation encouraged carriers to meet and
exceed the state of the practice in producing high quality freight transportation more
productively and at lower cost.
The path was not painless. Bankruptcy was a common fate in the 1980s, as struggling
carriers failed to keep up. The gap in the bankruptcy rate between the trucking industry and the
general economy rose sharply in the early 1980s and only declined in the mid-1990s (ATA
Trends, various years). Additionally, labor interests took a hit: the Teamsters union lost much of
16
its power, and real wages declined by around 24% for TL and 14% for LTL. (On the other hand,
as industry output increased, so did the need for more drivers.) However, some of the feared
negative consequences have not materialized. Service to small communities and small shippers
has not suffered (Morrison and Winston 1999), and safety has improved, as illustrated by a
roughly 500% decrease in the fatal crash rate since 1979 (DOT 2009).
The finding of a modest positive productivity improvement since deregulation is
consistent with other studies of trucking productivity. Apostolides (2009) also computes
multifactor productivity (MFP) for the industry, but for a different time period and in a different
manner. His finding, based on Bureau of Economic Analysis data, is of 0.8% p.a. growth in MFP
from 1987-2003. Boyer and Burks (2006) estimate productivity at the vehicle level, and seek to
disentangle “true” physical productivity advances from shifts in the composition of traffic. They
find a growth rate of approximately 2.2% p.a., of which roughly 30% is caused by a composition
bias (e.g. increases in haul length). Notwithstanding the important conceptual and
methodological differences between those studies and this one, the similar findings lend support
to the conclusion of an improvement, but not a revolution, in trucking productivity.
This study is distinguished from others on the subject in its segmentation into TL and
LTL sectors, its focus on strictly physical productivity, and its quantitative assessment of the
relative roles of productivity and price factors.
It would be ideal also to compare productivity performance post-deregulation to that in
the 1970s and earlier. Unfortunately, the data allowing for such a backwards extension could not
be obtained. What does seem apparent is that real rates were stagnant prior to deregulation: data
from the ENO Foundation, reproduced in Lieb (1994), show LTL rates that, once adjusted for
inflation, largely hold steady between 1960 and 1980. This implies that either physical
productivity did not improve or that gains arising from productivity advances were not passed
through. Either way, deregulation was clearly a turning point for the trucking industry.
The evolution of trucking in the span of just 30 years from an industry constrained by
federal and state controls to a dynamic, competitive sector offers a number of key lessons:
17
First, enormous changes can take place in very short order when competition is allowed
to flourish. The sudden bifurcation of the industry into truckload and less-than-truckload sectors,
and the massive upswing in the number of carriers, are perhaps the most impressive examples.
Second, the benefits of such fundamental regulatory changes were not of a one-off
nature. Competition incentivizes producers to use all available tools to produce greater value.
These indirect benefits of regulatory liberalization are complex, powerful, and enduring.
Third, even incremental regulatory changes can produce a large market response, if the
changes are the right ones. It is easy to fall into the trap of thinking the trucking industry was
fully deregulated in 1980. Yet rate bureaus were not disbanded nor stripped of their antitrust
immunity, nor was the ICC’s control over entry taken away. But the competitive forces
unleashed made these distinctions seem minor.
Fourth, the impetus for regulatory reform does not always come from the parties that
stand to gain the most. In the case of trucking, the main beneficiaries of deregulation – shippers –
were broadly satisfied with trucking service during the regulated period. It would have been
difficult to predict the transformations in costs and service quality that took place. One is only
left to wonder for how long trucking regulation may have survived had such dire deterioration in
the railroads not compelled Congress to take up the larger issue of transportation regulation.
Finally, a regulatory structure is not just a set of laws and rules: it quickly becomes an
institution in its own right. In theory, heavy regulation can provide a potential for system
optimization, or at least a capacity for managing the system in a careful, rational way. But these
promises can be illusory. Even the cleverest regulators would have found it hard to foresee the
true potential of the trucking industry, much less effectuate it.
Ten Observations about Trucking Deregulation
1) The Motor Carrier Act (MCA) of 1980 substantially liberalized the trucking industry and
was part of a larger deregulatory movement across the domestic transportation industries.
18
2) Deregulation did not happen overnight: the ICC had started to liberalize its policies
several years in advance, and the MCA weakened rather than eliminated the regulatory
structure.
3) The key aspects of the regulatory structure were entry restrictions via operating
certificates, price controls and (in practice) collective pricing, and bureaucratic
restrictions relating to firm classification. The collective effect of these was to curtail
competition.
4) After deregulation the industry rapidly bifurcated, as carriers came to specialize in
truckload (TL) or less-than-truckload (LTL) operations.
5) In the 1980s there was rapid overturn in the industry as the bankruptcy rate peaked and
the number of new entrants skyrocketed. The vast majority of new firms were small
truckload carriers.
6) Real output prices, stagnant for decades, dropped by an annual 2% p.a. for LTL and 3-4%
for TL in the decade or so after deregulation (the period for which the report has detailed
data). Indications are that real prices continued to decline into the 1990s and 2000s.
7) Output price declines were enabled by reduced unit profits and reduced unit costs.
Responsibility for unit cost declines seems to be shared between physical productivity
factors and input price factors, with the latter somewhat more prominent.
8) Physical multifactor productivity increased by 1.6% p.a. for TL and 1% p.a. for LTL
from 1979-1992. There was no productivity revolution in trucking, but the increased
productivity did significantly contribute to unit cost savings.
9) Real labor input prices declined by around 24% for TL and 14% for LTL from 1979-
1992. In addition to those workers whose wages were cut, other net losers from
deregulation included the labor union, and uncompetitive carriers that went bankrupt. The
big winners were shippers and (by extension) consumers, who reaped the benefits of
lower prices and higher service quality.
10) Trucking output has more than doubled in the 30 years after deregulation, and today
trucking is perhaps the most dominant mode of freight transportation. These
developments owe much to the increased competitiveness of trucking, the ascendancy of
intermodal transportation, and shifts in transported commodities toward smaller, high-
value items.
19
References American Trucking Associations, American Trucking Trends, various years
Annual Reports (Form M) data for motor carriers of property. The author would like to thank Dr.
Stephen Burks, University of Minnesota and Dr. Thomas Corsi, University of Maryland.
Apostolides, A. (2009). Estimation and Analysis of Multifactor Productivity in Truck
Transportation: 1987-2003. Bureau of Transportation Statistics, Office of Advanced
Studies
Boyer, K. and Burks, S. (2009). Stuck in the Slow Lane: Traffic Composition and the
Measurement of Trucking Productivity. Southern Economic Journal. Vol. 75, No. 4, pp.
1220-1237
Burks, S. and Guy, F. (2012). What Are Over-the-Road Truckers Paid For? Evidence from an
Exogenous Regulatory Change on the Role of Social Comparisons and Work
Organization in Wage Determination.” Institute for the Study of Labor (IZA) Discussion
Paper #6375
Bureau of Labor Statistics, CPI-U, U.S. All-City Average, available 1913-present
Bureau of Transportation Statistics, Commodity Flow Surveys, various years
Corsi, T. (1996). Current and Alternative Federal Size and Weight Policies: Less-Than-
Truckload Motor Carriers. University of Maryland, College of Business and
Management.
Department of Transportation. (2009). Large Bus and Truck Crash Facts
Lieb, R. C. (1994). Transportation. Dame Publications.
Morrison, S. and Winston, C. (1999). Regulatory Reform of U.S. Intercity Transportation.
Chapter 14 of Gomez-Ibanez, J., Tye, W. and Winston, C. (1999). Essays in
Transportation Economics and Policy. Brookings Institution Press.
Rothenberg, L. (1994). Regulation, Organizations, and Politics: Motor Freight Policy at the
Interstate Commerce Commission. University of Michigan Press.
Teske, P., Best, S. and Mintrom, M. (1995). Deregulating Freight Transportation: Delivering the
Goods. The American Enterprise Institute. The AEI Press.
US Census Bureau (1997), NAICS 484121 and NAICS 484122
Full Thesis: Parming, V. (2013). Productivity and Competition in the U.S. Trucking
Industry since Deregulation. MST Master’s Thesis. MIT.

transportation.mit.edu/productivity.php


![TRUCKING INDUSTRY · [ 6 ] TRUCKING INDUSTRY ENVIRONMENTAL BEST PRACTICE GUIDE ThE AUSTRALIAN TRUCKING ASSOCIATION The Australian Trucking Association (ATA) is the national peak body](https://img.pdfslide.us/doc/110x75/5e6e335355a7c4346213f0b4/trucking-6-trucking-industry-environmental-best-practice-guide-the-australian.jpg)