Embed Size (px)
Citation preview

Multilevel models for predicting personal victimisation in England
and Wales
Andromachi Tseloni
Analysis of crime data
ESRC Research Methods Festival 2010
St. Catherine’s College, Oxford, 5-8 July 2010

7 July 2010 2
Outline
•Victimisation theory and levels of analysis
•Data
•Dependent variable and covariates
•Statistical specification
•Modelling strategy
•Results
•Conclusions

7 July 2010 3
Victimisation theory
•Lifestyle & Routine Activity
(Hindelang et al. 1978; Cohen and Felson 1979; Felson 1998)
Individual Characteristics including Lifestyle
Level 1 unit of analysis: individual
•Social Disorganisation
(Shaw and McKay 1942; Sampson and Wooldregde 1987; Sampson and Groves 1989)
Area Characteristics
Level 2 unit of analysis: quarter postcode sector

7 July 2010 4
Data
•Crimes, individual & household characteristics taken from the 2000 British Crime Survey – Incidents occurred within a 15´ walk from home to
respondents who have not moved house in the previous year.
– 905 areas (sampling points=quarter postcode sectors) – 4-29 households per sampling point (mean=10, standard
deviation=5.9) – 15,774 individuals in total
•Area characteristics taken from the 1991 Census Small Area Statistics– 5% random error, standardised values
7 July 2010 5
Personal crimes
•Common assault
•Wounding
•Robbery
•Theft from person
•Other theft from person
•Sexual offences excluded
•Series incidents are truncated at 5 events.

7 July 2010 6
Figure 1: Personal Crimes across Areas (mean=0.8, skewness=2.9, concentration=2.0)
.00 1.00 2.00 3.00 4.00 5.00 6.00 7.00 8.00 9.00 14.00
arpe
0.0%
10.0%
20.0%
30.0%
40.0%
50.0%
60.0%
Percent
7 July 2010 7
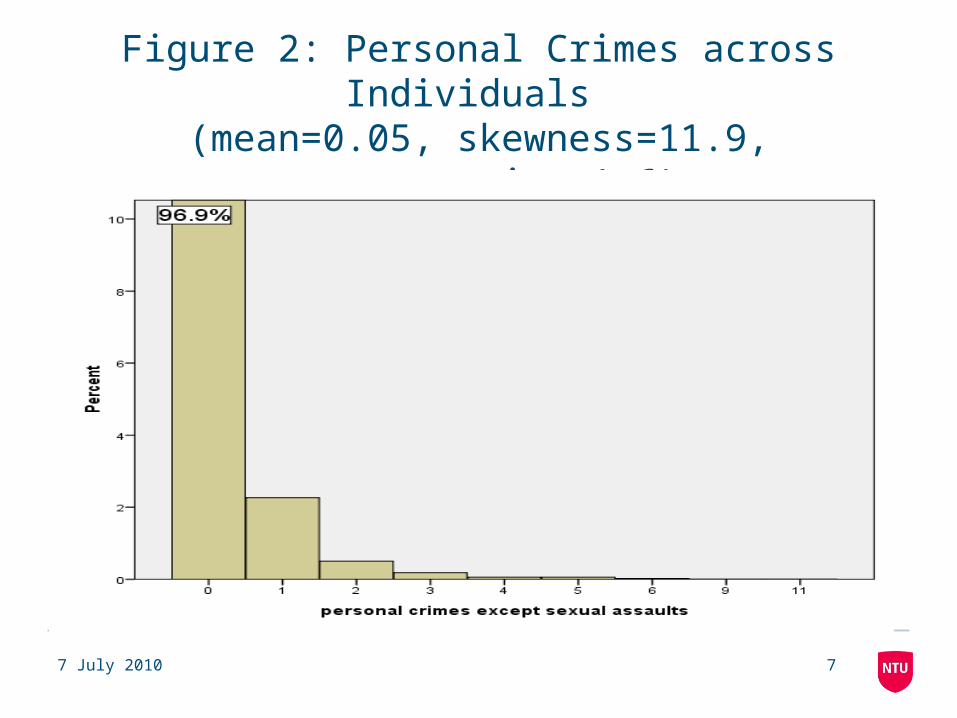
Figure 2: Personal Crimes across Individuals (mean=0.05, skewness=11.9, concentration=1.6)

7 July 2010 8
Covariates: Household Level (1)
•Demographic (male, age, non-white ethnicity)
•Social (marital status, living with children, education, social class)
•Tenure and accommodation type
•Household Income
•Length of residence in the area
•Routine activities (away from home, going to pubs, clubs and drinking alcohol)
•Area type (inner city, urban)

7 July 2010 9
Covariates: Area Level (2)•9 Regions of England and Wales (with South East=basis)
•Percent (%) households renting privately
•% Single adult non-pensioner households
•% Afro-Caribbean
•% Indian-subcontinent
•% Population 16-24 years
•% Households in housing association accommodation
•% Households moved in the area last year
•Population density
•Poverty [0.859 percent lone parent households+0.887 percent households without car-0.758 nonmanual-0.877 percent owner occupied households+ 0.720 mean number of persons per room+0.889 percent households renting from LA].

7 July 2010 10
Statistical Model
• Multilevel negative binomial regression with extra negative binomial variation Cameron and Trivedi 1986 J. of Appl. EconometricsGoldstein 1995 Multilevel Statistical ModelsSnijders and Bosker 1999 Multilevel AnalysisTseloni 2000 J. of Quant. Crim.
• ln ij=nij=Xij+q=pq=0 uqjzqij+q=Q-1
q=p+1 uqjzqj
i=1,...,15,774, j=1,...,905 (1)[uqj]~N(0,u)
ln ij= nij+ eij (2)
where exp(e0ij) follows a gamma probability distribution
• E(Yij)= ij= exp( nij) & var(Yij)= ij+ 2ij / (3)
/2 overdispersion due to unexplained heterogeneity between individuals & 2/ precision parameter

7 July 2010 11
Modelling strategy
Software MLwiN 2.11
Gradually added covariates
The ones with p-value of χ12 < 0.10 were retained
Five models fitted:
Baseline model with just a random intercept
Fixed individual and household effects
Fixed individual, household and routine activities or lifestyle effects
Fixed individual, household, lifestyle and area effects
Fixed individual, household, lifestyle and area effects with fixed (cross-cluster) interactions
7 July 2010 12
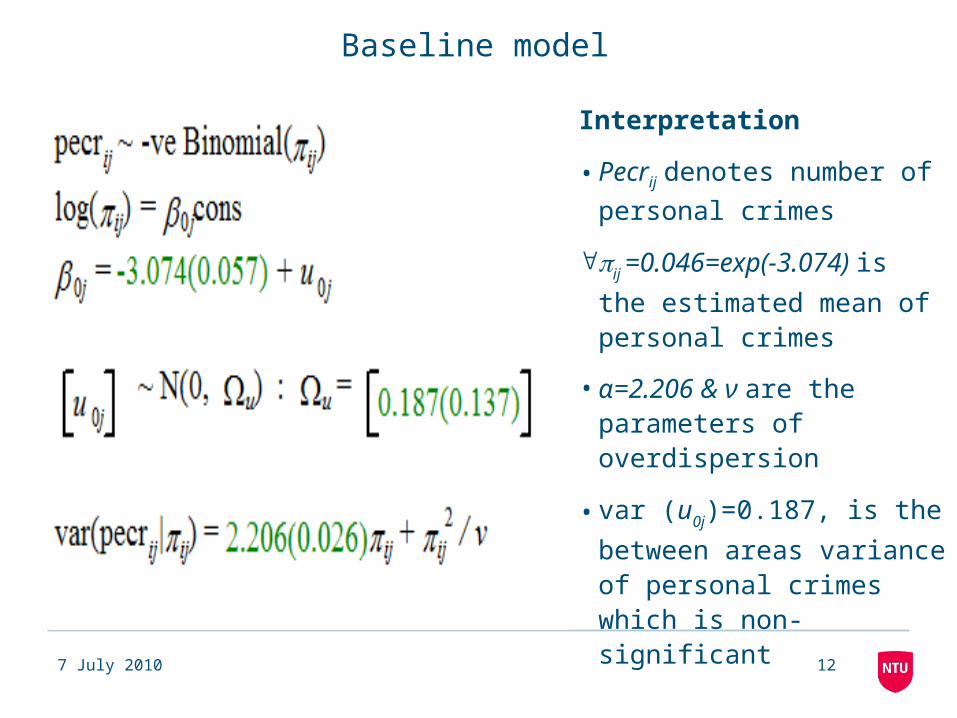
Baseline model
Interpretation
•Pecrij denotes number of
personal crimes
ij =0.046=exp(-3.074) is
the estimated mean of personal crimes
•α=2.206 & ν are the parameters of overdispersion
•var (u0j)=0.187, is the
between areas variance of personal crimes which is non- significant

7 July 2010 13
Final model

7 July 2010 14
Interpretation of results: constant
ij =0.016=exp(-2.332-0.0442x51+0.00018x512) is
the estimated number of personal crimes that a 51 years old married white woman without children is expected to experience per year. This woman has household income less than £30,000, goes to pubs less than 3 times per week and to clubs less often than once a week. Finally, she lives in her owned detached house for over 2 years in a rural area of England and Wales with national average population density and poverty.

7 July 2010 15
Interpretation of results: Figure 3: Predicted personal crimes and individual’s age

7 July 2010 16
Interpretation of results: significant socio-demographic effects
Positive
• Single
• Divorced, especially with children
• Windowed in high population density areas
• Having children
• Social renters
• Private renters
• In terraced houses
• In flats or maisonettes
• Movers (less than 2 years in the same area)
Negative
• Asian or black
• Non – definable social class
• Living in inner city

7 July 2010 17
Interpretation of results: significant lifestyle and area positive effects
Lifestyle
•Men who go to clubs at least once per week
•Parents of children who go to pubs at least 3 times per week
Area
•Poverty
•Population density

7 July 2010 18
Interpretation of results: Figure 4: Predicted personal crimes and area poverty

7 July 2010 19
Interpretation of results: Figure 5: Predicted personal crimes and
area population density

7 July 2010 20
Interpretation of results: Figure 6: Predicted personal crimes for widowed
individuals and others across area population density

7 July 2010 21
Conclusions• Personal criminal victimisation is predicted by individual and area
characteristics.
• While significant unexplained heterogeneity between individuals remains, area information fully accounts for the area clustering of personal victimisation.
• The results partly confirm the assertions of lifestyle /routine activities theory. Being male, non-white, inner city resident or having an outgoing lifestyle in general are exceptions.
• The results also confirm the social disorganisation theory with respect to economic deprivation and population density. But they also showed that ethnic heterogeneity, residential mobility and high proportions of young population do not predict personal crimes.
• The two theories should integrate into a single one as the effects of some risk factors on personal victimisation are communicable and/or depend on context.