Embed Size (px)
Citation preview
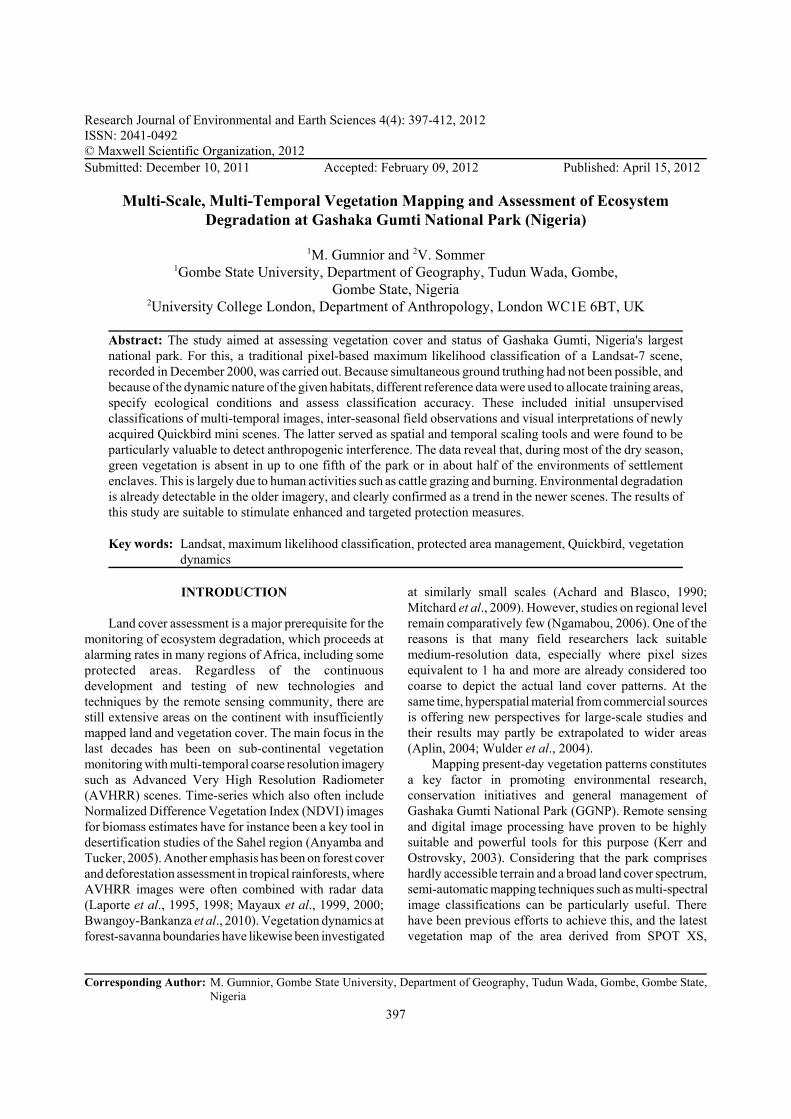
Research Journal of Environmental and Earth Sciences 4(4): 397-412, 2012
ISSN: 2041-0492
© Maxwell Scientific Organization, 2012
Submitted: December 10, 2011 Accepted: February 09, 2012 Published: April 15, 2012
Corresponding Author: M. Gumnior, Gombe State University, Department of Geography, Tudun Wada, Gombe, Gombe State,
Nigeria
397
Multi-Scale, Multi-Temporal Vegetation Mapping and Assessment of Ecosystem
Degradation at Gashaka Gumti National Park (Nigeria)
1M. Gumnior and 2V. Sommer1Gombe State University, Department of Geography, Tudun Wada, Gombe,
Gombe State, Nigeria2University College London, Department of Anthropology, London WC1E 6BT, UK
Abstract: The study aimed at assessing vegetation cover and status of Gashaka Gumti, Nigeria's largest
national park. For this, a traditional pixel-based maximum likelihood classification of a Landsat-7 scene,
recorded in December 2000, was carried out. Because simultaneous ground truthing had not been possible, and
because of the dynamic nature of the given habitats, different reference data were used to allocate training areas,
specify ecological conditions and assess classification accuracy. These included initial unsupervised
classifications of multi-temporal images, inter-seasonal field observations and visual interpretations of newly
acquired Quickbird mini scenes. The latter served as spatial and temporal scaling tools and were found to be
particularly valuable to detect anthropogenic interference. The data reveal that, during most of the dry season,
green vegetation is absent in up to one fifth of the park or in about half of the environments of settlement
enclaves. This is largely due to human activities such as cattle grazing and burning. Environmental degradation
is already detectable in the older imagery, and clearly confirmed as a trend in the newer scenes. The results of
this study are suitable to stimulate enhanced and targeted protection measures.
Key words: Landsat, maximum likelihood classification, protected area management, Quickbird, vegetation
dynamics
INTRODUCTION
Land cover assessment is a major prerequisite for the
monitoring of ecosystem degradation, which proceeds at
alarming rates in many regions of Africa, including some
protected areas. Regardless of the continuous
development and testing of new technologies and
techniques by the remote sensing community, there are
still extensive areas on the continent with insufficiently
mapped land and vegetation cover. The main focus in the
last decades has been on sub-continental vegetation
monitoring with multi-temporal coarse resolution imagery
such as Advanced Very High Resolution Radiometer
(AVHRR) scenes. Time-series which also often include
Normalized Difference Vegetation Index (NDVI) images
for biomass estimates have for instance been a key tool in
desertification studies of the Sahel region (Anyamba and
Tucker, 2005). Another emphasis has been on forest cover
and deforestation assessment in tropical rainforests, where
AVHRR images were often combined with radar data
(Laporte et al., 1995, 1998; Mayaux et al., 1999, 2000;
Bwangoy-Bankanza et al., 2010). Vegetation dynamics at
forest-savanna boundaries have likewise been investigated
at similarly small scales (Achard and Blasco, 1990;
Mitchard et al., 2009). However, studies on regional level
remain comparatively few (Ngamabou, 2006). One of the
reasons is that many field researchers lack suitable
medium-resolution data, especially where pixel sizes
equivalent to 1 ha and more are already considered too
coarse to depict the actual land cover patterns. At the
same time, hyperspatial material from commercial sources
is offering new perspectives for large-scale studies and
their results may partly be extrapolated to wider areas
(Aplin, 2004; Wulder et al., 2004).
Mapping present-day vegetation patterns constitutes
a key factor in promoting environmental research,
conservation initiatives and general management of
Gashaka Gumti National Park (GGNP). Remote sensing
and digital image processing have proven to be highly
suitable and powerful tools for this purpose (Kerr and
Ostrovsky, 2003). Considering that the park comprises
hardly accessible terrain and a broad land cover spectrum,
semi-automatic mapping techniques such as multi-spectral
image classifications can be particularly useful. There
have been previous efforts to achieve this, and the latest
vegetation map of the area derived from SPOT XS,
Res. J. Environ. Earth. Sci., 4(4): 397-412, 2012
398
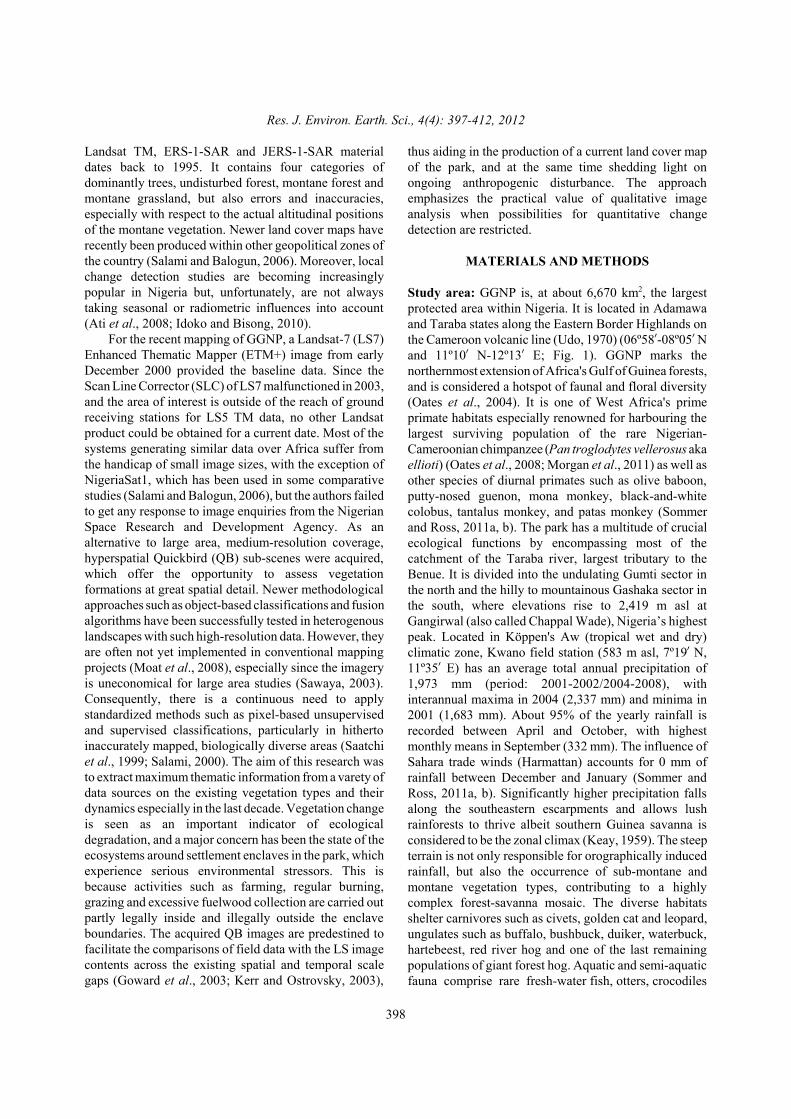
Landsat TM, ERS-1-SAR and JERS-1-SAR material
dates back to 1995. It contains four categories of
dominantly trees, undisturbed forest, montane forest and
montane grassland, but also errors and inaccuracies,
especially with respect to the actual altitudinal positions
of the montane vegetation. Newer land cover maps have
recently been produced within other geopolitical zones of
the country (Salami and Balogun, 2006). Moreover, local
change detection studies are becoming increasingly
popular in Nigeria but, unfortunately, are not always
taking seasonal or radiometric influences into account
(Ati et al., 2008; Idoko and Bisong, 2010).
For the recent mapping of GGNP, a Landsat-7 (LS7)
Enhanced Thematic Mapper (ETM+) image from early
December 2000 provided the baseline data. Since the
Scan Line Corrector (SLC) of LS7 malfunctioned in 2003,
and the area of interest is outside of the reach of ground
receiving stations for LS5 TM data, no other Landsat
product could be obtained for a current date. Most of the
systems generating similar data over Africa suffer from
the handicap of small image sizes, with the exception of
NigeriaSat1, which has been used in some comparative
studies (Salami and Balogun, 2006), but the authors failed
to get any response to image enquiries from the Nigerian
Space Research and Development Agency. As an
alternative to large area, medium-resolution coverage,
hyperspatial Quickbird (QB) sub-scenes were acquired,
which offer the opportunity to assess vegetation
formations at great spatial detail. Newer methodological
approaches such as object-based classifications and fusion
algorithms have been successfully tested in heterogenous
landscapes with such high-resolution data. However, they
are often not yet implemented in conventional mapping
projects (Moat et al., 2008), especially since the imagery
is uneconomical for large area studies (Sawaya, 2003).
Consequently, there is a continuous need to apply
standardized methods such as pixel-based unsupervised
and supervised classifications, particularly in hitherto
inaccurately mapped, biologically diverse areas (Saatchi
et al., 1999; Salami, 2000). The aim of this research was
to extract maximum thematic information from a varety of
data sources on the existing vegetation types and their
dynamics especially in the last decade. Vegetation change
is seen as an important indicator of ecological
degradation, and a major concern has been the state of the
ecosystems around settlement enclaves in the park, which
experience serious environmental stressors. This is
because activities such as farming, regular burning,
grazing and excessive fuelwood collection are carried out
partly legally inside and illegally outside the enclave
boundaries. The acquired QB images are predestined to
facilitate the comparisons of field data with the LS image
contents across the existing spatial and temporal scale
gaps (Goward et al., 2003; Kerr and Ostrovsky, 2003),
thus aiding in the production of a current land cover map
of the park, and at the same time shedding light on
ongoing anthropogenic disturbance. The approach
emphasizes the practical value of qualitative image
analysis when possibilities for quantitative change
detection are restricted.
MATERIALS AND METHODS
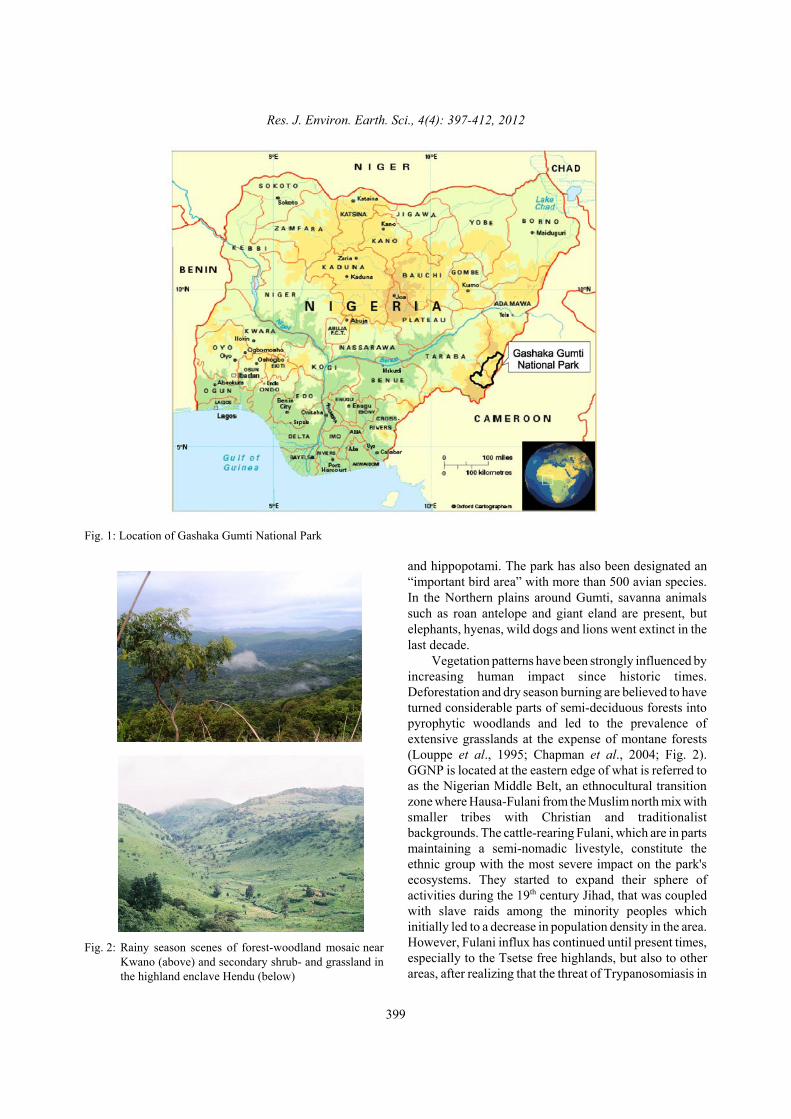
Study area: GGNP is, at about 6,670 km2, the largest
protected area within Nigeria. It is located in Adamawa
and Taraba states along the Eastern Border Highlands on
the Cameroon volcanic line (Udo, 1970) (06º58!-08º05! N
and 11º10! N-12º13! E; Fig. 1). GGNP marks the
northernmost extension of Africa's Gulf of Guinea forests,
and is considered a hotspot of faunal and floral diversity
(Oates et al., 2004). It is one of West Africa's prime
primate habitats especially renowned for harbouring the
largest surviving population of the rare Nigerian-
Cameroonian chimpanzee (Pan troglodytes vellerosus aka
ellioti) (Oates et al., 2008; Morgan et al., 2011) as well as
other species of diurnal primates such as olive baboon,
putty-nosed guenon, mona monkey, black-and-white
colobus, tantalus monkey, and patas monkey (Sommer
and Ross, 2011a, b). The park has a multitude of crucial
ecological functions by encompassing most of the
catchment of the Taraba river, largest tributary to the
Benue. It is divided into the undulating Gumti sector in
the north and the hilly to mountainous Gashaka sector in
the south, where elevations rise to 2,419 m asl at
Gangirwal (also called Chappal Wade), Nigeria’s highest
peak. Located in Köppen's Aw (tropical wet and dry)
climatic zone, Kwano field station (583 m asl, 7º19! N,
11º35! E) has an average total annual precipitation of
1,973 mm (period: 2001-2002/2004-2008), with
interannual maxima in 2004 (2,337 mm) and minima in
2001 (1,683 mm). About 95% of the yearly rainfall is
recorded between April and October, with highest
monthly means in September (332 mm). The influence of
Sahara trade winds (Harmattan) accounts for 0 mm of
rainfall between December and January (Sommer and
Ross, 2011a, b). Significantly higher precipitation falls
along the southeastern escarpments and allows lush
rainforests to thrive albeit southern Guinea savanna is
considered to be the zonal climax (Keay, 1959). The steep
terrain is not only responsible for orographically induced
rainfall, but also the occurrence of sub-montane and
montane vegetation types, contributing to a highly
complex forest-savanna mosaic. The diverse habitats
shelter carnivores such as civets, golden cat and leopard,
ungulates such as buffalo, bushbuck, duiker, waterbuck,
hartebeest, red river hog and one of the last remaining
populations of giant forest hog. Aquatic and semi-aquatic
fauna comprise rare fresh-water fish, otters, crocodiles
Res. J. Environ. Earth. Sci., 4(4): 397-412, 2012
399
Fig. 1: Location of Gashaka Gumti National Park
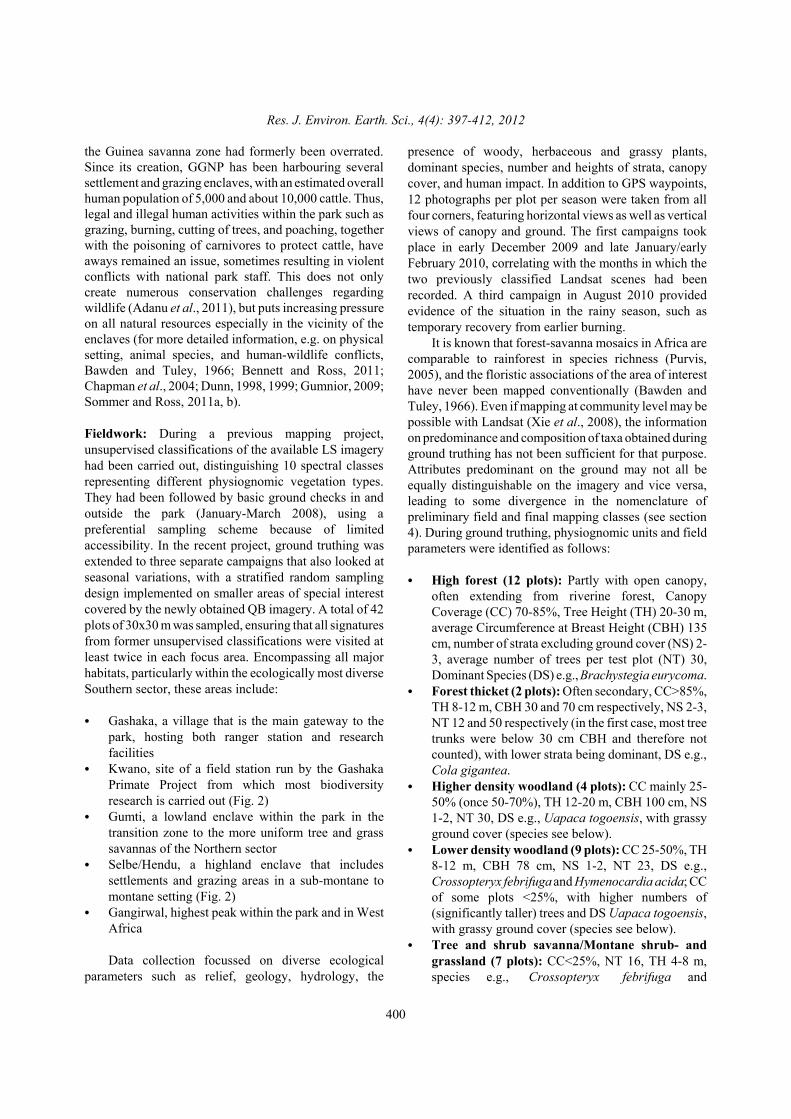
Fig. 2: Rainy season scenes of forest-woodland mosaic near
Kwano (above) and secondary shrub- and grassland in
the highland enclave Hendu (below)
and hippopotami. The park has also been designated an
“important bird area” with more than 500 avian species.
In the Northern plains around Gumti, savanna animals
such as roan antelope and giant eland are present, but
elephants, hyenas, wild dogs and lions went extinct in the
last decade.
Vegetation patterns have been strongly influenced by
increasing human impact since historic times.
Deforestation and dry season burning are believed to have
turned considerable parts of semi-deciduous forests into
pyrophytic woodlands and led to the prevalence of
extensive grasslands at the expense of montane forests
(Louppe et al., 1995; Chapman et al., 2004; Fig. 2).
GGNP is located at the eastern edge of what is referred to
as the Nigerian Middle Belt, an ethnocultural transition
zone where Hausa-Fulani from the Muslim north mix with
smaller tribes with Christian and traditionalist
backgrounds. The cattle-rearing Fulani, which are in parts
maintaining a semi-nomadic livestyle, constitute the
ethnic group with the most severe impact on the park's
ecosystems. They started to expand their sphere of
activities during the 19th century Jihad, that was coupled
with slave raids among the minority peoples which
initially led to a decrease in population density in the area.
However, Fulani influx has continued until present times,
especially to the Tsetse free highlands, but also to other
areas, after realizing that the threat of Trypanosomiasis in
Res. J. Environ. Earth. Sci., 4(4): 397-412, 2012
400
the Guinea savanna zone had formerly been overrated.
Since its creation, GGNP has been harbouring several
settlement and grazing enclaves, with an estimated overall
human population of 5,000 and about 10,000 cattle. Thus,
legal and illegal human activities within the park such as
grazing, burning, cutting of trees, and poaching, together
with the poisoning of carnivores to protect cattle, have
aways remained an issue, sometimes resulting in violent
conflicts with national park staff. This does not only
create numerous conservation challenges regarding
wildlife (Adanu et al., 2011), but puts increasing pressure
on all natural resources especially in the vicinity of the
enclaves (for more detailed information, e.g. on physical
setting, animal species, and human-wildlife conflicts,
Bawden and Tuley, 1966; Bennett and Ross, 2011;
Chapman et al., 2004; Dunn, 1998, 1999; Gumnior, 2009;
Sommer and Ross, 2011a, b).
Fieldwork: During a previous mapping project,
unsupervised classifications of the available LS imagery
had been carried out, distinguishing 10 spectral classes
representing different physiognomic vegetation types.
They had been followed by basic ground checks in and
outside the park (January-March 2008), using a
preferential sampling scheme because of limited
accessibility. In the recent project, ground truthing was
extended to three separate campaigns that also looked at
seasonal variations, with a stratified random sampling
design implemented on smaller areas of special interest
covered by the newly obtained QB imagery. A total of 42
plots of 30x30 m was sampled, ensuring that all signatures
from former unsupervised classifications were visited at
least twice in each focus area. Encompassing all major
habitats, particularly within the ecologically most diverse
Southern sector, these areas include:
! Gashaka, a village that is the main gateway to the
park, hosting both ranger station and research
facilities
! Kwano, site of a field station run by the Gashaka
Primate Project from which most biodiversity
research is carried out (Fig. 2)
! Gumti, a lowland enclave within the park in the
transition zone to the more uniform tree and grass
savannas of the Northern sector
! Selbe/Hendu, a highland enclave that includes
settlements and grazing areas in a sub-montane to
montane setting (Fig. 2)
! Gangirwal, highest peak within the park and in West
Africa
Data collection focussed on diverse ecological
parameters such as relief, geology, hydrology, the
presence of woody, herbaceous and grassy plants,
dominant species, number and heights of strata, canopy
cover, and human impact. In addition to GPS waypoints,
12 photographs per plot per season were taken from all
four corners, featuring horizontal views as well as vertical
views of canopy and ground. The first campaigns took
place in early December 2009 and late January/early
February 2010, correlating with the months in which the
two previously classified Landsat scenes had been
recorded. A third campaign in August 2010 provided
evidence of the situation in the rainy season, such as
temporary recovery from earlier burning.
It is known that forest-savanna mosaics in Africa are
comparable to rainforest in species richness (Purvis,
2005), and the floristic associations of the area of interest
have never been mapped conventionally (Bawden and
Tuley, 1966). Even if mapping at community level may be
possible with Landsat (Xie et al., 2008), the information
on predominance and composition of taxa obtained during
ground truthing has not been sufficient for that purpose.
Attributes predominant on the ground may not all be
equally distinguishable on the imagery and vice versa,
leading to some divergence in the nomenclature of
preliminary field and final mapping classes (see section
4). During ground truthing, physiognomic units and field
parameters were identified as follows:
! High forest (12 plots): Partly with open canopy,
often extending from riverine forest, Canopy
Coverage (CC) 70-85%, Tree Height (TH) 20-30 m,
average Circumference at Breast Height (CBH) 135
cm, number of strata excluding ground cover (NS) 2-
3, average number of trees per test plot (NT) 30,
Dominant Species (DS) e.g., Brachystegia eurycoma.
! Forest thicket (2 plots): Often secondary, CC>85%,
TH 8-12 m, CBH 30 and 70 cm respectively, NS 2-3,
NT 12 and 50 respectively (in the first case, most tree
trunks were below 30 cm CBH and therefore not
counted), with lower strata being dominant, DS e.g.,
Cola gigantea.
! Higher density woodland (4 plots): CC mainly 25-
50% (once 50-70%), TH 12-20 m, CBH 100 cm, NS
1-2, NT 30, DS e.g., Uapaca togoensis, with grassy
ground cover (species see below).
! Lower density woodland (9 plots): CC 25-50%, TH
8-12 m, CBH 78 cm, NS 1-2, NT 23, DS e.g.,
Crossopteryx febrifuga and Hymenocardia acida; CC
of some plots <25%, with higher numbers of
(significantly taller) trees and DS Uapaca togoensis,
with grassy ground cover (species see below).
! Tree and shrub savanna/Montane shrub- and
grassland (7 plots): CC<25%, NT 16, TH 4-8 m,
species e.g., Crossopteryx febrifuga and
Res. J. Environ. Earth. Sci., 4(4): 397-412, 2012
401
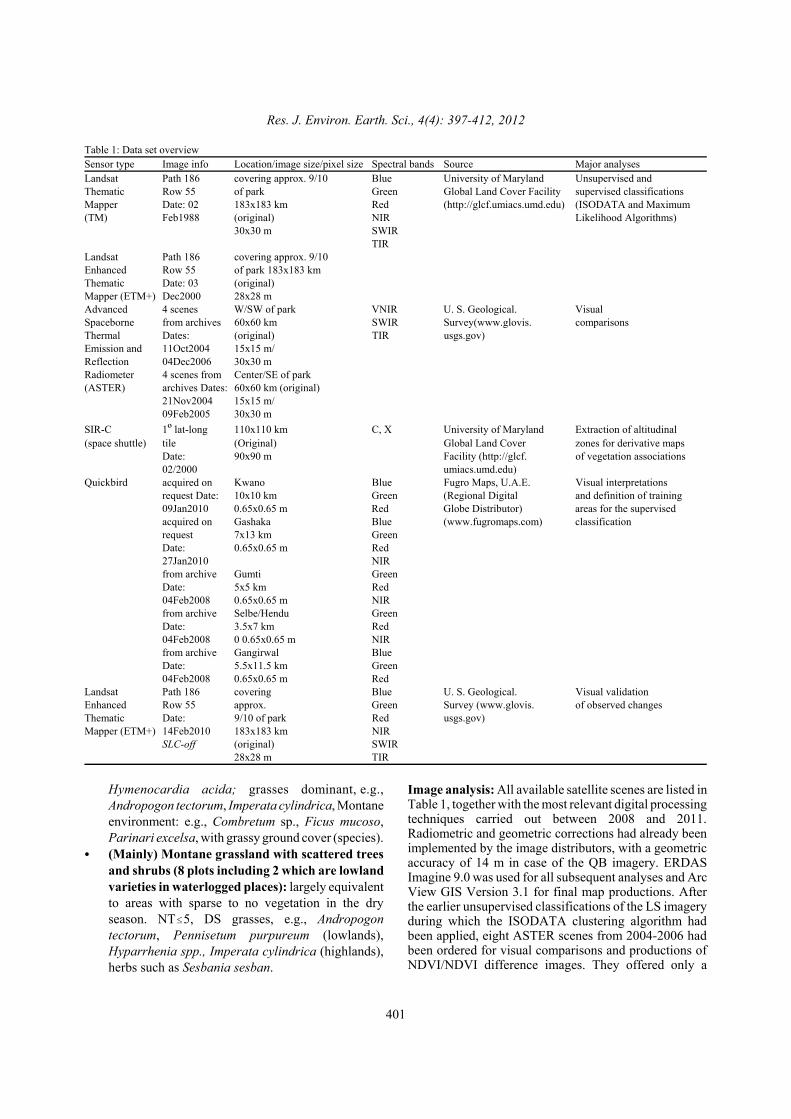
Table 1: Data set overview
Sensor type Image info Location/image size/pixel size Spectral bands Source Major analyses
Landsat Path 186 covering approx. 9/10 Blue University of Maryland Unsupervised and
Thematic Row 55 of park Green Global Land Cover Facility supervised classifications
Mapper Date: 02 183x183 km Red (http://glcf.umiacs.umd.edu) (ISODATA and Maximum
(TM) Feb1988 (original) NIR Likelihood Algorithms)
30x30 m SWIR
TIR
Landsat Path 186 covering approx. 9/10
Enhanced Row 55 of park 183x183 km
Thematic Date: 03 (original)
Mapper (ETM+) Dec2000 28x28 m
Advanced 4 scenes W/SW of park VNIR U. S. Geological. Visual
Spaceborne from archives 60x60 km SWIR Survey(www.glovis. comparisons
Thermal Dates: (original) TIR usgs.gov)
Emission and 11Oct2004 15x15 m/
Reflection 04Dec2006 30x30 m
Radiometer 4 scenes from Center/SE of park
(ASTER) archives Dates: 60x60 km (original)
21Nov2004 15x15 m/
09Feb2005 30x30 m
SIR-C 1º lat-long 110x110 km C, X University of Maryland Extraction of altitudinal
(space shuttle) tile (Original) Global Land Cover zones for derivative maps
Date: 90x90 m Facility (http://glcf. of vegetation associations
02/2000 umiacs.umd.edu)
Quickbird acquired on Kwano Blue Fugro Maps, U.A.E. Visual interpretations
request Date: 10x10 km Green (Regional Digital and definition of training
09Jan2010 0.65x0.65 m Red Globe Distributor) areas for the supervised
acquired on Gashaka Blue (www.fugromaps.com) classification
request 7x13 km Green
Date: 0.65x0.65 m Red
27Jan2010 NIR
from archive Gumti Green
Date: 5x5 km Red
04Feb2008 0.65x0.65 m NIR
from archive Selbe/Hendu Green
Date: 3.5x7 km Red
04Feb2008 0 0.65x0.65 m NIR
from archive Gangirwal Blue
Date: 5.5x11.5 km Green
04Feb2008 0.65x0.65 m Red
Landsat Path 186 covering Blue U. S. Geological. Visual validation
Enhanced Row 55 approx. Green Survey (www.glovis. of observed changes
Thematic Date: 9/10 of park Red usgs.gov)
Mapper (ETM+) 14Feb2010 183x183 km NIR
SLC-off (original) SWIR
28x28 m TIR
Hymenocardia acida; grasses dominant, e.g.,
Andropogon tectorum, Imperata cylindrica, Montane
environment: e.g., Combretum sp., Ficus mucoso,
Parinari excelsa, with grassy ground cover (species).
! (Mainly) Montane grassland with scattered trees
and shrubs (8 plots including 2 which are lowland
varieties in waterlogged places): largely equivalent
to areas with sparse to no vegetation in the dry
season. NT"5, DS grasses, e.g., Andropogon
tectorum, Pennisetum purpureum (lowlands),
Hyparrhenia spp., Imperata cylindrica (highlands),
herbs such as Sesbania sesban.
Image analysis: All available satellite scenes are listed inTable 1, together with the most relevant digital processingtechniques carried out between 2008 and 2011.Radiometric and geometric corrections had already beenimplemented by the image distributors, with a geometricaccuracy of 14 m in case of the QB imagery. ERDASImagine 9.0 was used for all subsequent analyses and ArcView GIS Version 3.1 for final map productions. Afterthe earlier unsupervised classifications of the LS imageryduring which the ISODATA clustering algorithm hadbeen applied, eight ASTER scenes from 2004-2006 hadbeen ordered for visual comparisons and productions ofNDVI/NDVI difference images. They offered only a
Res. J. Environ. Earth. Sci., 4(4): 397-412, 2012
402
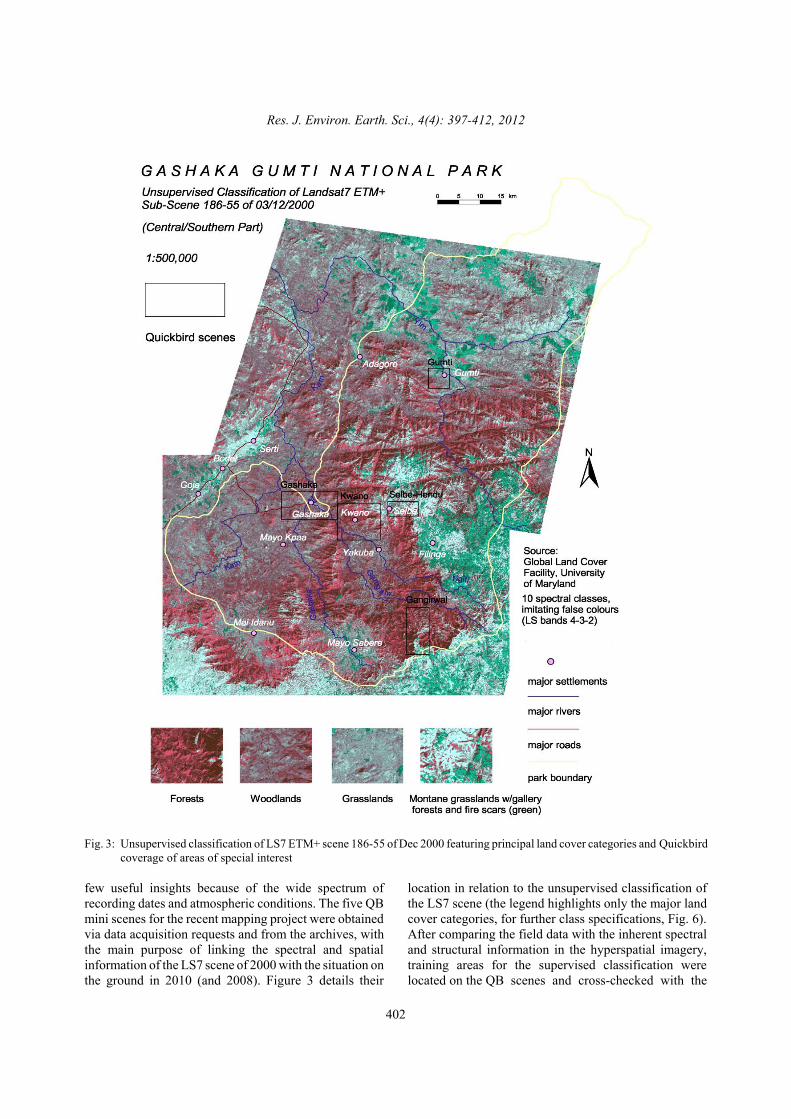
Fig. 3: Unsupervised classification of LS7 ETM+ scene 186-55 of Dec 2000 featuring principal land cover categories and Quickbird
coverage of areas of special interest
few useful insights because of the wide spectrum of
recording dates and atmospheric conditions. The five QB
mini scenes for the recent mapping project were obtained
via data acquisition requests and from the archives, with
the main purpose of linking the spectral and spatial
information of the LS7 scene of 2000 with the situation on
the ground in 2010 (and 2008). Figure 3 details their
location in relation to the unsupervised classification of
the LS7 scene (the legend highlights only the major land
cover categories, for further class specifications, Fig. 6).
After comparing the field data with the inherent spectral
and structural information in the hyperspatial imagery,
training areas for the supervised classification were
located on the QB scenes and cross-checked with the
Res. J. Environ. Earth. Sci., 4(4): 397-412, 2012
403
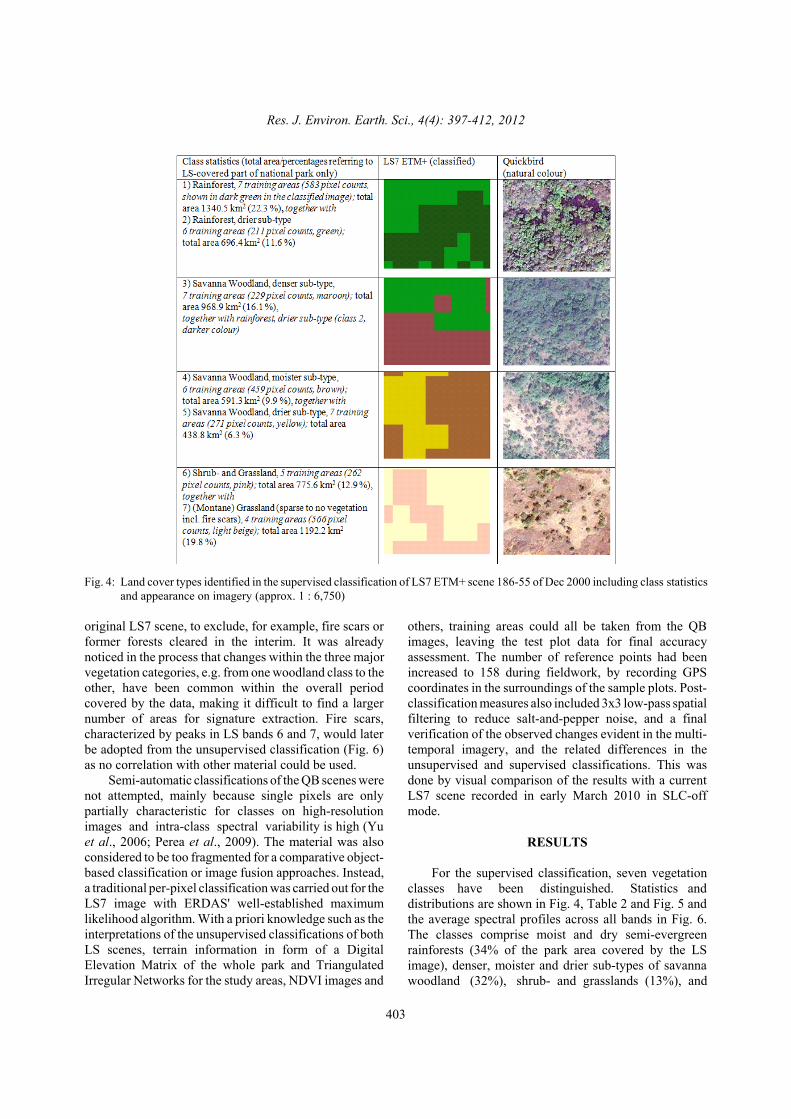
Fig. 4: Land cover types identified in the supervised classification of LS7 ETM+ scene 186-55 of Dec 2000 including class statistics
and appearance on imagery (approx. 1 : 6,750)
original LS7 scene, to exclude, for example, fire scars or
former forests cleared in the interim. It was already
noticed in the process that changes within the three major
vegetation categories, e.g. from one woodland class to the
other, have been common within the overall period
covered by the data, making it difficult to find a larger
number of areas for signature extraction. Fire scars,
characterized by peaks in LS bands 6 and 7, would later
be adopted from the unsupervised classification (Fig. 6)
as no correlation with other material could be used.
Semi-automatic classifications of the QB scenes were
not attempted, mainly because single pixels are only
partially characteristic for classes on high-resolution
images and intra-class spectral variability is high (Yu
et al., 2006; Perea et al., 2009). The material was also
considered to be too fragmented for a comparative object-
based classification or image fusion approaches. Instead,
a traditional per-pixel classification was carried out for the
LS7 image with ERDAS' well-established maximum
likelihood algorithm. With a priori knowledge such as the
interpretations of the unsupervised classifications of both
LS scenes, terrain information in form of a Digital
Elevation Matrix of the whole park and Triangulated
Irregular Networks for the study areas, NDVI images and
others, training areas could all be taken from the QB
images, leaving the test plot data for final accuracy
assessment. The number of reference points had been
increased to 158 during fieldwork, by recording GPS
coordinates in the surroundings of the sample plots. Post-
classification measures also included 3x3 low-pass spatial
filtering to reduce salt-and-pepper noise, and a final
verification of the observed changes evident in the multi-
temporal imagery, and the related differences in the
unsupervised and supervised classifications. This was
done by visual comparison of the results with a current
LS7 scene recorded in early March 2010 in SLC-off
mode.
RESULTS
For the supervised classification, seven vegetation
classes have been distinguished. Statistics and
distributions are shown in Fig. 4, Table 2 and Fig. 5 and
the average spectral profiles across all bands in Fig. 6.
The classes comprise moist and dry semi-evergreen
rainforests (34% of the park area covered by the LS
image), denser, moister and drier sub-types of savanna
woodland (32%), shrub- and grasslands (13%), and
Res. J. Environ. Earth. Sci., 4(4): 397-412, 2012
404
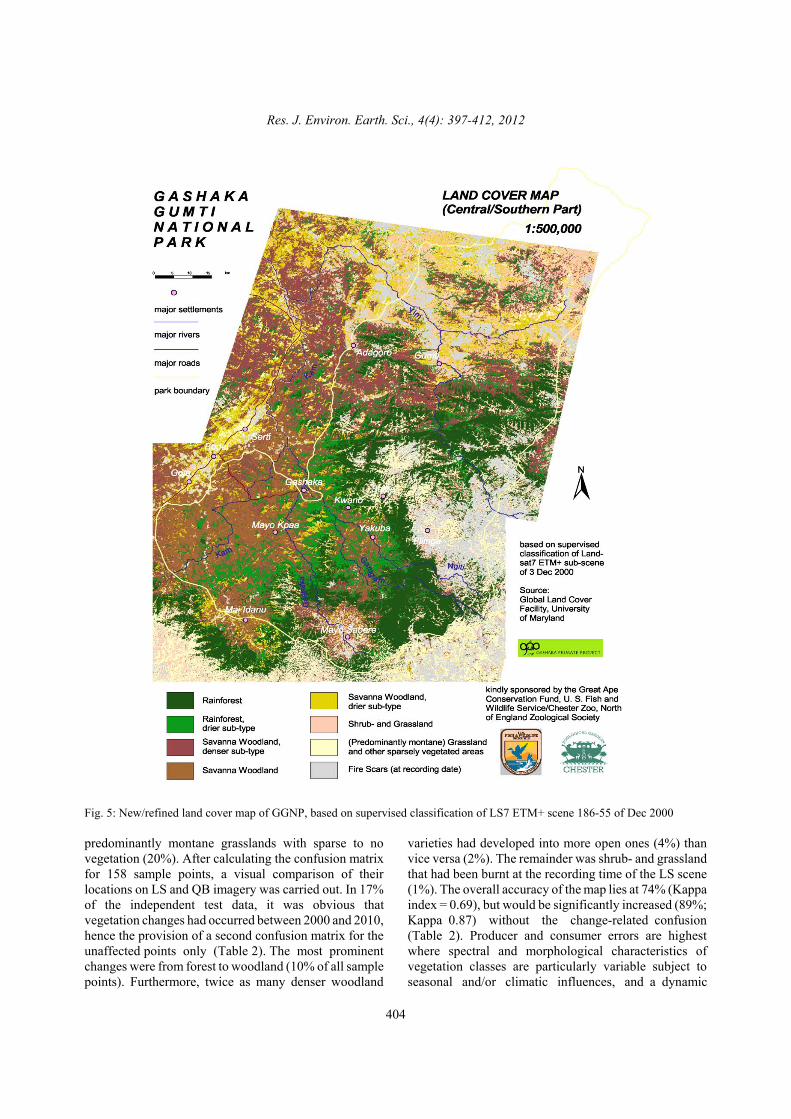
Fig. 5: New/refined land cover map of GGNP, based on supervised classification of LS7 ETM+ scene 186-55 of Dec 2000
predominantly montane grasslands with sparse to no
vegetation (20%). After calculating the confusion matrix
for 158 sample points, a visual comparison of their
locations on LS and QB imagery was carried out. In 17%
of the independent test data, it was obvious that
vegetation changes had occurred between 2000 and 2010,
hence the provision of a second confusion matrix for the
unaffected points only (Table 2). The most prominent
changes were from forest to woodland (10% of all sample
points). Furthermore, twice as many denser woodland
varieties had developed into more open ones (4%) than
vice versa (2%). The remainder was shrub- and grassland
that had been burnt at the recording time of the LS scene
(1%). The overall accuracy of the map lies at 74% (Kappa
index = 0.69), but would be significantly increased (89%;
Kappa 0.87) without the change-related confusion
(Table 2). Producer and consumer errors are highest
where spectral and morphological characteristics of
vegetation classes are particularly variable subject to
seasonal and/or climatic influences, and a dynamic
Res. J. Environ. Earth. Sci., 4(4): 397-412, 2012
405
1 2 3 4 5 6 7
Ls7 bands*
20
40
60
80
100
120
140
160
180
Mea
n p
ixel val
ue
Forest (3 classes)Dense woodland Open woodland Very open wood-and shrub land
Sparse glass land
Mainly bare soil and rocks
Burnt areas (recent)
Burnt areas (very recent)
1 2 3 4 5 6 7
Ls7 bands*
20
40
60
80
100
120
140
160
180
Mea
n p
ixel
valu
e
Dense woodland Open woodland, ‘moist’
Shrub-and grassland
Forest, ‘moist’Forest, ‘dry’
Open woodland, ‘dry’
(Montane) grass land,sparse to no vegetation
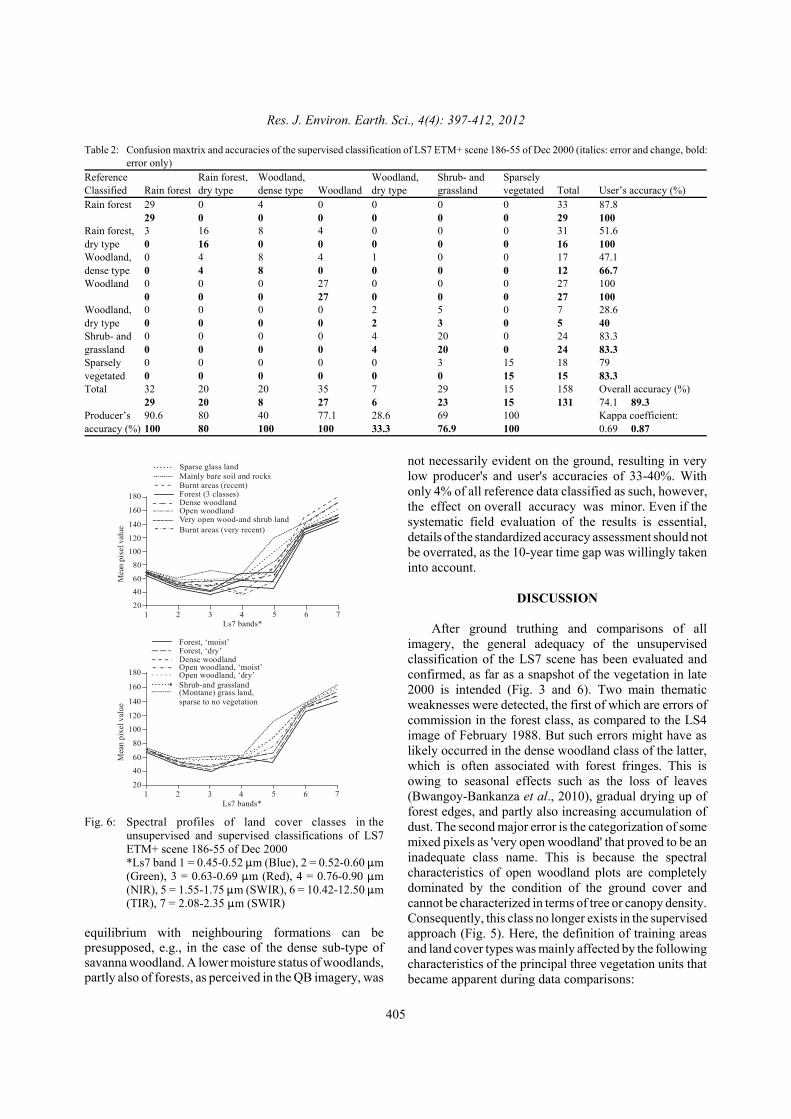
Table 2: Confusion maxtrix and accuracies of the supervised classification of LS7 ETM+ scene 186-55 of Dec 2000 (italics: error and change, bold:
error only)
Reference Rain forest, Woodland, Woodland, Shrub- and Sparsely
Classified Rain forest dry type dense type Woodland dry type grassland vegetated Total User’s accuracy (%)
Rain forest 29 0 4 0 0 0 0 33 87.8
29 0 0 0 0 0 0 29 100
Rain forest, 3 16 8 4 0 0 0 31 51.6
dry type 0 16 0 0 0 0 0 16 100
Woodland, 0 4 8 4 1 0 0 17 47.1
dense type 0 4 8 0 0 0 0 12 66.7
Woodland 0 0 0 27 0 0 0 27 100
0 0 0 27 0 0 0 27 100
Woodland, 0 0 0 0 2 5 0 7 28.6
dry type 0 0 0 0 2 3 0 5 40
Shrub- and 0 0 0 0 4 20 0 24 83.3
grassland 0 0 0 0 4 20 0 24 83.3
Sparsely 0 0 0 0 0 3 15 18 79
vegetated 0 0 0 0 0 0 15 15 83.3
Total 32 20 20 35 7 29 15 158 Overall accuracy (%)
29 20 8 27 6 23 15 131 74.1 89.3
Producer’s 90.6 80 40 77.1 28.6 69 100 Kappa coefficient:
accuracy (%) 100 80 100 100 33.3 76.9 100 0.69 0.87
Fig. 6: Spectral profiles of land cover classes in theunsupervised and supervised classifications of LS7ETM+ scene 186-55 of Dec 2000 *Ls7 band 1 = 0.45-0.52 !m (Blue), 2 = 0.52-0.60 !m(Green), 3 = 0.63-0.69 !m (Red), 4 = 0.76-0.90 !m(NIR), 5 = 1.55-1.75 !m (SWIR), 6 = 10.42-12.50 !m(TIR), 7 = 2.08-2.35 !m (SWIR)
equilibrium with neighbouring formations can bepresupposed, e.g., in the case of the dense sub-type ofsavanna woodland. A lower moisture status of woodlands,partly also of forests, as perceived in the QB imagery, was
not necessarily evident on the ground, resulting in very
low producer's and user's accuracies of 33-40%. With
only 4% of all reference data classified as such, however,
the effect on overall accuracy was minor. Even if the
systematic field evaluation of the results is essential,
details of the standardized accuracy assessment should not
be overrated, as the 10-year time gap was willingly taken
into account.
DISCUSSION
After ground truthing and comparisons of all
imagery, the general adequacy of the unsupervised
classification of the LS7 scene has been evaluated and
confirmed, as far as a snapshot of the vegetation in late
2000 is intended (Fig. 3 and 6). Two main thematic
weaknesses were detected, the first of which are errors of
commission in the forest class, as compared to the LS4
image of February 1988. But such errors might have as
likely occurred in the dense woodland class of the latter,
which is often associated with forest fringes. This is
owing to seasonal effects such as the loss of leaves
(Bwangoy-Bankanza et al., 2010), gradual drying up of
forest edges, and partly also increasing accumulation of
dust. The second major error is the categorization of some
mixed pixels as 'very open woodland' that proved to be an
inadequate class name. This is because the spectral
characteristics of open woodland plots are completely
dominated by the condition of the ground cover and
cannot be characterized in terms of tree or canopy density.
Consequently, this class no longer exists in the supervised
approach (Fig. 5). Here, the definition of training areas
and land cover types was mainly affected by the following
characteristics of the principal three vegetation units that
became apparent during data comparisons:
Res. J. Environ. Earth. Sci., 4(4): 397-412, 2012
406
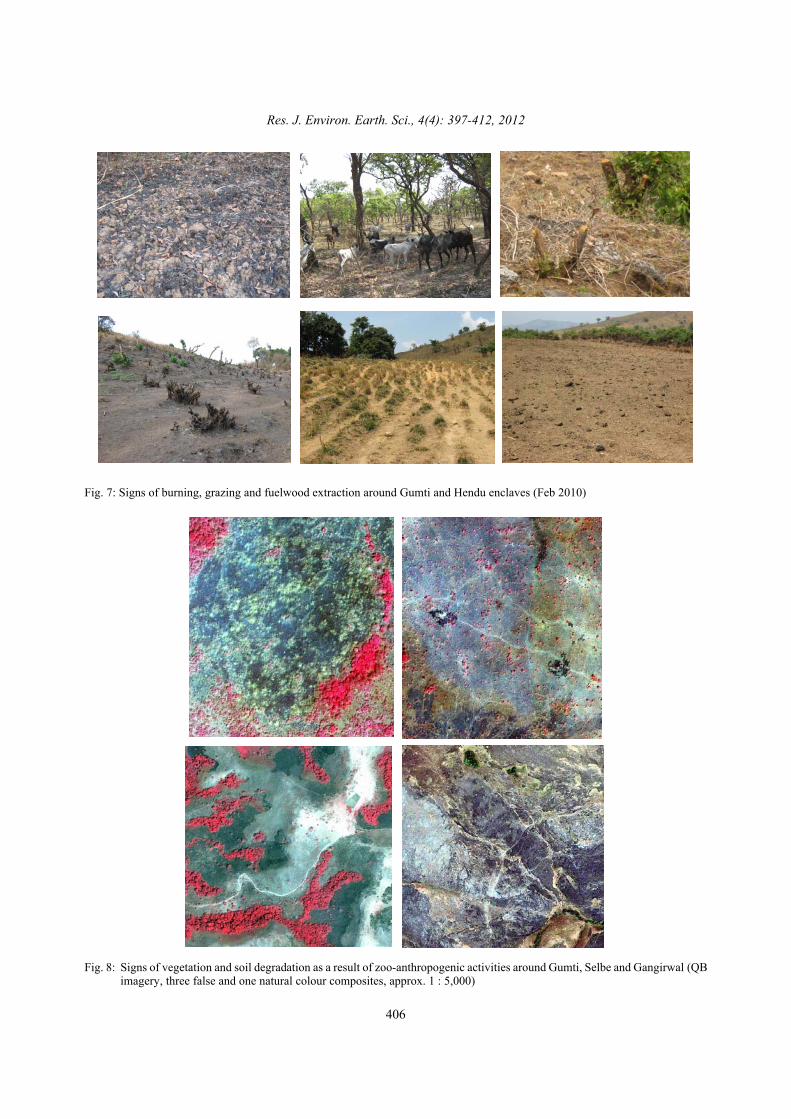
Fig. 7: Signs of burning, grazing and fuelwood extraction around Gumti and Hendu enclaves (Feb 2010)
Fig. 8: Signs of vegetation and soil degradation as a result of zoo-anthropogenic activities around Gumti, Selbe and Gangirwal (QBimagery, three false and one natural colour composites, approx. 1 : 5,000)
Res. J. Environ. Earth. Sci., 4(4): 397-412, 2012
407
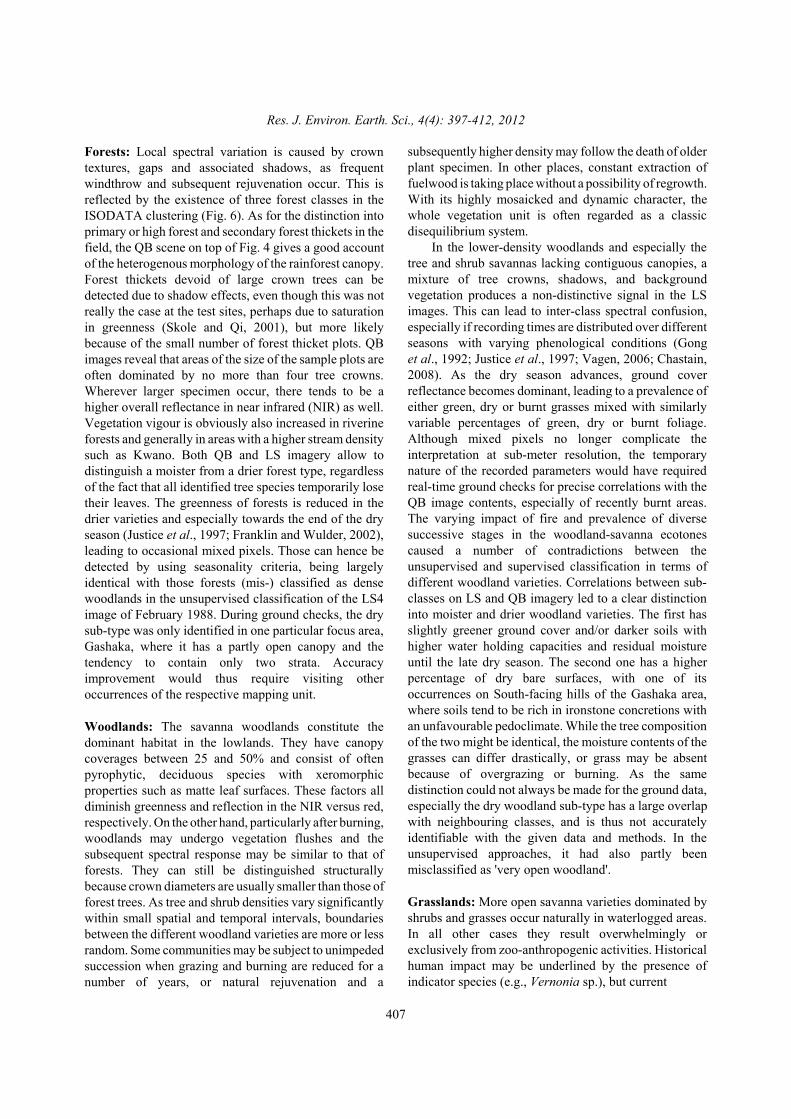
Forests: Local spectral variation is caused by crown
textures, gaps and associated shadows, as frequent
windthrow and subsequent rejuvenation occur. This is
reflected by the existence of three forest classes in the
ISODATA clustering (Fig. 6). As for the distinction into
primary or high forest and secondary forest thickets in the
field, the QB scene on top of Fig. 4 gives a good account
of the heterogenous morphology of the rainforest canopy.
Forest thickets devoid of large crown trees can be
detected due to shadow effects, even though this was not
really the case at the test sites, perhaps due to saturation
in greenness (Skole and Qi, 2001), but more likely
because of the small number of forest thicket plots. QB
images reveal that areas of the size of the sample plots are
often dominated by no more than four tree crowns.
Wherever larger specimen occur, there tends to be a
higher overall reflectance in near infrared (NIR) as well.
Vegetation vigour is obviously also increased in riverine
forests and generally in areas with a higher stream density
such as Kwano. Both QB and LS imagery allow to
distinguish a moister from a drier forest type, regardless
of the fact that all identified tree species temporarily lose
their leaves. The greenness of forests is reduced in the
drier varieties and especially towards the end of the dry
season (Justice et al., 1997; Franklin and Wulder, 2002),
leading to occasional mixed pixels. Those can hence be
detected by using seasonality criteria, being largely
identical with those forests (mis-) classified as dense
woodlands in the unsupervised classification of the LS4
image of February 1988. During ground checks, the dry
sub-type was only identified in one particular focus area,
Gashaka, where it has a partly open canopy and the
tendency to contain only two strata. Accuracy
improvement would thus require visiting other
occurrences of the respective mapping unit.
Woodlands: The savanna woodlands constitute the
dominant habitat in the lowlands. They have canopy
coverages between 25 and 50% and consist of often
pyrophytic, deciduous species with xeromorphic
properties such as matte leaf surfaces. These factors all
diminish greenness and reflection in the NIR versus red,
respectively. On the other hand, particularly after burning,
woodlands may undergo vegetation flushes and the
subsequent spectral response may be similar to that of
forests. They can still be distinguished structurally
because crown diameters are usually smaller than those of
forest trees. As tree and shrub densities vary significantly
within small spatial and temporal intervals, boundaries
between the different woodland varieties are more or less
random. Some communities may be subject to unimpeded
succession when grazing and burning are reduced for a
number of years, or natural rejuvenation and a
subsequently higher density may follow the death of older
plant specimen. In other places, constant extraction of
fuelwood is taking place without a possibility of regrowth.
With its highly mosaicked and dynamic character, the
whole vegetation unit is often regarded as a classic
disequilibrium system.
In the lower-density woodlands and especially the
tree and shrub savannas lacking contiguous canopies, a
mixture of tree crowns, shadows, and background
vegetation produces a non-distinctive signal in the LS
images. This can lead to inter-class spectral confusion,
especially if recording times are distributed over different
seasons with varying phenological conditions (Gong
et al., 1992; Justice et al., 1997; Vagen, 2006; Chastain,
2008). As the dry season advances, ground cover
reflectance becomes dominant, leading to a prevalence of
either green, dry or burnt grasses mixed with similarly
variable percentages of green, dry or burnt foliage.
Although mixed pixels no longer complicate the
interpretation at sub-meter resolution, the temporary
nature of the recorded parameters would have required
real-time ground checks for precise correlations with the
QB image contents, especially of recently burnt areas.
The varying impact of fire and prevalence of diverse
successive stages in the woodland-savanna ecotones
caused a number of contradictions between the
unsupervised and supervised classification in terms of
different woodland varieties. Correlations between sub-
classes on LS and QB imagery led to a clear distinction
into moister and drier woodland varieties. The first has
slightly greener ground cover and/or darker soils with
higher water holding capacities and residual moisture
until the late dry season. The second one has a higher
percentage of dry bare surfaces, with one of its
occurrences on South-facing hills of the Gashaka area,
where soils tend to be rich in ironstone concretions with
an unfavourable pedoclimate. While the tree composition
of the two might be identical, the moisture contents of the
grasses can differ drastically, or grass may be absent
because of overgrazing or burning. As the same
distinction could not always be made for the ground data,
especially the dry woodland sub-type has a large overlap
with neighbouring classes, and is thus not accurately
identifiable with the given data and methods. In the
unsupervised approaches, it had also partly been
misclassified as 'very open woodland'.
Grasslands: More open savanna varieties dominated by
shrubs and grasses occur naturally in waterlogged areas.
In all other cases they result overwhelmingly or
exclusively from zoo-anthropogenic activities. Historical
human impact may be underlined by the presence of
indicator species (e.g., Vernonia sp.), but current
Res. J. Environ. Earth. Sci., 4(4): 397-412, 2012
408
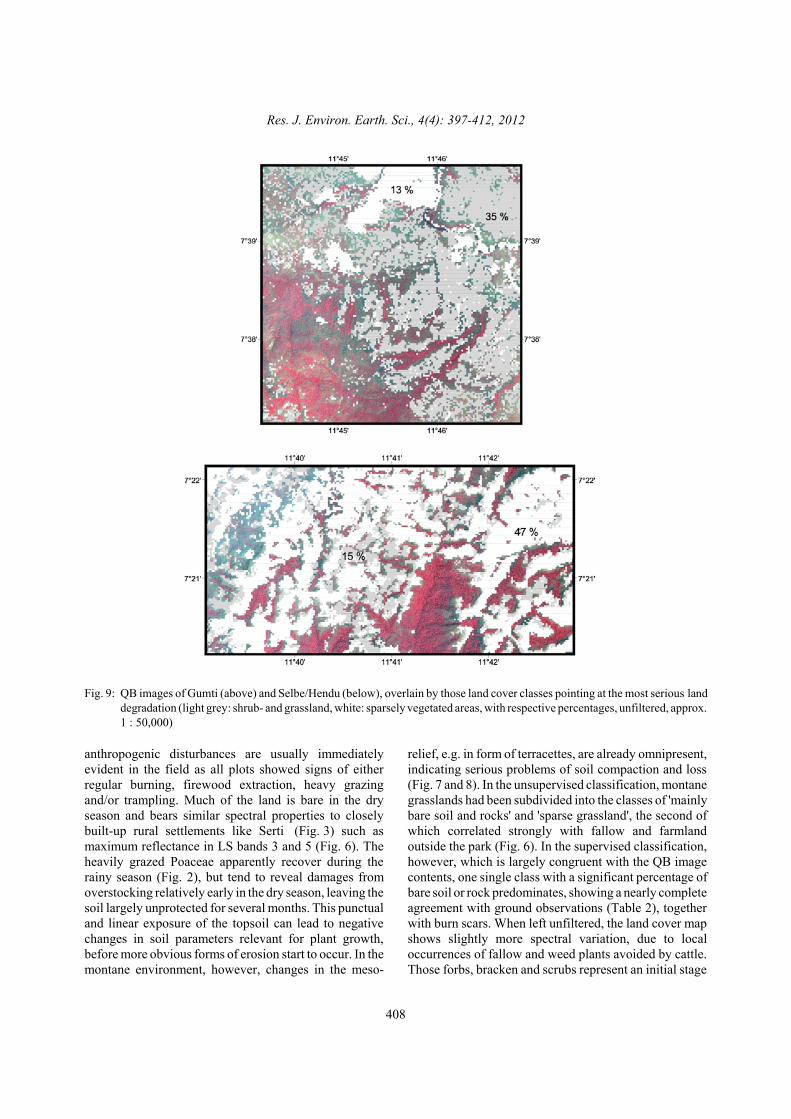
Fig. 9: QB images of Gumti (above) and Selbe/Hendu (below), overlain by those land cover classes pointing at the most serious land
degradation (light grey: shrub- and grassland, white: sparsely vegetated areas, with respective percentages, unfiltered, approx.
1 : 50,000)
anthropogenic disturbances are usually immediately
evident in the field as all plots showed signs of either
regular burning, firewood extraction, heavy grazing
and/or trampling. Much of the land is bare in the dry
season and bears similar spectral properties to closely
built-up rural settlements like Serti (Fig. 3) such as
maximum reflectance in LS bands 3 and 5 (Fig. 6). The
heavily grazed Poaceae apparently recover during the
rainy season (Fig. 2), but tend to reveal damages from
overstocking relatively early in the dry season, leaving the
soil largely unprotected for several months. This punctual
and linear exposure of the topsoil can lead to negative
changes in soil parameters relevant for plant growth,
before more obvious forms of erosion start to occur. In the
montane environment, however, changes in the meso-
relief, e.g. in form of terracettes, are already omnipresent,
indicating serious problems of soil compaction and loss
(Fig. 7 and 8). In the unsupervised classification, montane
grasslands had been subdivided into the classes of 'mainly
bare soil and rocks' and 'sparse grassland', the second of
which correlated strongly with fallow and farmland
outside the park (Fig. 6). In the supervised classification,
however, which is largely congruent with the QB image
contents, one single class with a significant percentage of
bare soil or rock predominates, showing a nearly complete
agreement with ground observations (Table 2), together
with burn scars. When left unfiltered, the land cover map
shows slightly more spectral variation, due to local
occurrences of fallow and weed plants avoided by cattle.
Those forbs, bracken and scrubs represent an initial stage
Res. J. Environ. Earth. Sci., 4(4): 397-412, 2012
409
of bush encroachment. Still looking comparatively fresh
at the end of the dry season, they were largely confused
with woodlands in the unsupervised classification.
Both early and late burning occur in almost all the
present ecosystems. Rangers are urged by the park
authorities to practice preventive or prescribed burning.
Nevertheless, satellite images and field evidence reveal an
omnipresence of illegal fires, mostly set to stimulate grass
growth for livestock. When the LS7 scene was recorded
at the beginning of the dry season in 2000, around 10% of
the entire park area had been recently burnt, with strong
emphasis on grasslands. The LS4 scene, recorded in the
late dry season of 1988, shows evidence of late burning.
Practiced in grassland and woodland alike, this affects
smaller and more diffusely distributed patches of land,
which, however, combine to a similarly large total area.
Direct observations confirm that the local people burn
vegetation for apparently no reason, as rainforest is also
set on fire when passing through. Burning is the major
factor that maintains woodlands within the forest-savanna
mosaic, preventing recolonization at forest edges (Louppe
et al., 1995; Bucini and Lambin, 2002). Hot blazes are an
additional threat wherever grazing pressure is low and
thick, high grasses catch fire. Burning may also have
introduced some minor errors in all image classifications
wherever it has promoted fresh green growth. For further
analysis of burning habits and their effects on land cover,
satellite imagery should be analysed over several burning
cycles (Roy, 2003). The favourable repetition rates of
around 3 days would make NigeriaSat1 a suitable sensor
for that purpose.
While the woodland communities are largely subject
to quasi natural, subclimactic dynamics, the general
results also point at progressive trends between 2000 and
2010. Compared to the current QB imagery, there is more
spectral variation in the original LS7 scene, which can
only partially be explained with the wider range of
wavelengths available. Habitat diversity also appears to
be higher in ISODATA clustering, while in the maximum
likelihood approach, there is a tendency towards the
establishment of a more uniform ecotype, especially in the
highlands. There, seemingly intact grass cover identified
in the rainy season gives way to multiple signs of
temporary and lasting damage, including soil loss, under
the increased grazing pressure of the dry season (Fig. 7
and 8). In steep locations inaccessible to cattle, dense
(sub-) montane rainforest prevails as the assumed climatic
and altitudinal climax. Nevertheless, woody vegetation in
general has been reduced, particularly in the vicinity of
enclaves, while regeneration of forest thickets is restricted
to a few spots. Even in the surroundings of Kwano, dense
rainforests alternate with sparsely forested watersheds,
where vegetation is prone to wind-driven fires. Although
park authorities evicted settlers years or even decades ago,
the vegetation cover remains in a state of arrested
development. Without pedological or geomorphological
surveys, one can merely speculate about the reversibility
of the damages to the vegetation cover that also includes
the loss of native montane species (Chapman et al., 2004).
Figure 9 merges the multi-scale, multi-temporal data to
visualize and quantify the described phenomena. It reveals
that nowadays 48% of the Gumti environment and 63% of
the Hendu uplands are covered by sparsely vegetated
shrub- and grasslands and predominantly bare throughout
the dry season. The general development has been
confirmed in a visual comparison with the 2010 LS7
scene in SLC-off mode.
Apart from local human impact, there are of course
other possible drivers for vegetation changes such as
interannual climatic variations or shifts in the carbon
budget. Mitchard et al. (2009) are describing forest
encroachment as a function of increasing CO2
concentrations in the atmosphere. A certain variability of
rainfall is common in the area and may have influenced
greenness in the various images via differences in the
duration of each rainy season. But the available figures
are not hinting at weather anomalies in any of the years of
recording. And as the observed vegetation changes are
especially drastic in the surroundings of enclaves, the
majority of them is not likely to be climatically induced.
For an exact picture of the specific nature and spatial
diversity of the potential trend, it is highly advisable to
carry out a semi-automatic change detection and/or multi-
temporal image classification as soon as new LS material
will be available.
CONCLUSION
Landsat has once again been confirmed as an
invaluable tool for environmental studies on a variety of
scales (Cohen and Goward, 2004). Its potency and
versatility is especially related to the positioning of its
spectral bands that offer more room for differentiation
than the common Green-Red-Infrared combination of
SPOT, NigeriaSat1 and others. On a practical level,
depicted phenomena can be easily demonstrated to
individuals inexperienced in image analysis, such as
national park staff, which is an advantage it has over
radar. Thus, Landsat is rightly seen as well-suited even for
vegetation diversity assessment and particularly in
comparison with high-resolution devices such as
IKONOS or Quickbird. These can assist either as a means
of cover type validation like in the given case, or through
additional data fusion or object-based classifications
(Goward et al., 2003; Sawaya, 2003; Corcoran and
Winstanley, 2008; Xie et al., 2008; Gibbes et al., 2010;
Nagendra et al., 2010). Comparatively high costs of
hyperspatial imagery can be moderated by focussing
Res. J. Environ. Earth. Sci., 4(4): 397-412, 2012
410
large-scale monitoring of habitat degradation on limited
spaces such as the enclave environments. There, but also
in the other areas of special interest covered so far,
sensors like QB can provide excellent baseline data for
botanical and pedological field studies, inter al. Signs of
land degradation, such as those visible in Fig. 7 and 8, can
be detected even by casual image interpretation and
afterwards be specifically targeted by field research.
The severe levels of human impact in GGNP havebeen known before and after its inception as a protectedarea, but opportunities to georeference and quantify thethreats and damages have been lacking. The recentresearch had also been designed to familiarize the park'srangers and management staff to various techniques ofenvironmental monitoring, from the use of GPS via visualinterpretations of satellite images to encoding ofwaypoints and digitizing of features, production of mapsand management of geodatabases. Immediate steps forimproved protection would include the collection of moreGPS and field data in relation to the park’s enclaves andtheir integration into the park-GIS. Other endangeredhabitats with high densities of illegal cattle are found inthe Northernmost tip of the park covered by twoadditional LS scenes and still remain to be analyzed. It isthus hoped that further studies on the status quo of thepark's ecosystems can be carried out and that monitoringof areas with critical human impact will continue,eventually triggering more consolidated research andinformed protection measures.
ACKNOWLEDGMENT
Seed funding was provided by the Nigeria
Biodiversity Programme of Chester Zoo/North of England
Zoological Society. The main study was supported by
USFWS (US Fish and Wildlife Service) through its Great
Ape Conservation Fund (Award No. 96200-9-G063).
Nigeria’s National Park Service granted permits. Logistic
assistance within GGNP was provided through the
Conservator of Park (Dr. Agboola Okeyoyin), the
Research Unit (Pepeh Kamaya), Information Unit (Jonah
Moses) and the Filinga Range Officer (Danjuma Magaji).
Other participants in the field included GGNP officers
(Hussaini Bako, Felix Kayode), as well as affiliates of the
Gashaka Primat Project (Umaru Buba, George Nodza)
and the University of Maiduguri (Dr. Jacob K.
Nyanganji).
REFERENCES
Achard, F. and F. Blasco, 1990. Analysis of vegetation
seasonal evolution and mapping of forest cover in
west Africa with the use of NOAA AVHRR HRPT
data. Photogramm. Eng. Remote Sens., 56(10):
1359-365.
Adanu, J., A. Fowler and V. Sommer, 2011. Hunters,
Fire, Cattle. Conservation Challenges in Eastern
Nigeria, with Special Reference to Chimpanzees. In:
Sommer, V. and C. Ross, (Eds.), Primates of
Gashaka. Socioecology and Conservation in Nigeria's
Biodiversity Hotspot. Springer, New York, pp:
55-100.
Anyamba, A. and C. Tucker, 2005. Analysis of Sahelian
vegetation dynamics using NOAA-AVHRR NDVI
data from 1981-2003. J. Arid. Environ., 63(3):
596-614.
Aplin, P., 2004. Remote sensing as a means of ecological
investigation. Proceedings of the 20th Congress of the
International Society for Photogrammetry and
Remote Sensing ‘Geoimagery Bridging Continents’,
July 12-23, Istanbul, pp: 325-332.
Ati, O.F., A. Danjuma and S.O. Mohammed, 2008. The
application of geoinformatics in assessing landuse
changes in Kaduna South, Kaduna, Nigeria. Zaria
Geographer, 17(1): 44-55.
Bawden, M.G. and P. Tuley, 1966. The Land Resources
of Southern Sardauna and Southern Adamawa
Provinces, Northern Nigeria. Land Resource Study
No. 2., Land Resources Division, Directorate of
Overseas Surveys, Tolworth.
Bennett, D. and C. Ross, 2011. Fulani of the Highlands.
Costs and Benefits of Living in National Park
Enclaves. In: Sommer, V. and C. Ross, (Eds.),
Primates of Gashaka. Socioecology and Conservation
in Nigeria's Biodiversity Hotspot. Springer, New
York, pp: 231-266.
Bucini, G. and E.F. Lambin, 2002. Fire impacts on
vegetation in central Africa: A remote-based statical
analysis. Appl. Geogr., 22(1): 27-48.
Bwangoy-Bankanza, J.R., M.C. Hansen, D.P. Roy, G. De
Grandi and C.O. Justice, 2010. Wetland mapping in
the Congo Basin using optical and radar remotely
sensed data and derived topographical indices.
Remote Sens. Environ., 114(1): 73-86.
Chapman, H., S. Olson, L. Sessions and D. Trumm, 2004.
An assessment of changes in the montane forests of
Taraba State, Nigeria, over the past 30 years. Oryx,
38(3): 1-9.
Chastain, R.A., 2008. Isolating and characterizing
woodland and savanna communities on Fort Lewis,
Washington, USA. Proceedings of the Annual
Conference of the American Society of
Photogrammetry and Remote Sensing. April 28-May,
Portland, 2: 12.
Cohen, W.B. and S.N. Goward, 2004. Landsat's role in
ecological applications of remote sensing.
Bioscience, 54(6): 535-545.
Res. J. Environ. Earth. Sci., 4(4): 397-412, 2012
411
Corcoran, P. and A.C. Winstanley, 2008. Using Texture
to Tackle the Problem of Scale in Landcover
Classification. In: Blaschke, T., S. Lang and G. Hay,
(Eds.), Object-Based Image Analysis-Spatial
Concepts for Knowledge-driven Remote Sensing
Applications. Springer, Berlin, pp: 113-132.
Dunn, A., 1998. A Management Plan for Developing the
Park and its Support Zone. Unpublished report to the
Nigerian Conservation Foundation/WWF-UK.
Dunn, A., 1999. Gashaka Gumti National Park: A
Guidebook. Gashaka Gumti National Park, Nigerian
Conservation Foundation/WWF-UK, Lagos.
Franklin, S.E. and M.A. Wulder, 2002. Remote sensing
methods in medium spatial resolution satellite data
land cover classification of large areas. Progr. Phys.
Geogr., 26(2): 173-205.
Gibbes, C., S. Adhikari, L. Rostant, J. Southworth and
Y. Qiu, 2010. Application of object based
classification and high resolution satellite imagery for
savanna ecosystem analysis. Remote Sens., 2(12):
2748-2772.
Gong, P., D.J. Marceau and P.J. Howarth, 1992. A
comparison of spatial feature extraction algorithms
for land-use classification with SPOT HRV data.
Remote Sens. Environ., 40: 137-151.
Goward, S.N., P.E. Davis, D. Fleming, L. Miller and
J.R. Townshend, 2003. Empirical comparison of
Landsat 7 and IKONOS multispectral measurements
for selected Earth Observation system (EOS)
validation sites. Remote Sens. Environ., 88(1-2):
80-99.
Gumnior, M., 2009. An initial approach towards
satellite-based vegetation mapping and monitoring of
Gashaka Gumti National Park (NE Nigeria). Gombe
State Univ. Monogr. Ser., 1: 60.
Idoko, M.A. and F.E. Bisong, 2010. Application of
geoinformation for evaluation of land use change: A
case study of Federal Capital Territory-Abuja. Env.
Res. J., 4(1): 140-144.
Justice, C.O., 1997. The Use of Time-series Satellite Data
for Characterization and Monitoring of the Seasonal
Forests and Savannas of Central Africa. BSP Ref.
#28. Retrieved from: http://www.bsponline.org/
publications/ show.html.
Keay, R.W.J., 1959. An Outline of Nigerian Vegetation.
3rd Edn., Government Printer, Lagos.
Kerr, J.T. and M. Ostrovsky, 2003. From space to
species: Ecological applications for remote sensing.
Trends Ecol. Evol., 18(6): 299-305.
Laporte, N., C. Justice and J. Kendall, 1995. Mapping the
dense humid forest of Cameroon and Zaire using
AVHRR satellite data. Int. J. Remote Sens., 16(6):
1127-1145.
Laporte, N., S.J. Goetz, C.O. Justice and M. Heinicke,
1998. A new land cover map of central Africa
derived from multi-resolution, multi-temporal
AVHRR Data. Int. J. Remote Sens., 19 (18):
3537-3550.
Louppe, D., N. Oattara and A. Coulibaly, 1995. The
effects of brush fires on vegetation: The Aubréville
fire plots after 60 years. Commonwealth For. Rev.,
74(4): 288-292.
Mayaux, P., T. Richards and E. Janodet, 1999. A
vegetation map of Central Africa derived from
satellite imagery. J. Biogeogr., 26(2): 353-366.
Mayaux, P., G. De Grandi and J.P. Malingreau, 2000.
Central African forest cover revisited: A
multisatellite analysis. Remote Sens. Environ., 71(2):
183-196.
Mitchard, E. T.A., S.S. Saatchi, F.F. Gerard, S.L. Lewis
and P. Meir, 2009. Measuring woody encroachment
along a forest-savanna boundary in Central Africa.
Earth Interact., 13(8): 1-29.
Moat, J., C. Crouch, W. Milliken, P. Smith, M. Hamilton,
S. Baena, S. Bachman and M. Rivers, 2008. Rapid
forest inventory and mapping/Monitoring forest
cover and land use change. Kew-Eliasch Review,
Report to the Office of Climate Change. Retrieved
from: www.ibcperu.org/doc/isis/11464.pdf,
(Accessed on: June 30, 2011).
Morgan, B., A. Adeleke, T. Bassey, R. Bergl, A. Dunn,
E. Gadsby, K. Gonder, E. Greengrass, D. Koutou
Koulagna, G. Mbah, A. Nicholas, J. Oates, F. Omeni,
Y. Saidu, V. Sommer, J. Sunderland-Groves,
J. Tiebou and L. Williamson, 2011. Regional Action
Plan for the Conservation of the Nigeria-Cameroon
Chimpanzee (Pan troglodytes ellioti). IUCN/ SSC
Primate Specialist Group and Zoological Society of
San Diego, CA, USA.
Nagendra, H., D. Rocchini, R. Ghate, B. Sharma and
S. Pareeth, 2010. Assessing plant diversity in a dry
tropical forest: Comparing the utility of Landsat and
Ikonos Satellite Images. Remote Sens., 2(2):
478-498.
Ngamabou, R.S., 2006. Evaluating the efficacy of remote
sensing techniques in monitoring forest cover and
forest cover change in the Mount Cameroon Region,
Ph.D. Thesis, University of Freiburg, Germany,
www.freidok.uni-freiburg.de/volltexte/.../01_
DISSERTATION_RSIWE.pdf, (Accessed on: June
30, 2011).
Oates, J.F., R.A. Bergl and J.M. Linder, 2004. Africa’s
Gulf of Guinea Forests: Biodiversity Patterns and
Conservation Priorities. Advances in Applied
Biodiversity Science 6. Conservation Intl.,
Washington, DC.
Res. J. Environ. Earth. Sci., 4(4): 397-412, 2012
412
Oates, J.F., C. Groves and P.D. Jenkins, 2008. The type
locality of Pan troglodytes vellerosus (Gray, 1862),
and implications for the nomenclature of West
African chimpanzees. Primates, 50(1): 78-80.
Perea, A.J., J.E. Meroño and M.J. Aguilera, 2009.
Algorithms of expert classification applied in
Quickbird satellite imges for land use mapping.
Chilean J. Agric. Res., 69(3): 400-405.
Purvis, A., 2005. Phylogeny and Conservation.
Cambridge University Press, Cambridge.
Roy, P.S., 2003. Forest Fire and Degradation Assessment
Using Satellite Remote Sensing and Geographic
Information System. In: Sivakumar, M.V.K., P.S.
Roy, K. Harmsen and S.K. Saha, (Eds.), Satellite
Remote Sensing and GIS Applications in
Agricultural Meteorology. Proceedings of a Training
Workshop held at Dehra Dun/India, July 7-11, pp:
361-400.
Saatchi, S., M. Shimard, E. Njoku, G. De Grandi,
C. Justice, N. Laporte and M. Massart, 1999. Study
of land-use and deforestation in Central African
tropical forest using high resolution SAR satellite
imagery. JERS-1 Science Program '99 PI Reports,
Global Forest Monitoring and SAR Interferometry,
NASDA/Japan, pp: 133-138.
Salami, A.T., 2000. Vegetation mapping of a part of dry
tropical rainforest of Southern Nigeria from Landsat
TM. Int. Arch. Photogramm. Remote Sens., 33(B7):
1301-1308.
Salami, A.T. and E.E. Balogun, 2006. Utilization of
Nigeria Sat-1 and Other Satellites for Forest and
Biodiversity Monitoring in Nigeria. National Space
Research and Development Agency, Federal Ministry
of Science and Technology, Abuja.
Sawaya, K., 2003. Extending satellite remote sensing tolocal scales: land and water resource monitoringusing high-resolution imagery. Remote Sens.Environ., 88 (1-2): 144-156.
Skole, D.L. and J. Qi, 2001. Optical Remote Sensing forMonitoring Forest and Biomass Change in theContext of the Kyoto Protocol. Michigan StateUniversity, East Lansing, MI. CGCEO/RA01-01/w.
Sommer, V. and C. Ross, 2011a. Primates of Gashaka.Socioecology and Conservation in Nigeria'sBiodiversity Hotspot. Developments in Primatology:Progress and Prospects 35. Springer, New York.
Sommer, V. and C. Ross, 2011b. Exploring andProtecting West Africa's Primates. The GashakaPrimate Project in Context. In: Sommer, V. and C.Ross (Eds.), Primates of Gashaka. Socioecology andConservation in Nigeria's Biodiversity Hotspot.Springer, New York, pp: 1-37.
Udo, K.R., 1970. Geographical Regions of Nigeria.Heinemann, London.
Vagen, T.G., 2006. Remote sensing of complex land usechange trajectories-a case study from the highlandsof Madagascar. Agric. Ecosys. Environ., 115(1-4):219-228.
Wulder, M.A., R.J. Hall, N.C. Coops and S.E. Franklin,
2004. High spatial resolution remotely sensed data
for ecosystem characterization. Bioscience, 54(6):
511-521.
Xie, Y., Z. Sha and M. Yu, 2008. Remote sensing
imagery in vegetation mapping: A review. J. Plant
Ecol., 1(1): 9-23.
Yu, Q., P. Gong, N. Clinton, G. Biging, M. Kelly and
D. Shirokauer, 2006. Object-based detailed
vegetation classification with airborne high spatial
resolution remote sensing imagery. Photogramm.
Eng. Remote Sens., 72(7): 799-811.