Embed Size (px)
Citation preview

www.mulesoft.com
MuleSoft Connectivity Benchmark Report 2018
Contents
Introduction
Digital transformation: no longer a case of ‘if’ but ‘when’
Getting digital transformation right - and what’s going wrong?
The IT delivery gap continues to widen
Why point-to-point integration must die (even if it is sometimes necessary)
Overcoming an inefficient IT model
The API imperative
Vertical market insight
IT trends for 2018
Conclusion
01.
02.
03.
04.
05.
06.
07.
08.
09.
10.
Page 3
The forces of digital disruption continue to impact organizations of every size and in
every industry, as consumers, employees, and partners expect everything to be
on demand and fully connected. To flourish in the digital economy, organizations
need to become more agile; they must develop and release new products and
services quickly, as soon as the market demands them. To put it bluntly, those
organizations that fail to digitally transform will start to lose revenue, and fast.
Unsurprisingly, at a business level, there is now growing impatience to make digital
transformation a reality. As Ross Mason, MuleSoft's founder, points out, "With major
disruptions happening in multiple industries, no company is too big to have the rug
pulled from under it. It is no longer about the big eating the small; it is now about the
fast eating the slow."1 This, in turn, puts a huge amount of pressure on CIOs and IT
decision makers (ITDMs) to meet business expectations, especially when revenue is at
stake.
In order to make sure that they remain competitive, companies are working on a
number of digital transformation initiatives like improving how efficiently their IT
operation works, transforming their customers’ experiences and interactions, and
increasing their overall business efficiency.
But for many organizations, there are still huge barriers to digital transformation
like integration, lack of resources, and misalignment between IT and the rest of the
business. This report, which benchmarks how IT decision makers are handling digital
transformation, IT operations, and change management, takes an in-depth look at
where organizations are on their digital journey and uncovers the challenges they
face when integrating new and existing technologies.
1 Mason, Ross. First, Break IT. 2016, p. 3
Introduction

Page 4
Digital transformation: no longer a case of ‘if’ but ‘when’
ITDMs were very clear on what business goals they wanted to achieve with digital
transformation. They cited increasing IT’s operational efficiency (83%), improving
customer experience (71%), and increasing business efficiency (70%), as their top
three goals for digital transformation. Given the tight budgets for IT and the
increasing number of projects that IT decision makers are tasked with, it’s not
surprising that operational efficiency is the top initiative they want to achieve with
digital transformation.
Yes
Not yet, but in the next year
Not yet but in the next 2 yearsNot yet but in the next 3 years
Not yet but in the next 4 years
Not yet but in the next 5 years
No
74%
16%
5%
2%
0%
0%
3%
0% 20% 40% 60% 80%
When it comes to digital transformation it is no longer a case of ‘if’ but ‘when’, and over
the last 12 months, organizations have moved beyond planning to execution.
Nearly three quarters (74%) of IT decision makers are currently carrying out digital
transformation initiatives, with a further 23% planning to over the next three years.
Is your company currently undertaking digital transformation initiatives?

Page 5
What are the goals you would most like to achieve with your digital transformation initiatives in your organization?
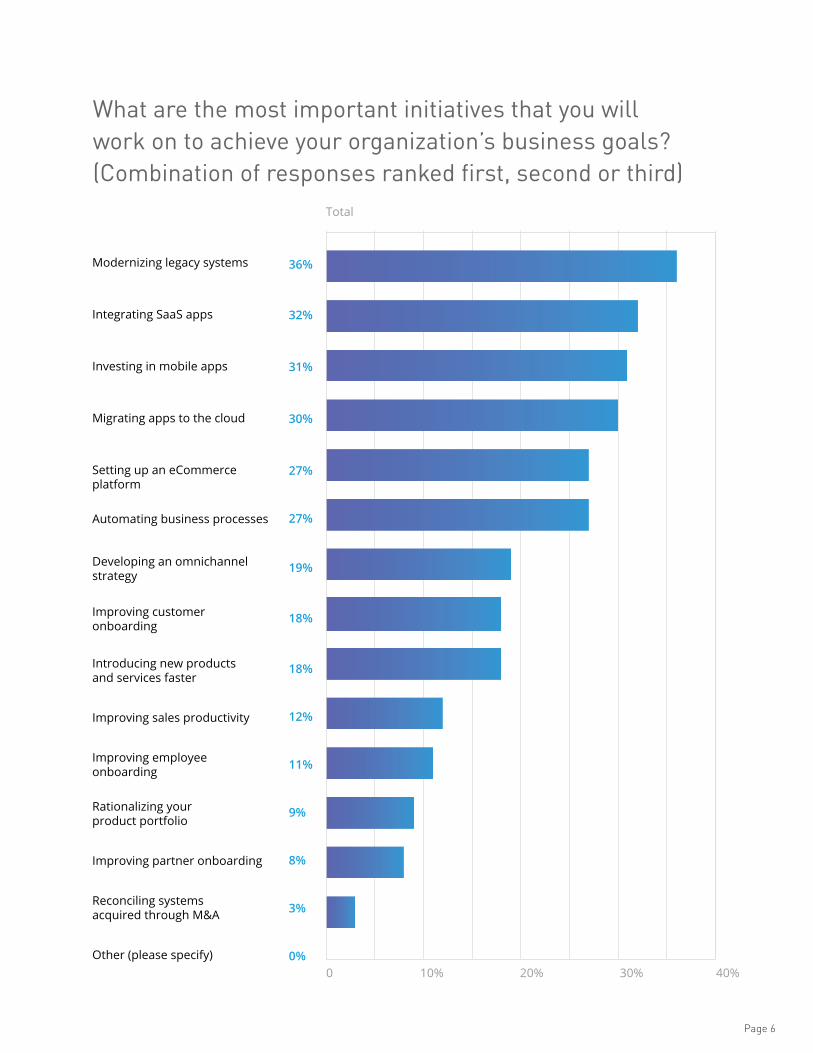
In order to achieve these goals, ITDMs identified a number of specific initiatives they
wanted to achieve. Top amongst them were modernizing legacy systems, integrating
SaaS apps, and investing in mobile applications, which is not at all surprising given
the popular goals of increasing efficiency and improving customer experience.
Increase IT’s operational efficiency
Improve customer experience
Increase business efficiency
Introduce new products and services faster
Improve employee experience
Improve partner experience
Other (please specify)
83%
71%
70%
58%
51%
27%
0%
0% 100%
Page 6
What are the most important initiatives that you will work on to achieve your organization’s business goals? (Combination of responses ranked first, second or third)
Modernizing legacy systems
Integrating SaaS apps
Investing in mobile apps
Migrating apps to the cloud
Setting up an eCommerce platform
Automating business processes
Developing an omnichannel strategy
Improving customer onboarding
Introducing new products and services faster
Improving sales productivity
Improving employee onboarding
Rationalizing your product portfolio
Improving partner onboarding
Reconciling systems acquired through M&A
Other (please specify)
Total
36%
32%
31%
30%
27%
27%
19%
18%
18%
12%
11%
9%
8%
3%
0%0 40%10% 20% 30%

Page 7
Carrying out these digital transformation initiatives isn’t easy for organizations because
they face a number of cultural and technological barriers. Business and IT misalignment
(43%), legacy infrastructure and systems (42%), and resources/budget allocation (38%)
were cited as the top three barriers to digital transformation. A further third said that
integrating siloed apps and data is an additional obstacle.
These results highlight that organizations are not only facing these challenges but in
most cases failing to overcome them. But for how much longer can this continue?
Which of the following are the three biggest challenges to digital transformation within your organization?
Getting digital transformation right - and what’s going wrong?
Time constraints
Business and IT misalignment
Legacy infrastructure and systems
Integrating siloed apps and data
Lack of skill sets and experience within existing IT team
Risk management, compliance and/or legal implications
Company culture and mindset
Hiring and retaining the IT team
Other (please specify)
43%
42%
38%
35%
33%
33%
31%
25%
0%
0 50%10% 20% 30% 40%
0% 5% 10% 15% 20% 25% 30% 35%
Page 8
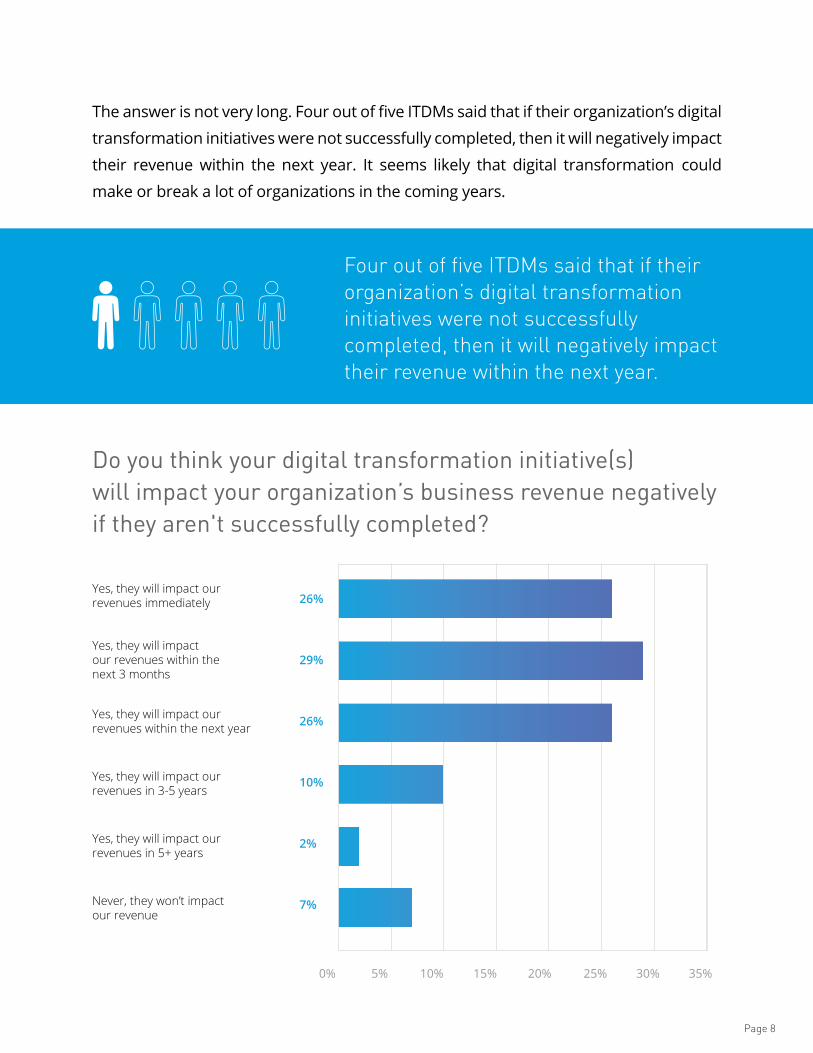
Four out of five ITDMs said that if their organization’s digital transformation initiatives were not successfully completed, then it will negatively impact their revenue within the next year.
The answer is not very long. Four out of five ITDMs said that if their organization’s digital
transformation initiatives were not successfully completed, then it will negatively impact
their revenue within the next year. It seems likely that digital transformation could
make or break a lot of organizations in the coming years.
Do you think your digital transformation initiative(s) will impact your organization’s business revenue negatively if they aren't successfully completed?
Yes, they will impact our revenues immediately
Yes, they will impact our revenues within the next 3 months
Yes, they will impact our revenues within the next year
Yes, they will impact our revenues in 3-5 years
Yes, they will impact our revenues in 5+ years
Never, they won’t impact our revenue
26%
29%
26%
10%
2%
7%

Page 9
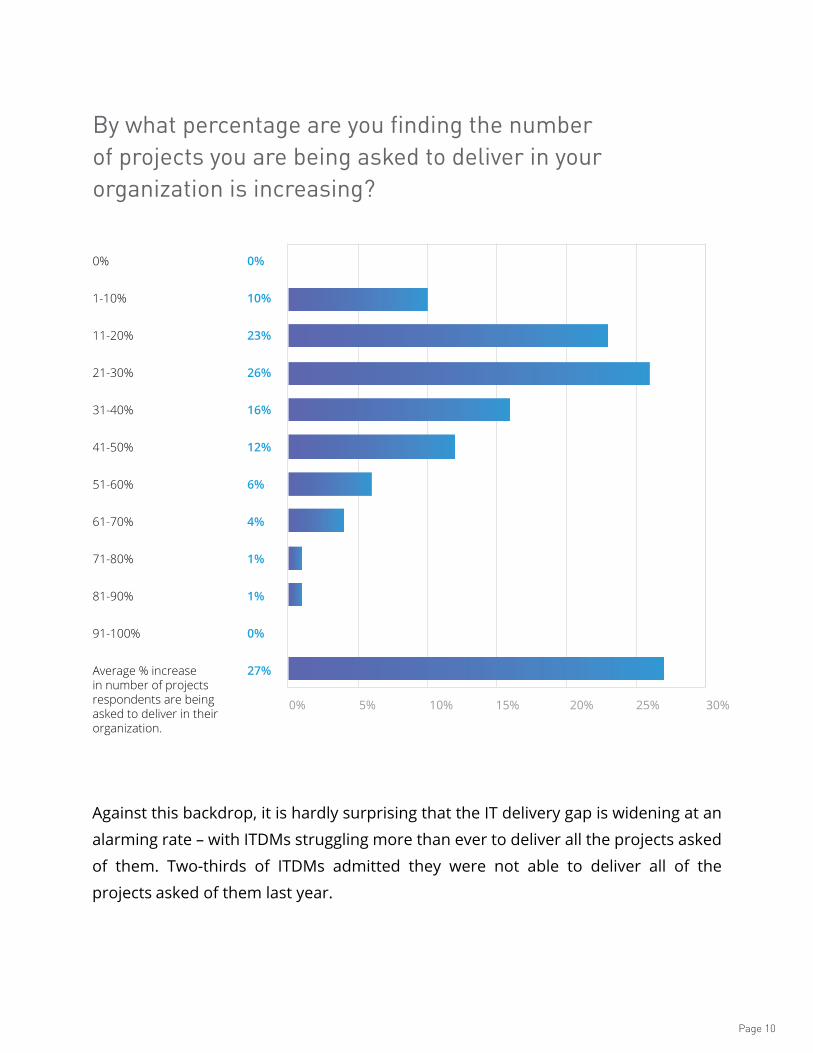
Yet nearly all of the surveyed ITDMs said the number of projects they are being
asked to deliver in their organization is increasing; on average, they reported a 27%
increase in projects since last year.
The IT delivery gap continues to widen
This pressure to transform comes at a time when IT budgets have remained relatively
static, but IT is simultaneously being asked to deliver more projects to the business than
ever before. Never has the term “do more with less” been so prophetic for ITDMs.
The Connectivity Benchmark Report 2018 reveals that 71% of ITDMs say their IT budget will
either increase by less than 10%, or will stay the same in the coming year.
How will your IT budget change over the coming year?
Significantly increase (by more than 10%)
Somewhat increase (by less than 10%)
Stay the same
Somewhat decrease (by less than 10%)
Significantly decrease (by more than 10%)
Don’t know
19%
51%
20%
8%
1%
1%
0% 10% 20% 30% 40% 50% 60%
Page 10
By what percentage are you finding the number of projects you are being asked to deliver in your organization is increasing?
Against this backdrop, it is hardly surprising that the IT delivery gap is widening at an
alarming rate – with ITDMs struggling more than ever to deliver all the projects asked
of them. Two-thirds of ITDMs admitted they were not able to deliver all of the
projects asked of them last year.
0%
1-10%
11-20%
21-30%
31-40%
41-50%
51-60%
61-70%
71-80%
81-90%
91-100%
Average % increase in number of projects respondents are being asked to deliver in their organization.
0%
10%
23%
26%
16%
12%
6%
4%
1%
1%
0%
27%
0% 5% 10% 15% 20% 25% 30%
Page 11
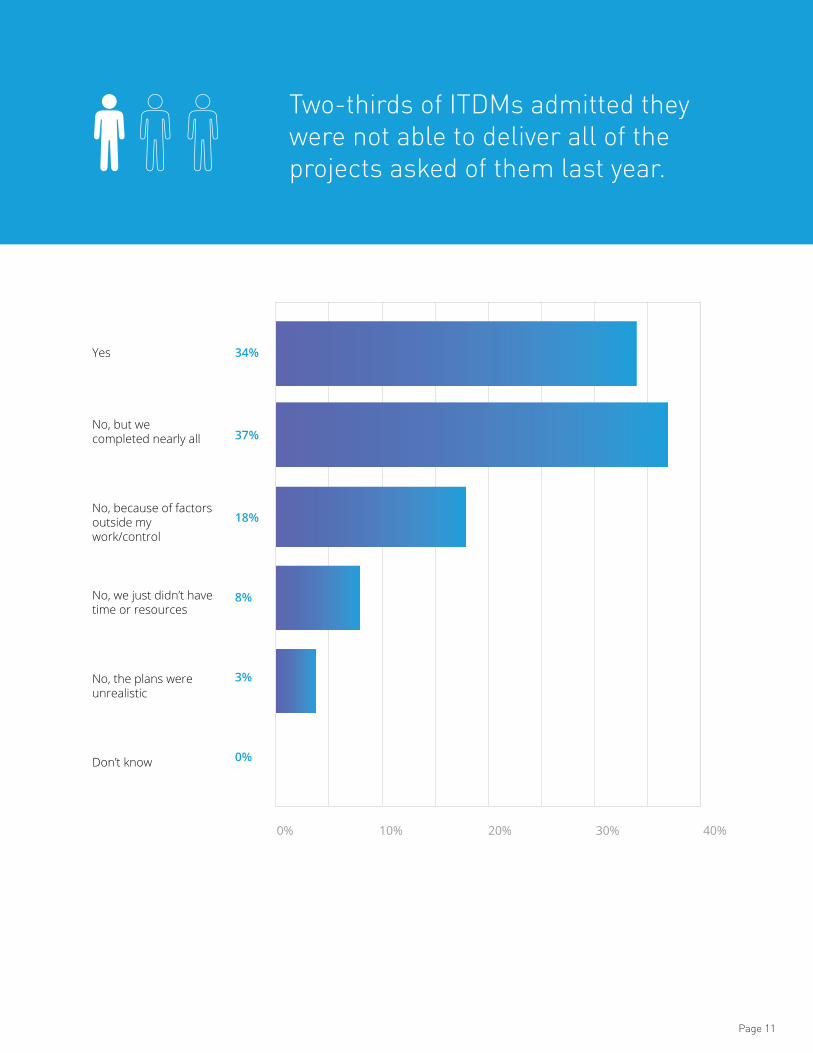
Yes
No, but we completed nearly all
No, because of factors outside my work/control
No, we just didn’t have time or resources
No, the plans were unrealistic
Don’t know
34%
37%
18%
8%
3%
0%
0% 10% 20% 30% 40%
Two-thirds of ITDMs admitted they were not able to deliver all of the projects asked of them last year.

Page 12
Respondents identified that a major obstacle to digital transformation was integration.
And organizations have a lot to integrate. Driven by trends such as cloud, mobile,
and ‘shadow IT’, the number of applications used by companies today is huge. Our
Connectivity Benchmark Report 2018 reveals that, on average, organizations are
using 1,020 individual applications across their business.
A common way organizations tackle the challenge of connecting applications together
is by custom coding their applications and APIs — often referred to as point-to-
point integration. For an organization with two applications, this is not an issue.
But if your organization is like our respondents and has an ecosystem of over
1,000 applications, this level of tight coupling can create issues when changes
occur. Loose coupling reduces dependencies between components so that the
impact of change is isolated.
On average, large organizations are using more than 1000 individual applications across their business.
Why point-to-point integration must die (even if it is sometimes necessary)
1,000+

Page 13
How many different, individual applications do you think are in use in your organization?
What percentage of these applications does your organization currently integrate/connect together?
These figures highlight two things. First, integration continues to pose a challenge
for most organizations. Second, there is still a huge opportunity for organizations
to increase business efficiency and innovate by integrating and connecting more of
their applications.
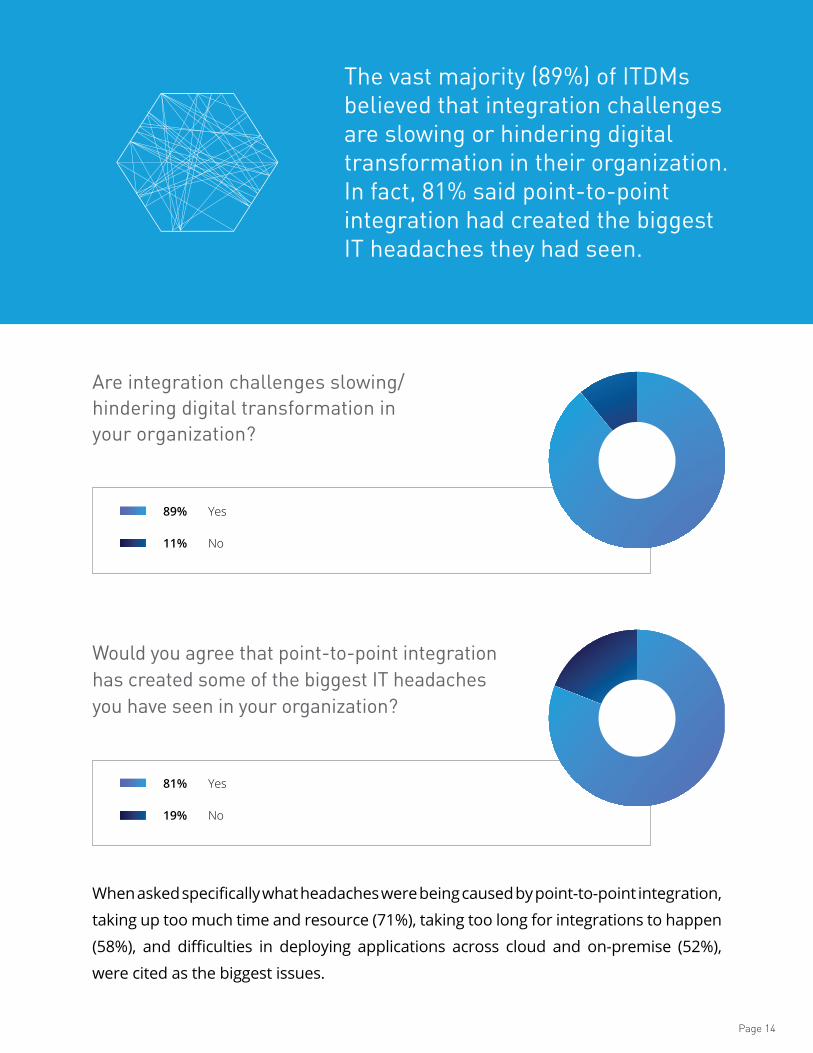
The vast majority (89%) of ITDMs believed that integration challenges are slowing
or hindering digital transformation in their organization. In fact, 81% said point-to-
point integration had created the biggest IT headaches they had seen.
Despite the huge number of individual applications organizations use, a relatively small
number (29%) are integrated or connected together.
Average number of different, individual applications that respondents think are in use in their organization
Average percentage of applications that respondents’ organizations currently integrate/connect together
1,020
29%
Page 14
The vast majority (89%) of ITDMs believed that integration challenges are slowing or hindering digital transformation in their organization. In fact, 81% said point-to-point integration had created the biggest IT headaches they had seen.
Are integration challenges slowing/hindering digital transformation in your organization?
Would you agree that point-to-point integration has created some of the biggest IT headaches you have seen in your organization?
When asked specifically what headaches were being caused by point-to-point integration,
taking up too much time and resource (71%), taking too long for integrations to happen
(58%), and difficulties in deploying applications across cloud and on-premise (52%),
were cited as the biggest issues.
Yes
No
Yes
No
89%
11%
81%
19%
Page 15
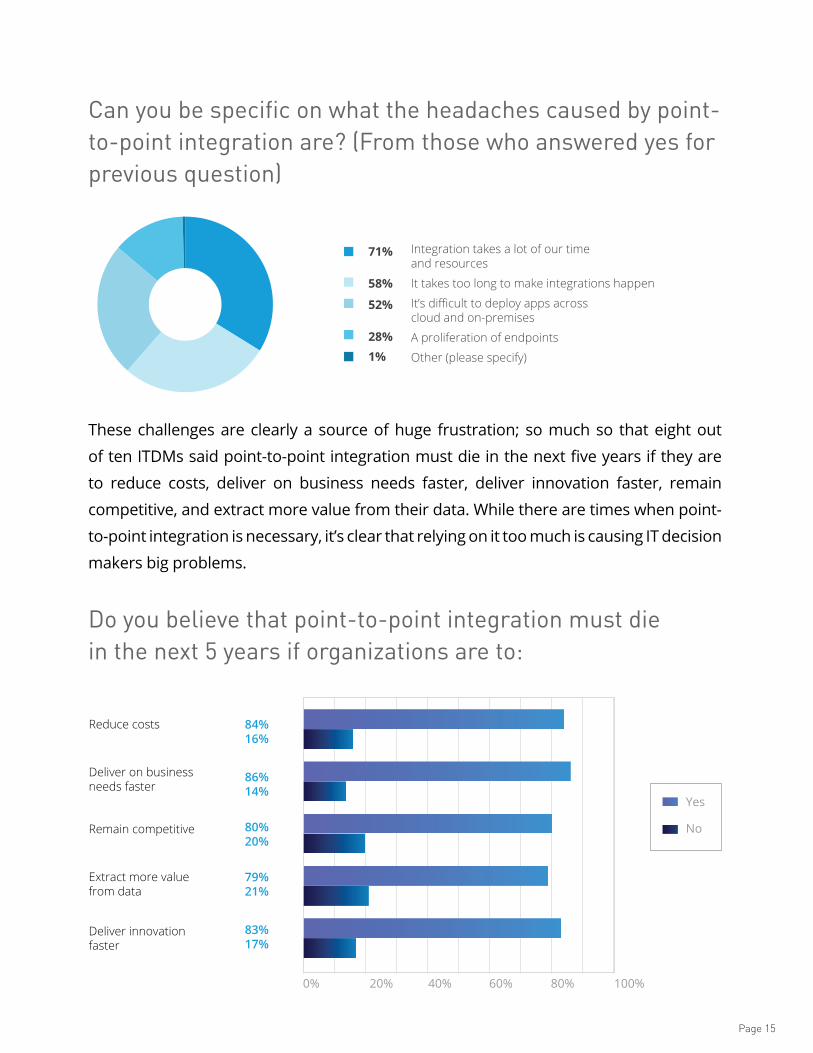
Can you be specific on what the headaches caused by point-to-point integration are? (From those who answered yes for previous question)
Do you believe that point-to-point integration must die in the next 5 years if organizations are to:
These challenges are clearly a source of huge frustration; so much so that eight out
of ten ITDMs said point-to-point integration must die in the next five years if they are
to reduce costs, deliver on business needs faster, deliver innovation faster, remain
competitive, and extract more value from their data. While there are times when point-
to-point integration is necessary, it’s clear that relying on it too much is causing IT decision
makers big problems.
71%
58%
52%
28%1%
Reduce costs
Deliver on business needs faster
Remain competitive
Extract more value from data
Deliver innovation faster
Yes
No
84%16%
86%14%
80%20%
79%21%
83%17%
0% 20% 40% 80% 100%60%

Page 16
It is clear that integration challenges are contributing directly and indirectly to IT
departments being unable to deliver all the projects being asked of them. In fact, the
research shows that organizations are currently spending 22% of their IT budgets
each year on integrating different technologies. Put another way – that equals $814
billion each year, which dwarfs current annual spending on data center systems ($178
billion)2. With the pressure on to digitally transform, organizations can no longer afford
integration to be a drain on time, resource, and budget.
Organizations are currently spending 22% of their IT budgets each year on integrating different technologies. That’s $814 billion each year, which dwarfs current annual spending on data center systems ($178 billion).
On average, how much of your IT budget is spent each year on integrating different technologies?
2 22% of latest Gartner IT spending estimate for 2018 | https://www.gartner.com/newsroom/id/3845563
Average percentage of respondents’ organizations’ IT budget that is spent each year on integrating different technologies
22%
$178B $814B

Page 17
Overcoming an inefficient IT model
When it comes to building new applications and services, it is still very common for
development teams to work in isolation, meaning organizations are unable to
discover and reuse the assets that have been created. This can often result in a
duplication of effort as new applications and services are built from the ground up.
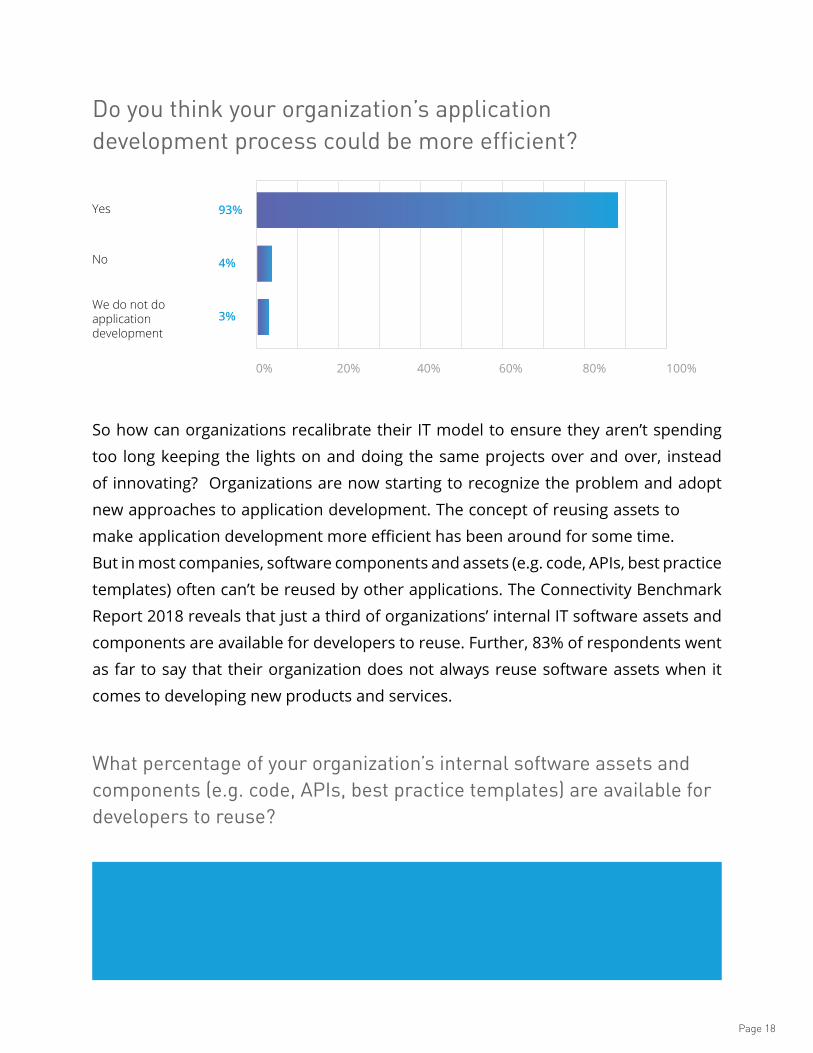
Unsurprisingly, the vast majority (93%) of ITDMs admit their application
development process could be more efficient.
What percentage of your time is spent on running the business (i.e. keeping the lights on) compared to innovation and development projects that are designed to change the business?
It is apparent that organizations need to adopt a more efficient IT model, which
requires both a cultural and technological change. On the face of it that is easier said
than done, as ITDMs continue to face the age-old dilemma of ‘keeping the lights on’
versus ‘innovating’. As the figures show, IT departments are spending nearly two-
thirds (63%) of their time on ‘running the business’ activity, compared to innovation
and development projects.
Average percentage of respondents’ time spent on running the business compared to innovation and development projects
63%
Page 18
So how can organizations recalibrate their IT model to ensure they aren’t spending
too long keeping the lights on and doing the same projects over and over, instead
of innovating? Organizations are now starting to recognize the problem and adopt
new approaches to application development. The concept of reusing assets to
make application development more efficient has been around for some time.
But in most companies, software components and assets (e.g. code, APIs, best practice
templates) often can’t be reused by other applications. The Connectivity Benchmark
Report 2018 reveals that just a third of organizations’ internal IT software assets and
components are available for developers to reuse. Further, 83% of respondents went
as far to say that their organization does not always reuse software assets when it
comes to developing new products and services.
What percentage of your organization’s internal software assets and components (e.g. code, APIs, best practice templates) are available for developers to reuse?
Do you think your organization’s application development process could be more efficient?
Yes
No
We do not do application development
93%
4%
3%
0% 100%80%60%40%20%
Average percentage of respondents’ organizations’ internal software assets and components that are available for developers to reuse
33%

Page 19
If organizations are to deliver digital transformation and innovate more quickly, being
able to discover, connect, and reuse these software assets through APIs will be
essential. By doing this, organizations will be able to move to a self-service model
where anyone within the business can go to an API marketplace to find APIs and
integration assets, which will allow them to connect applications and data. This will
ultimately remove the need for costly and time-consuming bespoke integration
projects. The research highlights that the vast majority (93%) of ITDMs believe
that IT self-service will be critical to their digital transformation success. It seems
the days of IT keeping tight hold of the reins may be coming to an end.
Which of the following statements best applies to your organization?
We always reuse software assets (e.g. code, APIs, and design templates) when it comes to developing new products and services
We frequently reuse software assets when it comes to developing new products and services
We occasionally reuse software assets when it comes to developing new products and services
We never reuse IT assets when it comes to developing new products and services
17%
52%
26%
4%
0% 10% 20% 30% 40% 50% 60%
Page 20
The API imperative
An API strategy is critical to thriving in today’s digital economy. Expanding the
capabilities of the business by becoming a digital platform allows organizations
to increase their profits dramatically. APIs also unlock the value of internal data,
making it easy for people throughout the business to consume data and
applications in an easy and standardized way.
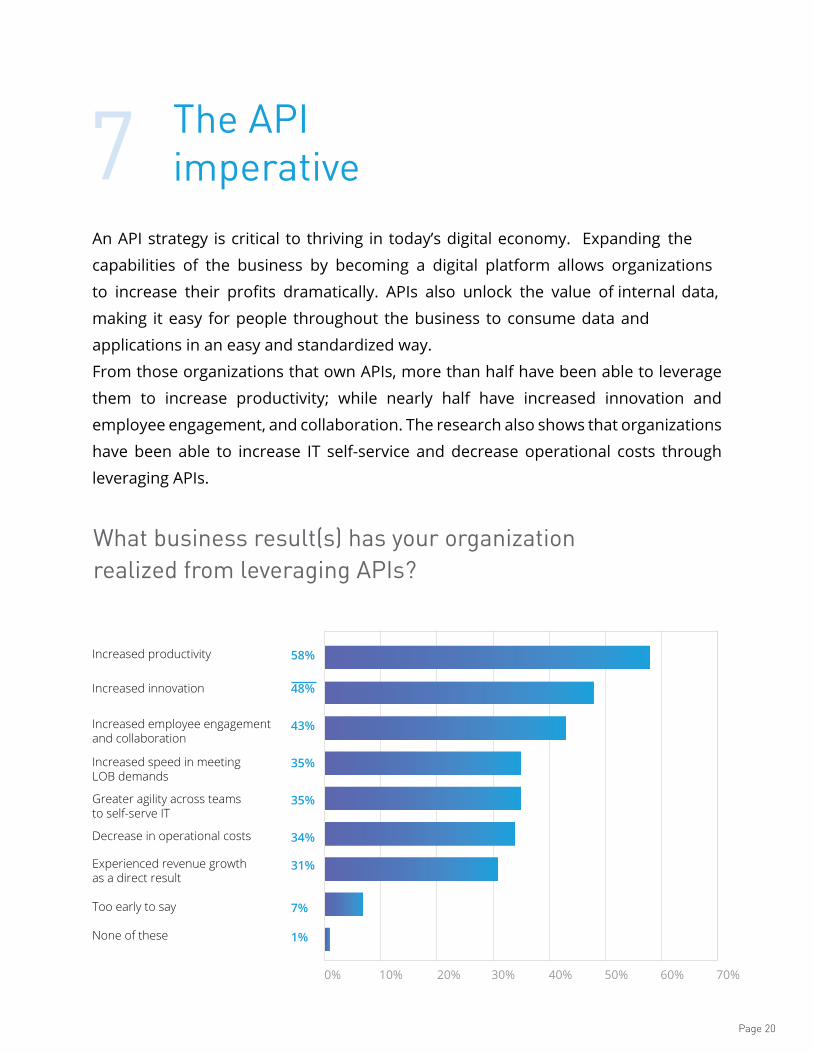
From those organizations that own APIs, more than half have been able to leverage
them to increase productivity; while nearly half have increased innovation and
employee engagement, and collaboration. The research also shows that organizations
have been able to increase IT self-service and decrease operational costs through
leveraging APIs.
What business result(s) has your organization realized from leveraging APIs?
Increased productivity
Increased innovation
Increased employee engagement and collaboration
Increased speed in meeting LOB demands
Greater agility across teams to self-serve IT
Decrease in operational costs
Experienced revenue growth as a direct result
Too early to say
None of these
58%
48%
43%
35%
35%
34%
31%
7%
1%
0% 70%60%50%40%30%20%10%
Page 21
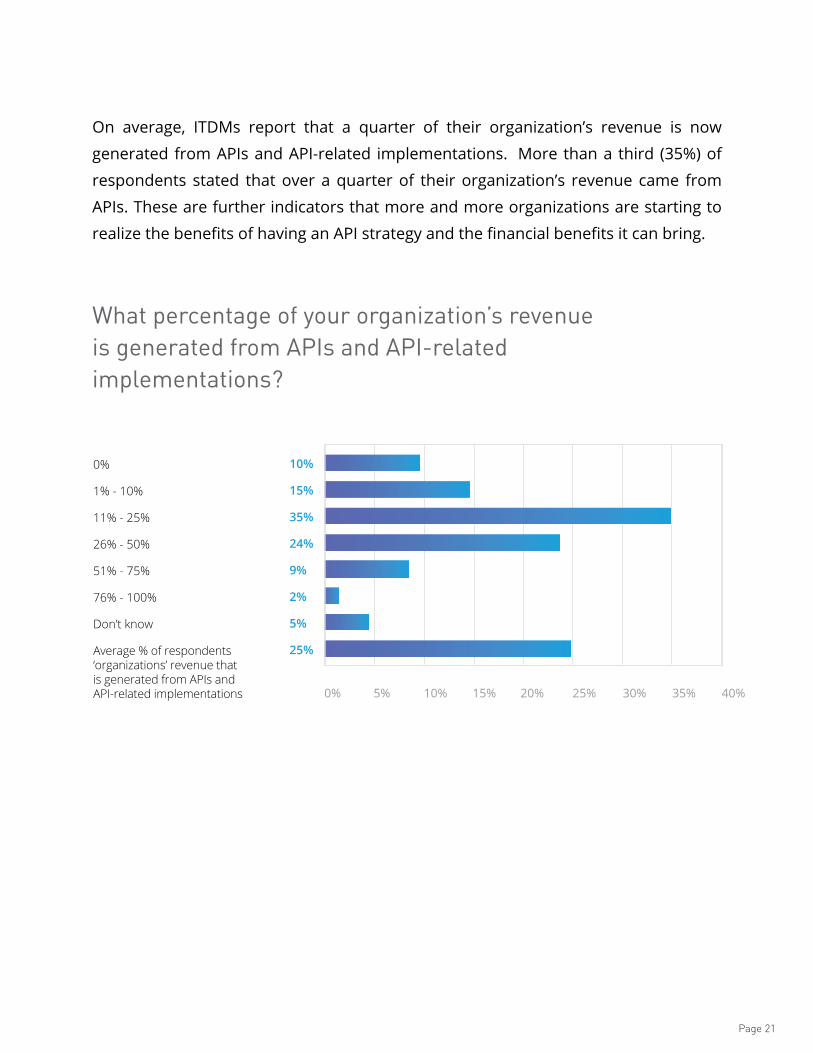
On average, ITDMs report that a quarter of their organization’s revenue is now
generated from APIs and API-related implementations. More than a third (35%) of
respondents stated that over a quarter of their organization’s revenue came from
APIs. These are further indicators that more and more organizations are starting to
realize the benefits of having an API strategy and the financial benefits it can bring.
What percentage of your organization’s revenue is generated from APIs and API-related implementations?
10%
15%
35%
24%
9%
2%
5%
25%
0%
1% - 10%
11% - 25%
26% - 50%
51% - 75%
76% - 100%
Don’t know
Average % of respondents ‘organizations’ revenue that is generated from APIs and API-related implementations 0% 40%30% 35%25%20%15%10%5%
Page 22
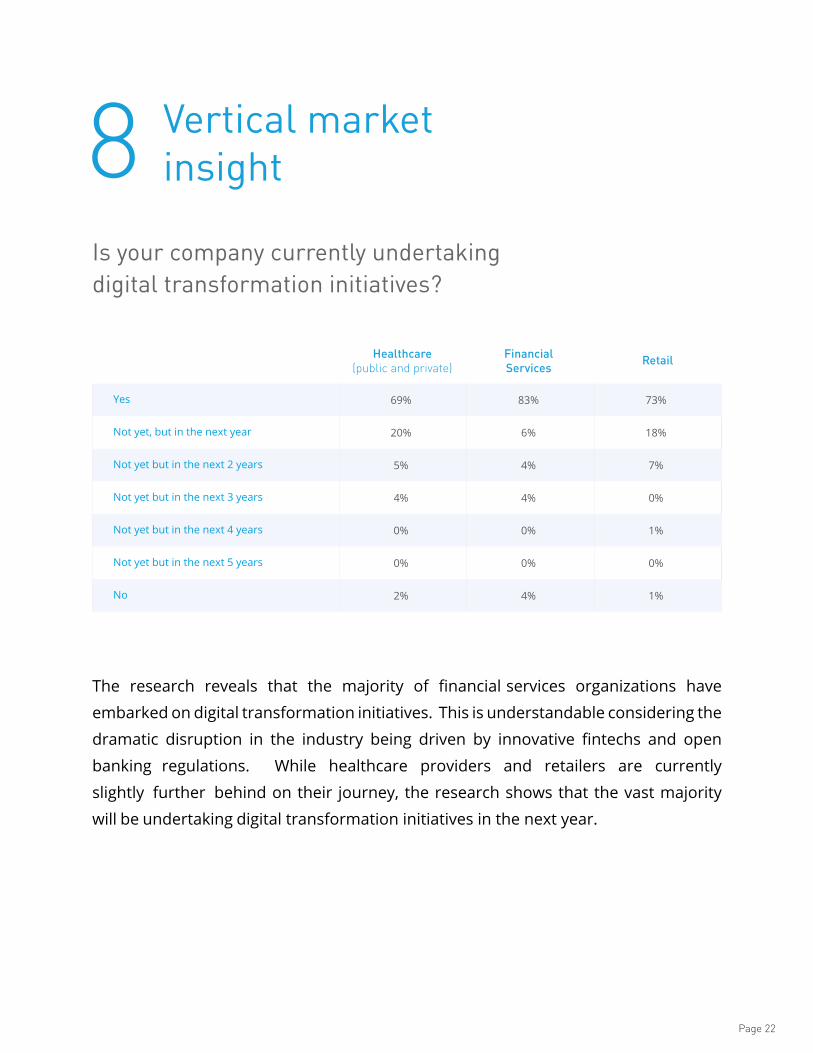
Is your company currently undertaking digital transformation initiatives?
The research reveals that the majority of financial services organizations have
embarked on digital transformation initiatives. This is understandable considering the
dramatic disruption in the industry being driven by innovative fintechs and open
banking regulations. While healthcare providers and retailers are currently
slightly further behind on their journey, the research shows that the vast majority
will be undertaking digital transformation initiatives in the next year.
Vertical market insight
Yes 69% 83% 73%
Not yet, but in the next year 20% 6% 18%
Not yet but in the next 2 years 5% 4% 7%
Not yet but in the next 3 years 4% 4% 0%
Not yet but in the next 4 years 0% 0% 1%
Not yet but in the next 5 years 0% 0% 0%
No 2% 4% 1%
Healthcare (public and private)
FinancialServices Retail

Page 23
Increasing IT’s operational efficiency, improving the customer experience, and
increasing business efficiency were the top three goals for digital transformation.
Improving the customer experience was an area of particular focus for both financial
services organizations and retailers, sectors where the battle for customers is
becoming increasingly fierce.
What are the goals you would most like to achieve with your digital transformation initiatives in your organization?
Increase IT’s operational efficiency 75% 75% 80%
Improve customer experience 64% 77% 77%
Increase business efficiency 75% 64% 71%
Introduce new products and services faster 60% 52% 57%
Improve employee experience 43% 47% 57%
Improve partner experience 32% 24% 26%
Other (please specify) 0% 0% 0%
Healthcare (public and private)
FinancialServices Retail
Page 24
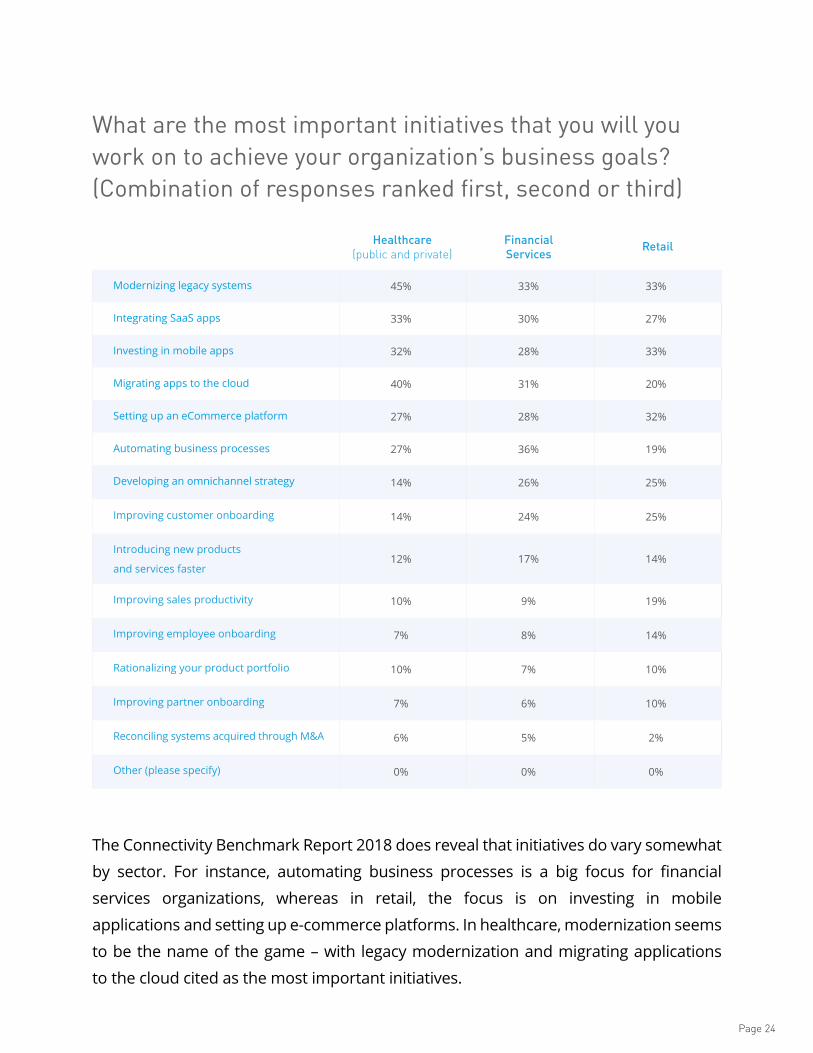
What are the most important initiatives that you will you work on to achieve your organization’s business goals? (Combination of responses ranked first, second or third)
Modernizing legacy systems 45% 33% 33%
Integrating SaaS apps 33% 30% 27%
Investing in mobile apps 32% 28% 33%
Migrating apps to the cloud 40% 31% 20%
Setting up an eCommerce platform 27% 28% 32%
Automating business processes 27% 36% 19%
Developing an omnichannel strategy 14% 26% 25%
Improving customer onboarding 14% 24% 25%
Introducing new products
and services faster12% 17% 14%
Improving sales productivity 10% 9% 19%
Improving employee onboarding 7% 8% 14%
Rationalizing your product portfolio 10% 7% 10%
Improving partner onboarding 7% 6% 10%
Reconciling systems acquired through M&A 6% 5% 2%
Other (please specify) 0% 0% 0%
Healthcare (public and private)
FinancialServices Retail
The Connectivity Benchmark Report 2018 does reveal that initiatives do vary somewhat
by sector. For instance, automating business processes is a big focus for financial
services organizations, whereas in retail, the focus is on investing in mobile
applications and setting up e-commerce platforms. In healthcare, modernization seems
to be the name of the game – with legacy modernization and migrating applications
to the cloud cited as the most important initiatives.

Page 25
For three-quarters of financial services organizations and retailers, IT budgets will
either stay the same or increase by less than 10%. However, encouragingly for a
fifth of retailers, they will see a budget increase of more than 10% this year.
Interestingly, in healthcare, IT budgets appear a lot tighter with 60% of ITDMs stating
they will either stay the same or increase by less than 10% - a further 22% said
their budget would decrease this year.
Were you able to deliver all the projects asked of you last year?
How will your IT budget change over the coming year?
Significantly increase (by more than 10%) 15% 15% 21%
Somewhat increase (by less than 10%) 47% 53% 55%
Stay the same 13% 21% 20%
Somewhat decrease (by less than 10%) 16% 8% 3%
Significantly decrease (by more than 10%) 6% 1% 1%
Healthcare (public and private)
FinancialServices Retail
Yes 20% 27% 34%
No, but we completed nearly all 42% 32% 40%
No, because of factors outside
my work/control21% 24% 16%
No, we just didn’t have time
or resources9% 11% 6%
No, the plans were unrealistic 7% 6% 4%
Don't know 1% 0% 0%
Healthcare (public and private)
FinancialServices Retail
Project delivery issues were particularly acute in financial services and healthcare,
where 73% and 80% of ITDMs respectively were unable to deliver all of their projects.
Page 26
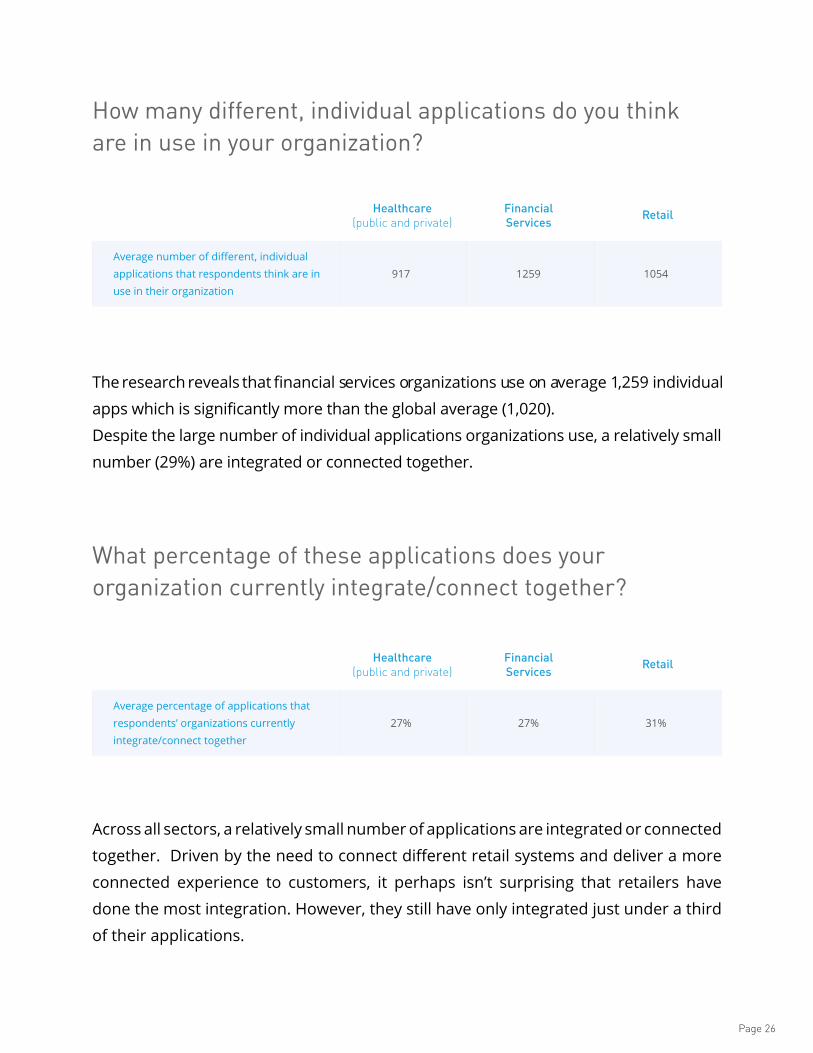
How many different, individual applications do you think are in use in your organization?
Average number of different, individual applications that respondents think are in use in their organization
917 1259 1054
Average percentage of applications that respondents’ organizations currently integrate/connect together
27% 27% 31%
Healthcare (public and private)
Healthcare (public and private)
FinancialServices
FinancialServices
Retail
Retail
The research reveals that financial services organizations use on average 1,259 individual
apps which is significantly more than the global average (1,020).
Despite the large number of individual applications organizations use, a relatively small
number (29%) are integrated or connected together.
What percentage of these applications does your organization currently integrate/connect together?
Across all sectors, a relatively small number of applications are integrated or connected
together. Driven by the need to connect different retail systems and deliver a more
connected experience to customers, it perhaps isn’t surprising that retailers have
done the most integration. However, they still have only integrated just under a third
of their applications.

Page 27
What percentage of your organization’s revenue is generated from APIs and API-related implementations?
0% 10% 26% 11% 6%
1% - 10% 15% 18% 16% 10%
11% - 25% 35% 32% 39% 36%
26% - 50% 24% 19% 19% 33%
51% - 75% 9% 3% 9% 9%
76% - 100% 2% 0% 2% 4%
Don’t know 5% 2% 4% 1%
Average percentage of respondents' organizations' revenue that is generated from APIs and API-related implementations
25% 15% 23% 29%
Healthcare (public and private)
FinancialServices RetailTotal
Currently, retailers are generating approaching a third of their revenue from APIs and API-
related implementations. In fact, 42% stated APIs generate more than a quarter of revenue.
In contrast, healthcare providers are only generating 15% of revenue. This may be because
healthcare organizations are very late to the game when it comes to digitization at all. For
example, many hospitals were not using electronic records even 10 years ago. It follows
that they may also be behind in adopting ways to monetize through APIs.
Page 28
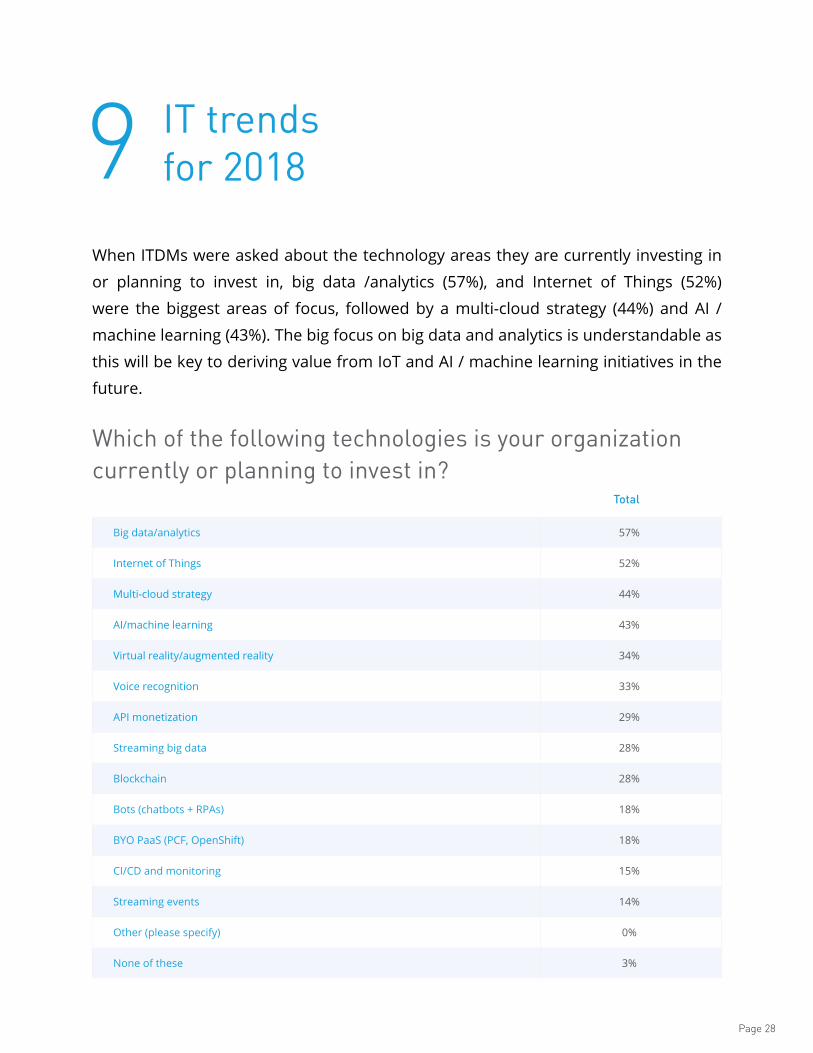
When ITDMs were asked about the technology areas they are currently investing in
or planning to invest in, big data /analytics (57%), and Internet of Things (52%)
were the biggest areas of focus, followed by a multi-cloud strategy (44%) and AI /
machine learning (43%). The big focus on big data and analytics is understandable as
this will be key to deriving value from IoT and AI / machine learning initiatives in the
future.
Which of the following technologies is your organization currently or planning to invest in?
IT trends for 2018
Big data/analytics 57%
Internet of Things 52%
Multi-cloud strategy 44%
AI/machine learning 43%
Virtual reality/augmented reality 34%
Voice recognition 33%
API monetization 29%
Streaming big data 28%
Blockchain 28%
Bots (chatbots + RPAs) 18%
BYO PaaS (PCF, OpenShift) 18%
CI/CD and monitoring 15%
Streaming events 14%
Other (please specify) 0%
None of these 3%
Total
Page 29
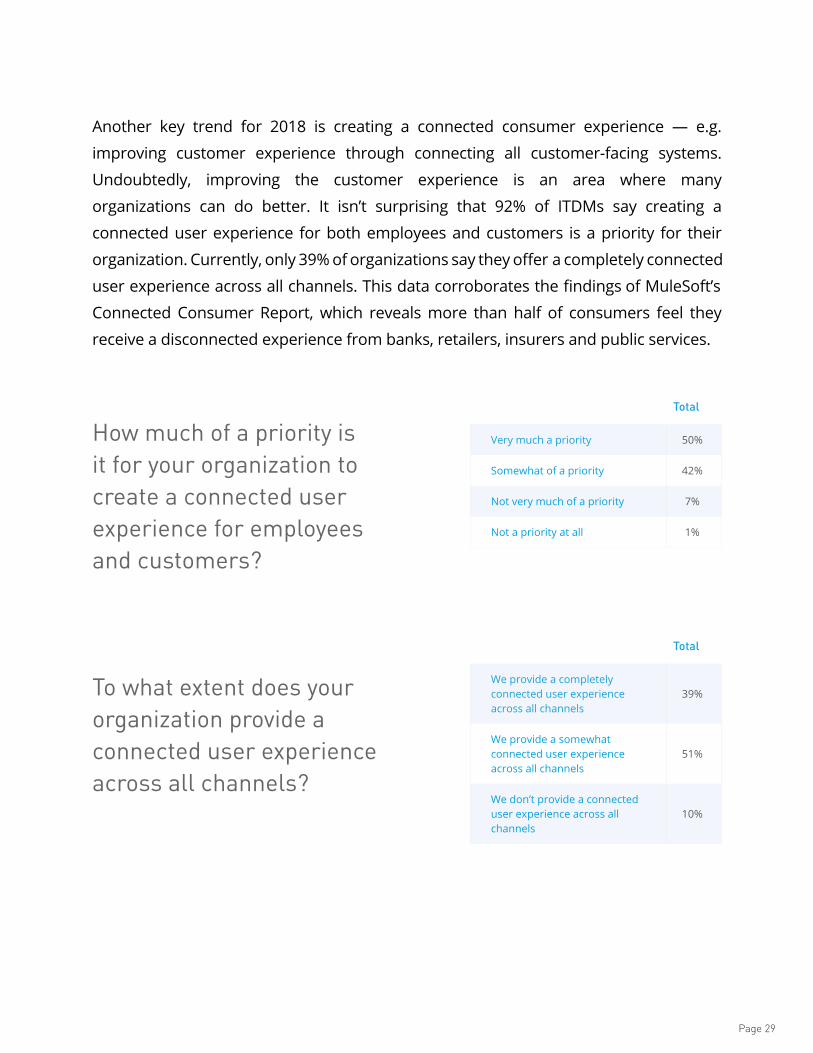
How much of a priority is it for your organization to create a connected user experience for employees and customers?
To what extent does your organization provide a connected user experience across all channels?
Another key trend for 2018 is creating a connected consumer experience — e.g.
improving customer experience through connecting all customer-facing systems.
Undoubtedly, improving the customer experience is an area where many
organizations can do better. It isn’t surprising that 92% of ITDMs say creating a
connected user experience for both employees and customers is a priority for their
organization. Currently, only 39% of organizations say they offer a completely connected
user experience across all channels. This data corroborates the findings of MuleSoft’s
Connected Consumer Report, which reveals more than half of consumers feel they
receive a disconnected experience from banks, retailers, insurers and public services.
Very much a priority 50%
Somewhat of a priority 42%
Not very much of a priority 7%
Not a priority at all 1%
We provide a completely connected user experience across all channels
39%
We provide a somewhat connected user experience across all channels
51%
We don’t provide a connected user experience across all channels
10%
Total
Total
Page 30
At a time when budgets and resources remain tight, it is clear that the old approach
of IT trying to deliver all the projects itself won’t work for the fast pace of change. IT
decision makers are telling us that their workloads are increasing, their budgets and
resources are only going up slightly, and the pressure is on to complete the digital
transformation initiatives that they are now tasked with or else the consequences
could be severe.
IT decision makers know that it’s time for a change. Digital transformation isn’t just
a matter of buying new software and hoping it solves all problems; the number of
applications they are integrating and traditional integration approaches are simply
creating new issues. IT decision makers investing in APIs, reusable software assets,
and more efficient ways of developing applications suggest they are thinking
about new solutions to these challenges.
For more about how MuleSoft is transforming how IT functions in the modern
enterprise, and real-life case studies on how a number of companies have overcome
obstacles to digital transformation, take a look at MuleSoft founder Ross Mason’s
book, First Break IT.
Conclusion
The survey was commissioned by MuleSoft and independently carried out by
Vanson Bourne. The total sample size was 650 IT Decision Makers (ITDMs)
working at organizations with 1,000+ employees:
US (250 ITDMs), UK (100 ITDMs), Germany (75 ITDMs), Netherlands (50 ITDMs),
Australia (50 ITDMs), Singapore (50 ITDMs) and China (75 ITDMs). Fieldwork
was undertaken in November / December 2017.