Embed Size (px)
DESCRIPTION
A STUDY OF CRITICAL FACTORS RESPONSIBLE FOR THE LOW SALES OF PACKAGED ATTA
Citation preview

A STUDY OF CRITICAL FACTORS RESPONSIBLE FOR THE LOW
SALES OF PACKAGED ATTA
CHAPTER-1
INTRODUCTION
1

A STUDY OF CRITICAL FACTORS RESPONSIBLE FOR THE LOW
SALES OF PACKAGED ATTA
1. Introduction
Food is powerful symbol of cultural identity; wheat considered to be a staple part of diet for most
of northern and western part of India, is also finding its way into the culinary habits of the south
and the east where rice has traditionally ruled the platter.
The bulk of wheat is converted into whole wheat flour or Atta, used to make flat bread or roti.
While Atta and roti are central to Indian food, packaged atta is a novel concept. The market is
characterized by traditional chakki atta, where the housewife buys grain and has it freshly ground
in a local flour mill or chakki. The current size of branded packaged atta is approximately one
million tons or 2.2% of total market of approximately 45 million tones.
2%
98%
Consumption of Packaged Atta
Packaged Atta Unpackaged Atta
It is a country of unity in diversity. But there is not much variation in the food habits of people.
Particularly when it comes to main component of Indian diet, Roti is indispensible. Except for a
few states in the south, rotiis the main course of Indian food. Roti is made of wheat flour. Thus
considering the amount spent on food, approximately 20 per cent of food expenditure is on flour.
In this study atta is going to be used in place of wheat flour.
India has seen rapid economic growth in the past two decades after the new economic policy.
The economic growth has certainly bettered the life style and standard of living of the middle
class, if not rural Indians. The changing life style and the aggressive marketing of food items
2

have completely changed the buying pattern of consumers. Consumers are buying packaged oil,
masale, leaf tea, pickle, beverages, rice, fruits and what not. The penetration is so intense that
people are buying one rupee water pouches.
In the light of such changing scenario, is seems pretty strange as why the packaged atta industry
is not keeping the pace with the growth of other packaged items in India. The branded atta
market (estimated between 2.3-3 lakhs tones and valued at Rs 400-600 crores) is increasing in
the last few years. According to some other estimates merely five per cent is the consumption of
packaged atta out of total consumption.
Packaging Industry in India
An increasing population and growing consumer demand for packaged foods has forced food
and beverages industry to look at new technologies that provide flexibility, ease of operation and
constant tracking of the production process. Complete transparency is required along the
production process for assuring consumers health and hygiene. This demands continuous
monitoring and efficient traceability of the entire production process in the food manufacturing
plant.
Interest in biodegradable disposable plastic items has steadily grown over the last decade.
Disposable packaging materials used to ship and protect purchased items as well as disposable
containers used for food and drink are of special interest. The idea that one time use items can be
disposed off with the peace of mind, that they will not remain for centuries in a landfill, or as
litter, is one of the tenets driving the recent interest in "green" technologies and lifestyles. With
packaging materials, the reduction in usage of raw materials, re-use and recycling is of course
the best route to sustainable lifestyle. However, for various reasons, in practice, much of the
material ends up being discarded to a landfill or accidentally shows up as litter. For these
instances, it is advantageous to have a plastic material that would biodegrade when exposed to
environments where other biodegradable materials are undergoing decay.
3
Market
Indian Food and Beverages forecast (2007-2011) gives an in-depth analysis of the present and
future prospects of the Indian food and beverages industry. It looks into the industry in detail
with focus on organized food retailing, consumer food purchasing behavior, food processing
industry and packed/convenience food industry. This report helps clients to analyze the factors
and examine the opportunities critical to the success of food and beverages industry in India.
With vast population base, growing middle class and strong macroeconomic environment, the
Indian food & drinks market has emerged as the one of the fastest growing segments in the
Indian retail industry. Rapid lifestyle transformation, particularly among those living in urban
areas, has resulted into a dramatic increase in the demand for processed or health food, packaged
and ready-to-eat food products. Arrival of food multinationals and proliferation of fast food
outlets have further added to the growth in this industry. The changing scenario of the retail
industry, like opening up of new supermarkets/hypermarkets, shopping malls and fast food
outlets, coupled with favorable industry trends, is about to bring radical shifts in the food & drink
industry, says “Indian Food and Drinks Market: Emerging Opportunities”, a latest industry
analysis by RNCOS.
Almost all the segments analyzed in the report are found to be growing at rapid pace even in the
phase of economic crisis, especially the alcoholic drinks segment, which is expected to reach 3
Billion Liter mark by 2012 from around 1.95 Billion Liters in 2008, has been outperforming
other segments in terms of sales growth and concreting a solid platform for stiff competition in
the domestic market among existing as well as new market players.
The low brand loyalty and price-sensitive consumer behavior is still preventing the Indian
market to unfold its full potential. However, it will require balanced brand portfolio strategies,
comprising of diverse product mix with superb level of quality and that too on an affordable
price. This is expected to result into an overall market progress in which the consumer will be
benefited the most.
4
The report provides in-depth research and rational analysis on the food & drinks industry in
India. It provides detailed overview of the consumption patterns of Indians in various food
segments, like milk, fruits, vegetables, meat, etc. The beverage segment talks about the type of
beverages, their sales and consumption patterns among the Indian populace. The report aims at
assisting clients in analyzing the potential growth areas, challenges and drivers critical for the
Indian food & drinks industry.
Opportunity
Supermarket sales will expand at a much higher rate than other retail formats. This is because
greater number of higher income Indians will prefer to shop at supermarkets because of
convenience, higher standards of hygiene, and attractive ambience.
It is expected that fruit consumption will increase at a CAGR of 4.33% for the period spanning
from 2007-2011, highest among all the food products taken in this report.
The processed-food market is the main focus for foreign companies as this segment is
underdeveloped and presents enormous potential for growth. The growth of modern, organized
retailing — in contrast to the kiosks and small shops from which Indians have been purchasing
food traditionally — will also increase the demand for value-added foods.
Rising household incomes, increasing urbanization, changing lifestyles and the rapid growth of
the private-sector and dairy-processing industry should lead to greater demand for value-added,
milk-based products, such as processed cheese, table butter and ice cream.
Rising incomes will make fish more affordable for a larger segment of the population. It is
expected that the consumption per head will increase at a CAGR of 3.45% for the forecasted
period.
The growth rate of soft drink sales will decelerate during the forecasted period due to pesticide
contamination issues and growing popularity of fruit juice drinks and bottled water.
5

Coffee consumption is likely to expand at a rapid rate during the forecasted period. It is expected
that it will increase at a CAGR of 10.05% for the period spanning from 2007-2011.
Ready to cook food
The ready-to-cook food category has been one of the rising stars of the food industry. Since the
inception of the category, it has shown strong growth outstripping its nearest competitor, the
ready meal. Ready-to-cook foods are consistent with modern consumer trends towards greater
involvement in cooking and the desire to use natural, unprocessed ingredients.
The market has continued to grow although the rate of growth is slowing. In 2008, the market is
expected to grow by nearly 8% to £543 million. Household penetration of ready-to-cook foods
has steadily increased. However, consumer attitudes towards ready-to-cook foods are
deteriorating with increasing numbers questioning their role.
This report reviews recent developments in the ready-to-cook food market with a special
emphasis on interpreting the impact of changing consumer attitudes on future sales. It also aims
to test the following hypothesis: “Is the read
6

A STUDY OF CRITICAL FACTORS RESPONSIBLE FOR THE LOW
SALES OF PACKAGED ATTA
CHAPTER-2
Introduction to Food Industry
7

A STUDY OF CRITICAL FACTORS RESPONSIBLE FOR THE LOW
SALES OF PACKAGED ATTA
2. Introduction to Food Industry
India is the world's second largest producer of food next to China, and has the potential of being
the biggest with the food and agricultural sector. The total food production in India is likely to
double in the next ten years and there is an opportunity for large investments in food and food
processing technologies, skills and equipment, especially in areas of Canning, Dairy and Food
Processing, Specialty Processing, Packaging, Frozen Food/Refrigeration and Thermo Processing.
Fruits & Vegetables, Fisheries, Milk & Milk Products, Meat & Poultry, Packaged/Convenience
Foods, Alcoholic Beverages & Soft Drinks and Grains are important sub-sectors of the food
processing industry. Health food supplements are another rapidly rising segment of this industry
which is gaining vast popularity amongst the health conscious consumers.
India is one of the world’s major food producers but accounts for less than 1.5 per cent of
international food trade. This indicates vast scope for both investors and exporters. Food exports
in 1998 stood at US $5.8 billion whereas the world total was US $438 billion. The Indian food
industries sales turnover is Rs 140,000 crore (1 crore = 10 million) annually as at the start of year
2000. The industry has the highest number of plants approved by the US Food and Drug
Administration (FDA) outside the USA.
India's food processing sector covers fruit and vegetables; meat and poultry; milk and milk
products, alcoholic beverages, fisheries, plantation, grain processing and other consumer product
groups like confectionery, chocolates and cocoa products, Soya-based products, mineral water,
high protein foods etc. We cover an exhaustive database of an array of suppliers, manufacturers,
exporters and importers widely dealing in sectors like the -Food Industry, Dairy processing,
Indian beverage industry etc. We also cover sectors like dairy plants, canning, bottling plants,
packaging industries, process machinery etc.
8

The most promising sub-sectors includes -Soft-drink bottling, Confectionery manufacture,
Fishing, aquaculture, Grain-milling and grain-based products, Meat and poultry processing,
Alcoholic beverages, Milk processing, Tomato paste, Fast-food, Ready-to-eat breakfast cereals,
Food additives, flavors etc.
Company Profile
Aashirvaad
At ITC Aashirvaad, extra care is taken to keep things as natural as possible. The way Mother
Nature intended for them to be. That is why you will see that a lot of traditional, sometimes even
cumbersome methods that the world has long left behind are adopted, so that you can have a
taste of the authentic. In our quest to provide you wholesome goodness, the finest of ingredients
are sourced, directly from the farmers through our e-choupals. ITC’s e-choupal initiative, aims to
confer the power of expert knowledge on even the smallest individual farmer. Thus, it is
enhancing its competitiveness in the global market. A walk through our range our products might
well seem like a journey through the good old world.
.
Aashirvaad Atta was launched on 27th May 2002 and within a short span of 7 years has become
the number one in branded packaged atta across the country. Aashirvaad Atta is made from the
choicest grains - heavy on the palm, golden amber in color and hard in bite. It is carefully ground
using modern 'chakki - grinding' process for the perfect balance of color, taste and nutrition
which also ensures that Aashirvaad atta contains 0% Maida and is 100% Sampoorna Atta. The
dough made from Aashirvaad Atta absorbs more water; hence roti’s remain soft longer. The
wheat for Aashirvaad Atta is sourced directly from farmers through ITC's e-choupals.
9

Aashirvaad Select 100% MP Sharbati atta comes from the plush, fertile soil of Madhya Pradesh,
tended by the right amounts of sunshine and rainfall. The land here truly sprouts gold. The gold
that we call ´sharbati´. The ´sharbati′ wheat is sourced directly from farmers through ITC′s e-
choupals and then blended using the traditional ´chakki-grinding′ method to give you that
superior, discerning taste that you well deserve.
Aashirvaad Atta with Multigrain: From the stable of India’s most trusted Atta brand comes a
new and improved variety – Aashirvaad Atta with Multigrain. This all-new variant is designed to
provide nourishment for people of all ages and is an integrated mix of six different grains –
wheat, soya, channa, oat, and maize phylum husk – which gives a better and healthier option for
the consumers. Aashirvaad Atta with Multigrain is an excellent source of vitamins which is vital
in strengthening immunity and; extra protein content to improve body strength. The extra fiber
makes your food easier to digest; low content of saturated fat keeps your heart smiling all
through the day and above all, still retaining the same great taste!!
Whole Wheat Atta - 0% Maida and 100% Atta: Aashirvaad Whole Wheat Atta has 0% Maida
and 100% atta. This means you serve soft, fluffy roti’s and a whole lot of health and happiness.
Shakti Bhog
Established in the year 1970, we, "Shakti Bhog Foods Ltd.", are the most reputed name in the
field of food products. Our brand- Shakti Bhog is India's fastest selling wheat flour and has made
us a popular name in the global market. The distinctiveness of our products and further
broadening of product lines has established us as the most acknowledged manufacturer and
exporter of Wheat Flour, Basmati and Non-Basmati Rice, Pulses and Beans, Corn Flour, Maize
Flour, Atta, Mustard Oil, Pickles and Samoline (Suji). Our impeccable quality products, cost
effective production process, voluminous experience of the market and prompt delivery has
fetched us tremendous customer response in overseas markets like USA, New Zealand,
Australia, UAE, Qatar and host of other countries. The work culture of our organization is
focused on high performance, innovation, entrepreneurship and empowerment. Our products
have been well-appreciated by all our clients, which motivates us to elevate the standards of
10

excellence.
We are a leading producer in milled product segment in Indian processed food industry, products
like Packaged Atta (Whole Wheat Flour), Besan (Gram Flour), Samoline (Suji), Basmati Rice
and Dalia (Porridge) are part of our product line. We produce three kinds of Flour, two kinds of
Porridge and different variety of Basmati Rice. Absolute hygienically proven and tested quality
checks are undertaken at every level of the production process, in order to make sure that only
quality proven batches of products are dispatched in the market.
Pillsbury
We have a range of innovative brands all driving our mission of making consumers lives
healthier, easier and richer.
Our brands are relevant to a wide range of consumers. We offer households worldwide brands
such as Pillsbury, Green Giant and Betty Crocker. Active professionals enjoy our Nature Valley
products.
We have Haagen-Dazs for consumers of super-premium ice cream.
General Mills India also offers a range of customized products for the foodservice sector.
Pillsbury Chakki Fresh Atta flour provides consumers with a deliciously soft roti’s, along with
the convenience of a packaged, branded product.
11

Pillsbury Chakki Fresh Atta was introduced in 1998 as a high-quality, nutritious alternative to
the age-old tradition of purchasing grain and having it ground at the local “Chakki” or flour mill.
Pillsbury has been recognized as a “super brand” in the branded atta category, and is one of the
leading players, with products distributed in more than 500 towns and 100,000 outlets
throughout India.
Pillsbury Chakki Fresh Atta is 100 percent whole wheat grain atta with fibre - which is important
for a healthy digestive system - natural ingredients for overall health and vitality, plus iron,
which acts as a carrier of oxygen in the body.
Pillsbury Atta with Multi-Grain Launched in 2008 in select cities, this is a first-to-market, unique
blend of seven grains (wheat, oats, soy, raagi, barley, channa dal and maize) that are specially
blended to provide all-around health benefits.
Silver Coin
Initially, company entered into the market with unit pack of 25 Kg, 50 Kg and 90 Kg to meet the
demands from bakeries, hotels, restaurants, functions etc. On creation of best market amongst the
bulk users, company went ahead to meet the demand of end users with consumer pack of 1 Kg to
10 Kg. Unit packaging has been designed in consideration of all types of users residing at metros
and remote areas in the country. This packaging system is being introduced into two separate
sections, in addition to the special unit packaging as per requirements of users with different
brand names.
12

A STUDY OF CRITICAL FACTORS RESPONSIBLE FOR THE LOW
SALES OF PACKAGED ATTA
CHAPTER-3
Rationale of the study
13

A STUDY OF CRITICAL FACTORS RESPONSIBLE FOR THE LOW
SALES OF PACKAGED ATTA
3. Rationale of the Study
3.1. Statement of the problem
Given the growth of other packaged food items, the packaged atta industry is estimated to grow
at the rate of merely 3 per cent. The slow growth of the above mentioned industry may be due to
several reasons. It is also surprising that the presence of ITC, Hindustan Lever Ltd and even the
global brand Pillsbury is not stimulating the growth of the industry. This is evident from the
advertising space in the television. There is hardly any advertisement of packaged atta during the
prime time of television targeting the Indian housewives through Balika Vadhu, Jhansi Ki Rani,
Ye Rishta Kya Kehlata Hai, etc.
The problem is related to the low sales of packaged atta in the light of the fact that it is inevitable
part of our life. Now the time when people are using everything in packaged form Sand believing
that it would be better than open food, nevertheless they are not giving as much response as they
should give to it.
The major market is of families where both husband and wife are working, office goers or those
families which don’t have a flour mill in vicinity.
Most families still prefer going the traditional way and doubt the quality of packaged atta. The
still practice purchasing wheat from the market, cleaning it by hand, storing them and then taking
small quantities of wheat to neighborhood mill or chakki to get it ground between two stones to
convert it into flour.
Selling packaged flour is almost revolutionary in India, where most Indian housewives still buy
raw wheat in bulk, clean it with hand, store it in metal hampers and carry some to the
neighborhood mill or chakki where it is grinded between two stones. This above analysis makes
this study a useful and important study.
14
3.2 Objectives
The main objective of the study is:
“To study the critical factor responsible for low sales of packaged atta”
The secondary objectives of the study are:
To find out the per cent of households using the packaged atta in urban area
To find out factors that drive people to use the packaged atta
To analyze key decision maker in the household for buying/ not buying the packaged atta
3.3 Scope of the Study
After finding the critical factors responsible for low demand for packaged atta, the study covers
the core marketing concepts viz. Price, Promotion, Place, and Product. The scope of the study, in
terms of geography, is limited to urban area. This study is to know why, what, where, who is
responsible for low sales of packaged atta.
15

A STUDY OF CRITICAL FACTORS RESPONSIBLE FOR THE LOW
SALES OF PACKAGED ATTA
CHAPTER-4
Research Methodology
16

A STUDY OF CRITICAL FACTORS RESPONSIBLE FOR THE LOW
SALES OF PACKAGED ATTA
Research Methodology
“Research methodology is a method of studying problems whose solutions are to be desired
partly or wholly from facts. These facts may be statements of opinions, historical facts, those
contained in records and reports, the results of tests, answers to questionnaires, experimental data
of any sort, and so forth.”
- By M.S. Monore
Research is the systematic exploration of the region of the unknown to find satisfactory answers
to the questions: what, how and why? It may be diligent enquiry in a scientific manner for
improvement of an existing system or for development of a new one, or for improving a process.
Research has been defined by various authors in different ways. It always begins with the
question or a problem
Research is carried out for two purposes -
1. Discovery of new facts
2. Verification of old one
There are two types of methods
A. Primary data collection method
B. Secondary data collection method
C. Statistical tools
Primary data collection method:
In primary data collection, you collect the data yourself using methods such as interviews and
questionnaires. The key point here is that the data you collect is unique to you and your research
and, until you publish, no one else has access to it.
There are many methods of collecting primary data and the main methods include:
17
a) questionnaires
b) interviews
c) focus group interviews
Observation
B. Secondary data collection method:
All methods of data collection can supply quantitative data (numbers, statistics or
financial) or qualitative data (usually words or text). Quantitative data may often be
presented in tabular or graphical form. Secondary data is data that has already been
collected by someone else for a different purpose to yours.
Thus, research is the systematic exploration of the region of the unknown to find satisfactory
answers to the questions: what, how and why? It may be diligent enquiry in a scientific manner
for improvement of an existing system or for development of a new one, or for improving a
process.
Thereby, the aim of research is to improve, develop and not merely control routine operations.
Characteristics of research
1) Directed towards the solution
2) Require systematic approach
3) Data collection and data analysis
4) Relevancy
5) Expertise
6) Unbiased
7) Control
8) Logical
9) Empirical
18

Defining the problem
Planning a research design
Planning a sample Gathering the data
Every project report conducted scientifically has specified framework for controlling data
collection. This framework is called research design. Its function is to ensure that required data
are collected accurately and effectively
THE RESEARCH PROCESS
Model: 4.1: THE RESEARCH PROCESS
Model: 4.1: THE RESEARCH PROCESS
19
Processing and analyzing the data
Formulating conclusions and
preparing the report
Defining the new problem And so
on

4.1 The Study
The study is conducted in Indore. The study covers different income group of people. It tells
factors why people are using it or not using it.
4.2 The Sample Design
The target respondents are the housewives, retailers and the sales men of shopping mal. The
questionnaire is developed after a pilot survey of some housewives and senior citizens.
Following is the data collection table from the targeted respondents:
Table 4.1: Respondents Profile
Low
Income
Middle
Income
High Income Total
House wives 10 30 10 50
Working Women 10 5 5 20
Senior Citizens 10 5 5 20
Sellers* 4 4 2 10
Total 34 44 22 100
*Low income seller = Local Chakki Owners
Middle income seller = Mom and Pop Store Owners
High income seller = Sales men from shopping malls
In this study, I have taken total 100 respondents from various locations of Indore. Table 4.1
shows the profile of the respondents. The sample is designed in such a way that it is true
representative of the customers. There are mainly four types of respondents, i.e., house wives,
senior citizens, sellers and working wives. All these respondents come from various income
groups. For example, I have taken 10 senior citizens from low income families. This way I have
taken 34, 44 and 22 respondents from low income, middle income and low income families.
20

4.3 Tools for Data Collection
The data has been collected through schedules where the surveyor asked the questions in the
schedule and marked and noted the responses.
4.4 Review of Literature
There are many studies conducted in the buying behavior of people but as such no study has
been conducted to find out the factors responsible for low sales of atta, in particular. The
preferences of the consumers clearly indicate their priority for cleanliness/ freshness of food
products followed by price, quality, variety, packaging, and non-seasonal availability in the food
market and grocery market. (Ali et al, 2010)
Ready to Cook Food
The instant food market in India seems to have taken off this time around, after a few tries
sometime over the last few decades. For a long long time, Nestles Maggi noodles were about the
only big player. Brands like Top Ramen have provided some competition, but only just. With the
recent (reasonable) successes of MTR and Aashirvaad (ITC again) ready to eat foods, it looks
like this market is finally picking up.
Many factors seem to have contributed, part of which is perhaps, the critical mass of nuclear
families with both husband and wife working. Also, the fact that ready to eat stuff is fairly
affordably priced ( about 35 odd rupees per person) and it is far better than eating at a hotel day
in and day out and can be conveniently stored at home for use on a need-to basis.
The ready to eat available today is also more ready to eat than the ready to cook vermicellli and
other mixes that are available in the market. They are neatly packed, quality is assured (there are
hiccups, as I once found out). These are simple microwave and eat or boil the pack in water, eat.
Would I prefer ready to eat over home cooked food? Not yet. In India home cooked food is the
first choice. Eating out is a second choice often, a necessity. Ready to eat lets one be at home
without having to cook (Restaurant home delivery options do exist, but I would count this among
the people who eat out anyway).
21

While this market will grow, there is still space for conveniences to ease cooking, but only if
there is no compromise on the taste, health and cost front. Heat and eat chapatis did not do too
well because of their tendency to crumble on heating. The ready made spice mixes
(masalas) , Everest is the most well known, are a fixture in most Indian kitchen these days as are
ready to use Ginger Garlic pastes and its derivatives. Ready to use Idli batter is available in most
places. Ready to use tamarind mix, coconut milk have not made so much headway.
Ready-Cooked Foods
More and more cooked food canned or otherwise, is taking its place in the market. When canned
goods were first manufactured on a large scale they comprised fruits, vegetables, meats, and fish,
but we are now accustomed to a miscellaneous variety, including soups, baked beans, puddings,
and pudding sauces, spaghetti, hashed meat, and shellfish. Bakery products have a
larger sale than ever, and are found in small towns and even in country districts carried there by
bakers' wagons. In our large cities we find the "delicatessen shop ' very common, where small
portions of cooked meats and fowl may be purchased after the custom of Europe, and these
stores are open even on Sunday.
How shall we decide what is best for us in our buying? We must not condemn entirely the
buying of cooked food without a careful study of the situation. The custom has grown with
changes in our mode of living, especially in cities, where the small apartment is common, and
where gas is the fuel. Under these conditions it is difficult to prepare foods that need long and
slow cooking, and these processes are more expensive when gas is used. The long slow cooking
of soup and beans, the even baking of bread, are difficult to accomplish. The odors from these
processes fill the small apartment, and scent it for some time, and this is unpleasant at all
seasons.
Take another example, the canning and preserving of fruits. The first cost of the fruit is usually
high in the city, and this plus the sugar and the gas, and the labor and the lack of storage space
make it seem impracticable in these conditions, and many people decide in favor of buying
goods already canned. Such housekeeping is simplified by buying cooked products to some
extent. The fireless cooker helps here, but not for all processes. Counting in fuel, the cost is not
so much greater as we might suppose; and comfort and convenience are increased. Under other
22
conditions, even in the city, a different conclusion is reached. If coal is the fuel, and a steady fire
is kept, perhaps in winter for heating purposes, then it is economy to cook most food materials at
home.
In the country and small village different conditions prevail. Here the abundance of certain fruits
in season makes it economical to can and dry, even counting fuel and labor. In some sections
many people can their own vegetables also. However, even in the country in the summer, it is a
decided relief to the farmer's wife, probably short of "help," to win a little leisure by buying
staple bakery products. Here if strict economy is not necessary, is it not better to save strength
rather than money? Each housekeeper must work out these problems for herself.
Marketing Mix
What is the marketing mix?
The marketing mix is probably the most famous marketing term. Its elements are the basic,
tactical components of a marketing plan. Also known as the Four P's, the marketing
mix elements are price, place, product, and promotion. Read on for more details on
the marketing mix.
23

Price
There are many ways to price a product. Let's have a look at some of them and try to understand
the best policy/strategy in various situations.
Premium PricingUse a high price where there is uniqueness about the product or service. This approach is used
where a a substantial competitive advantage exists. Such high prices are charge for luxuries such
as Cunard Cruises, Savoy Hotel rooms, and Concorde flights.
Penetration Pricing
The price charged for products and services is set artificially low in order to gain market share.
Once this is achieved, the price is increased. This approach was used by France Telecom and Sky
TV.
Economy PricingThis is a no frills low price. The cost of marketing and manufacture are kept at a minimum.
Supermarkets often have economy brands for soups, spaghetti, etc.
Price Skimming
Charge a high price because you have a substantial competitive advantage. However, the
advantage is not sustainable. The high price tends to attract new competitors into the market, and
24

the price inevitably falls due to increased supply. Manufacturers of digital watches used a
skimming approach in the 1970s. Once other manufacturers were tempted into the market and
the watches were produced at a lower unit cost, other marketing strategies and pricing
approaches are implemented.
Premium pricing, penetration pricing, economy pricing, and price skimming are the four main
pricing policies/strategies. They form the bases for the exercise. However there are other
important approaches to pricing.
Psychological PricingThis approach is used when the marketer wants the consumer to respond on an emotional, rather
than rational basis. For example, price point perspective is 99 cents not one dollar.
Product Line PricingWhere there is a range of product or services the pricing reflect the benefits of parts of the range.
For example car washes. Basic wash could be $2, wash and wax $4, and the whole package $6.
Optional Product PricingCompanies will attempt to increase the amount customer spend once they start to buy. Optional
'extras' increase the overall price of the product or service. For example airlines will charge for
optional extras such as guaranteeing a window seat or reserving a row of seats next to each other.
Captive Product PricingWhere products have complements, companies will charge a premium price where the consumer
is captured. For example a razor manufacturer will charge a low price and recoup its margin (and
more) from the sale of the only design of blades which fit the razor.
Product Bundle PricingHere sellers combine several products in the same package. This also serves to move old stock.
Videos and CDs are often sold using the bundle approach.
Promotional PricingPricing to promote a product is a very common application. There are many examples of
promotional pricing including approaches such as BOGOF (Buy One Get One Free).
25

Geographical PricingGeographical pricing is evident where there are variations in price in different parts of the world.
For example rarity value, or where shipping costs increase price.
Value PricingThis approach is used where external factors such as recession or increased competition force
companies to provide 'value' products and services toretain sales e.g. value meals at McDonalds.
PlaceAnother element of Neil H.Borden's Marketing Mix is Place. Place is also known as channel,
distribution, or intermediary. It is the mechanism through which goods and/or services are
moved from the manufacturer/ service provider to the user or consumer.
There are six basic 'channel' decisions:
Do we use direct or indirect channels? (e.g. 'direct' to a consumer, 'indirect' via a wholesaler).
Single or multiple channels.
Cumulative length of the multiple channels.
Types of intermediary (see later).
Number of intermediaries at each level (e.g. how many retailers in Southern Spain).
Which companies as intermediaries to avoid ‘intra channel conflict’ (i.e. infighting between
local distributors)?
Selection Consideration - how do we decide upon a distributor?
Market segment - the distributor must be familiar with your target consumer and segment.
Changes during the product life cycle - different channels can be exploited at different points
in the PLC e.g. Foldaway scooters are now available everywhere. Once they were sold via a
few specific stores.
Producer - distributor fit - Is there a match between their polices, strategies, image, and
yours? Look for 'synergy'.
Qualification assessment - establishes the experience and track record of your intermediary.
How much training and support will your distributor require?
26

Types of Channel Intermediaries.
There are many types of intermediaries such as wholesalers, agents, retailers, the Internet,
overseas distributors, direct marketing (from manufacturer to user without an intermediary), and
many others. The main modes of distribution will be looked at in more detail.
1. Channel Intermediaries – Wholesalers
They break down 'bulk' into smaller packages for resale by a retailer.
They buy from producers and resell to retailers. They take ownership or 'title' to goods whereas
agents do not (see below).
They provide storage facilities. For example, cheese manufacturers seldom wait for their product
to mature. They sell on to a wholesaler that will store it and eventually resell to a retailer.
Wholesalers offer reduce the physical contact cost between the producer and consumer e.g.
customer service costs, or sales force costs.
A wholesaler will often take on the some of the marketing responsibilities. Many produce their
own brochures and use their own telesales operations.
3. Channel Intermediaries – Agents
Agents are mainly used in international markets.
An agent will typically secure an order for a producer and will take a commission. They do
not tend to take title to the goods. This means that capital is not tied up in goods. However, a
'stockiest agent' will hold consignment stock (i.e. will store the stock, but the title will remain
with the producer. This approach is used where goods need to get into a market soon after the
order is placed e.g. foodstuffs).
27
Agents can be very expensive to train. They are difficult to keep control of due to the
physical distances involved. They are difficult to motivate.
4. Channel Intermediaries – Retailers
Retailers will have a much stronger personal relationship with the consumer.
The retailer will hold several other brands and products. A consumer will expect to be
exposed to many products.
Retailers will often offer credit to the customer e.g. electrical wholesalers, or travel agents.
Products and services are promoted and merchandised by the retailer.
The retailer will give the final selling price to the product.
Retailers often have a strong 'brand' themselves e.g. Ross and Wall-Mart in the USA, and
Alisuper, Modelo, and Jumbo in Portugal.
5. Channel Intermediaries – Internet
The Internet has a geographically disperse market.
The main benefit of the Internet is that niche products reach a wider audience e.g. Scottish
Salmon direct from an Inverness fishery.
There are low barriers low barriers to entry as set up costs are low.
Use e-commerce technology (for payment, shopping software, etc.)
There is a paradigm shift in commerce and consumption which benefits distribution via the
Internet
Product
For many a product is simply the tangible, physical entity that they may be buying or selling.
You buy a new car and that's the product - simple! Or maybe not. When you buy a car, is the
product more complex than you first thought?
The Product Life Cycle (PLC) is based upon the biological life cycle. For example, a seed is
planted (introduction); it begins to sprout (growth); it shoots out leaves and puts down roots as it
28
becomes an adult (maturity); after a long period as an adult the plant begins to shrink and die out
(decline).
The Customer Life Cycle (CLC) has obvious similarities with the Product Life Cycle (PLC).
However, CLC focuses upon the creation of and delivery of lifetime value to the customer i.e.
looks at the products or services that customers NEED throughout their lives.
These are known as the 'Three Levels of a Product.' So what is the difference between the three
products, or more precisely 'levels?'
The CORE product is NOT the tangible, physical product. You can't touch it. That's because the
core product is the BENEFIT of the product that makes it valuable to you. So with the car
example, the benefit is convenience i.e. the ease at which you can go where you like, when you
want to. Another core benefit is speed since you can travel around relatively quickly.
The ACTUAL product is the tangible, physical product. You can get some use out of it. Again
with the car example, it is the vehicle that you test drive, buy and then collect.
The AUGMENTED product is the non-physical part of the product. It usually consists of lots of
added value, for which you may or may not pay a premium. So when you buy a car, part of the
augmented product would be the warranty, the customer service support offered by the car's
manufacture, and any after-sales service.
Another marketing tool for evaluating product is the product life cycle.
29
Promotion
Another one of the 4P's is promotion. This includes all of the tools available to the marketer for
'marketing communication'. As with Neil H.Borden's marketing mix, marketing communications
has its own 'promotions mix.' Think of it like a cake mix, the basic ingredients are always the
same. However if you vary the amounts of one of the ingredients, the final outcome is different
The elements of the promotions mix are:
Personal Selling.
Sales Promotion.
Public Relations.
Direct Mail.
Trade Fairs and Exhibitions.
Advertising.
Sponsorship.
The elements of the promotions mix are integrated to form a coherent campaign. As with all
forms of communication. The message from the marketer follows the 'communications process'
as illustrated above. For example, a radio advert is made for a car manufacturer. The car
manufacturer (sender) pays for a specific advert with contains a message specific to a target
audience (encoding). It is transmitted during a set of commercials from a radio station (Message /
media).
30

The message is decoded by a car radio (decoding) and the target consumer interprets the message
(receiver). He or she might visit a dealership or seek further information from a web site
(Response). The consumer might buy a car or express an interest or dislike (feedback). This
information will inform future elements of an integrated promotional campaign. Perhaps a direct
mail campaign would push the consumer to the point of purchase. Noise represents the thousand
of marketing communications that a consumer is exposed to everyday, all competing for
attention.
The Promotions Mix.
Let us look at the individual components of the promotions mix in more detail. Remember all of
the elements are 'integrated' to form a specific communications campaign.
1. Personal Selling.Personal Selling is an effective way to manage personal customer relationships. The sales person
acts on behalf of the organization. They tend to be well trained in the approaches and techniques
of personal selling. However sales people are very expensive and should only be used where
there is a genuine return on investment. For example salesmen are often used to sell cars or home
improvements where the margin is high.
2. Sales Promotion.Sales promotion tends to be thought of as being all promotions apart from advertising, personal
selling, and public relations. For example the BOGOF promotion, or Buy One Get One Free.
Others include couponing, money-off promotions, competitions, free accessories (such as free
blades with a new razor), introductory offers (such as buy digital TV and get free installation),
and so on. Each sales promotion should be carefully cost and compared with the next best
alternative.
3. Public Relations (PR).Public Relations is defined as 'the deliberate, planned and sustained effort to establish and
maintain mutual understanding between an organization and its publics' (Institute of Public
Relations). It is relatively cheap, but certainly not cheap. Successful strategies tend to be long-
term and plan for all eventualities. All airlines exploit PR; just watch what happens when there is
31

a disaster. The pre-planned PR machine clicks in very quickly with a very effective rehearsed
plan.
4. Direct Mail.Direct mail is very highly focused upon targeting consumers based upon a database. As with all
marketing, the potential consumer is 'defined' based upon a series of attributes and similarities.
Creative agencies work with marketers to design a highly focused communication in the form of
a mailing. The mail is sent out to the potential consumers and responses are carefully monitored.
For example, if you are marketing medical text books, you would use a database of doctors'
surgeries as the basis of your mail shot.
5. Trade Fairs and Exhibitions.Such approaches are very good for making new contacts and renewing old ones. Companies will
seldom sell much at such events. The purpose is to increase awareness and to encourage trial.
They offer the opportunity for companies to meet with both the trade and the consumer. Expo
has recently finish in Germany with the next one planned for Japan in 2005, despite a recent
decline in interest in such events.
6. Advertising.Advertising is a 'paid for' communication. It is used to develop attitudes, create awareness, and
transmit information in order to gain a response from the target market. There are many
advertising 'media' such as newspapers (local, national, free, trade), magazines and journals,
television (local, national, terrestrial, satellite) cinema, outdoor advertising (such as posters, bus
sides).
7. Sponsorship.Sponsorship is where an organization pays to be associated with a particular event, cause or
image. Companies will sponsor sports events such as the Olympics or Formula One. The
attributes of the event are then associated with the sponsoring organization.
Physical EvidencePhysical Evidence is the material part of a service. Strictly speaking there are no physical
attributes to a service, so a consumer tends to rely on material cues. There are many examples of
physical evidence, including some of the following:
32

There are many examples of physical evidence, including some of the following:
Packaging. Internet/web pages. Paperwork (such as invoices, tickets and dispatch notes). Brochures. Furnishings. Signage (such as those on aircraft and vehicles). Uniforms. Business cards. The building itself (such as prestigious offices or scenic headquarters). Mailboxes and many others . . . . . .
A sporting event is packed full of physical evidence. Your tickets have your team's logos printed
on them, and players are wearing uniforms. The stadium itself could be impressive and have an
electrifying atmosphere. You travelled there and parked quickly nearby, and your seats are
comfortable and close to restrooms and store. All you need now is for your team to win!
Some organizations depend heavily upon physical evidence as a means of marketing
communications, for example tourism attractions and resorts (e.g. Disney World), parcel and
mail services (e.g. UPS trucks), and large banks and insurance companies (e.g. Lloyds of
London).
People
People are the most important element of any service or experience. Services tend to be
produced and consumed at the same moment, and aspects of the customer experience are altered
to meet the 'individual needs' of the person consuming it.
TrainingAll customer facing personnel need to be trained and developed to maintain a high quality of
personal service. Training should begin as soon as the individual starts working for an
organization during an induction. The induction will involve the person in the organization's
culture for the first time, as well as briefing him or her on day-to-day policies and procedures. At
this very early stage the training needs of the individual are identified. A training and
33

development plan is constructed for the individual which sets out personal goals that can be
linked into future appraisals. In practice most training is either 'on-the-job' or 'off-the-job.' On-
the-job training involves training whilst the job is being performed e.g. training of bar staff. Off-
the-job training sees learning taking place at a college, training centre or conference facility.
Attention needs to be paid to Continuing Professional Development (CPD) where employees see
their professional learning as a lifelong process of training and development.
Personal Selling
There are different kinds of salesperson. There is the product delivery salesperson. His or her
main task is to deliver the product, and selling is of less importance e.g. fast food, or mail. The
second type is the order taker, and these may be either 'internal' or 'external.' The internal sales
person would take an order by telephone, e-mail or over a counter. The external sales person
would be working in the field. In both cases little selling is done. The next sort of sales person is
the missionary.
Here, as with those missionaries that promote faith, the salesperson builds goodwill with
customers with the longer-term aim of generating orders. Again, actually closing the sale is not
of great importance at this early stage. The forth type is the technical sales person, e.g. a
technical sales engineer. Their in-depth knowledge supports them as they advise customers on
the best purchase for their needs. Finally, there are creative sellers. Creative sellers work to
persuade buyers to give them an order. This is tough selling, and tends to o ffer the biggest
incentives. The skill is identifying the needs of a customer and persuading them that they need to
satisfy their previously unidentified need by giving an order.
Customer ServiceMany products, services and experiences are supported by customer services teams. Customer
services provided expertise (e.g. on the selection of financial services), technical support(e.g.
offering advice on IT and software) and coordinate the customer interface (e.g. controlling
service engineers, or communicating with a salesman). The disposition and attitude of such
people is vitally important to a company. The way in which a complaint is handled can mean the
difference between retaining or losing a customer, or improving or ruining a company's
reputation. Today, customer service can be face-to-face, over the telephone or using the Internet.
People tend to buy from people that they like, and so effective customer service is vital.
34

Customer services can add value by offering customers technical support and expertise and
advice.
Another view is that marketing has a number of processes that integrate together to create an
overall marketing process, for example - telemarketing and Internet marketing can be integrated.
A further view is that marketing processes are used to control the marketing mix, i.e. processes
that measure the achievement marketing objectives. All views are understandable, but not
particularly customer focused.
For the purposes of the marketing mix, process is an element of service that sees the customer
experiencing an organization’s offering. It's best viewed as something that your customer
participates in at different points in time. Here are some examples to help your build a picture of
marketing process, from the customer's point of view.
Going on a cruise - from the moment that you arrive at the dockside, you are greeted; your
baggage is taken to your room. You have two weeks of services from restaurants and evening
entertainment, to casinos and shopping. Finally, you arrive at your destination, and your baggage
is delivered to you. This is a highly focused marketing process.
Booking a flight on the Internet - the process begins with you visiting an airline's website. You
enter details of your flights and book them. Your ticket/booking reference arrive by e-mail or
post. You catch your flight on time, and arrive refreshed at your destination. This is all part of
the marketing process.
At each stage of the process, markets: Deliver value through all elements of the marketing mix. Process, physical evidence and
people enhance services.
Feedback can be taken and the mix can be altered.
Customers are retained, and other serves or products are extended and marked to them.
The process itself can be tailored to the needs of different individuals, experiencing a similar
service at the same time.
Processes essentially have inputs, throughputs and outputs (or outcomes). Marketing adds value
to each of the stages. Take a look at the lesson on value chain analysis to consider a series of
processes at work.
35

ProcessProcess is another element of the extended marketing mix, or 7P's.There are a number of
perceptions of the concept of process within the business and marketing literature. Some see
processes as a means to achieve an outcome, for example - to achieve a 30% market share a
company implements a marketing planning process.
Another view is that marketing has a number of processes that integrate together to create an
overall marketing process, for example - telemarketing and Internet marketing can be integrated.
A further view is that marketing processes are used to control the marketing mix, i.e. processes
that measure the achievement marketing objectives. All views are understandable, but not
particularly customer focused.
For the purposes of the marketing mix, process is an element of service that sees the customer
experiencing an organisation's offering. It's best viewed as something that your customer
participates in at different points in time. Here are some examples to help your build a picture of
marketing process, from the customer's point of view.
Going on a cruise - from the moment that you arrive at the dockside, you are greeted; your
baggage is taken to your room. You have two weeks of services from restaurants and evening
entertainment, to casinos and shopping. Finally, you arrive at your destination, and your baggage
is delivered to you. This is a highly focused marketing process.
Booking a flight on the Internet - the process begins with you visiting an airline's website. You
enter details of your flights and book them. Your ticket/booking reference arrive by e-mail or
post. You catch your flight on time, and arrive refreshed at your destination. This is all part of
the marketing process.
At each stage of the process, markets: Deliver value through all elements of the marketing mix. Process, physical evidence and people
enhance services.
Feedback can be taken and the mix can be altered.
Customers are retained, and other serves or products are extended and marked to them.
36

The process itself can be tailored to the needs of different individuals, experiencing a similar
service at the same time.
Processes essentially have inputs, throughputs and outputs (or outcomes). Marketing adds value
to each of the stages. Take a look at the lesson on value chain analysis to consider a series of
processes at work.
A STUDY OF CRITICAL FACTORS RESPONSIBLE FOR THE LOW
SALES OF PACKAGED ATTA
CHAPTER-5
37

Data Analysis and Results
A STUDY OF CRITICAL FACTORS RESPONSIBLE FOR THE LOW
SALES OF PACKAGED ATTA
5. Data Analysis and Results
5.1 Hypotheses
The previous researchers have concluded that there is total 3% population that uses packaged
atta. The previous research does not do the specific analysis for families with low, middle and
high incomes. The above mentioned hypothesis is tested for families with different income
groups.
38

(1) Usage of packaged atta in various income families
H0: P = 0.03
Null Hypothesis is that only 3 percent families use the packaged Atta
H1: P > 0.03
Alternative Hypothesis is that more than 3 percent families use packaged Atta
Analysis for low income families - Low income families, in this study, means the families
having a sum total of family income up to Rs 10,000 per month. The responses of members from
low families are given in the table below:
Table 5.1: Use of Packaged Atta in Low Income Families
Response No. of Respondents
Yes 2
No 32
Total 34
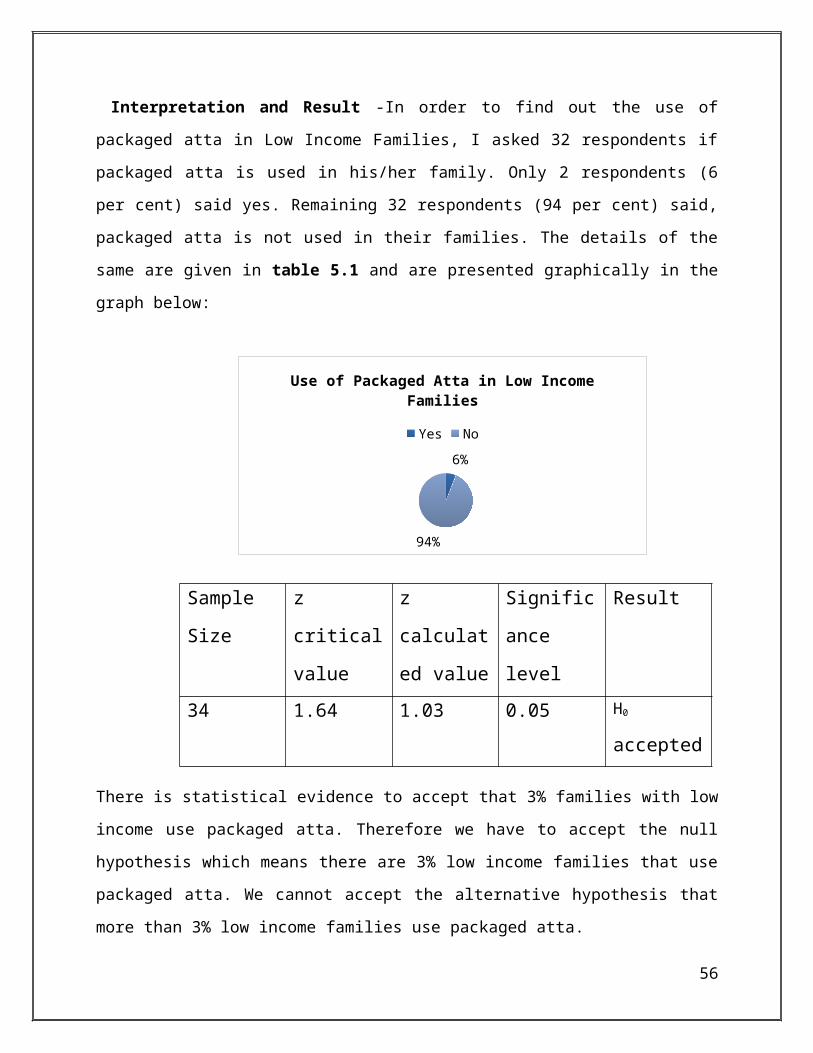
Interpretation and Result -In order to find out the use of packaged atta in Low Income
Families, I asked 32 respondents if packaged atta is used in his/her family. Only 2 respondents (6
per cent) said yes. Remaining 32 respondents (94 per cent) said, packaged atta is not used in their
families. The details of the same are given in table 5.1 and are presented graphically in the graph
below:
6%
94%
Use of Packaged Atta in Low Income Families
Yes No
39

Sample
Size
z critical
value
z calculated
value
Significance
level
Result
34 1.64 1.03 0.05 H0 accepted
There is statistical evidence to accept that 3% families with low income use packaged atta.
Therefore we have to accept the null hypothesis which means there are 3% low income families
that use packaged atta. We cannot accept the alternative hypothesis that more than 3% low
income families use packaged atta.
Analysis for middle income families - Middle income families, in this study, means the families
having a sum total of family income between Rs 15,000 and Rs 40,000 per month. The responses
of members from middle income families are given in the table below:
Table 5.2: Use of Packaged Atta in Middle Income Families
Response No. of Respondents
Yes 6
No 38
Total 44
Interpretation and Result -In order to find out the use of packaged atta in middle Income
Families, I asked 44 respondents if packaged atta is used in his/her family. Only 6 respondents
(14 per cent) said yes. Remaining 38 respondents (86 per cent) said, packaged atta is not used in
their families. The details of the same are given in table 5.2 and are presented graphically in the
graph below:
40

14%
86%
Use of Packaged Atta in Middle Income Family
Yes No
There is no statistical evidence to accept that 3% families with middle income use packaged atta.
Therefore we have to accept the null hypothesis which means there are more than 3% middle
income families that use packaged atta. Analysis for high income families - High income
families, in this study, means the families having a sum total of family income more than Rs
40,000 per month. The responses of members from low families are given in the table below:
Table 5.3: Use of Packaged Atta in High Income Families
Response No. of Respondents
Yes 8
No 14
Total 22
41
Sample
Size
z critical
value
z calculated
value
Significance
level
Result
44 1.64 4.09 0.05 H0 not accepted
Interpretation and Result -In order to find out the use of packaged atta in High Income
Families, I asked 22 respondents if packaged atta is used in his/her family. 8 respondents (36 per
cent) said yes. Remaining 14 respondents (64 per cent) said, packaged atta is not used in their
families. The details of the same are given in table 5.3 and are presented graphically in the graph
below:
36%
64%
Use of Packaged Atta in High Income Families
Yes No
There is no statistical evidence to accept that 3% families with high income use packaged atta.
Therefore we have to accept the null hypothesis which means there are more than 3% high
income families that use packaged atta.
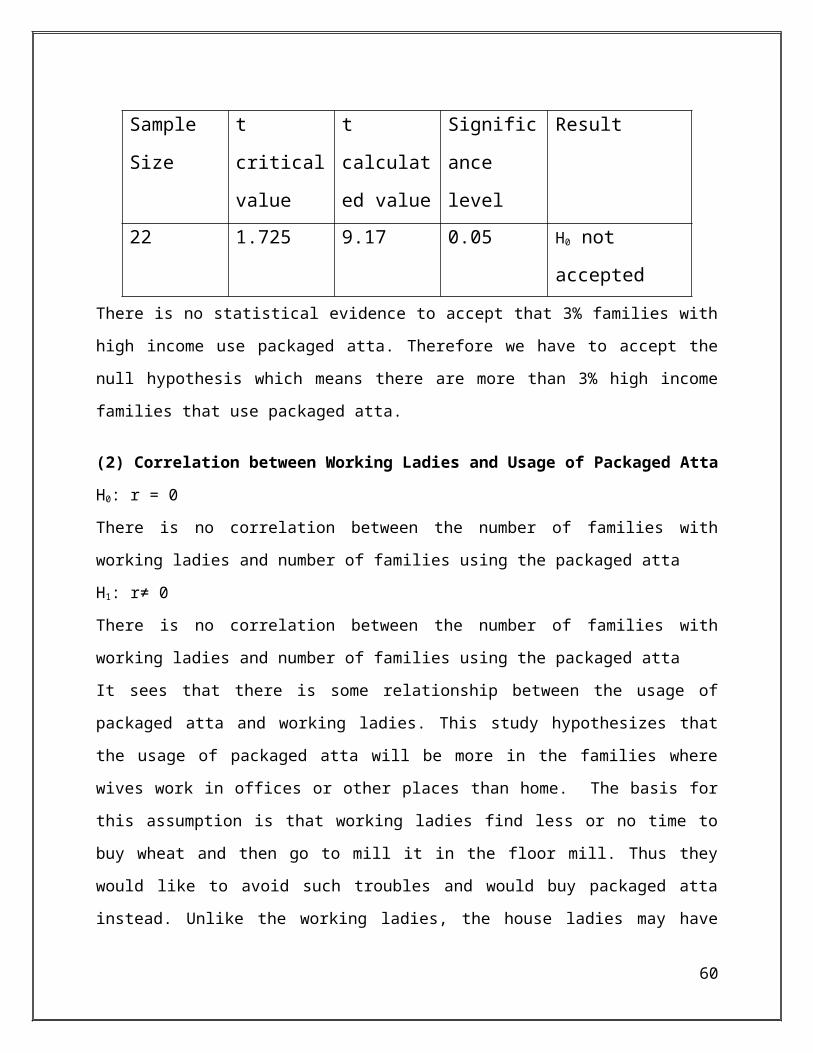
(2) Correlation between Working Ladies and Usage of Packaged Atta
H0: r = 0
There is no correlation between the number of families with working ladies and number of
families using the packaged atta
H1: r≠ 0
There is no correlation between the number of families with working ladies and number of
families using the packaged atta
42
Sample
Size
t critical
value
t calculated
value
Significance
level
Result
22 1.725 9.17 0.05 H0 not accepted

It sees that there is some relationship between the usage of packaged atta and working ladies.
This study hypothesizes that the usage of packaged atta will be more in the families where wives
work in offices or other places than home. The basis for this assumption is that working ladies
find less or no time to buy wheat and then go to mill it in the floor mill. Thus they would like to
avoid such troubles and would buy packaged atta instead. Unlike the working ladies, the house
ladies may have enough time to buy wheat, clean it, and then get it milled in the nearby atta
chakki.
Table 5.4: Relation between number of families with low income and number of families
using packaged atta
Locality No. of families with working
ladies
No. of families where packaged atta is used
Vijaynagar 8 8
LIG 9 6
Sudama Nagar 2 1
Patnipura 4 2
Palasia 5 3
Gita Bhavan 6 6
Dewas Naka 2 3
Annapurna 2 3
Bhanvarkua 3 2
Rajbada 5 4
Interpretation and Result -In order to find out the correlation between the families using
packaged atta and families with working women I asked two question to each family from
various locations of Indore. In each of the location I selected 10 families. The total number of
locations is 10. For example, in Rajbada, there were 5 families with working ladies and 4
families used the packaged atta. These may or may not be from the same families which have
working ladies. This way, I asked these questions to 100 families. The details of the responses
are shown in table 5.4, and are presented graphically in the graph below:
43

1 2 3 4 5 6 7 8 9 100
1
2
3
4
5
6
7
8
9
f(x) = 0.723404255319149 x + 0.872340425531916R² = 0.745325596389426
Families with Working Ladies and Usage of Packaged Atta
No. of Families with Working Ladies
No.
of F
amili
es U
sing
Pack
aged
Att
a
Sample Size r critical value r calculated value Significance
level
Result
10 0.632 0.86 0.05 H0 not accepted
We conclude that there is significant correlation between the number of families with working
ladies and number of families using packaged atta.
(3) Correlation between number of low income families and usage of packaged atta
H0: r = 0
Null Hypothesis is that there is no correlation between income of the household and
usage of packaged atta
H1: P ≠ 0
Alternative Hypothesis is that there is significant correlation between income of the
household and usage of packaged atta
44

Table 5.5: Relation between number of families with low income and number of
families using packaged atta
Location
Number of Families with
low Income
Number of families using
packaged atta
Vijaynagar 4 8
LIG 5 5
Sudama Nagar 3 7
Patnipura 8 2
Palasia 4 6
Gita Bhavan 7 4
Dewas Naka 6 4
Annapurna 2 9
Bhanvarkua 7 2
Rajbada 6 5
Interpretation and Result -In order to find out the correlation between the families using
packaged atta and low income families, I asked two questions to each family from various
locations of Indore. In each of the location I selected 10 families. The total number of locations
is 10. For example, in Sudama Nagar, there were 3 low income families and 7 families used the
packaged atta. These may or may not be from the same low income families. This way, I asked
these questions to 100 families. The details of the responses are shown in table 5.5, and are
presented graphically in the graph below:
45

1 2 3 4 5 6 7 8 90
1
2
3
4
5
6
7
8
9
10
f(x) = − 1.14285714285714 x + 11.1428571428571R² = 0.884792626728111
Low Income Families and Usage of Packaged Atta
No. of families with low income
No.
of f
amili
es u
sing
pack
aged
att
a
Interpretation and Result -We conclude that there is significant negative correlation between
the number of families with working ladies and number of families using packaged atta. The
analysis also suggests that the relationship between the two variables in negative.
Table 5.6: Rating of the critical factors for demand of Packaged Atta
Factor/Rating R1 R2 R3 R4 Total
Better Quality Perception 26 34 28 12 100
Availability in vicinity 40 33 22 5 100
Convenient 54 32 10 4 100
Advertised Nutritious Values 15 29 36 20 100
46
Sample Size r critical value r calculated value Significance
level
Result
10 0. 632 -0.94 0.05 H0 not accepted
In order to find out the critical factors that lead to high demand of packaged atta, I asked them to
rate the factors on their importance wise. For example, 54 respondents said that convenience is
the most important factor responsible for them to buy the packaged atta. It can be said that
convenience and availability in the vicinity are the drivers of high demand of packaged atta. The
details of the responses are shown in table 5.6, and are presented graphically in the graph below:
R1 R2 R3 R40
10
20
30
40
50
60
Rating of the Critical Factors for Demand of Packaged Atta
Better Quality PerceptionAvailibility in vicinityConvenientAdvertised Nutritious Values
Table 5.7: Rating of the Factors of Responsible for the Low Sales of Packaged Atta
Factor/Rating R1 R2 R3 R4 Total
Maida Taste 41 26 20 13 100
Unreliable 57 33 7 3 100
High Price 23 39 22 16 100
Time Availability 34 25 29 12 100
Interpretation and Result -In order to find out the critical factors that cause low demand of
packaged atta, I asked them to rate the factors on their importance wise. For example, 23
respondents said that convenience is the most important factor responsible for them not to buy
47

the packaged atta. It can be said that maida taste and unreliability y are the factors responsible for
low sales of packaged atta. The details of the responses are shown in table 5.7, and are presented
graphically in the graph below:
R1 R2 R3 R40
10
20
30
40
50
60
Rating of the Factors for Low Sales of Atta
Maida TasteUnreliableHigh PriceTime Availibility
Table 5.8: Decision Maker about the brand of packaged atta in family
Housewife 50
Parents 20
Husband 18
Children 2
Total 90
Table 5.8 details the decision makers about the usage of packaged atta in the family. Children
decide the brand of packaged atta only in 2 per cent families while in 56 per cent of the families
housewives decide the brand of packaged atta. Parents decide in 22 per cent of the families
whereas husbands decide in 20 percent of the families. The following graph gives the details of
the decision makers:
48

Husband20%
Housewife56%
Parents22%
Children2%
Decision Makers about the Usage of Packaged Atta
Who cooks food in the family
One of the important factors in the usage of packaged atta is recommendation made by the
person cooking food in home. Therefore it was important to find out who cooks food in homes.
In rural India, almost in every home the food is cooked by family members. Unlike rural India, in
urban areas both husband and wife work which results into the employment of maids in the
cooking of foods. Since there was such study available about the percentage of homes where
food is cooked by maids, I have hypothesized that maids cook food in 10% of the homes. Since
there is diversity in the cooking habits across income groups, hypothesis has been tested for low
income families, middle income families and high income families.
49

Low Income Families
Housewife33%
Working Woman33%
Senior Citizen
33%
Respondents from Low Income Families
H0: Maids cook food in 10% of the families with low income
H1: Maids cook food in less than 10% of the families with low income
Table 5.9: Who cooks food in low income family?
Family Member 28
Maid 2
Total 30
In 97 per cent of the low income families, the food is cooked by family members while in only 3
per cent of the families maid cooks food. Table 5.9 details the same and the responses are shown
in the following graph:
50

Sample Size t table
value
t calculated
value
Significance level Result
30 1.699 -0.602 0.05 H0 not accepted
Interpretation and Result -It can be concluded that in less than 10 per cent families (low
income) the food is cooked by maids.
This conclusion is important because the decision about the packaged atta is likely to be made by
the person cooking food. Since in most of the families with low income food is cooked by family
members, housewife in particular, the decision about the usage of the packaged atta is made by
the housewife.
51
Family Members
93%
Maid7%
Who Cooks Food in Low Income Families

Middle Income Families
Housewife75%
Working Woman13%
Parents13%
Respondents from Middle Class Families
Table 5.10: Who cooks food in middle income families?
Family Member 30
Maid 10
Total 40
Interpretation and Result -In 75 per cent of the middle income families, the food is cooked by
family members while in only 25 per cent of the families maid cooks food. Table 5.10 details the
same and the responses are shown in the following graph:
Family Members
75%
Maid25%
Who cooks food in Middle Income Families
H0: Maids cook food in 10% of the families in urban India
52

H1: Maids cook food in more than 10% of the families in urban India
Sample
Size
t table value t calculated
value
Significance
level
Result
40 1.684 65.22 0.05 H0 not accepted
Interpretation and Result -It can be concluded that in more than 10 per cent families (middle
income) the food is cooked by maids.
High Income Families
Table 5.11: Who cooks food in high income family?
Family Member 10
Maid 10
Total 20
Interpretation and Result -In 50 per cent of the middle income families, the food is cooked by
family members while in 50 per cent of the families maid cooks food. Table 5.11 details the
same and the responses are shown in the following graph:
Family Members
50%Maid50%
Who cooks food in High Income Fam-ilies
H0: Maids cook food in 25% of the families in urban India
H1: Maids cook food in more than 25% of the families in urban India
Sample
Size
t table value t calculated
value
Significance
level
Result
53

20 1.729 2.58 0.05 H0 not accepted
Interpretation and Result -It can be concluded that in more than 25 per cent families (high
income) the food is cooked by maids.
A STUDY OF CRITICAL FACTORS RESPONSIBLE FOR THE LOW
SALES OF PACKAGED ATTA
CHAPTER-6
54

Limitations of the Study
A STUDY OF CRITICAL FACTORS RESPONSIBLE FOR THE LOW
SALES OF PACKAGED ATTA
6. Limitations of the Study
The research project aims at collecting data from urban area. Thus, exclusion of rural area
where approximately 65 per cent of people live would be major limitation.
The sample size of 100 may be limited to conclude the findings for 30 crore people living
in urban area.
It covers only marketing aspect of low sales.
The number of question in questionnaire may not be adequate to know the reason for low
sales.
55
A STUDY OF CRITICAL FACTORS RESPONSIBLE FOR THE LOW
SALES OF PACKAGED ATTA
CHAPTER-7
56

Suggestions and Conclusion
A STUDY OF CRITICAL FACTORS RESPONSIBLE FOR THE LOW SALES OF
PACKAGED ATTA
7. Suggestions and Conclusion
Per capita income in India is increasing. Rural population is also becoming quality conscious.
People are using luxurious products. The cold beverages have made their place in consumers.
Advertisement is driving sales of many products. Business houses are eyeing at the retail
sector as the business of future. People in urban India are getting used to buy vegetables from
organized retail shops. There is cut throat competition among the firms in every walk of
business.
But, India has less than 3 per cent of its population which uses packaged atta. There are three
major players in packaged atta segment. The above two sentences form the basis of the study
57

in the light of the additional fact that atta is the main ingredient of food in almost every state
in India. The study aims at finding out the critical factors responsible for low sales of
packaged atta.
This study is based on the responses of 100 families of different locations in Indore. Data
have been collected by researcher herself. The results show that the quality of packaged atta
is less reliable than the atta grinded in the local chakki. They do not like the taste of atta
because its maida-type fine and lacks fiber. The study finds a significant positive correlation
between the number of families with working ladies and the number of families using
packaged atta. On the other hand, there is significant negative correlation between the number
of families with low income and the number of families using packaged atta. Packaged atta is
used because families report it be convenient than to buy wheat, clean it and then grind it in
vicinity chakki. The availability of packaged atta in vicinity grocery and other stores is
second major reason for people to use it.
The firms producing and selling packaged atta may be benefitted by the findings and
suggestions of the study. It is suggested for the firms to design advertisement for establishing
the reliability of process of manufacturing of packaged atta. Whole wheat atta with little low
price may increase the demand of packaged atta exponentially.
A STUDY OF CRITICAL FACTORS RESPONSIBLE FOR THE LOW
SALES OF PACKAGED ATTA
CHAPTER-858

References
Bibliography
1. Kotler Philip, (2008.) “Marketing Management – Text and Cases”, Pearson Education
a south Asian perspective, 13th Edition
2. Brian Mulian (1999) “The Psychology of Consumer Behavior” Craig Johnson, MPH
Publication New York
3. Robbins, Stephen P. (2008) Organizational Behavior, and New Delhi: Prentice Hall of India.
4. Johnson (2010), “Sales Management”, Mc Graw Hill, 7th Edition.
5. Mary Robert (1999), “Direct Marketing Management”, London: Prentice Hall, 2nd Ed.
59
6. Jerry C. Olson, Thomas J. Reynolds (2001), Understanding Consumer Decision Making: The
Means-End Approach to Marketing and Advertising Strategy, Oxford university Press, Oxford
7. Ali, Jabir, Sanjeev Kapoor and Janakiraman Moorthy, “Buying Behaviour of Consumers for Food
Products in an Emerging Economy”, British Food Journal, Vol. 112 No. 2 (2010): 109-124
Webliography
1. http://timesofindia.indiatimes.com/articleshow/1241069178.cms 2. http://timesofindia.indiatimes.com/city/delhi/-No-mechanism-to-keep-retail-prices-in-check/
articleshow/5717368.cms
3. http://www.indianfoodindustry.net/
4. http://www.indianexpress.com/news/who-are-the-middle-class-in-india/438429/
60

5. http://www.prlog.org/10955354-new-market-study-published-ethical-packaged-food-does-it-
really-have-future.html
6. http://chestofbooks.com/food/household/Foods-And-Household-Management/Ready-Cooked-
Foods.html
7. http://ecophilo.blogspot.com/2005/04/ready-to-eat-or-ready-to-cook.html
A STUDY OF CRITICAL FACTORS RESPONSIBLE FOR THE LOW
SALES OF PACKAGED ATTA
61

Appendices
Appendices
A .Questionnaire
Personal Information
1. Who cooks food in your home:
a. Cook
b. Any other family member
2. Do you use packaged atta in your Home?
a. Yes
b. No
62

3. Total Number of Members in the Family
a. Two
b. 2 – 4
c. 4 – 6
d. More than 6
4. Profession
a. House maker
b. Working
5. Total Family Income per month
a. Up to Rs 10000
b. Rs 10000 – Rs 40000
c. More than Rs 40000
Information relating to consumption pattern
1. How often do you use packaged atta?
1. Daily
2. Occasionally
3. Never
4. When out of stock
2. Why do you not use packaged atta?
a. Unreliability
b. Price
c. Time Availability
d. Taste ( Maida )
3. Are you satisfied with the quality of packaged atta?
a. Excellent
b. Good
63

c. Average
d. poor
4. Are you satisfied with the price?
a. Yes
b. No
5. Do you feel Maida test in packaged atta?
a. Yes
b. No
6. How many brands of packaged atta do you know? Please name them
a. …………………..
b. ………………….
c. …………………..
d. …………………..
e. …………………..
7. Have you seen the advertisement of packaged atta in television, if yes please name
the brand
………………………………………………………………………..
8. Who makes the decision about the brand of the packaged atta in your family?
a. Self
b. Husband
c. Mother In Law/ Parents/ Father in Law
d. Children
9. Which type of improvement would you like to see in the atta you are using currently
64
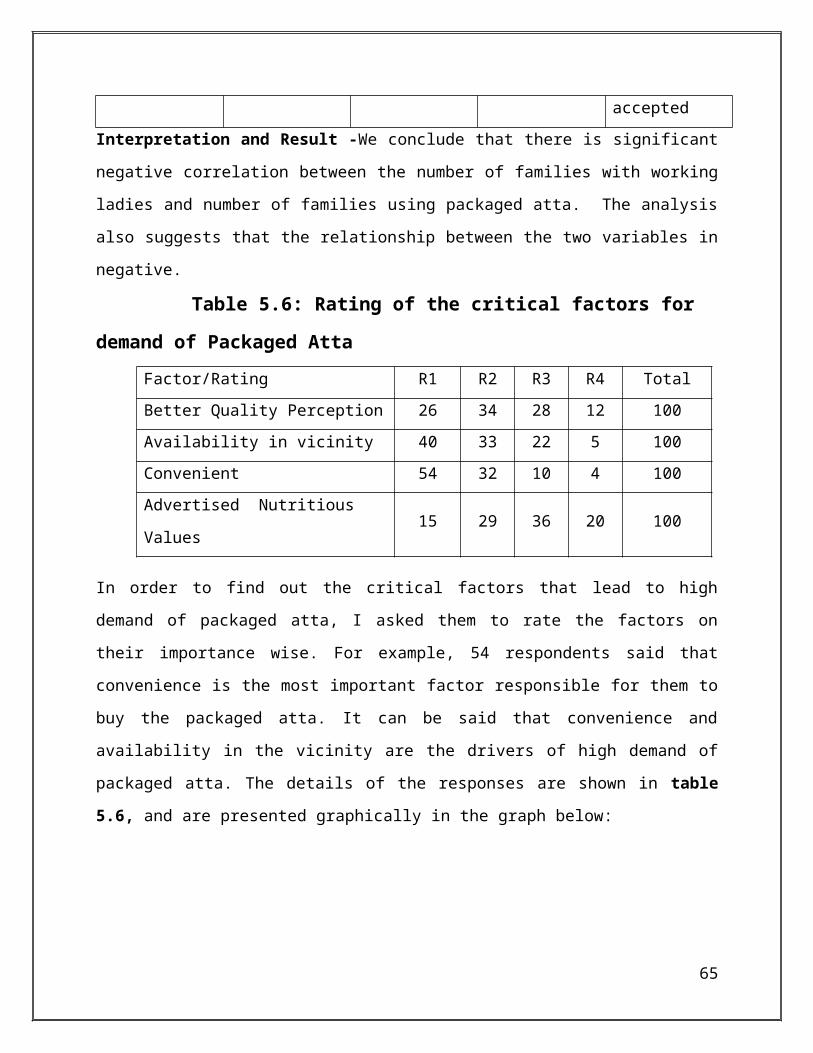
…………………………………………………………………………..
10. How satisfied are you with the packaged atta?
a. Very Satisfied
b. Just Satisfied
c. Dissatisfied
d. Very Dissatisfied
11. Rank the reason for using the packaged atta according to your importance ( Rank
1 means most Important
Factor Rank
Quality
Better Quality Perception
Availability in vicinity
Convenient
Advertised Nutritious Values
Respondents list
Respondent
ProfeSCion
Income ClaSC
Use of Pack Atta
Location
High Sales Rank 1
Low Sales Rank 1
Who cooks
1 HW L N VN BQ MT FM
2 HW L N LG
AV UR FM
3 HW L N SN CT HP FM
4 HW L N PT
AN TA FM
5 HW L N PL UR FM6 HW L N GB UR FM7 HW L N DN UR FM8 HW L N AN UR FM
65
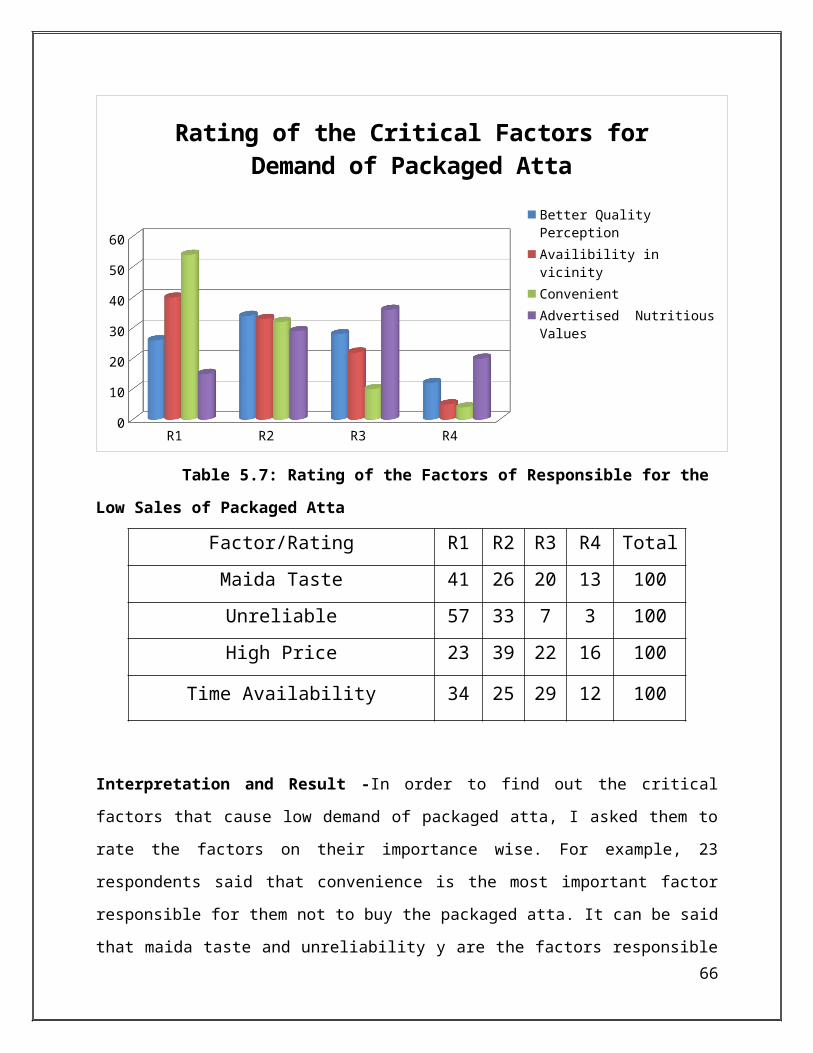
9 HW L N BK FM10 HW L Y RB TA FM11 HW M N VN UR
12 HW M N LG CT13 HW M N SN
14 HW M N PT CT HP
15 HW M N PL UR
16 HW M N GB UR
17 HW M N DN CT MT
18 HW M N AN CT UR
19 HW M N BK CT UR
20 HW M N RB CT UR
21 HW M N VN CT UR
22 HW M N LG CT UR
23 HW M N SN UR
24 HW M N PT UR
25 HW M N PL CT UR
26 HW M N GB CT UR
27 HW M N DN CT TA
28 HW M N AN CT TA
29 HW M N BK CT TA
30 HW M N RB CT MT
31 HW M N VN UR
32 HW M N LG CT HP
33 HW M N SN CT TA
34 HW M N PT MT
35 HW M N PL UR
36 HW M N GB UR
37 HW M N DN CT UR
38 HW M Y AN UR
39 HW M Y BK MT
40 HW M Y RB CT UR
41 HW H N VN HP
42 HW H N LG TA
43 HW H N SN UR
44 HW H N PT UR
45 HW H N PL CT UR
46 HW H N GB MT
47 HW H N DN UR
48 HW H Y AN HP
49 HW H Y BK CT TA
50 HW H Y RB UR
51 WW L N VN HP
52 WW L N LG CT HP MD
53 WW L N SN HP FM54 WW L N PT UR FM55 WW L N PL CT UR FM56 WW L N GB CT HP FM57 WW L N DN CT UR FM58 WW L N AN CT UR FM
66
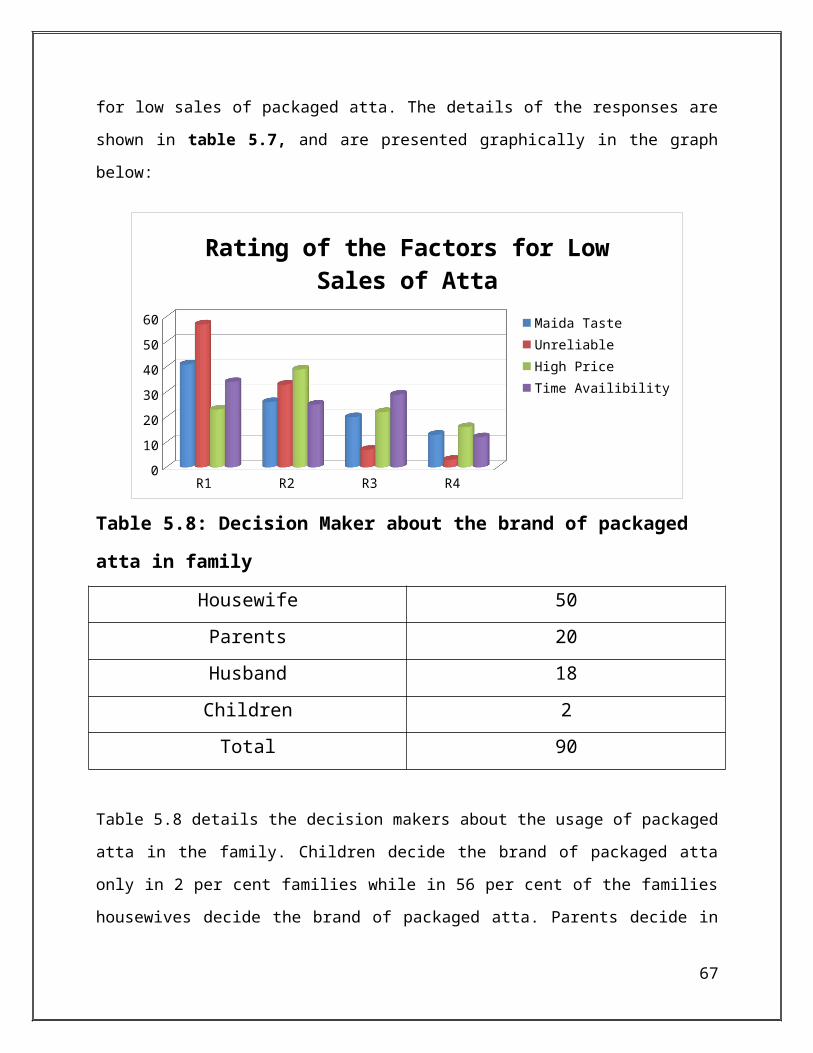
59 WW L N BK CT UR MD
60 WW L N RB UR FM61 WW M N VN UR FM62 WW M N LG UR FM63 WW M N SN UR FM64 WW M Y PT CT UR FM65 WW M Y PL CT MT FM66 WW H N GB CT u FM67 WW H N DN CT UR FM68 WW H N AN CT UR FM69 WW H Y BK CT UR FM70 WW H Y RB CT HP
71 SC L Y VN HP FM72 SC L N LG CT UR FM73 SC L N SN CT UR FM74 SC L N PT CT UR FM75 SC L N PL CT UR FM76 SC L N GB UR FM77 SC L N DN CT UR FM78 SC L N AN CT UR FM79 SC L N BK CT MT FM80 SC L N RB CT MT FM81 SC M N VN CT MT
82 SC M N LG CT MT
83 SC M N SN CT MT
84 SC M N PT CT MT
85 SC M Y PL CT MT
86 SC H Y GB CT HP
87 SC H Y DN HP MD88 SC H Y AN HP FM89 SC H N BK CT HP FM90 SC H N RB UR FM91 S L N LG UR FM92 S L N SN CT UR FM93 S L N PT CT UR FM94 S L N PL CT UR FM95 S M N GB CT UR
96 S M N DN CT MT
97 S M N AN UR
98 S M N BK MT
99 S H N RB UR
100 S H N VN UR
HW 50 34 16 10 54 16 43WW 20 44 84 10 57SC 20 22 10S 10 100 10Total 100 10
101010
67

1010
Percentage Analysis
Table 5.1: Use of Packaged Atta in Low Income Families
Response No. of Respondents %
Yes 2 6
No 32 94
Total 34 100
Table 5.2: Use of Packaged Atta in Middle Income Families
Response No. of Respondents %
Yes 6 14
68

No 38 86
Total 44 100
Table 5.3: Use of Packaged Atta in High Income Families
Response No. of Respondents %
Yes 8 36
No 14 64
Total 22 100
Table5.8: Dicision making about brand %
Housewife 50 56
Parents 20 22
Husband 18 20
Children 2 2
Total 90 100
Table 5.9: Who cooks food in low income family?Family Member 28 93
Maid 2 7
Total 30 100
Table 5.10: Who cooks food in middle income families?Family Member 30 75
Maid 10 25
Total 40 100
Table 5.11: Who cooks food in high income family?
Family Member 10 50
Maid 10 50
Total 20 100
69
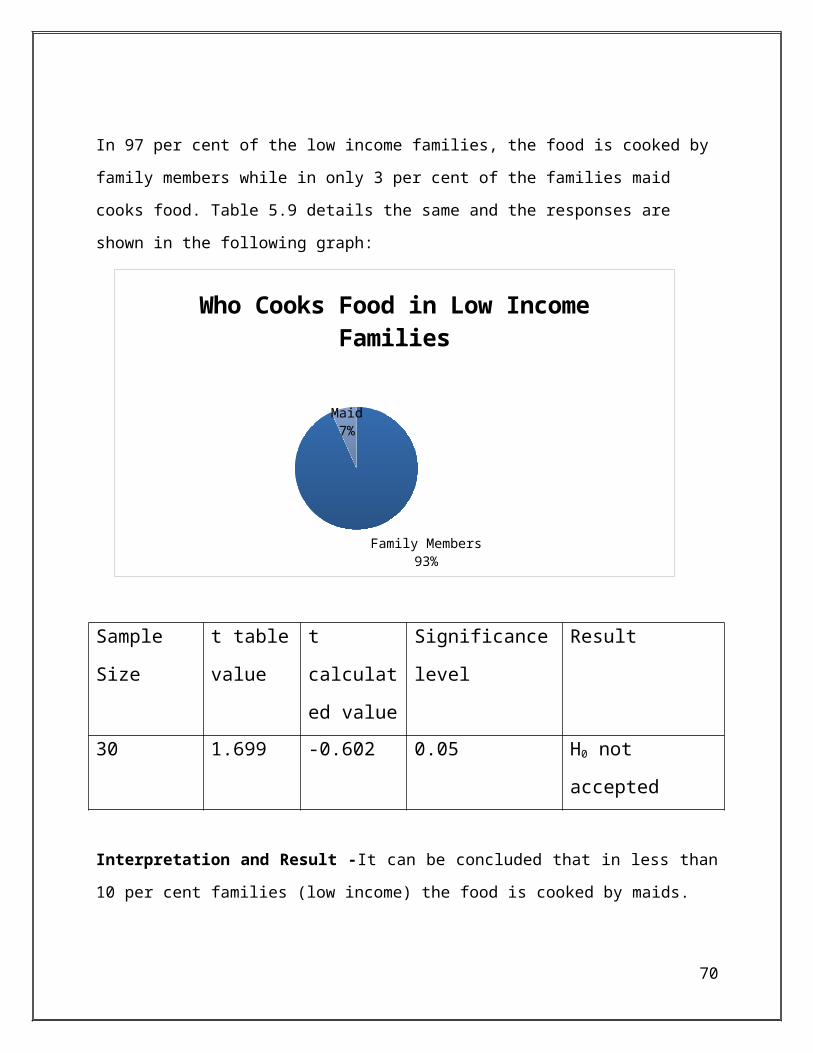
Appendices. D. Synopsis
A STUDY OF CRITICAL FACTORS RESPONSIBLE FOR
LOW SALES OF PACKAGED ATTA
Major Research Project
Submitted by
Sangeeta Pandey
70

Guided by
Ms Richa Darshan
in partial fulfillment for the award of the degree
of
Master of Business Administration
B M COLLEGE OF MANAGEMENT AND RESEARCH, INDORE
DECLARATION
I, Sangeeta Pandey, here by declare that the major research project entitled “ A Study of
Critical Factor Responsible for Low Sales of Packaged Atta” has been undertaken by me
71

under the guidance of Ms Richa Darshan, Professor of B M College of Management &
Research in partial fulfillment of the requirement for the completion of Degree of Master
of Business Administration.
Sangeeta
Pandey
TABLE OF CONTENTS
PAGE NO:
1. INTRODUCTION …………………………………………………………………………...1
1.1 Statement of the Problem………………………………………………………………1
1.2 Objectives………………………………………………………………………………..2
1.3 Scope of the study………………………………………………………………………2
72

1.4 Limitations of the study…………………………………………………………………2
2. REVIEW OF LITERATURE…………………………………………………….2
3. INTRODUCTION TO FOOD INDUSTRY……………………………………...2
4. RESEARCH METHODOLOGY………………………………………………...3
4.1 The study…………………………………………………………………………………3
4.2 The sample design………………………………………………………………………..4
4.3 Tools for data collection…………………………………………………………………4
4.4 Tools for data analysis…………………………………………………………………...4
4.5 Hypothesis………………………………………………………………………………...4
REFERENCE…………………………………………………………………….......5
ANNEXURE 1 – QUESTIONNAIRE………………………………………………6
A Study of Critical Factors Responsible for Low Sales
of Packaged Atta
1. Introduction
Food is powerful symbol of cultural identity; wheat considered to be a staple part of diet for most
of northern and western part of India, is also finding its way into the culinary habits of the south
and the east where rice has traditionally ruled the platter.
73
The bulk of wheat is converted into whole wheat flour or Atta, used to make flat bread or roti.
While Atta and roties are central to Indian food, packaged atta is a novel concept. The market is
characterized by traditional chakki atta, where the housewife buys grain and has it freshly ground
in a local flour mill or chakki. The current size of branded packaged atta is approximately one
million tones or 3% of total market of approximately 45 million tones.
In is a country of unity in diversity. But there is not much variation in the food habits of people.
Particularly when it comes to main component of Indian diet, Roti is indispensible. Except for a
few states in the south, rotis are the main course of Indian food. Roti is made of wheat flour.
Thus considering the amount spent on food, approximately 20 per cent of food expenditure is on
flour. In this study atta is going to be used in place of wheat flour.
India has seen rapid economic growth in the past two decades after the new economic policy.
The economic growth has certainly bettered the life style and standard of living of the middle
class, if not rural Indians. The changing life style and the aggressive marketing of food items
have completely changed the buying pattern of consumers. Consumers are buying packaged oil,
masale, leaf tea, pickle, beverages, rice, fruits and what not. The penetration is so intense that
people are buying one rupee water pouches.
In the light of such changing scenario, is seems pretty strange as why the packaged atta industry
is not keeping the pace with the growth of other packaged items in India. The branded atta
market (estimated between 2.3-3 lakh tonnes and valued at Rs 400-600 crore) is increasing in the
last few years. According to some estimates merely five per cent is the consumption of packaged
atta out of total consumption.
1.1Statement of the problem
Given the growth of other packaged food items, the packaged atta industry is estimated to grow
at the rate of merely 3 per cent. The slow growth of the above mentioned industry may be due to
several reasons. It is also surprising that the presence of ITC, Hindustan Lever Ltd and even the
global brand Pillsbury is not stimulating the growth of the industry. This is evident from the
advertising space in the television. There is hardly any advertisement of packaged atta during the
74
prime time of television targeting the Indian housewives through Balika Vadhu, Jhansi Ki Rani,
Ye Rishta Kya Kehlata Hai, etc.
The problem is related to the low sales of packaged atta, even it is inevitable part of our life.
Now the time when people are using every thing in packaged form and believing that it would be
better than open food, even than they are not giving as much as response as they should give to
it.
The major market is of families where both husband and wife are working, office goers or those
families which don’t have a flour mill nearby.
Most families still prefer going the traditional way and doubt the quality of packaged atta. The
still practice purchasing wheat from the market, cleaning it by hand, storing them and then taking
small quantities of wheat to neighborhood mill or chakki to get it ground between two stones to
convert it into flour.
Selling packaged flour is almost revolutionary in India, where most Indian housewives still buy
row wheat in bulk, clean it by hand, store it in metal hampers and carry some to the
neighborhood mill or chakki where it ground between to stones.
1.2 Objectives
The main objective of the study was:
“To study the critical factor responsible for low sales of packaged atta”
The sub-objectives of the study were:
The per cent of households using the packaged atta in urban area
Factors that drive people to use the packaged atta
Factors that check households from using the packaged atta
Key decision maker in the household for buying/ not buying the packaged atta
Advertisement effectiveness ofpackaged atta
75

Average income of buyers of packaged atta
1.2 Scope of the Study
After finding the critical factors responsible for low demand for packaged atta, the suggestion
can used in the core marketing concepts viz. Price, Promotion, Place, and Product.
The scope of the study, in terms of geography, is limited to urban area.
This study is to know why, what, where, who is responsible for low sales of packaged atta.
1.3 Limitations of the Study
The research project aims at collecting data from urban area. Thus, exclusion of rural area
where approximately 65 per cent of people live would be major limitation.
The sample size of 100 may be limited to conclude the findings for 30 crore people living
in urban area.
It covers only marketing aspect of low sales.
The number of question in questionnaire may not be adequate to know the reason for low
sales.
2. Reviewof Literature
There are many studies conducted in the buying behavior of people but as such no study has
been conducted to find out the factors responsible for low sales of atta, in particular. The
preferences of the consumers clearly indicate their priority for cleanliness/ freshness of food
products followed by price, quality, variety, packaging, and non-seasonal availability in the food
market and grocery market. (Ali et al, 2010)
3. Introduction to Food Industry
76

India is the world's second largest producer of food next to China, and has the potential of being
the biggest with the food and agricultural sector. The total food production in India is likely to
double in the next ten years and there is an opportunity for large investments in food and food
processing technologies, skills and equipment, especially in areas of Canning, Dairy and Food
Processing, Specialty Processing, Packaging, Frozen Food/Refrigeration and Thermo Processing.
Fruits & Vegetables, Fisheries, Milk & Milk Products, Meat & Poultry, Packaged/Convenience
Foods, Alcoholic Beverages & Soft Drinks and Grains are important sub-sectors of the food
processing industry. Health food and health food supplements is another rapidly rising segment
of this industry which is gaining vast popularity amongst the health conscious.
India is one of the worlds major food producers but accounts for less than 1.5 per cent of
international food trade. This indicates vast scope for both investors and exporters. Food exports
in 1998 stood at US $5.8 billion whereas the world total was US $438 billion. The Indian food
industries sales turnover is Rs 140,000 crore (1 crore = 10 million) annually as at the start of year
2000. The industry has the highest number of plants approved by the US Food and Drug
Administration (FDA) outside the USA.
India's food processing sector covers fruit and vegetables; meat and poultry; milk and milk
products, alcoholic beverages, fisheries, plantation, grain processing and other consumer product
groups like confectionery, chocolates and cocoa products, Soya-based products, mineral water,
high protein foods etc. We cover an exhaustive database of an array of suppliers, manufacturers,
exporters and importers widely dealing in sectors like the -Food Industry, Dairy processing,
Indian beverage industry etc. We also cover sectors like dairy plants, canning, bottling plants,
packaging industries, process machinery etc.
The most promising sub-sectors includes -Soft-drink bottling, Confectionery manufacture,
Fishing, aquaculture, Grain-milling and grain-based products, Meat and poultry processing,
Alcoholic beverages, Milk processing, Tomato paste, Fast-food, Ready-to-eat breakfast cereals,
Food additives, flavors etc.
77
4. Methodology
4.1 The Study
The study would be conducted in Indore. The study will cover different income group of people.
It tells factors why people are using it or not using it.
4.2 The Sample Design
The target respondents are the housewives, retailers and the sales men of shopping maals. The
questionnaire is developed after a pilot survey of some housewives and senior citizens.
Following is the data collection table from the targeted respondents:
Low
Income
Middle
Income
High Income Total
House wives 10 30 10 50
Working Women 10 5 5 20
Senior Citizens 10 5 5 20
Sellers* 4 4 2 10
Total 34 44 22 100
*Low income seller = Local Chakki Owners
Middle income seller = Mom and Pop Store Owners
High income seller = Sales men from shopping malls
4.3 Tools for Data Collection
The data would be collected through schedules where the surveyor would be asking the questions
in the schedule and marking and noting the responses.
78

4.4 Tools for Data Analysis
The data would be presented using the graphs, pie charts and bar diagrams. Analysis of data
would be done using arithmetic mean, correlation analysis and appropriate.
4.5 Hypothesis
The followings are the assumption of the study:
(2) H0: P = 0.5
Null Hypothesis is that only 5 percent people use the packaged Atta
H1: P ≠ 0.5
Alternative Hypothesis is that 5 percent people do not use packaged Atta
(3) H0: r = 0
Null Hypothesis is that there is no correlation between income of the household and
usage of packaged atta
H1: P ≠ 0
Alternative Hypothesis is that there is significant correlation between income of the
household and usage of packaged atta
5. References
4. http://timesofindia.indiatimes.com/articleshow/1241069178.cms
5. http://timesofindia.indiatimes.com/city/delhi/-No-mechanism-to-keep-retail-prices-in-
check/articleshow/5717368.cms
6. Ali, Jabir, Sanjeev Kapoor and Janakiraman Moorthy, “Buying Behaviour of Consumers forFood
Products in an Emerging Economy”, British Food Journal, Vol. 112 No. 2 (2010): 109-124
7. http://www.indianfoodindustry.net/
8. http://www.indianexpress.com/news/who-are-the-middle-class-in-india/438429/
79

Annexure 1 – Questionnaire
Personal Information
6. Who cooks food in your home:
a. Self
b. Cook
c. Any other family member
7. Do you use packaged atta in your Home?
a. Yes
b. No
8. Total Number of Members in the Family
a. Two
b. 2 – 4
c. 4 – 6
d. More than 6
9. Profession
a. House maker
b. Working
c. Part Time
10. Total Family Income per month
a. Up to Rs 10000
b. Rs 10000 – Rs 20000
c. Rs 20000 – Rs 40000
d. More than Rs 40000
Information relating to consumption pattern
1. How often do you use packaged atta?
1. Daily
2. Occasionally
3. Never
80

4. When out of stock
2. Why do you not use/use packaged atta?
e. Quality
f. Price
g. Packet Size
h. Availability
i. Convenience
j. Test ( Maida )
3. Are you satisfied with the quality of packaged atta?
e. Excellent
f. Good
g. Average
h. poor
4. Are you satisfied with the price?
a. Yes
b. No
5. Do you feel Maida test in packaged atta?
a. Yes
b. No
6. How many brands of packaged atta do you know? Please name them
81

f. …………………..
g. ………………….
h. …………………..
i. …………………..
j. …………………..
7. Have you seen the advertisement of packaged atta in television, if yes please name
the brand
………………………………………………………………………..
8. Who makes the decision about the brand of the packaged atta in your family?
e. Self
f. Husband
g. Mother In Law/ Parents/ Father in Law
h. Children
9. Which type of improvement would you like to see in the atta you are using currently
…………………………………………………………………………..
10. How satisfied are you with the packaged atta?
e. Very Satisfied
f. Just Satisfied
g. Dissatisfied
h. Very Dissatisfied
12. Rank the reason for using the packaged atta according to your importance ( Rank
1 means most Important
Factor Rank
82

Quality
Price
Convenience
Packet Size
Maida Test
83