Embed Size (px)
Citation preview
““Moving The Cheese”Moving The Cheese”
Portfolio Analysis: Dashboard Diagnostics Portfolio Analysis: Dashboard Diagnostics
January 20, 2010
Presented by:
Mark RobertsonFounder and Managing Partner –
www.manifestinvesting.com

2
Dashboard DiagnosticsDashboard Diagnostics
Club History & CharacteristicsClub History & Characteristics
Club Name: “Anonymous” (Cheese Movers)
Location: Midwest
# of Members: 16 (Ladies)
Founded: 1994
The group includes a retired banker, a nurse, retailer, small business owner, dietician, physician’s
assistant, teacher and a lawyer ...
The genesis of the club is a quest for learning. The ladies wanted to learn more about investing and
the world of finance without involving their husbands or stock brokers.
3
Dashboard DiagnosticsDashboard Diagnostics
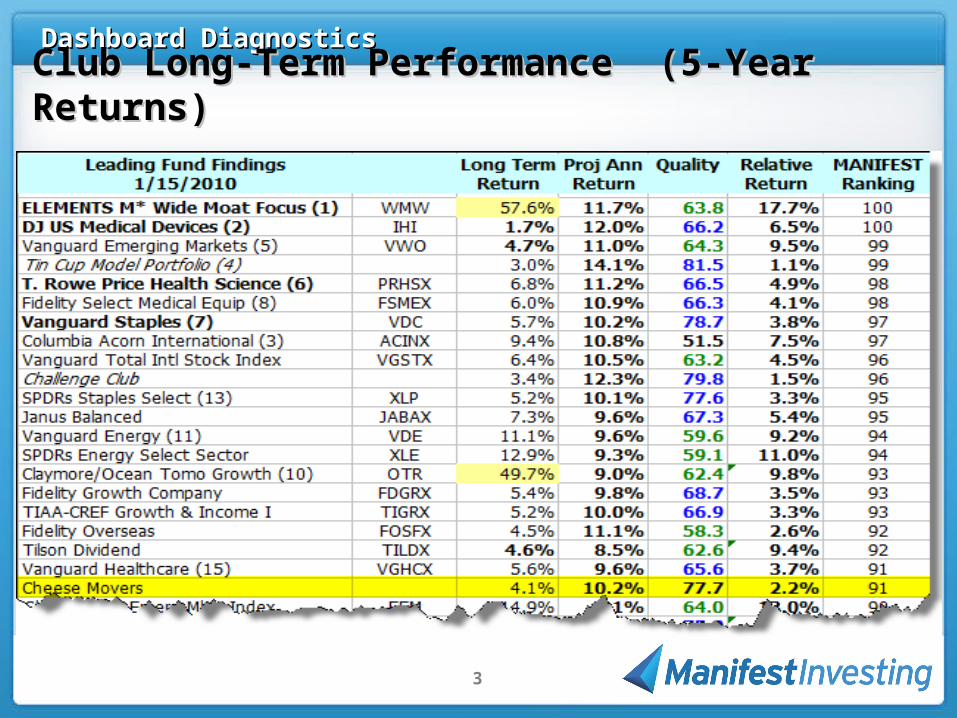
Club Long-Term Performance (5-Year Returns)Club Long-Term Performance (5-Year Returns)
4
Dashboard DiagnosticsDashboard Diagnostics
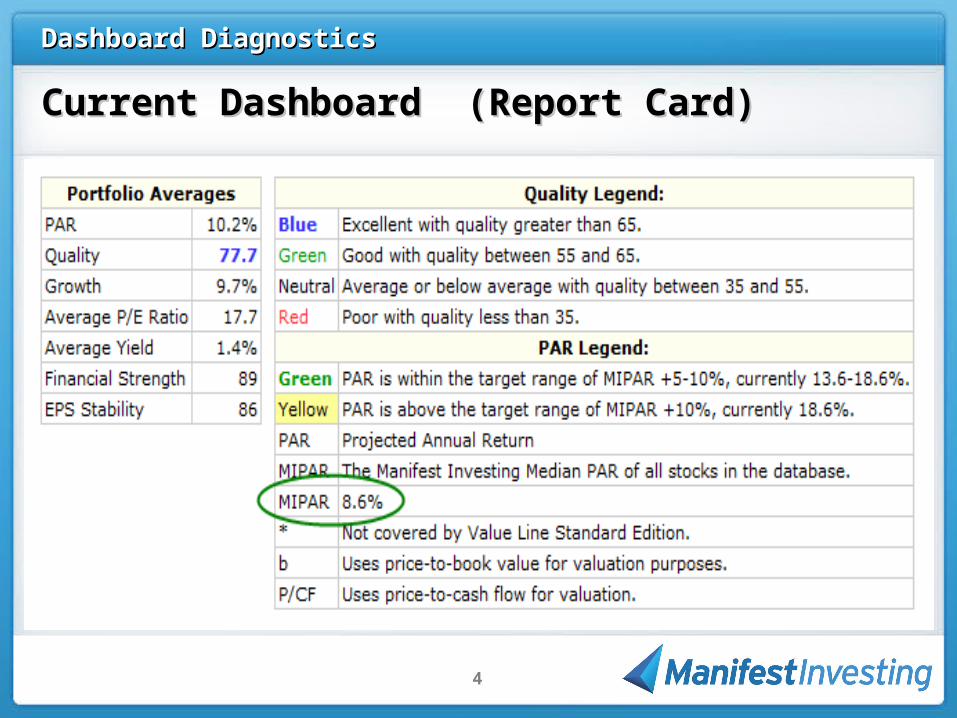
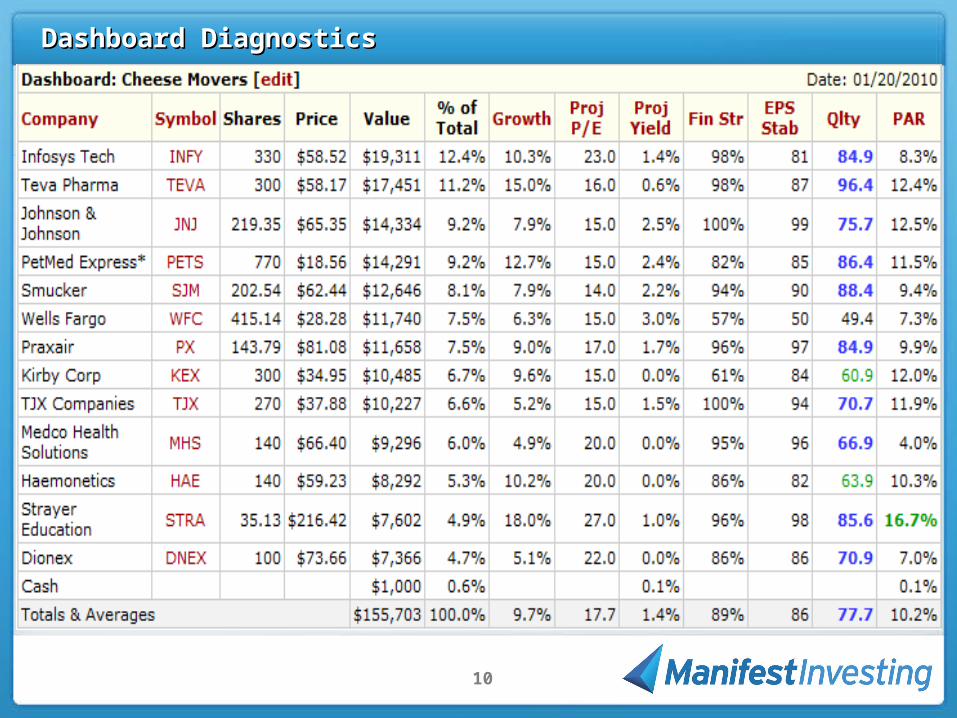
Current Dashboard (Report Card)Current Dashboard (Report Card)
5
Dashboard DiagnosticsDashboard Diagnostics
0% 5% 10% 15% 20%
PAR
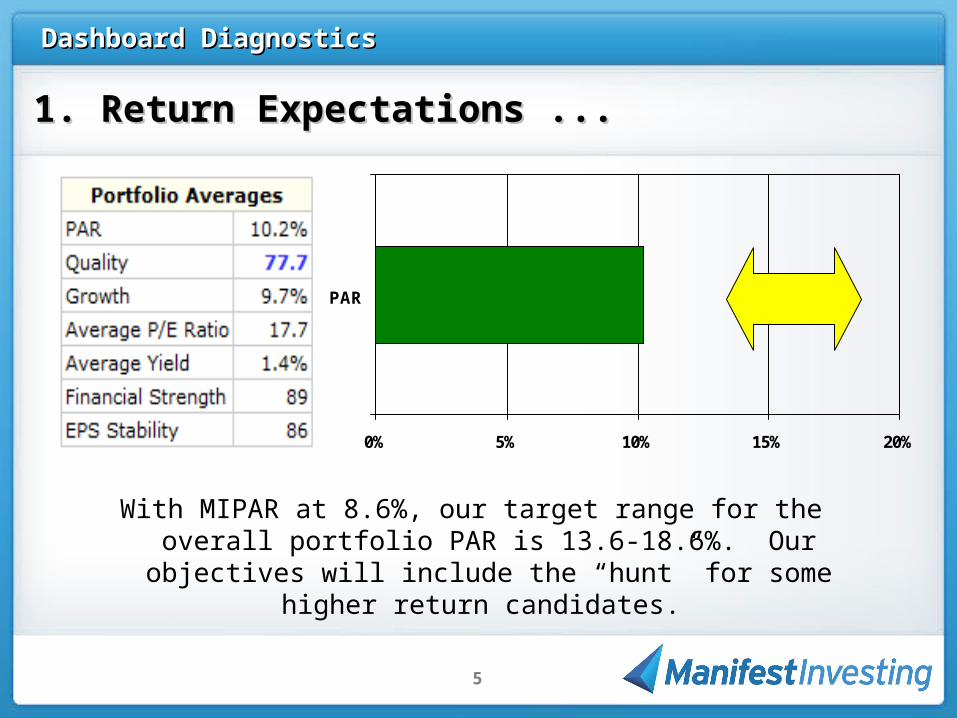
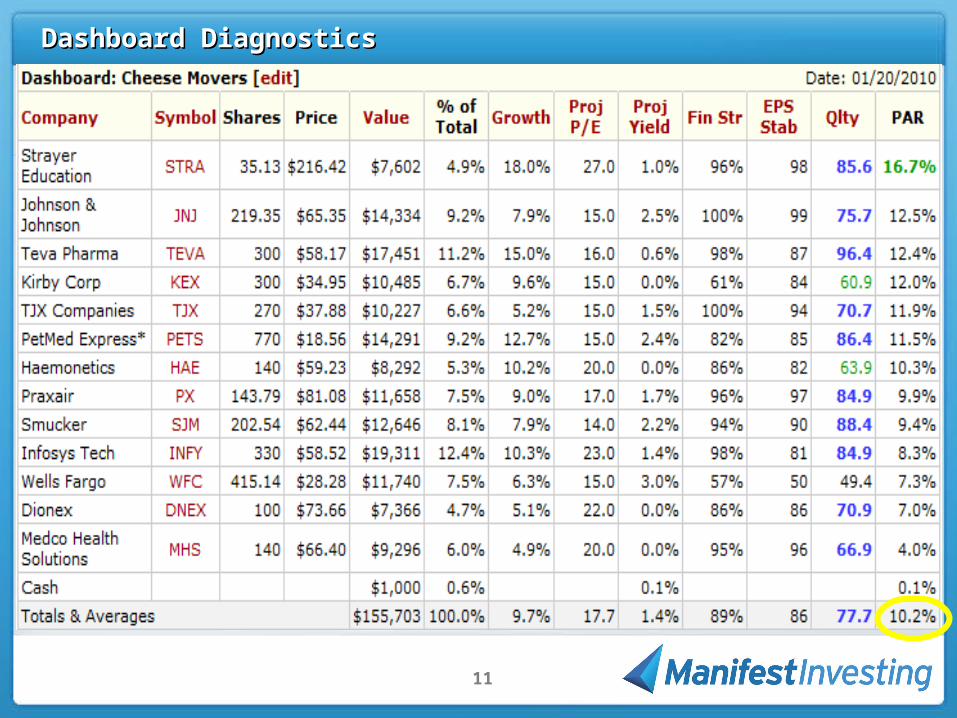
1. Return Expectations ...1. Return Expectations ...
With MIPAR at 8.6%, our target range for the overall portfolio PAR is 13.6-18.6%. Our objectives will include
the “hunt” for some higher return candidates.
6
Dashboard DiagnosticsDashboard Diagnostics
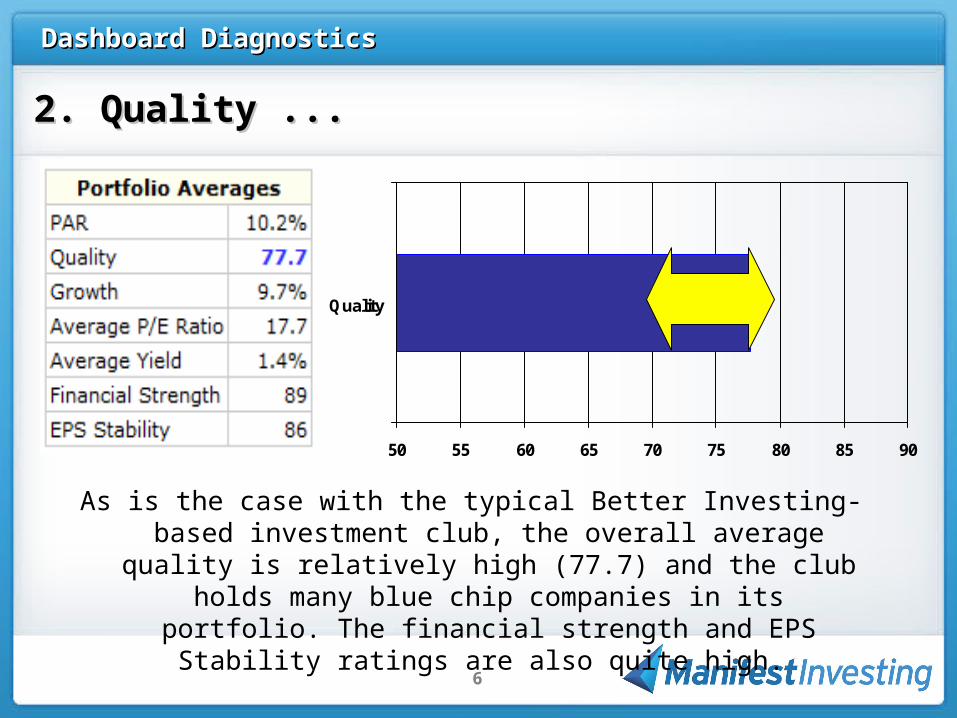
50 55 60 65 70 75 80 85 90
Quality
2. Quality ...2. Quality ...
As is the case with the typical Better Investing-based investment club, the overall average quality is relatively
high (77.7) and the club holds many blue chip companies in its portfolio. The financial strength and
EPS Stability ratings are also quite high.
7
Dashboard DiagnosticsDashboard Diagnostics
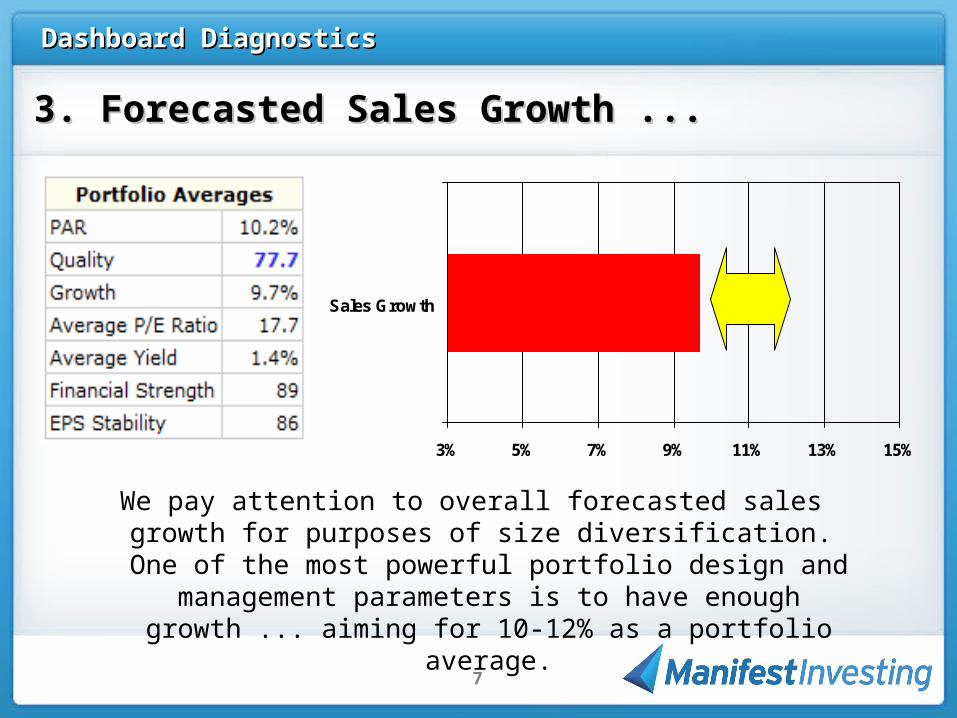
3% 5% 7% 9% 11% 13% 15%
Sales Growth
3. Forecasted Sales Growth ...3. Forecasted Sales Growth ...
We pay attention to overall forecasted sales growth for purposes of size diversification. One of the most
powerful portfolio design and management parameters is to have enough growth ... aiming for 10-12% as a
portfolio average.
8
Dashboard DiagnosticsDashboard Diagnostics
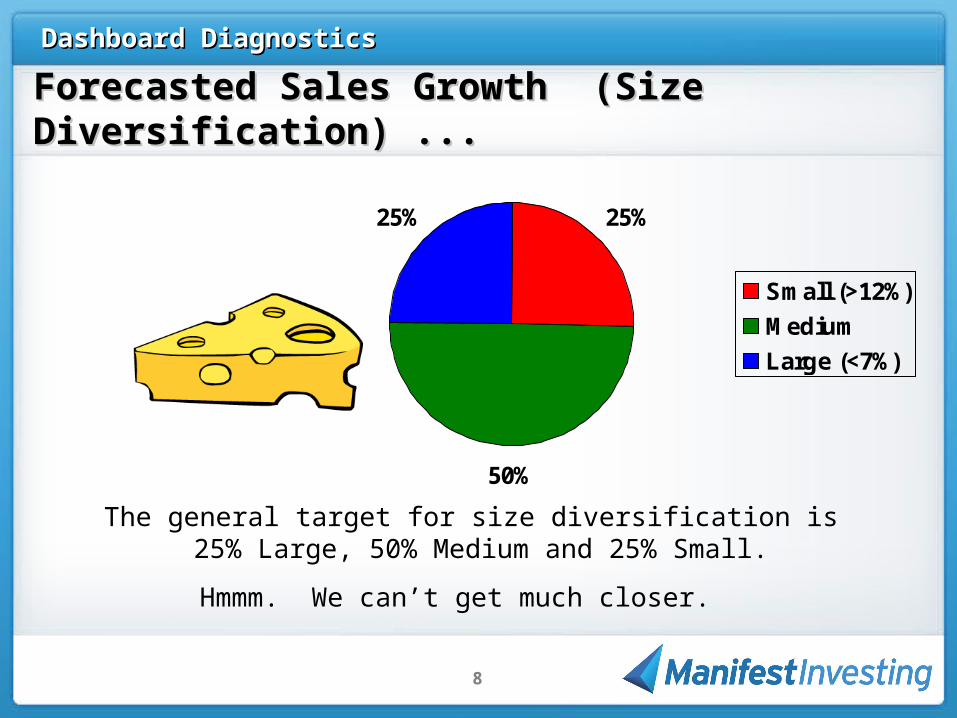
Forecasted Sales Growth (Size Diversification) ...Forecasted Sales Growth (Size Diversification) ...
25%
50%
25%
Small (>12%)
Medium
Large (<7%)
The general target for size diversification is 25% Large, 50% Medium and 25% Small.
Hmmm. We can’t get much closer.
9
Dashboard DiagnosticsDashboard Diagnostics
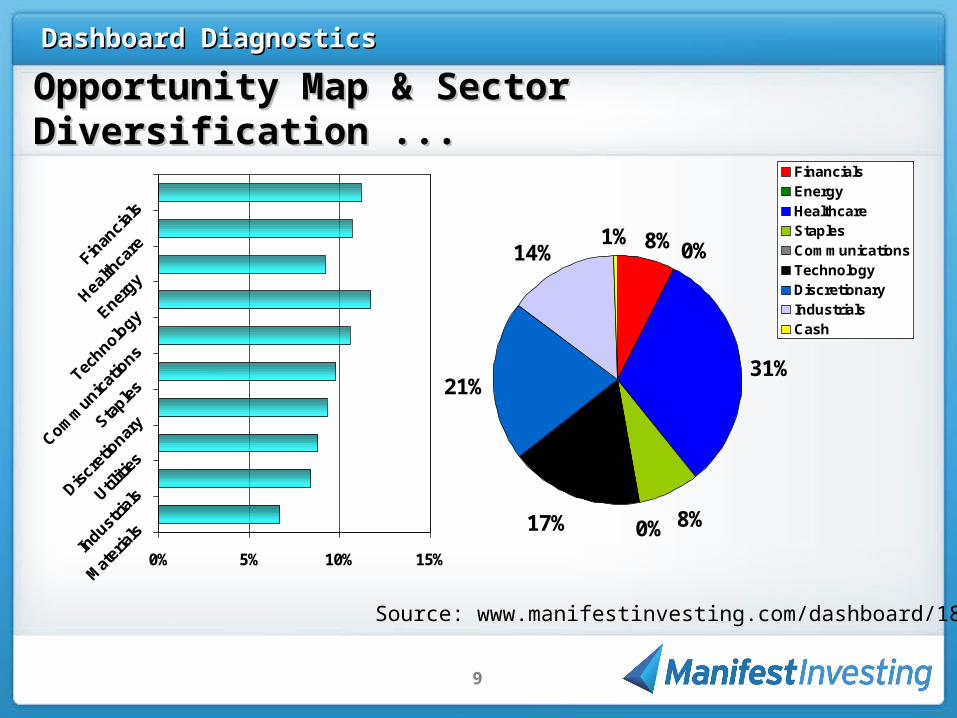
Opportunity Map & Sector Diversification ...Opportunity Map & Sector Diversification ...
8% 0%
31%
8%0%17%
21%
14%1%
FinancialsEnergyHealthcareStaplesCommunicationsTechnologyDiscretionaryIndustrialsCash
0% 5% 10% 15%M
ater
ials
Indust
rialsUtil
ities
Discr
etio
narySta
ples
Comm
unic
atio
ns
Technolo
gyEnergy
Health
care
Finan
cial
s
Source: www.manifestinvesting.com/dashboard/1835
10
Dashboard DiagnosticsDashboard Diagnostics
11
Dashboard DiagnosticsDashboard Diagnostics
12
Dashboard DiagnosticsDashboard Diagnostics
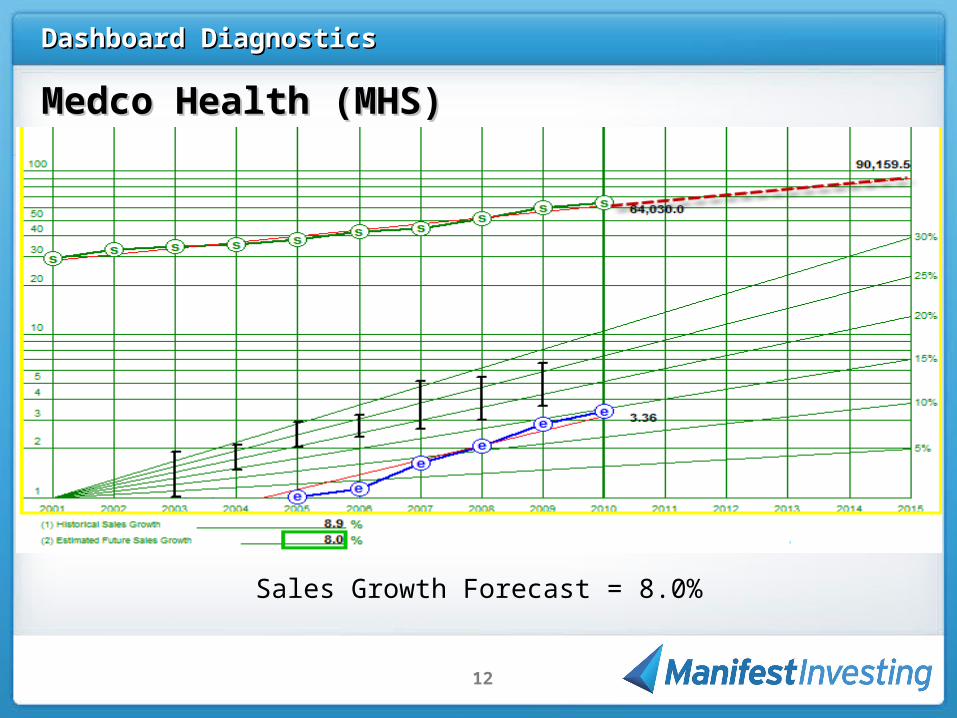
Medco Health (MHS)Medco Health (MHS)
Sales Growth Forecast = 8.0%
13
Dashboard DiagnosticsDashboard Diagnostics
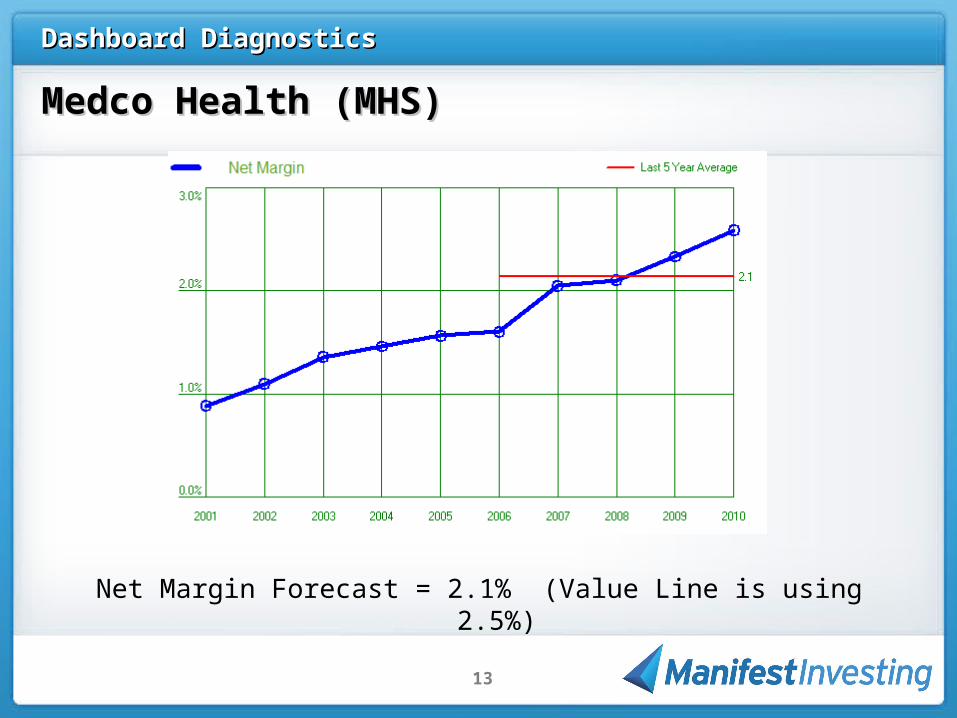
Medco Health (MHS)Medco Health (MHS)
Net Margin Forecast = 2.1% (Value Line is using 2.5%)
14
Dashboard DiagnosticsDashboard Diagnostics
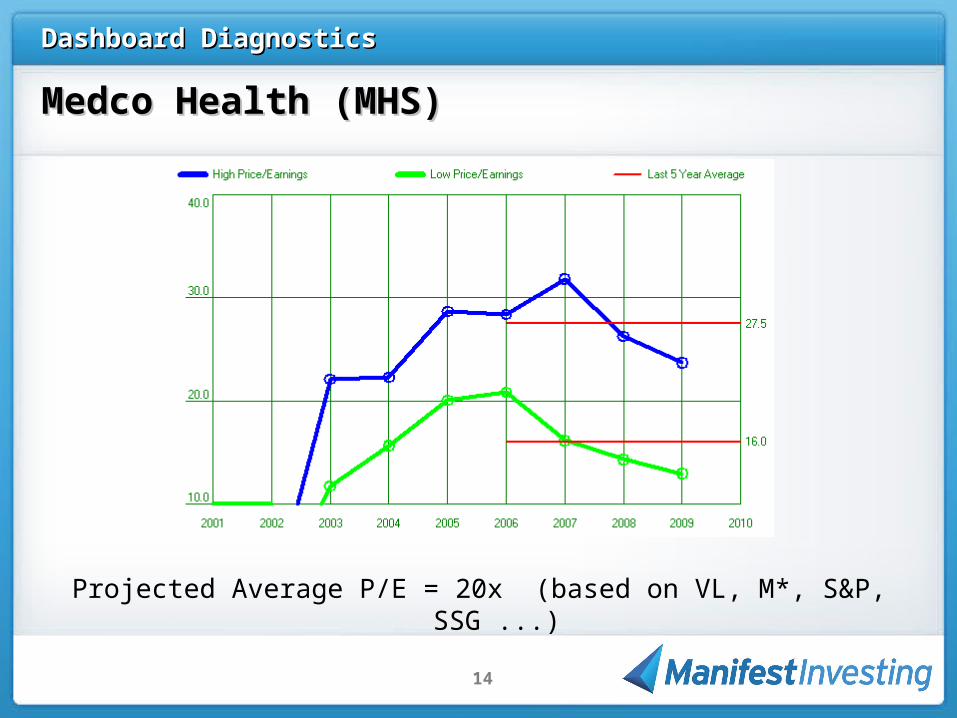
Medco Health (MHS)Medco Health (MHS)
Projected Average P/E = 20x (based on VL, M*, S&P, SSG ...)
15
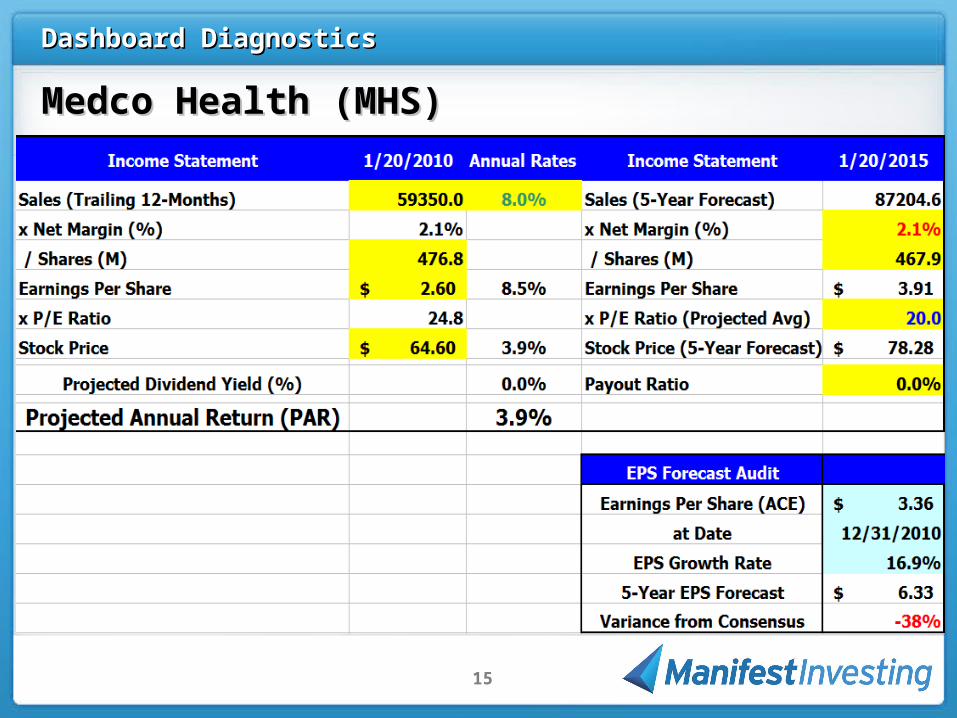
Dashboard DiagnosticsDashboard Diagnostics
Medco Health (MHS)Medco Health (MHS)
16
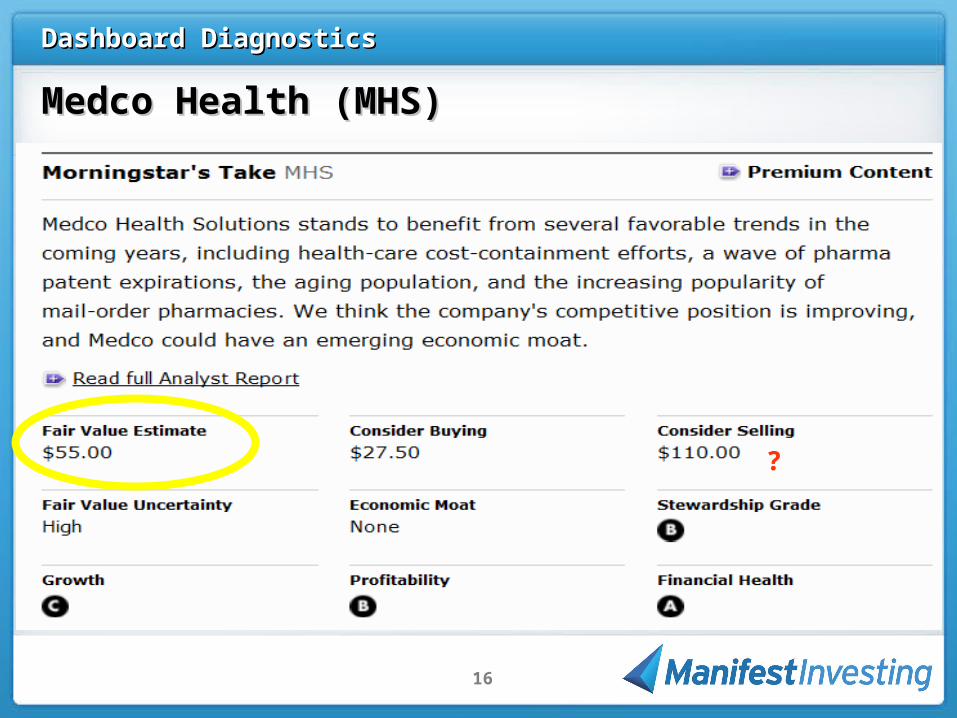
Dashboard DiagnosticsDashboard Diagnostics
Medco Health (MHS)Medco Health (MHS)
?
17
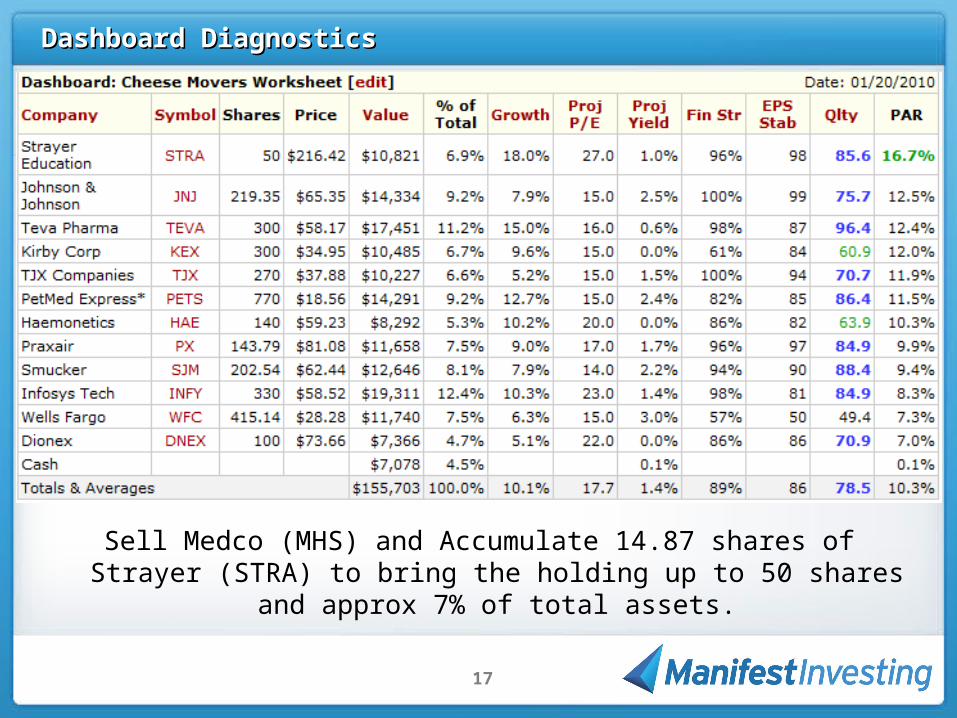
Dashboard DiagnosticsDashboard Diagnostics
Sell Medco (MHS) and Accumulate 14.87 shares of Strayer (STRA) to bring the holding up to 50 shares and approx 7% of
total assets.
18
Dashboard DiagnosticsDashboard Diagnostics
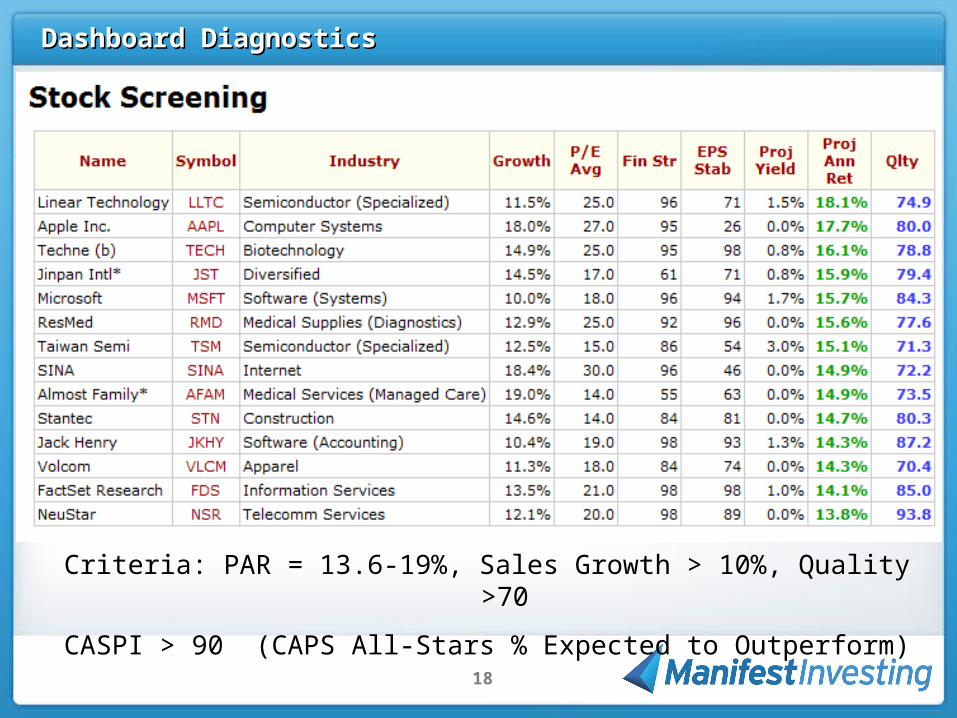
Criteria: PAR = 13.6-19%, Sales Growth > 10%, Quality >70
CASPI > 90 (CAPS All-Stars % Expected to Outperform)
19
Dashboard DiagnosticsDashboard Diagnostics
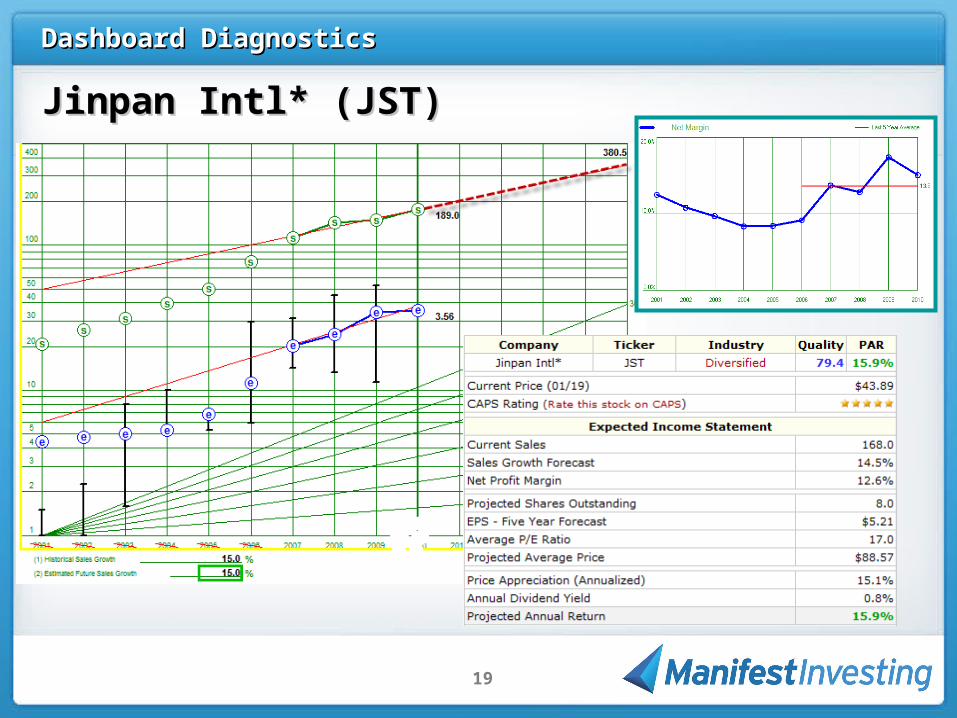
Jinpan Intl* (JST)Jinpan Intl* (JST)
20
Dashboard DiagnosticsDashboard Diagnostics
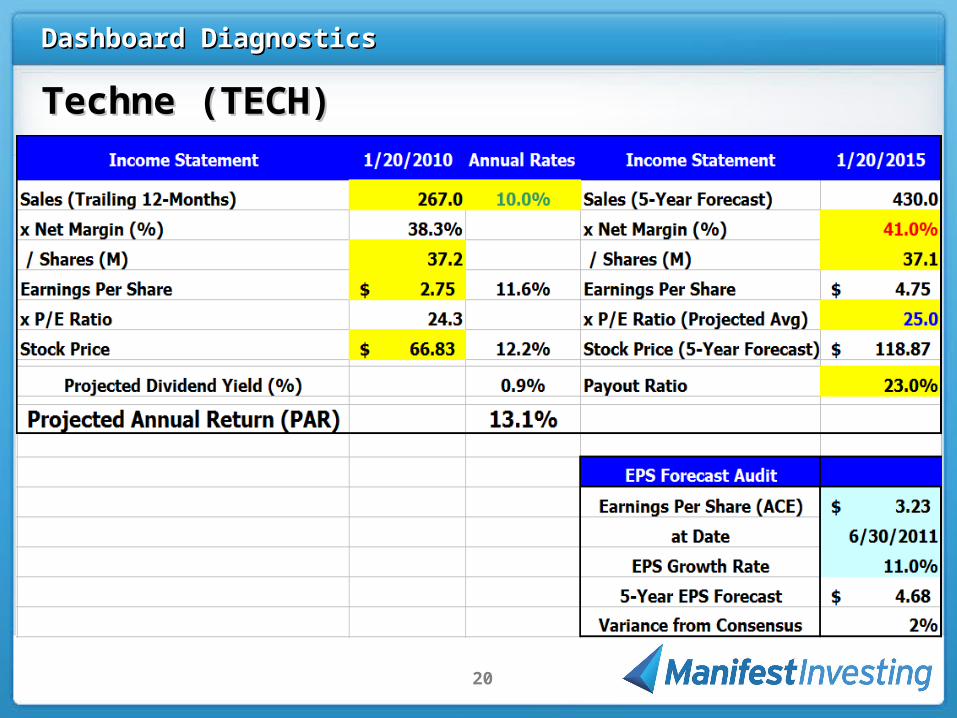
Techne (TECH)Techne (TECH)
21
Dashboard DiagnosticsDashboard Diagnostics
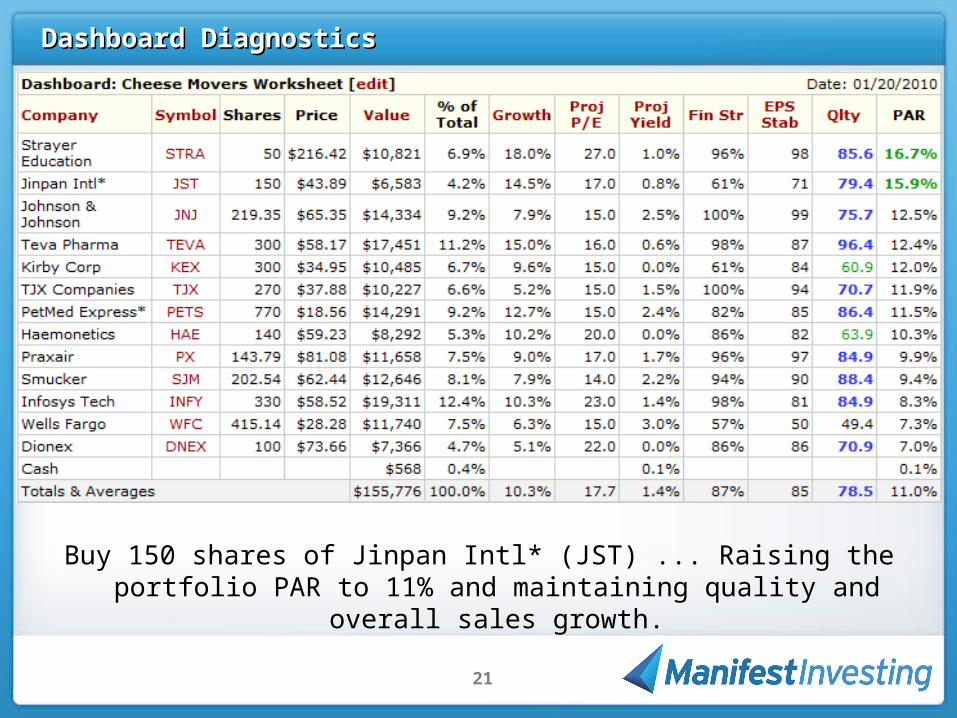
Buy 150 shares of Jinpan Intl* (JST) ... Raising the portfolio PAR to 11% and maintaining quality and overall sales growth.
22
Dashboard DiagnosticsDashboard Diagnostics
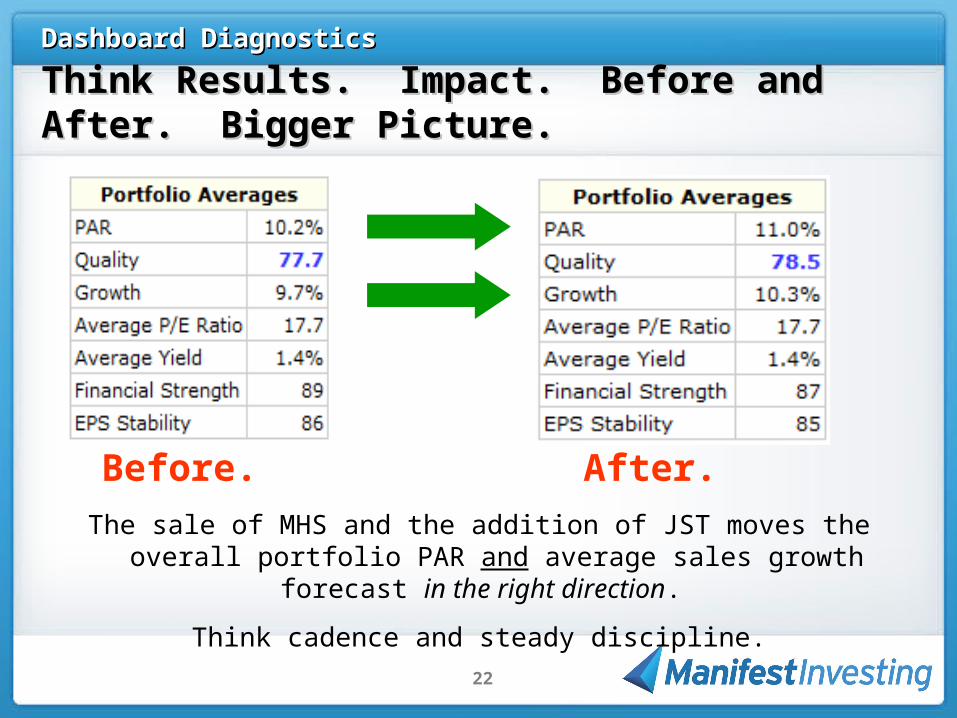
Think Results. Impact. Before and After. Bigger Picture.Think Results. Impact. Before and After. Bigger Picture.
Before. After.
The sale of MHS and the addition of JST moves the overall portfolio PAR and average sales growth forecast in the right direction.
Think cadence and steady discipline.
23
Dashboard DiagnosticsDashboard Diagnostics
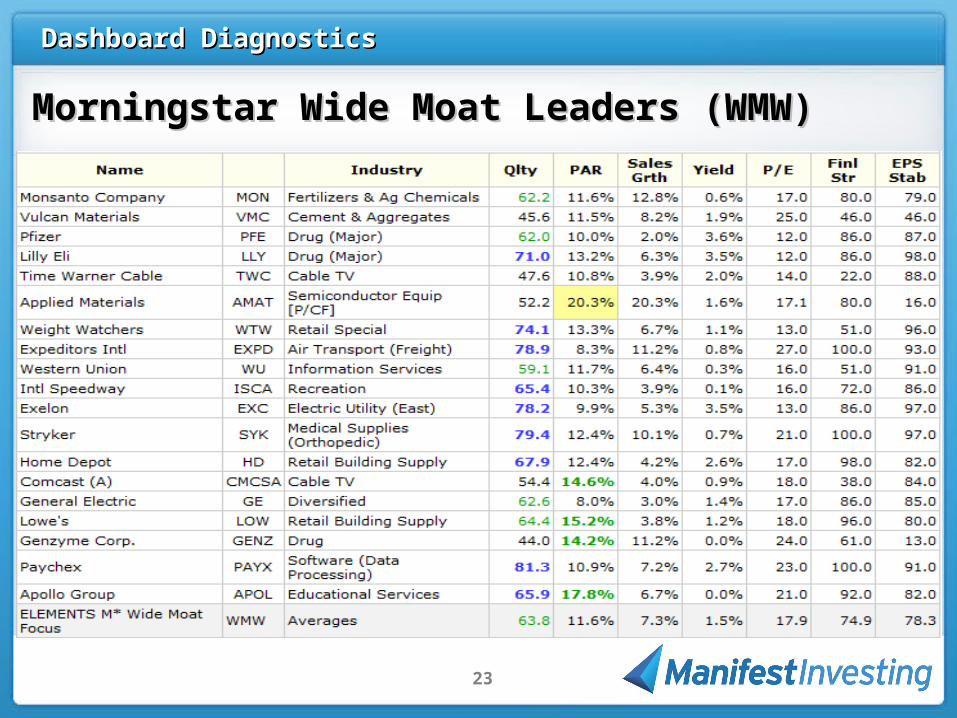
Morningstar Wide Moat Leaders (WMW)Morningstar Wide Moat Leaders (WMW)
24
Dashboard DiagnosticsDashboard Diagnostics
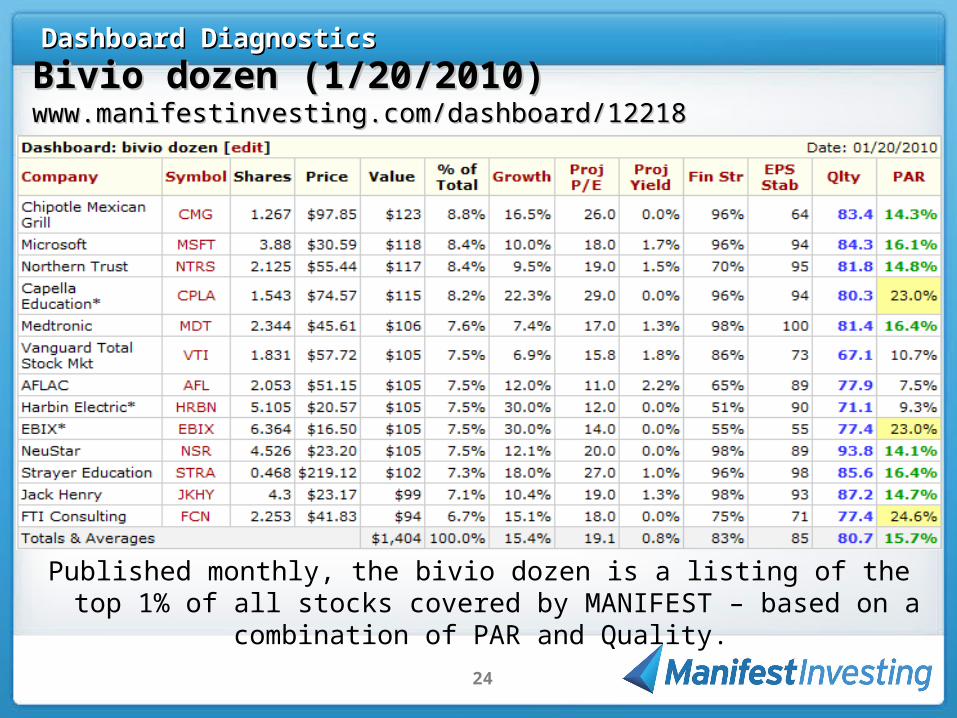
Bivio dozen (1/20/2010) Bivio dozen (1/20/2010) www.manifestinvesting.com/dashboard/12218www.manifestinvesting.com/dashboard/12218
Published monthly, the bivio dozen is a listing of the top 1% of all stocks covered by MANIFEST – based on a combination of PAR and Quality.