Embed Size (px)
Citation preview


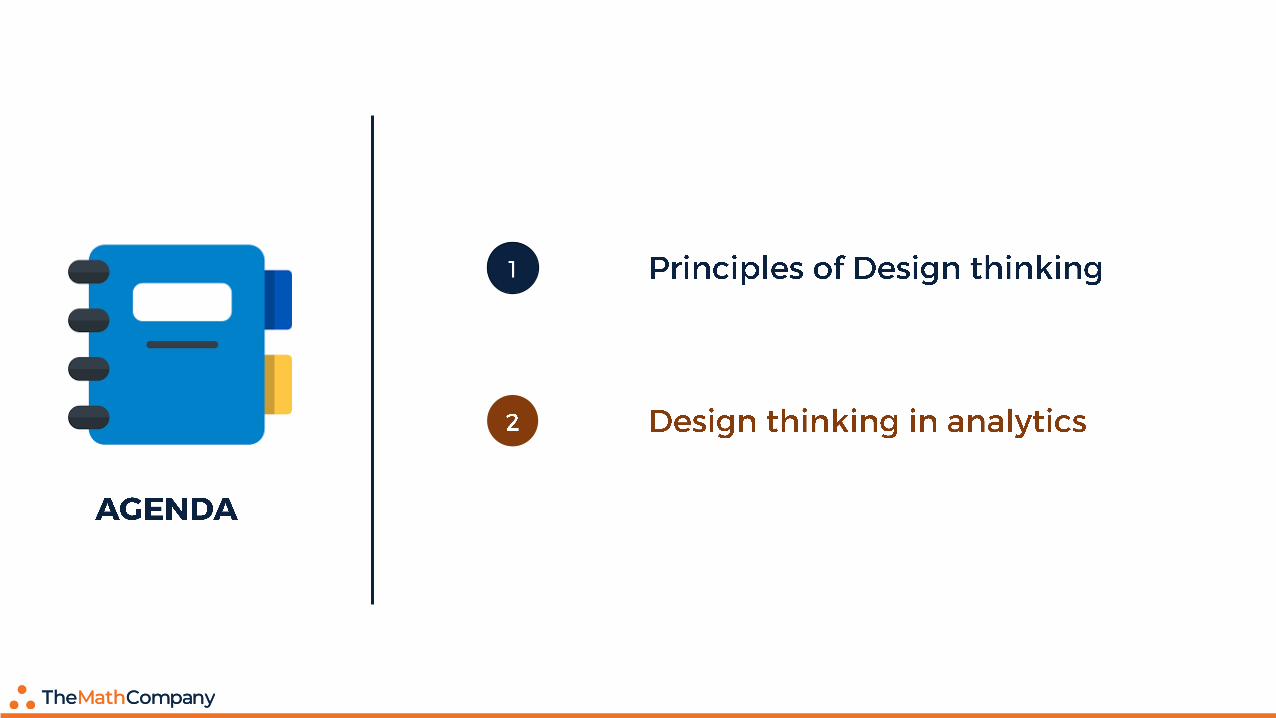


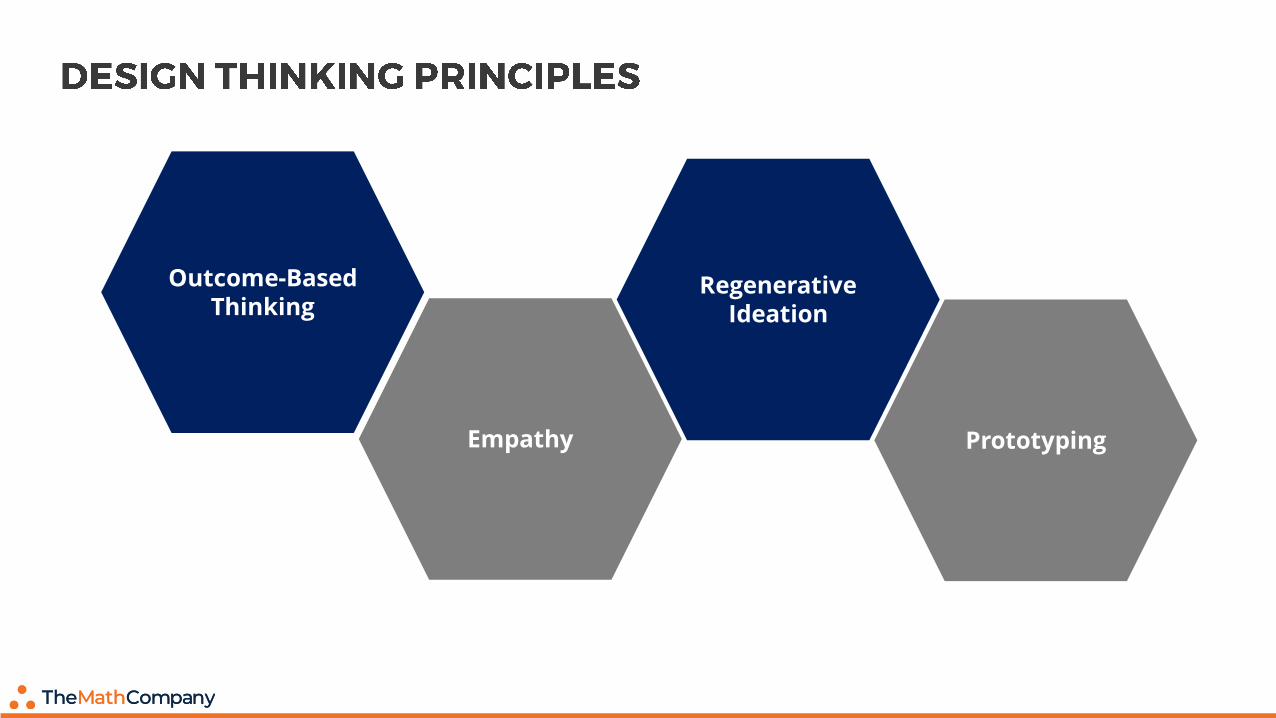
Regenerative Ideation
Outcome-Based Thinking
Empathy Prototyping

Outcome Based
Thinking
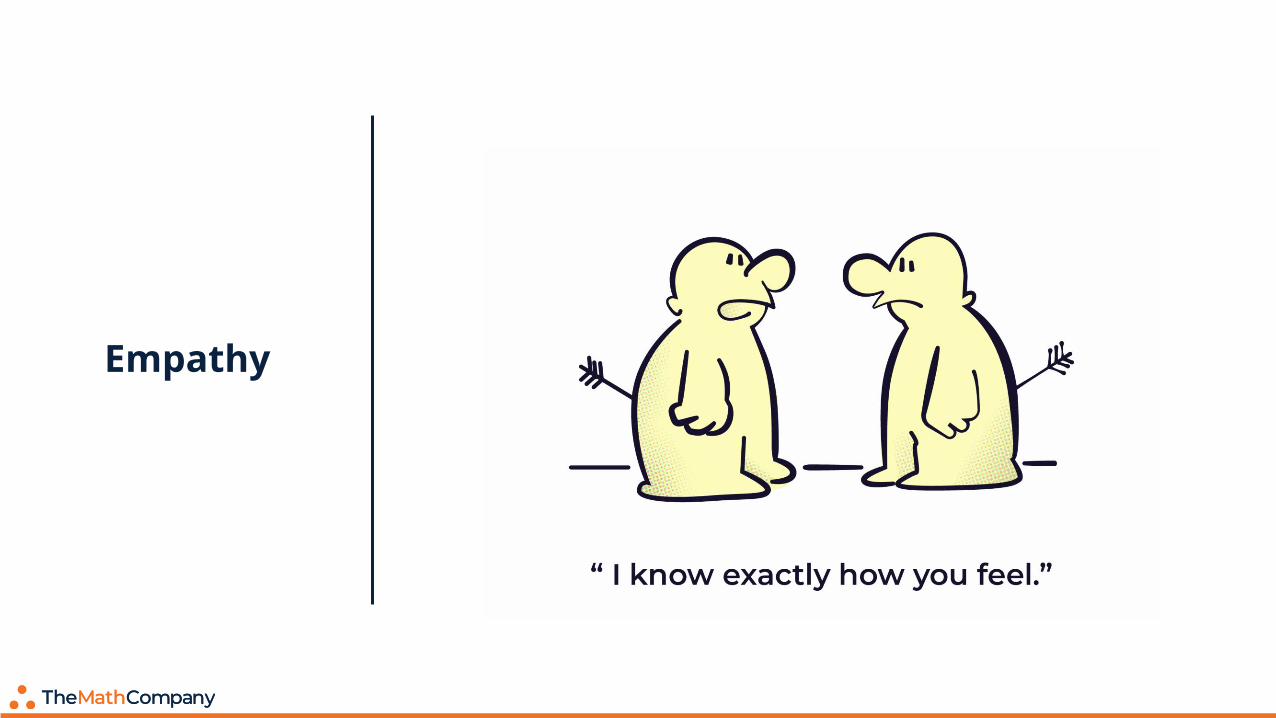
Empathy
Empathy

Regenerative Ideation
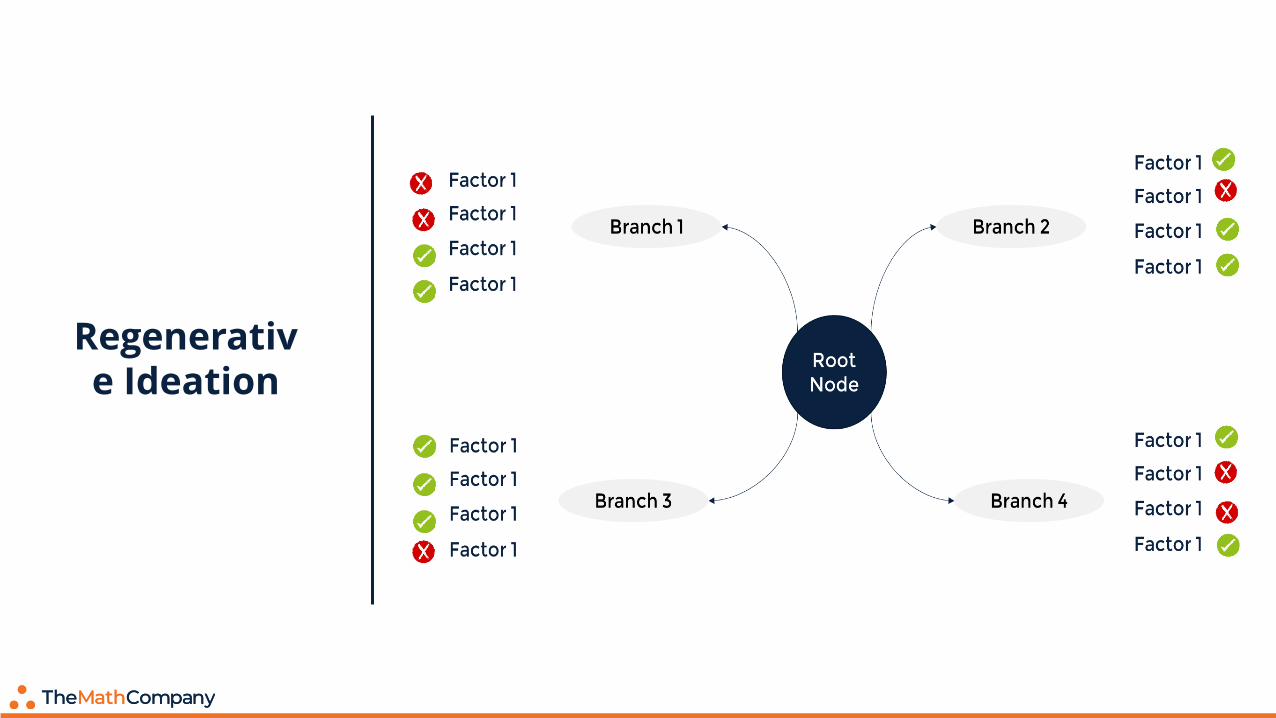
Regenerative Ideation
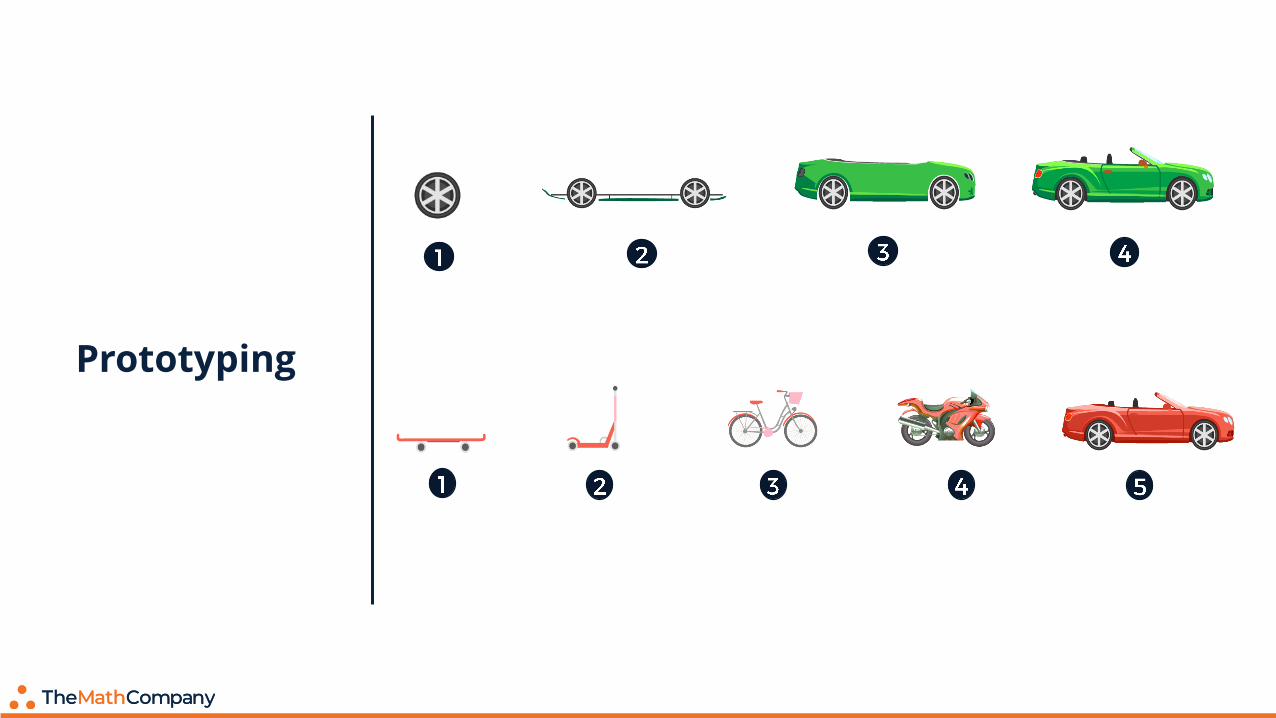
Prototyping


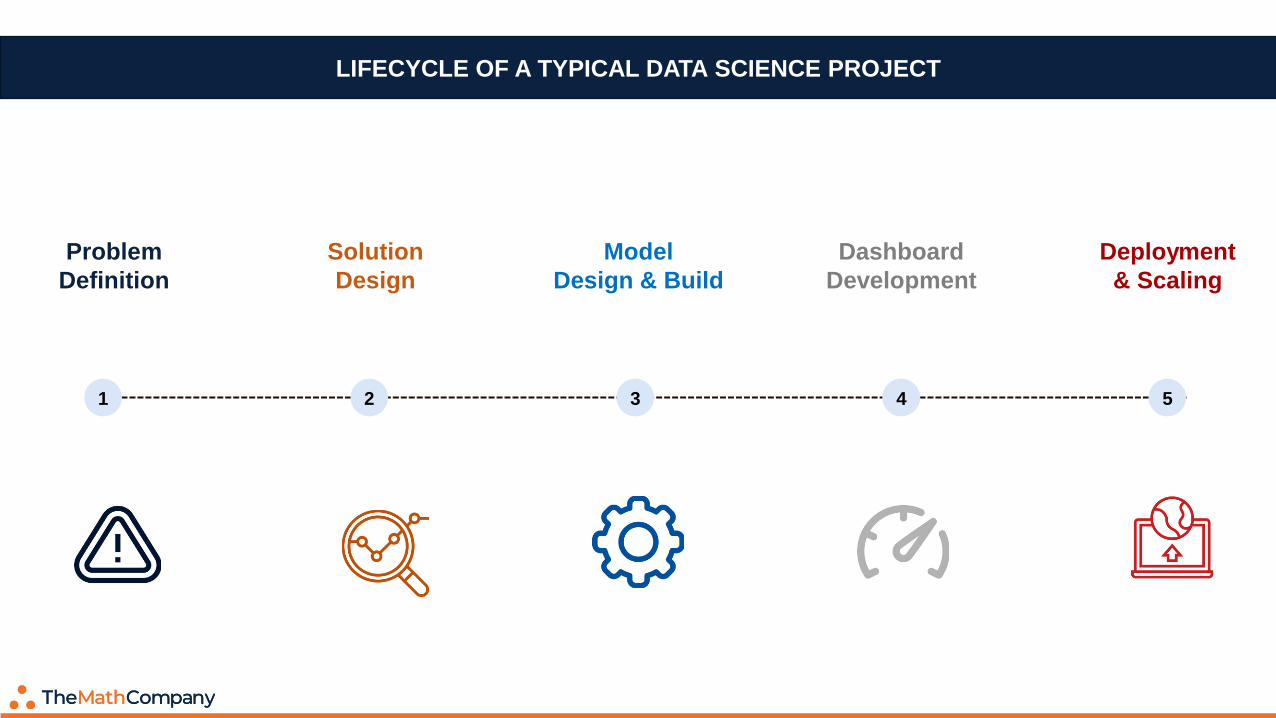
1 2 3 4 5
Problem
Definition
Solution
Design
Model
Design & Build
Dashboard
Development
Deployment
& Scaling
LIFECYCLE OF A TYPICAL DATA SCIENCE PROJECT

W H A T W O U L D Y O U D O ?
1
Problem
Definition
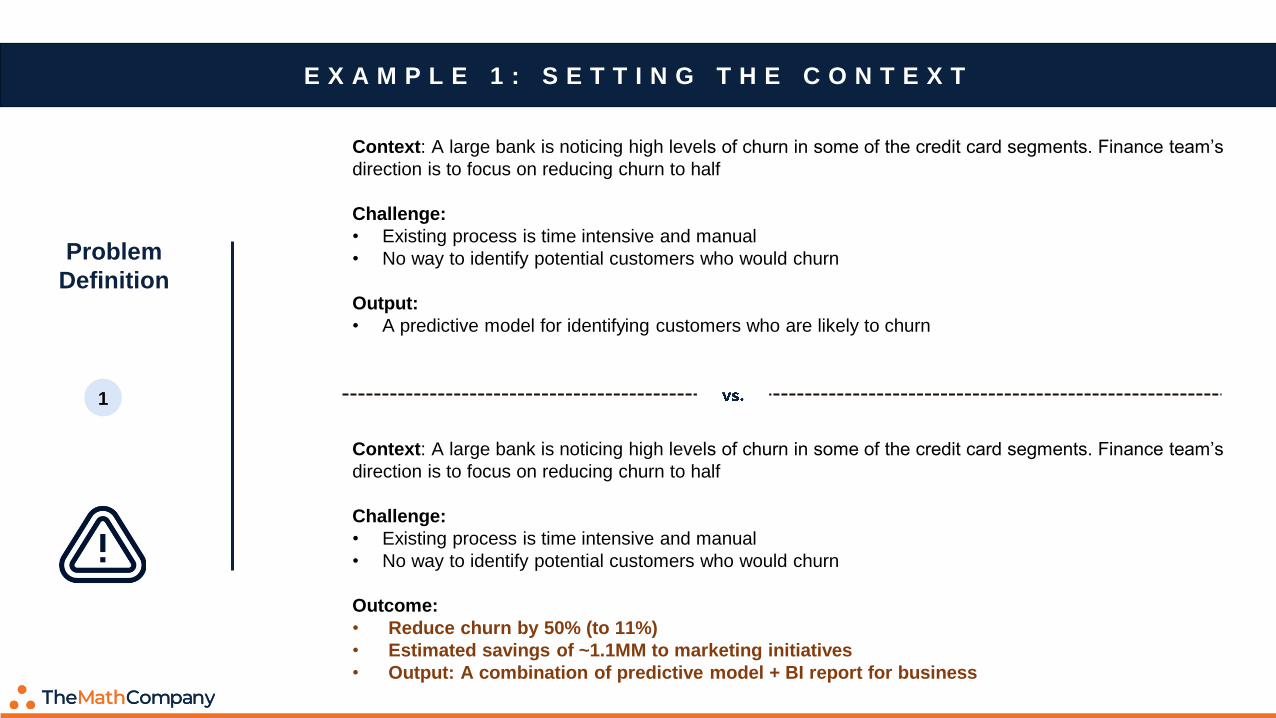
E X A M P L E 1 : S E T T I N G T H E C O N T E X T
Context: A large bank is noticing high levels of churn in some of the credit card segments. Finance team’s
direction is to focus on reducing churn to half
Challenge:
• Existing process is time intensive and manual
• No way to identify potential customers who would churn
Output:
• A predictive model for identifying customers who are likely to churn
Context: A large bank is noticing high levels of churn in some of the credit card segments. Finance team’s
direction is to focus on reducing churn to half
Challenge:
• Existing process is time intensive and manual
• No way to identify potential customers who would churn
Outcome:
• Reduce churn by 50% (to 11%)
• Estimated savings of ~1.1MM to marketing initiatives
• Output: A combination of predictive model + BI report for business
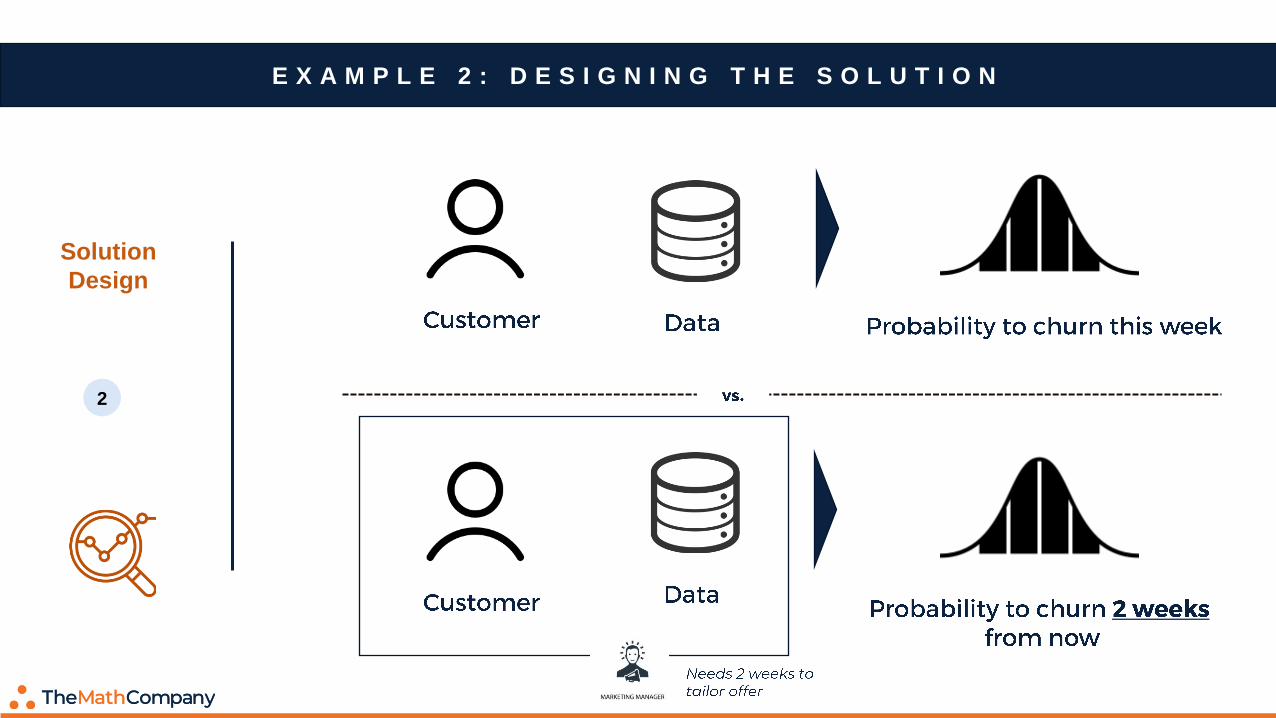
E X A M P L E 2 : D E S I G N I N G T H E S O L U T I O N
2
Solution
Design

E X A M P L E 3 : T E S T I N G H Y P O T H E S E S
Model
Design & Build
3
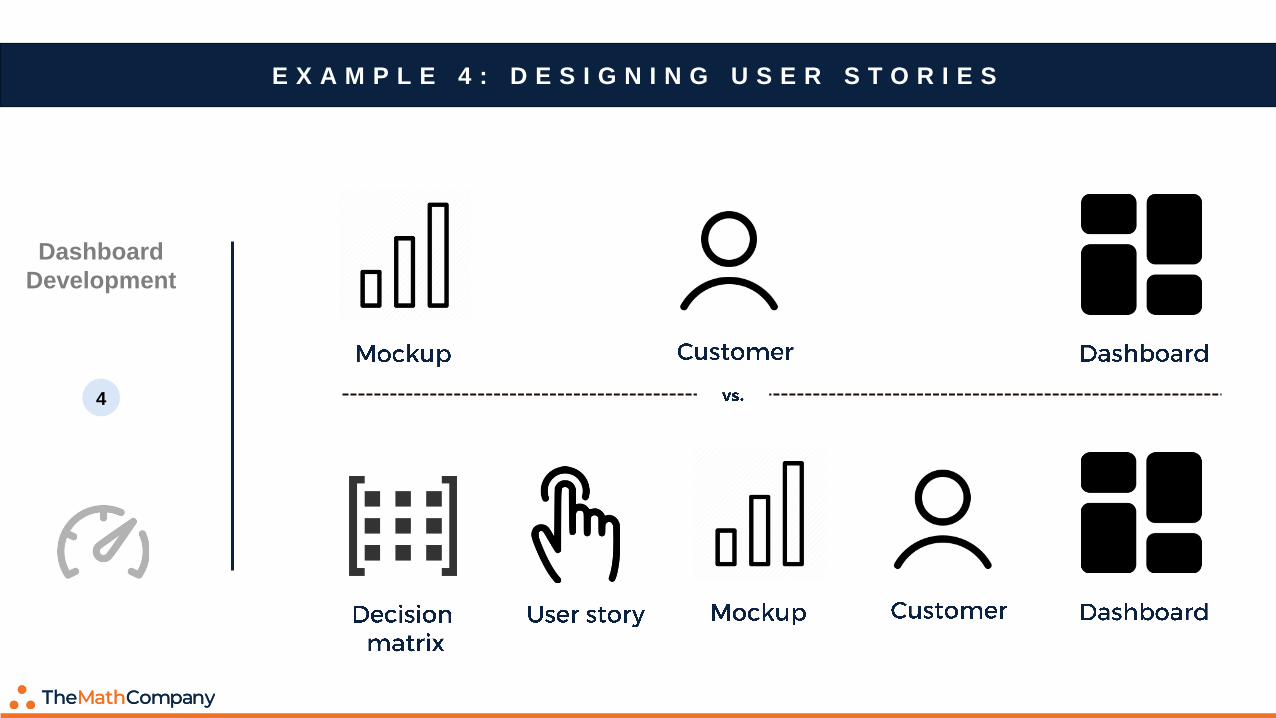
E X A M P L E 4 : D E S I G N I N G U S E R S T O R I E S
4
Dashboard
Development
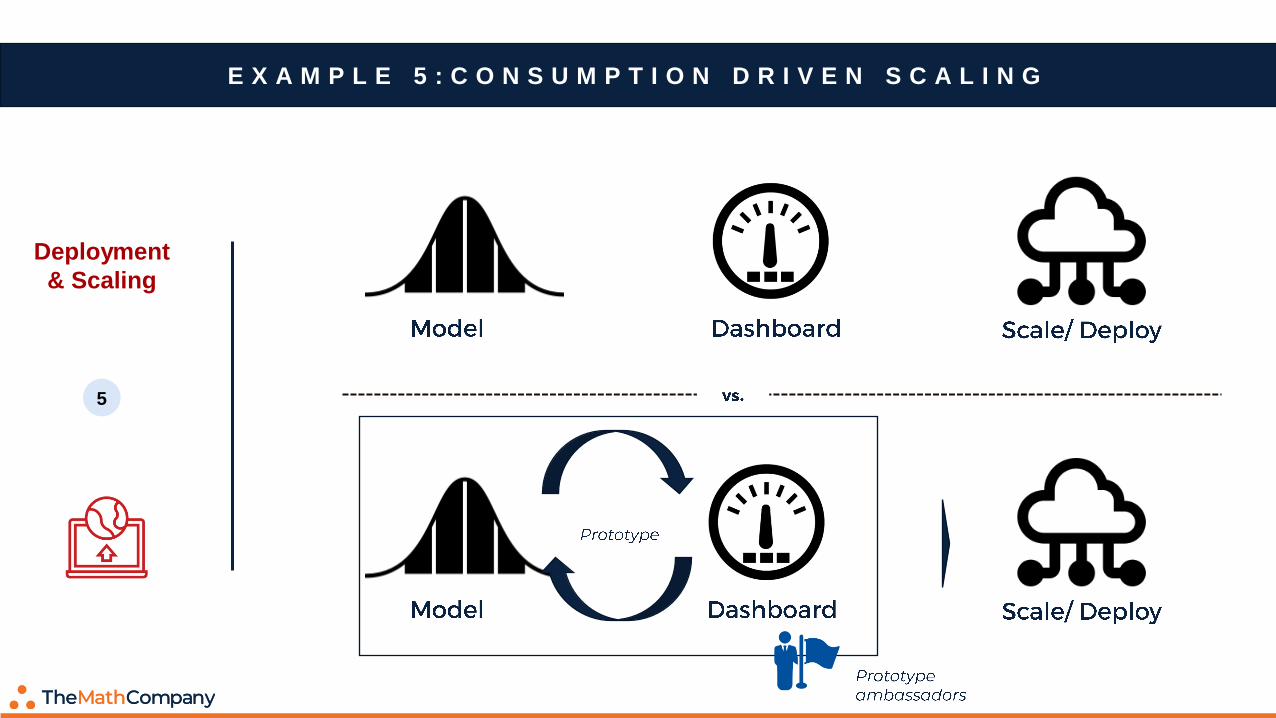
E X A M P L E 5 : C O N S U M P T I O N D R I V E N S C A L I N G
5
Deployment
& Scaling


Problem Definition
Analytics Translation
Model Design & Build
Dashboard Development
Deployment & Scale
Outcome
based thinkingEmpathy Regenerative
IdeationPrototyping
Problem summary
Program outcomes
Stakeholder summary
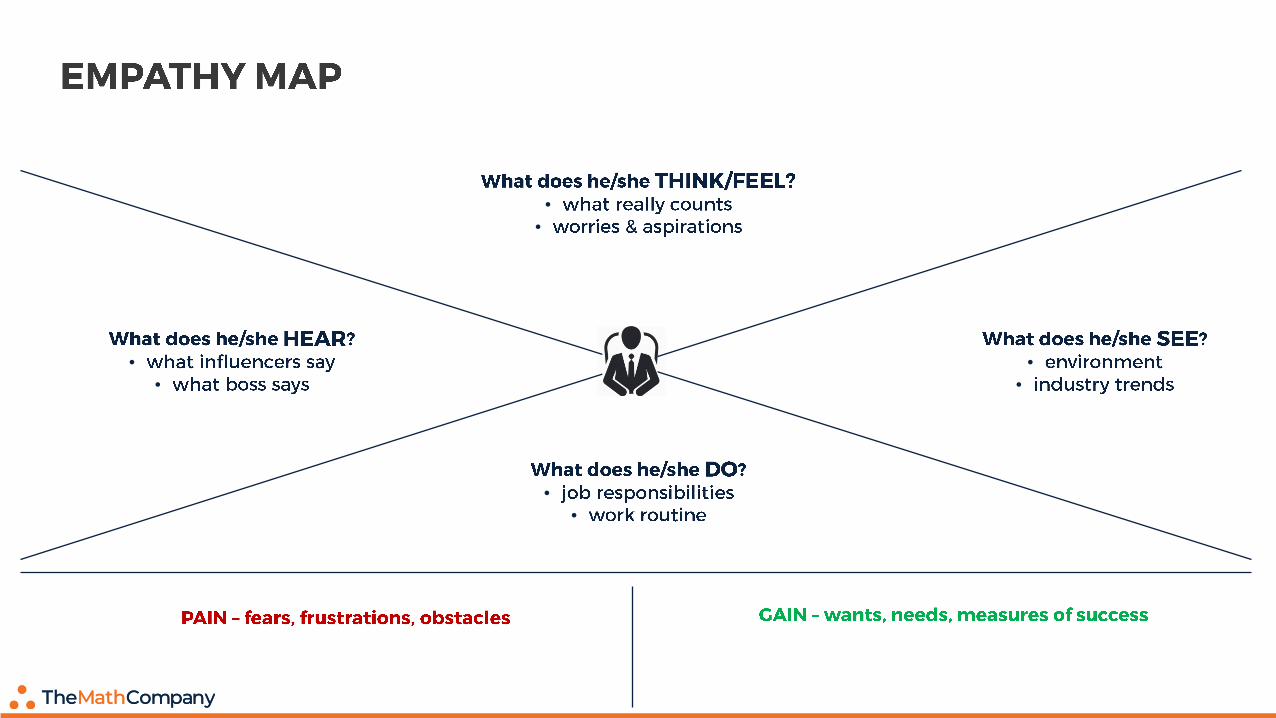
Empathy map
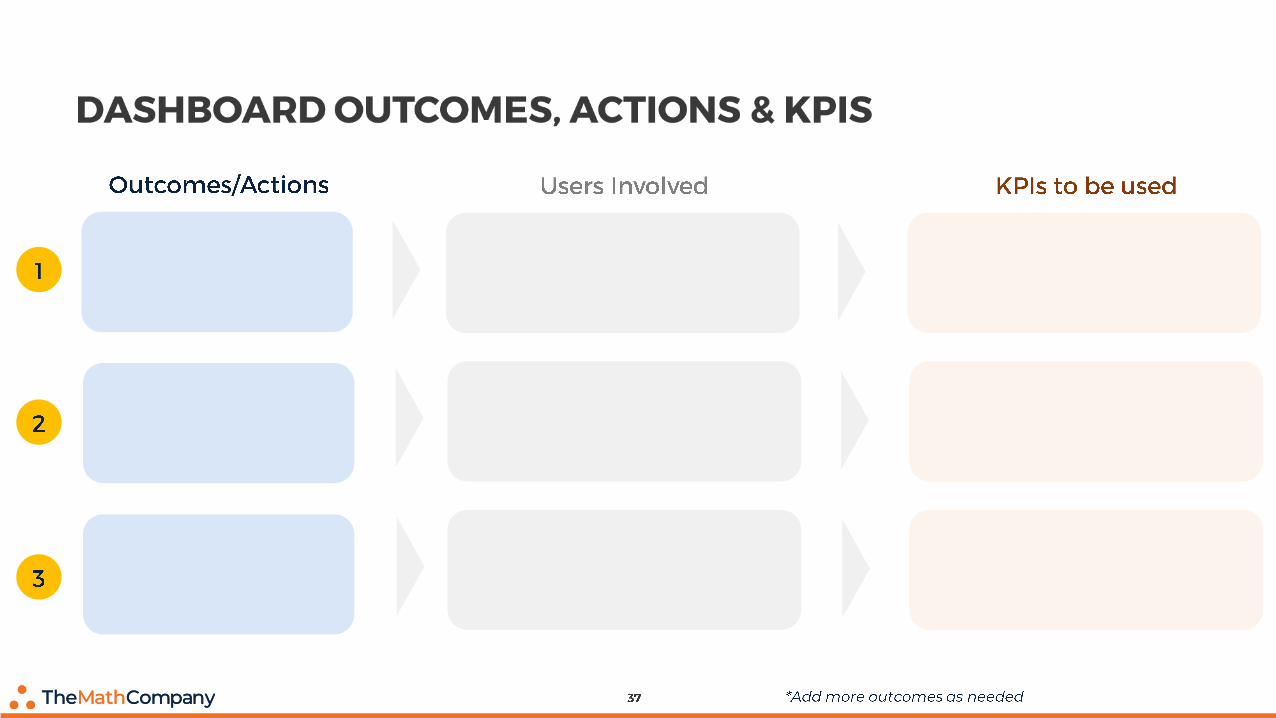
Model diagnostics (for business)
Report usage stats
MI reporting
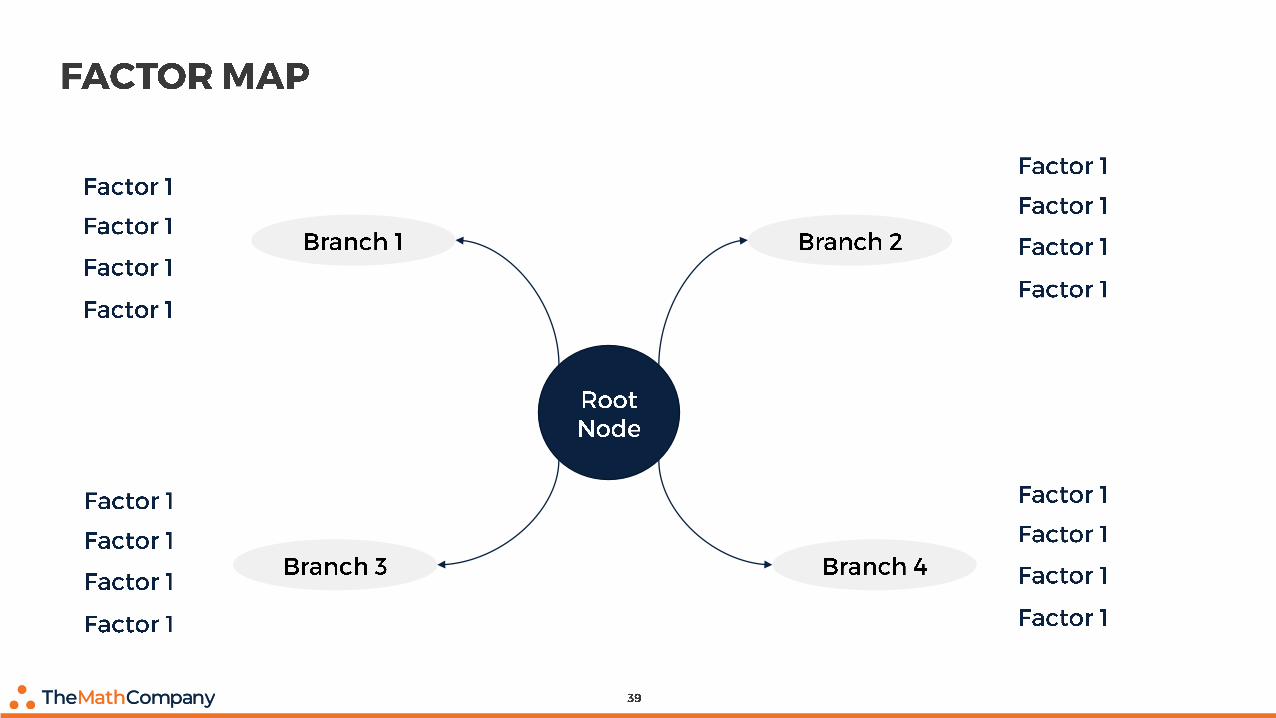
Factor map
Hypotheses matrix
KPI summary templates
Dashboard mockupsUser story
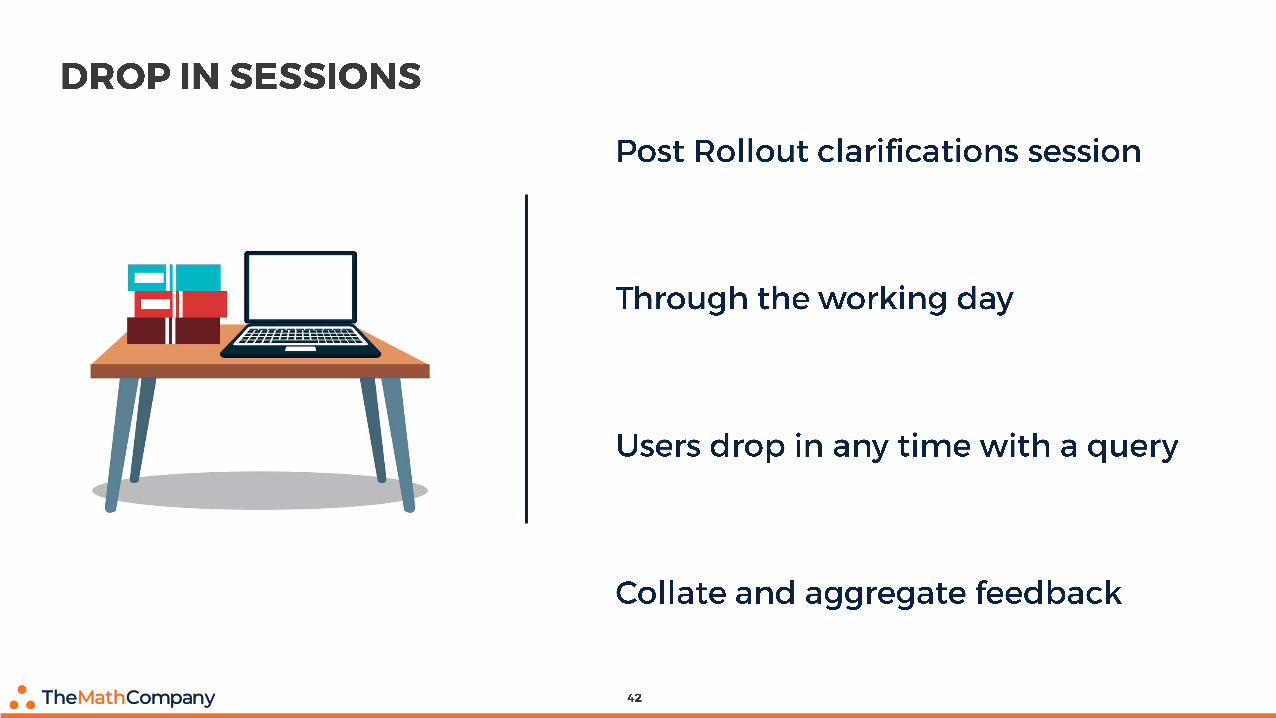
Drop in sessions
Change logs
Program v2.0
Solution alignment
Decision matrix
Model pilot by category
Prototype ambassadors
Model lifecycle management


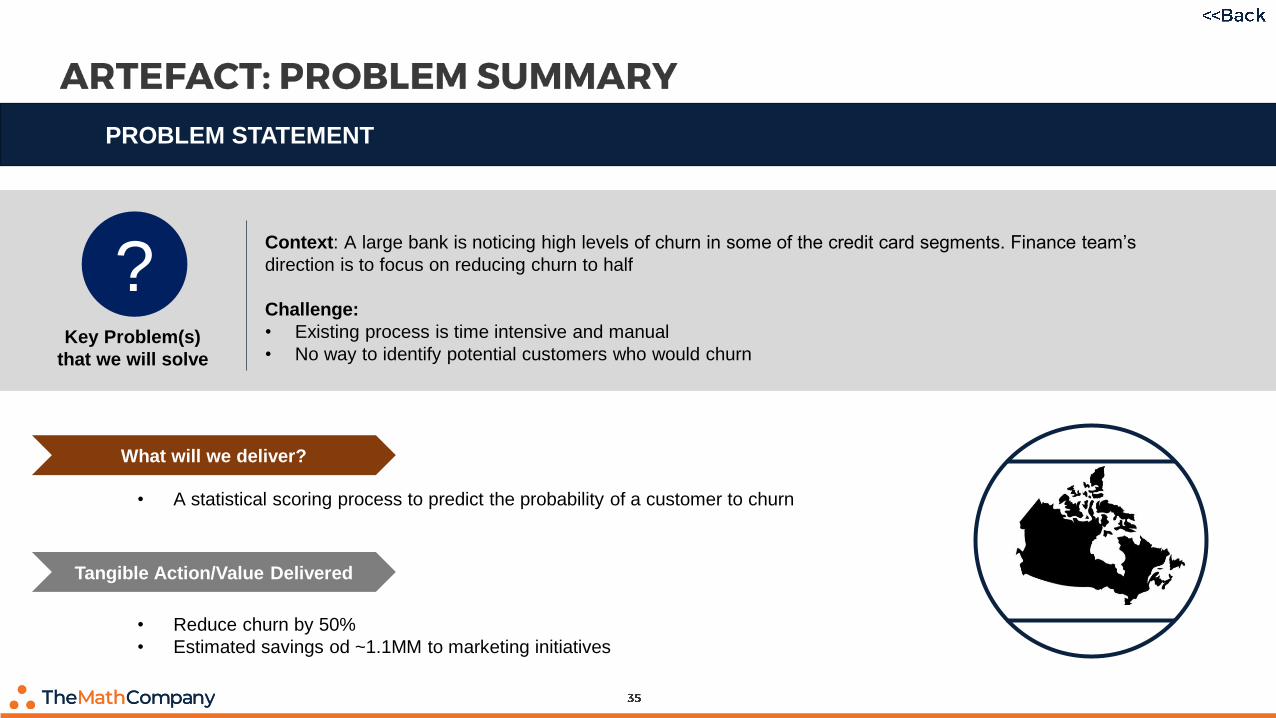
?Key Problem(s)
that we will solve
• A statistical scoring process to predict the probability of a customer to churn
• Reduce churn by 50%
• Estimated savings od ~1.1MM to marketing initiatives
What will we deliver?
Tangible Action/Value Delivered
Context: A large bank is noticing high levels of churn in some of the credit card segments. Finance team’s
direction is to focus on reducing churn to half
Challenge:
• Existing process is time intensive and manual
• No way to identify potential customers who would churn
PROBLEM STATEMENT
•
•
•
•
•
•
•
•

Analytics problem
Scoring business customers on propensity to churn/stop using credit cards
Accounting for marketing team’s actionability is critical to make the program successful
Key solution considerations
▪ Multiple models should be built for cascading effect
▪ Allow 3 weeks’ of lag to let marketing team build and design preventive campaigns for ‘High risk’ customers
▪ Design a test-control experiment to showcase efficacy of existing model over natural selection
Stakeholders & Expectations


![Kevin Moran · Empathy Map 1. Empathy Map 2. Empathy Map 3. Storyboards. Storyboard 1. Storyboard 2. User Testing Script Participant Introduction Hello [participant]. My name is Kevin,](https://img.pdfslide.us/doc/110x75/60511a1a899195775b17ac13/kevin-moran-empathy-map-1-empathy-map-2-empathy-map-3-storyboards-storyboard.jpg)