Embed Size (px)
Citation preview
““Dinero Diablos”Dinero Diablos”
Portfolio Analysis: Dashboard Diagnostics Portfolio Analysis: Dashboard Diagnostics
April 21, 2010
Presented by:
Mark RobertsonFounder and Managing Partner –
www.manifestinvesting.com
2
Dashboard Diagnostics: Dinero DiablosDashboard Diagnostics: Dinero Diablos
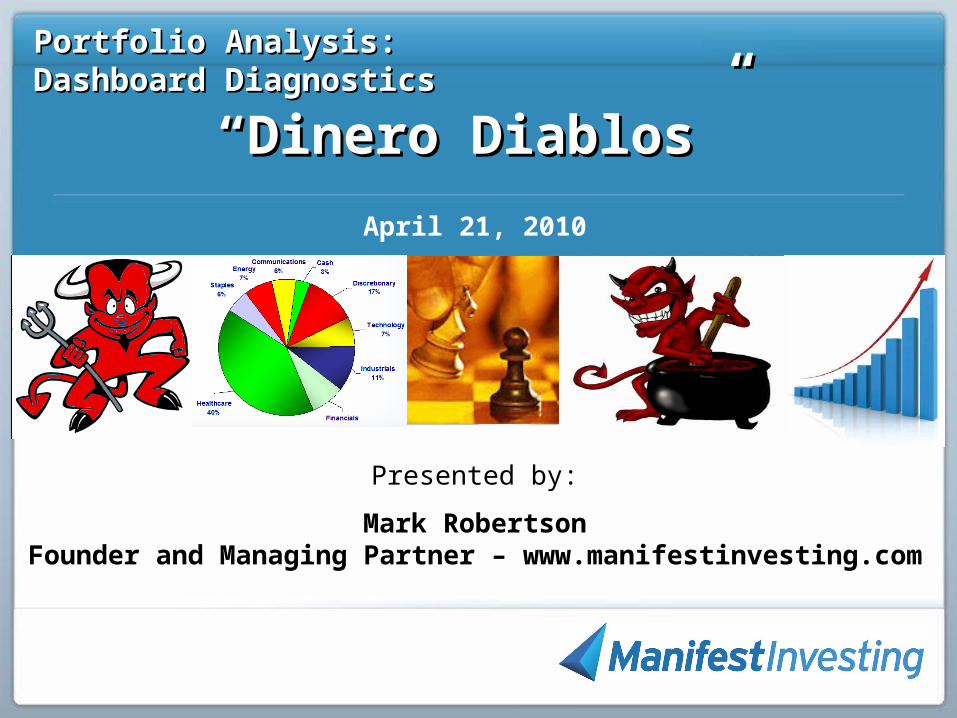
Club History & CharacteristicsClub History & Characteristics
Club Name: “Dinero Diablos”
Location: Northern California
# of Members: 16 (All-Male)
Founded: TBD
The club uses a set of rules for selling: (1) Sell Zone, (2) Sales/EPS stagnant 3-4 quarters, (3) U/D = 1,
(4) Relative Value > 150%, (5) <5-7% Total Return, (6) Down trends in margins, (7) Stock
price decline for no apparent reason.
Simplify. Treat decisions from a total portfolio perspective. Core holdings: Sell if PAR is less than money market rates. Non-Core holdings: Sell if PAR is less than market average.
3
Dashboard Diagnostics: Dinero DiablosDashboard Diagnostics: Dinero Diablos
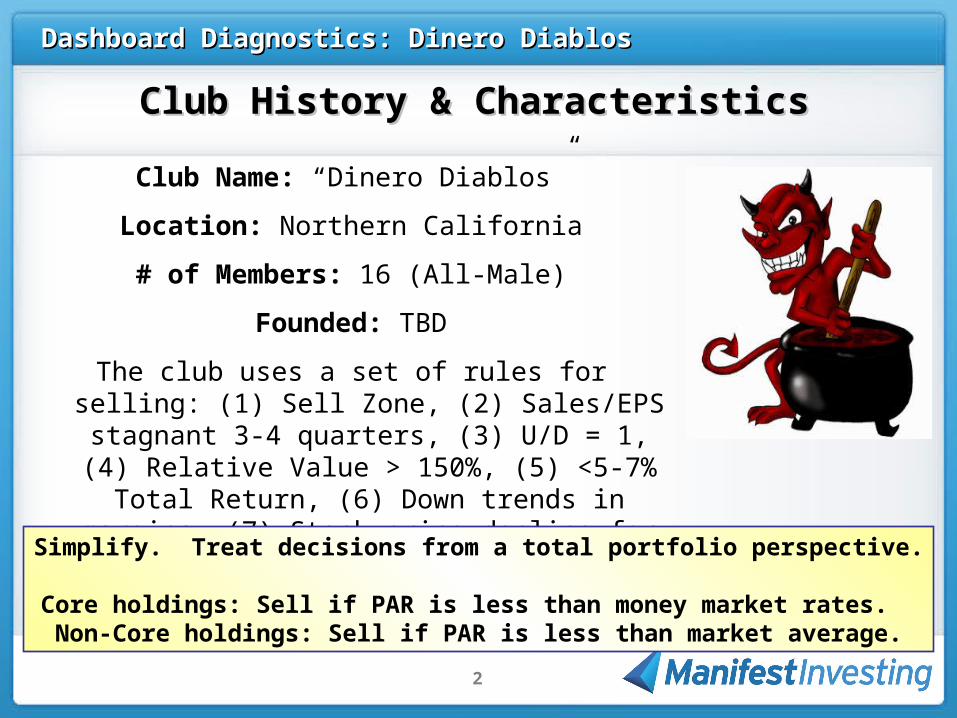
50 55 60 65 70 75 80 85 90
Quality
3% 5% 7% 9% 11% 13% 15%
Sales Growth
0% 5% 10% 15% 20%
PAR
Dashboard View: (1) Returns, (2) Quality, (3) GrowthDashboard View: (1) Returns, (2) Quality, (3) Growth
4
Dashboard Diagnostics: Dinero DiablosDashboard Diagnostics: Dinero Diablos
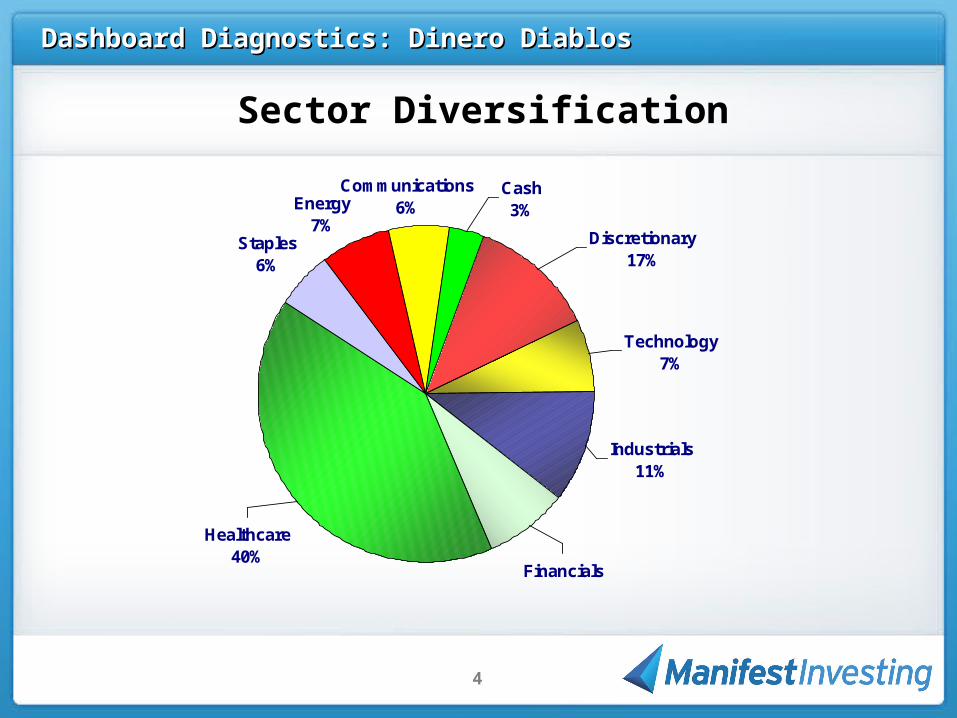
Sector Diversification
Cash3%Energy
7%Staples
6%
Communications6%
Discretionary17%
Technology7%
Industrials11%
Financials
Healthcare40%
5
Dashboard Diagnostics: Dinero DiablosDashboard Diagnostics: Dinero Diablos
6
Dashboard Diagnostics: Dinero DiablosDashboard Diagnostics: Dinero Diablos
0%
5%
10%
15%
20%
25%
30%
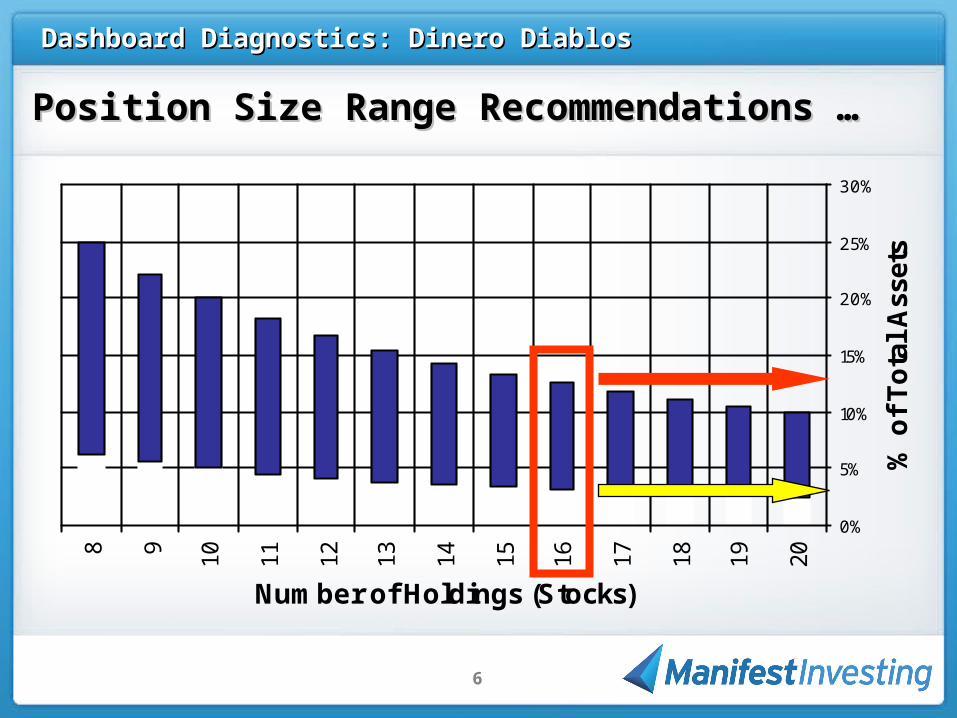
8 9 10 11 12 13 14 15 16 17 18 19 20
Number of Holdings (Stocks)
% o
f T
ota
l A
sset
s
Position Size Range Recommendations …Position Size Range Recommendations …
7
Dashboard Diagnostics: Dinero DiablosDashboard Diagnostics: Dinero Diablos
8
Dashboard Diagnostics: Dinero DiablosDashboard Diagnostics: Dinero Diablos
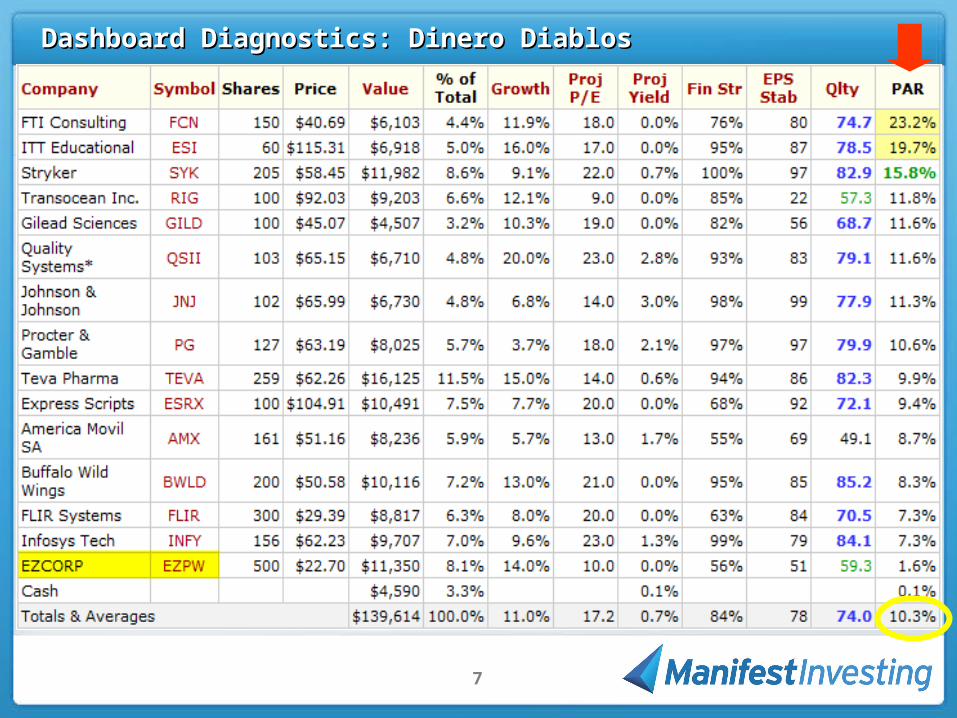
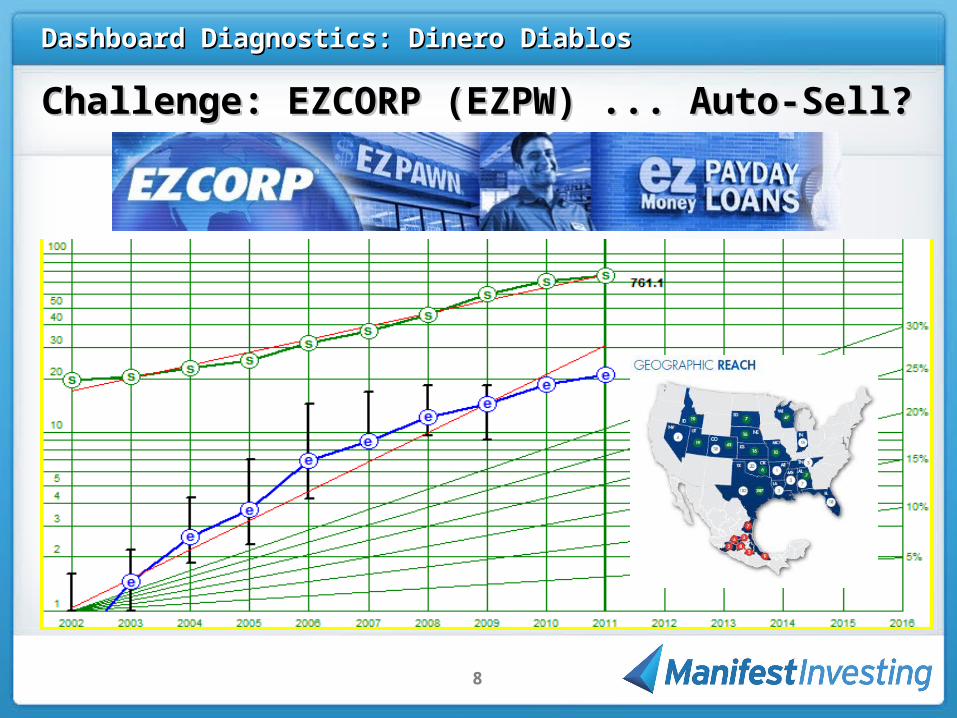
Challenge: EZCORP (EZPW) ... Auto-Sell?Challenge: EZCORP (EZPW) ... Auto-Sell?
9
Dashboard Diagnostics: Dinero DiablosDashboard Diagnostics: Dinero Diablos
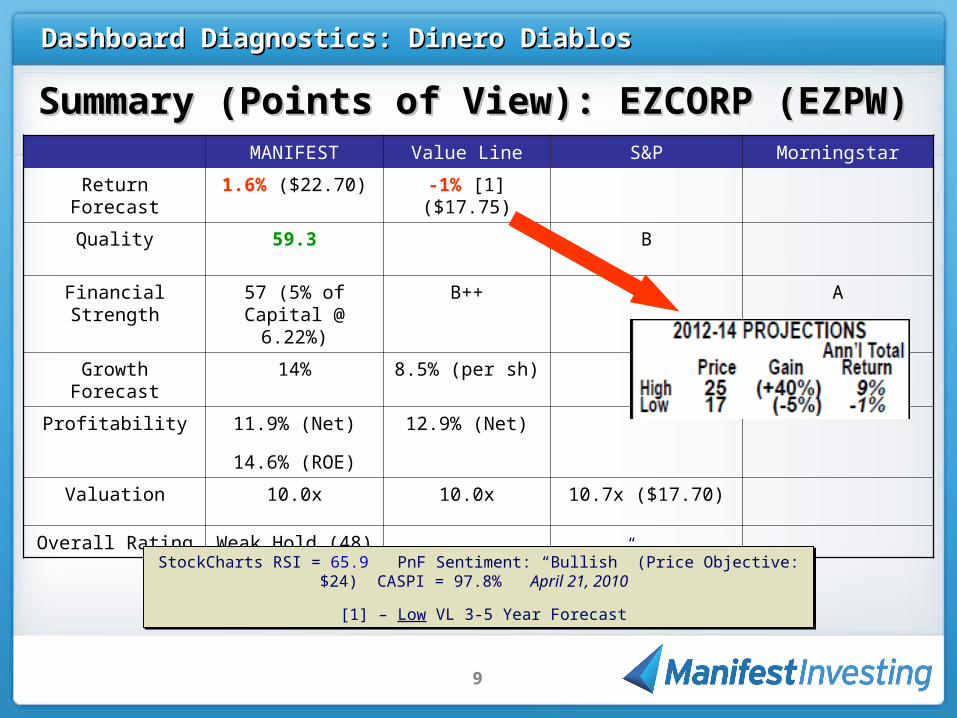
Summary (Points of View): EZCORP (EZPW) Summary (Points of View): EZCORP (EZPW) MANIFEST Value Line S&P Morningstar
Return Forecast 1.6% ($22.70) -1% [1] ($17.75)
Quality 59.3 B
Financial Strength
57 (5% of Capital @
6.22%)
B++ A
Growth Forecast 14% 8.5% (per sh)
Profitability 11.9% (Net)
14.6% (ROE)
12.9% (Net)
Valuation 10.0x 10.0x 10.7x ($17.70)
Overall Rating Weak Hold (48)
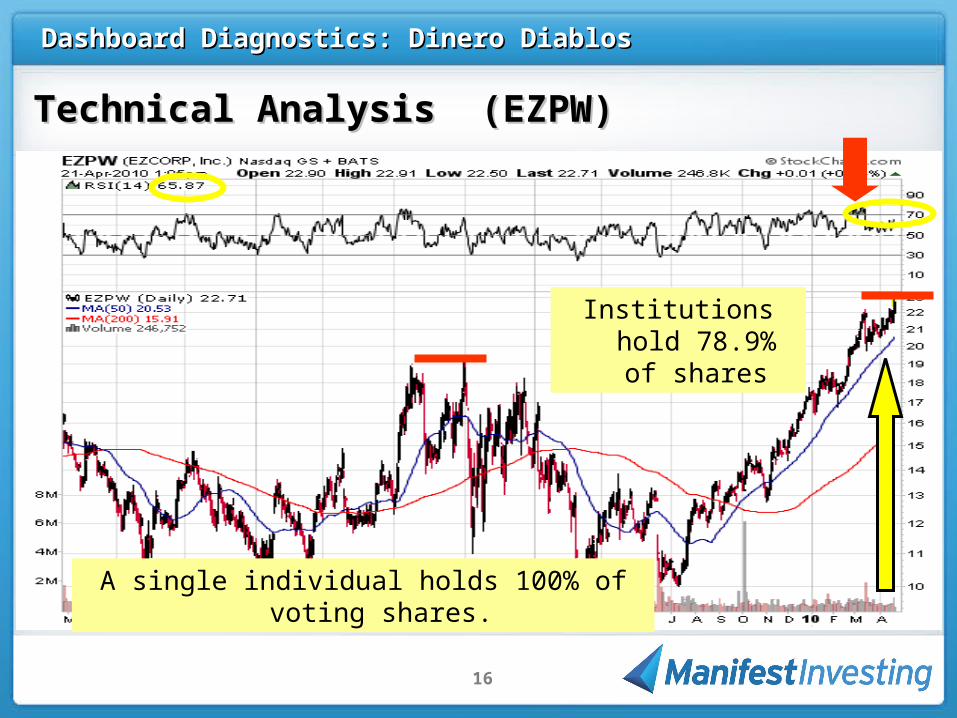
StockCharts RSI = 65.9 PnF Sentiment: “Bullish” (Price Objective: $24) CASPI = 97.8% April 21, 2010
[1] – Low VL 3-5 Year Forecast
StockCharts RSI = 65.9 PnF Sentiment: “Bullish” (Price Objective: $24) CASPI = 97.8% April 21, 2010
[1] – Low VL 3-5 Year Forecast
10
Dashboard Diagnostics: Dinero DiablosDashboard Diagnostics: Dinero Diablos
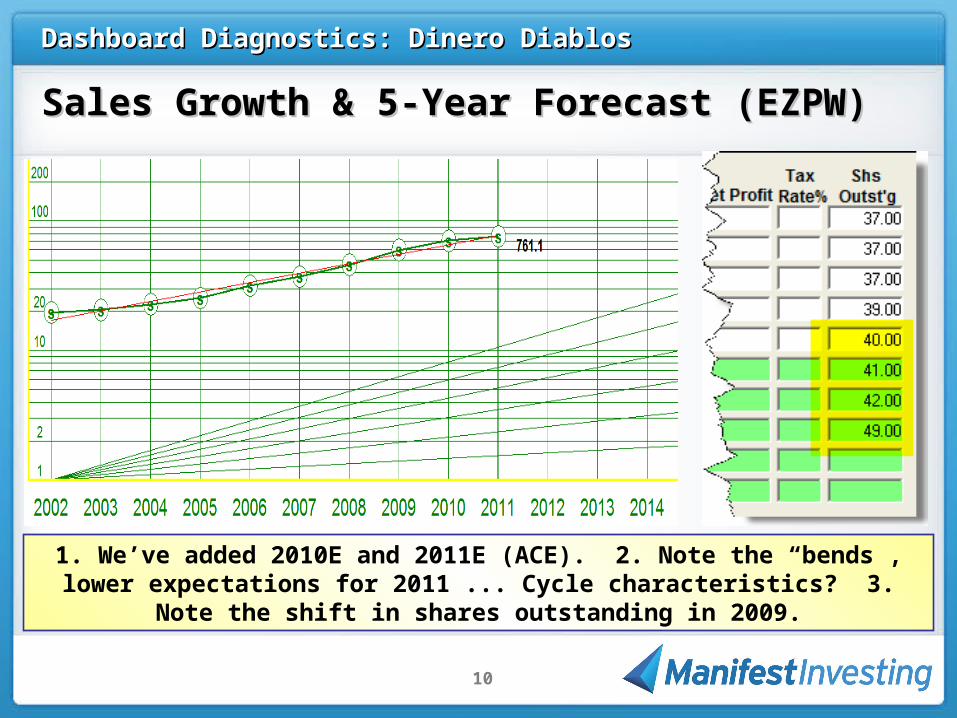
Sales Growth & 5-Year Forecast (EZPW)Sales Growth & 5-Year Forecast (EZPW)
1. We’ve added 2010E and 2011E (ACE). 2. Note the “bends”, lower expectations for 2011 ... Cycle characteristics? 3. Note the
shift in shares outstanding in 2009.
11
Dashboard Diagnostics: Dinero DiablosDashboard Diagnostics: Dinero Diablos
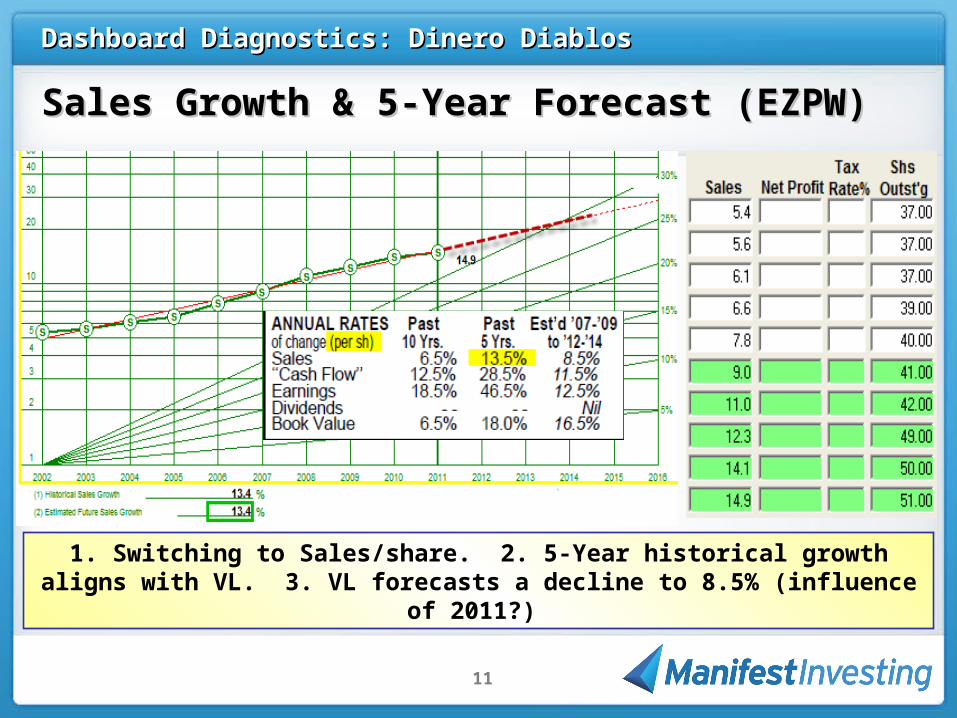
Sales Growth & 5-Year Forecast (EZPW)Sales Growth & 5-Year Forecast (EZPW)
1. Switching to Sales/share. 2. 5-Year historical growth aligns with VL. 3. VL forecasts a decline to 8.5% (influence of 2011?)
12
Dashboard Diagnostics: Dinero DiablosDashboard Diagnostics: Dinero Diablos
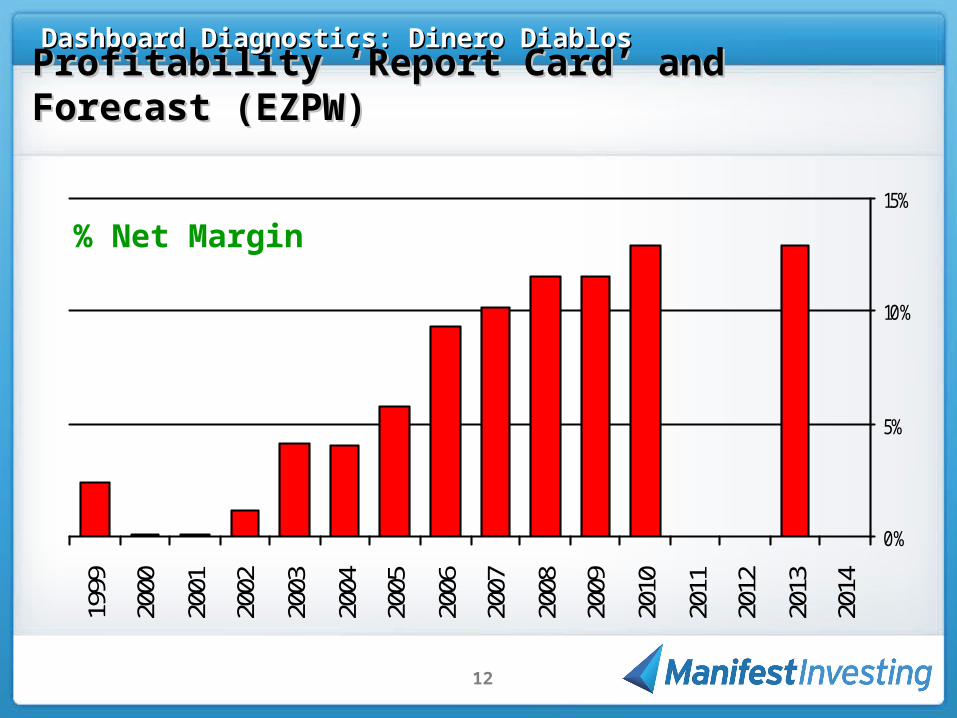
0%
5%
10%
15%
1999
2000
2001
2002
2003
2004
2005
2006
2007
2008
2009
2010
2011
2012
2013
2014
% Net Margin
Profitability ‘Report Card’ and Forecast (EZPW)Profitability ‘Report Card’ and Forecast (EZPW)
13
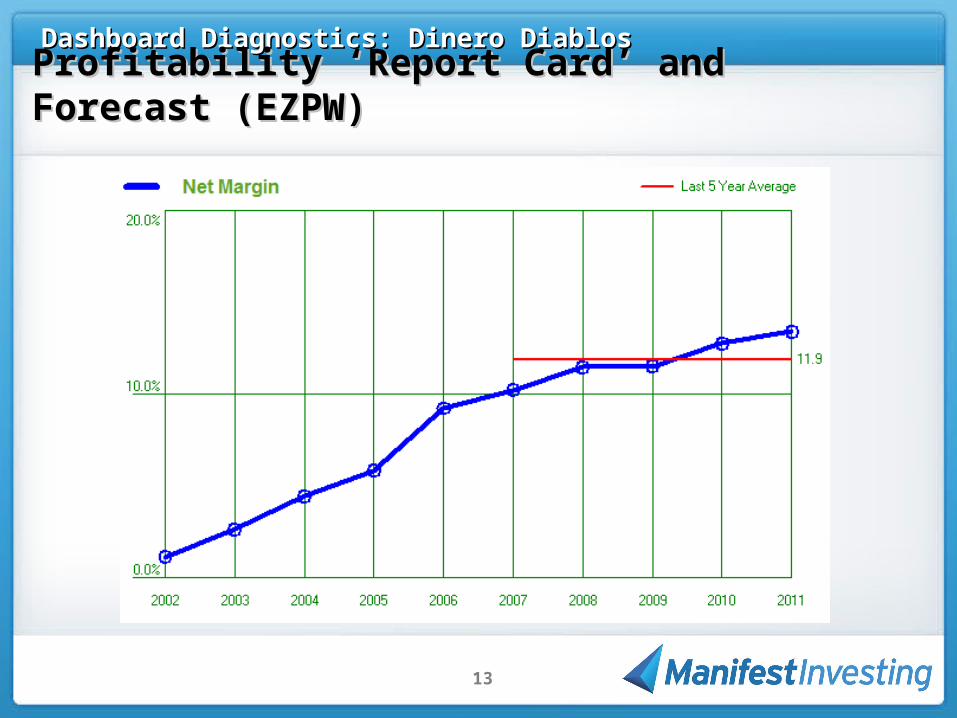
Dashboard Diagnostics: Dinero DiablosDashboard Diagnostics: Dinero Diablos
Profitability ‘Report Card’ and Forecast (EZPW)Profitability ‘Report Card’ and Forecast (EZPW)
14
Dashboard Diagnostics: Dinero DiablosDashboard Diagnostics: Dinero Diablos
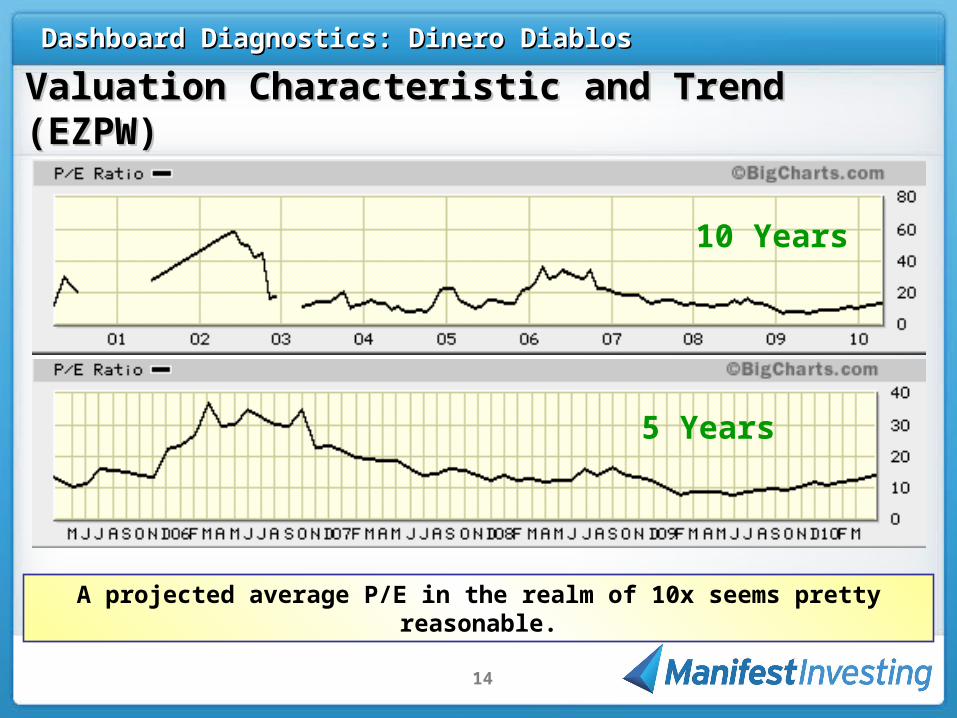
Valuation Characteristic and Trend (EZPW)Valuation Characteristic and Trend (EZPW)
A projected average P/E in the realm of 10x seems pretty reasonable.
10 Years
5 Years
15
Dashboard Diagnostics: Dinero DiablosDashboard Diagnostics: Dinero Diablos
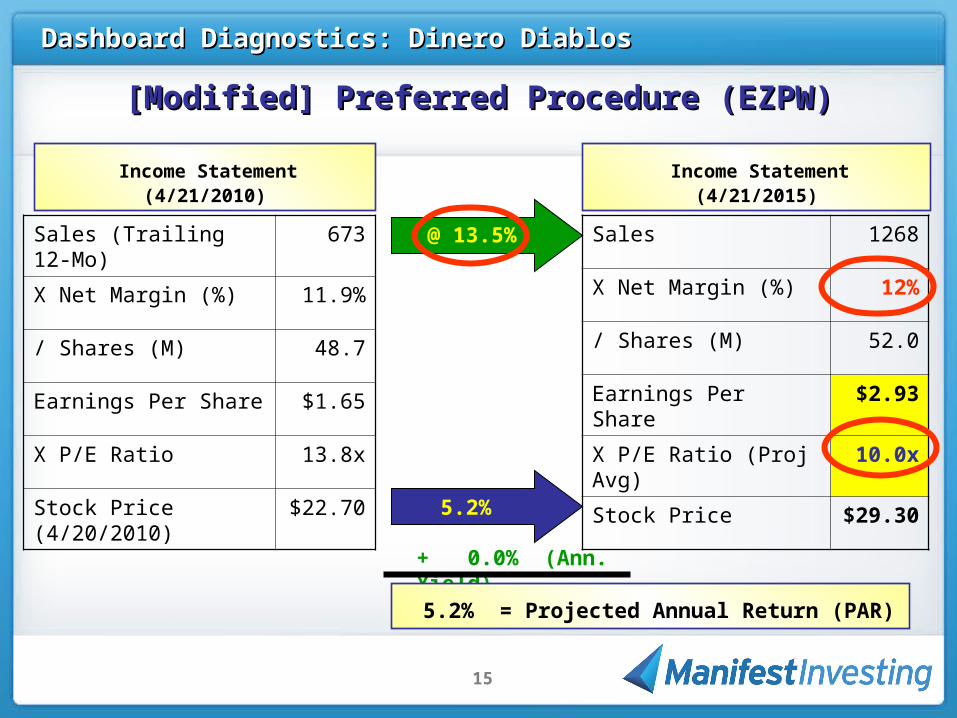
[Modified] Preferred Procedure (EZPW)[Modified] Preferred Procedure (EZPW)
Sales (Trailing 12-Mo) 673
X Net Margin (%) 11.9%
/ Shares (M) 48.7
Earnings Per Share $1.65
X P/E Ratio 13.8x
Stock Price (4/20/2010) $22.70
Income Statement (4/21/2010)
Income Statement (4/21/2015)
Sales 1268
X Net Margin (%) 12%
/ Shares (M) 52.0
Earnings Per Share $2.93
X P/E Ratio (Proj Avg) 10.0x
Stock Price $29.30
@ 13.5%
5.2%
+ 0.0% (Ann. Yield)
5.2% = Projected Annual Return (PAR)
16
Dashboard Diagnostics: Dinero DiablosDashboard Diagnostics: Dinero Diablos
Technical Analysis (EZPW)Technical Analysis (EZPW)
Institutions hold 78.9% of shares
A single individual holds 100% of voting shares.
17
Dashboard Diagnostics: Dinero DiablosDashboard Diagnostics: Dinero Diablos
Ask the Audience: Would you sell EZPW?Ask the Audience: Would you sell EZPW?
Yes, Sell!Yes, Sell!
No. Hold, I feel lots of No. Hold, I feel lots of momentum with this one.momentum with this one.
18
Dashboard Diagnostics: Dinero DiablosDashboard Diagnostics: Dinero Diablos
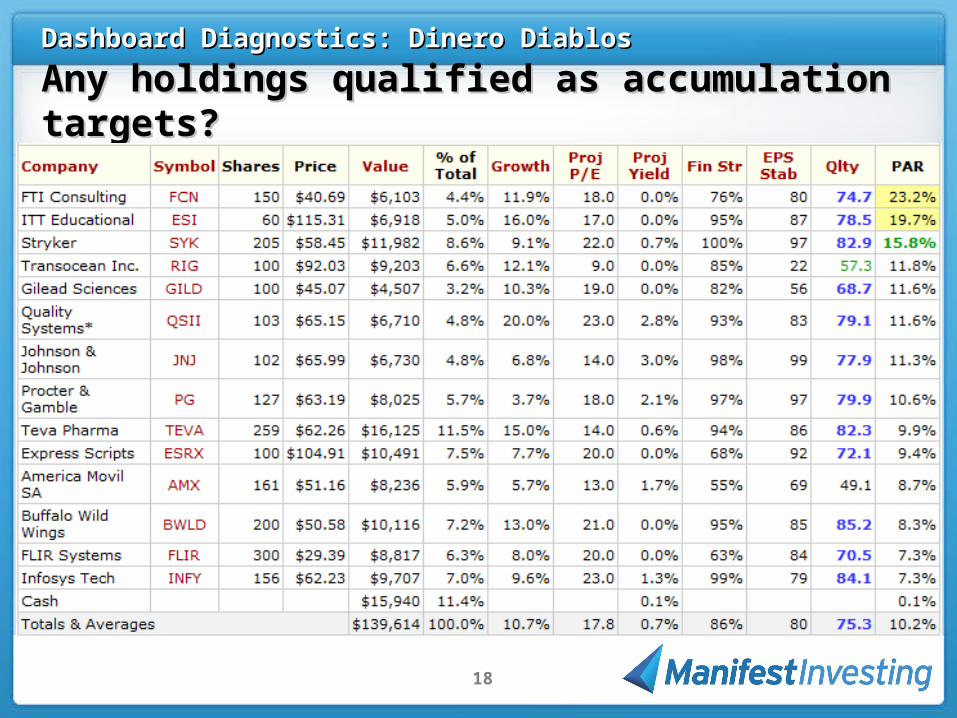
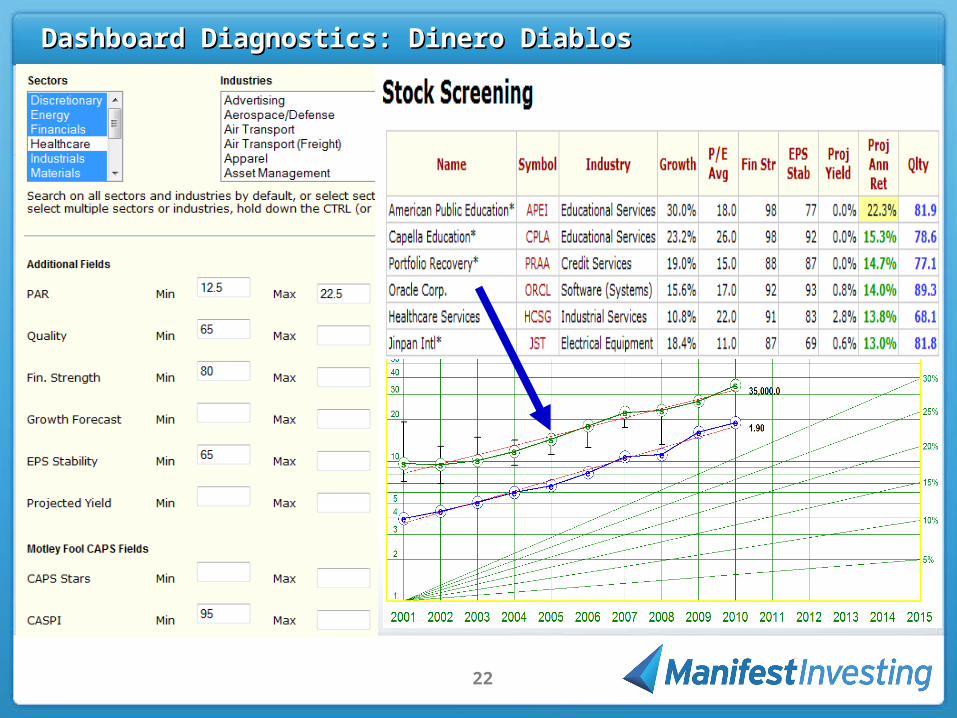
Any holdings qualified as accumulation targets?Any holdings qualified as accumulation targets?
19
Dashboard Diagnostics: Dinero DiablosDashboard Diagnostics: Dinero Diablos
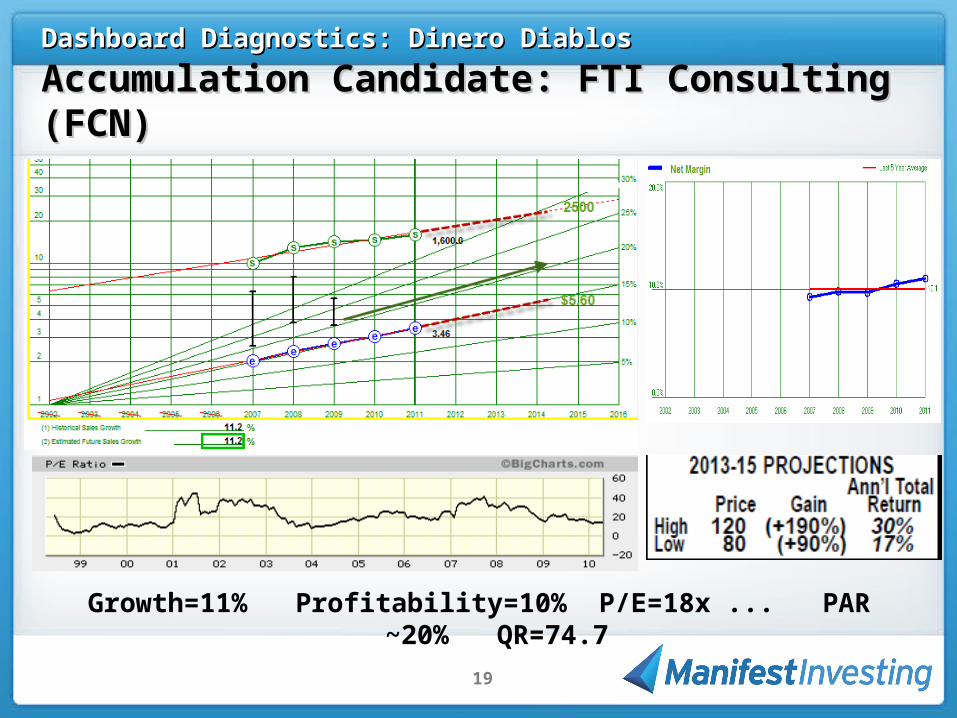
Accumulation Candidate: FTI Consulting (FCN)Accumulation Candidate: FTI Consulting (FCN)
Growth=11% Profitability=10% P/E=18x ... PAR ~20% QR=74.7
20
Dashboard Diagnostics: Dinero DiablosDashboard Diagnostics: Dinero Diablos
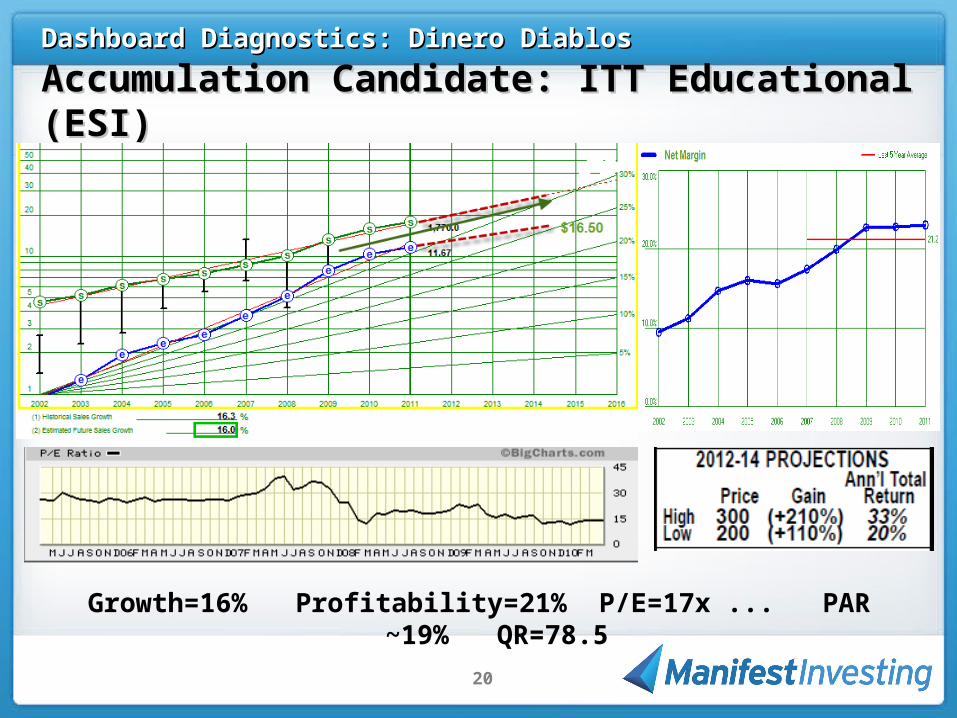
Accumulation Candidate: ITT Educational (ESI)Accumulation Candidate: ITT Educational (ESI)
Growth=16% Profitability=21% P/E=17x ... PAR ~19% QR=78.5
21
Dashboard Diagnostics: Dinero DiablosDashboard Diagnostics: Dinero Diablos
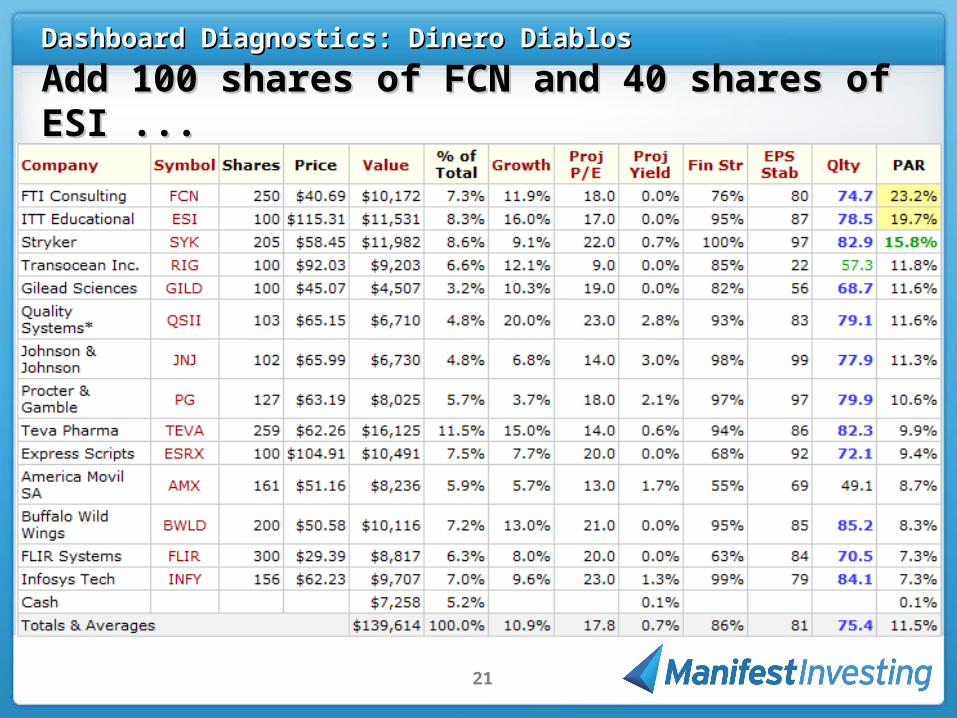
Add 100 shares of FCN and 40 shares of ESI ...Add 100 shares of FCN and 40 shares of ESI ...
22
Dashboard Diagnostics: Dinero DiablosDashboard Diagnostics: Dinero Diablos
23
Dashboard Diagnostics: Dinero DiablosDashboard Diagnostics: Dinero Diablos
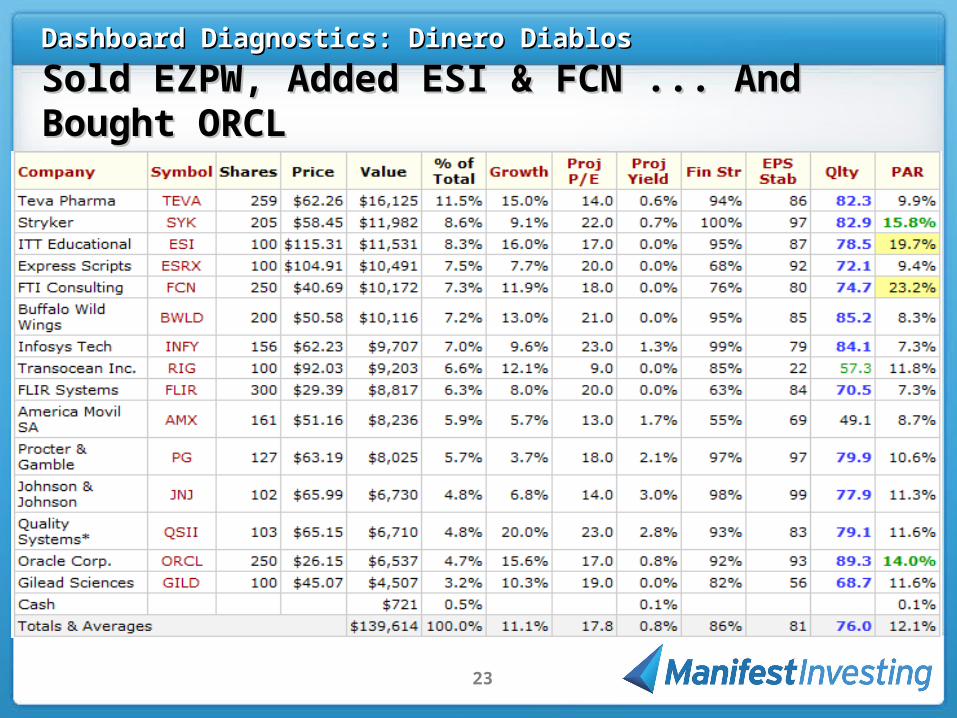
Sold EZPW, Added ESI & FCN ... And Bought ORCLSold EZPW, Added ESI & FCN ... And Bought ORCL
24
Dashboard Diagnostics: Dinero DiablosDashboard Diagnostics: Dinero Diablos
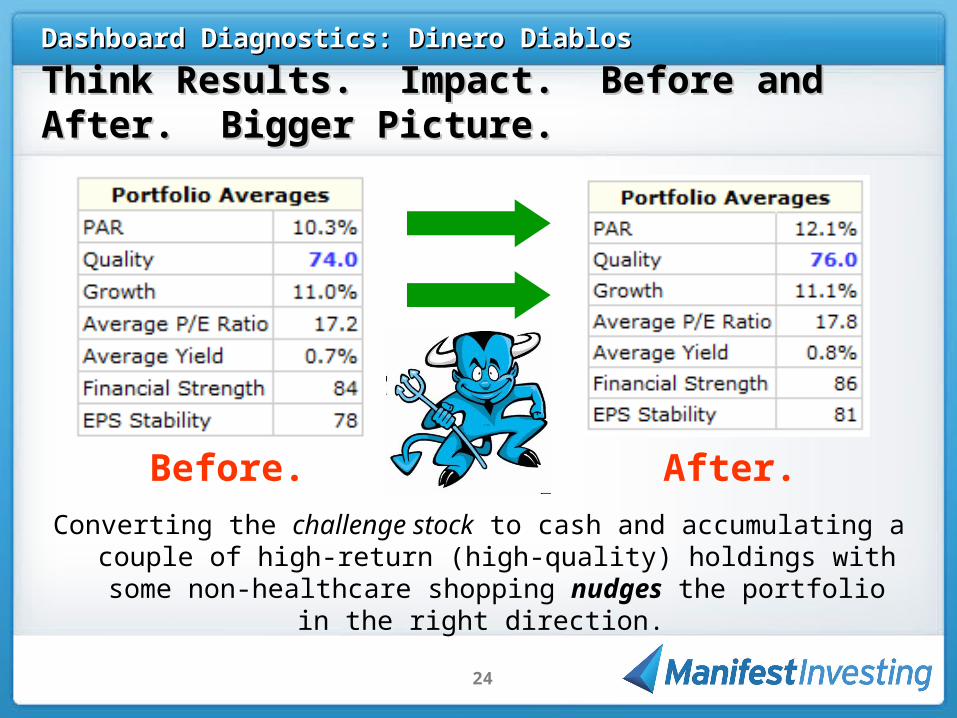
Think Results. Impact. Before and After. Bigger Picture.Think Results. Impact. Before and After. Bigger Picture.
Before. After.
Converting the challenge stock to cash and accumulating a couple of high-return (high-quality) holdings with some non-healthcare
shopping nudges the portfolio in the right direction.