Embed Size (px)
Citation preview
Mountain Weather and Climate
Third Edition
Mountains and high plateau areas account for a quarter of the Earth’s land surface.
They give rise to a wide range ofmeteorological phenomena and distinctive climatic
characteristics of consequence for ecology, forestry, glaciology and hydrology.
Mountain Weather and Climate remains the only comprehensive text describing
and explaining mountain weather and climate processes. It presents the results of a
broad range of studies drawn from across the world.
Following an introductory survey of the historical aspects of mountain meteo-
rology, three chapters deal with the latitudinal, altitudinal and topographic controls
of meteorological elements in mountains, circulation systems related to orography,
and the climatic characteristics of mountains. The author supplies regional case
studies of selected mountain climates from New Guinea to the Yukon, a chapter
on bioclimatology that examines human bioclimatology, weather hazards and air
pollution, and a concluding chapter on the evidence for and the significance of
changes in mountain climates.
Since the first edition of this book appeared over two decades ago several impor-
tant field programs have been conducted in mountain areas. Notable among these
have been the European Alpine Experiment and related investigations of local
winds, studies of air drainage in complex terrain in the western United States and
field laboratory experiments on air flow over low hills. Results from these investi-
gations and other research are incorporated in this new edition and all relevant
new literature is referenced.
ROGER G . BARRY is Distinguished Professor of Geography at the University of
Colorado and Director, World Data Center for Glaciology and the National Snow
and Ice Data Center, Boulder.
© Cambridge University Press www.cambridge.org
Cambridge University Press978-0-521-86295-0 - Mountain Weather and Climate, Third EditionRoger G. BarryFrontmatterMore information
MOUNTAINWEATHER ANDCLIMATE
THIRD EDITION
ROGER G. BARRY
University of Colorado, Boulder, USA
© Cambridge University Press www.cambridge.org
Cambridge University Press978-0-521-86295-0 - Mountain Weather and Climate, Third EditionRoger G. BarryFrontmatterMore information
CAMBRIDGE UNIVERS ITY PRESS
Cambridge, New York, Melbourne, Madrid, Cape Town, Singapore, Sao Paulo, Delhi
Cambridge University PressThe Edinburgh Building, Cambridge CB2 8RU, UK
Published in the United States of America by Cambridge University Press, New York
www.cambridge.orgInformation on this title: www.cambridge.org/9780521862950
# R. Barry 2008
This publication is in copyright. Subject to statutory exceptionand to the provisions of relevant collective licensing agreements,no reproduction of any part may take place withoutthe written permission of Cambridge University Press.
First published 2008
Printed in the United Kingdom at the University Press, Cambridge
A catalog record for this publication is available from the British Library
ISBN 978-0-521-86295-0 hardbackISBN 978-0-521-68158-2 paperback
Cambridge University Press has no responsibility for the persistence or accuracy of URLs for externalor third-party internet websites referred to in this publication, and does not guarantee that anycontent on such websites is, or will remain, accurate or appropriate.
© Cambridge University Press www.cambridge.org
Cambridge University Press978-0-521-86295-0 - Mountain Weather and Climate, Third EditionRoger G. BarryFrontmatterMore information
CONTENTS
List of figures page vii
List of tables xix
Preface to the Third Edition xxi
Acknowledgments xxii
1 Mountains and their climatological study 1
1.1 Introduction 1
1.2 Characteristics of mountain areas 2
1.3 History of research into mountain weather and climate 5
1.4 The study of mountain weather and climate 11
2 Geographical controls of mountain meteorological elements 24
2.1 Latitude 24
2.2 Continentality 26
2.3 Altitude 31
2.4 Topography 72
2.5 Notes 108
3 Circulation systems related to orography 125
3.1 Dynamic modification 125
3.2 Thermally induced winds 186
3.3 Notes 230
4 Climatic characteristics of mountains 251
4.1 Energy budgets 251
4.2 Temperature 259
4.3 Clouds 266
4.4 Precipitation 273
4.5 Other hydrometeors 316
4.6 Evaporation 328
4.7 Notes 342
5 Regional case studies 363
5.1 Equatorial mountains – New Guinea and East Africa 363
5.2 The Himalaya 368
© Cambridge University Press www.cambridge.org
Cambridge University Press978-0-521-86295-0 - Mountain Weather and Climate, Third EditionRoger G. BarryFrontmatterMore information
5.3 Sub-tropical desert mountains – the Hoggar and Tibesti 378
5.4 Central Asia 381
5.5 The Alps 386
5.6 The maritime mountains of Great Britain 397
5.7 The Rocky Mountains in Colorado 401
5.8 The sub-polar St. Elias mountains – Alaska/Yukon 407
5.9 High plateaus 411
5.10 The Andes 421
5.11 New Zealand Alps 426
5.12 Note 427
6 Mountain bioclimatology 444
6.1 Human bioclimatology 444
6.2 Weather hazards 456
6.3 Air pollution in mountain regions 460
7 Changes in mountain climates 474
7.1 Evidence 474
7.2 Significance 486
Appendix 495
Index 497
C ON T E N T S vi
© Cambridge University Press www.cambridge.org
Cambridge University Press978-0-521-86295-0 - Mountain Weather and Climate, Third EditionRoger G. BarryFrontmatterMore information
FIGURES
1.1 Latitudinal cross-section of the highest summits, highest and lowest snow
lines, and highest and lowest upper limits of timberline (from Barry and
Ives, 1974). page 3
1.2 Alpine and highland zones and their climatic characteristics (after
N. Crutzberg, from Ives and Barry, 1974). 5
1.3 The Sonnblick Observatory in April 1985 (R. Boehm). 7
1.4 The mountain atmosphere (after Ekhart, 1948). 12
1.5 Scales of climatic zonation in mountainous terrain (after Yoshino, 1975). 13
1.6 Automatic weather station in the Andes (D. Hardy). 15
2.1 (a) and (b) Daily Sun paths at latitudes 608N and 308N (from Smithsonian
Meteorological Tables, 6th edn). 25
2.2 Thermoisopleth diagrams of mean hourly temperatures (8C) at(a) Pangrango, Java, 78 S, 3022m (after Troll, 1964) and (b) Zugspitze,
Germany, 478N, 2962m (after Hauer, 1950). 27
2.3 Mean daily temperature range versus latitude for a number of high valley
and summit stations (after Lauscher, 1966). 28
2.4 Examples of the relations with altitude of hygric continentality, winter
snow cover duration and thermal continentality, and tree species in
Austria (after Aulitsky et al., 1982). 31
2.5 Annual averages and range of monthly means of absolute humidity (gm�3)
as a function of altitude in tropical South America (after Prohaska, 1970). 34
2.6 Profiles of zenith-path transmissivity for a clean, dry atmosphere with ozone,
a clean, wet atmosphere and a dirty, wet atmosphere; profiles of the theoretical
transmissivity index (K) of W. P. Lowry are also shown for K¼ 1, 2, and 4
(after Lowry, 1980b). 37
2.7 Direct solar radiation versus altitude in an ideal atmosphere for m ¼ 1
(after Kastrov, in Kondratyev, 1969; p. 262) and as observed at mountain
stations (based on Abetti, 1957; Kimball, 1927; Pope 1977). 39
2.8 Altitudinal variation of seasonal mean values (Wm�2 km�1), of (a) all-sky
shortwave radiation; (b) upward longwave (infrared) radiation; and
(c) downward longwave radiation measured at ASRB stations in the
Swiss Alps (adapted from Marty et al., 2002). 41
2.9 Global solar radiation versus cloud amount at different elevations in the
Austrian Alps in June and December (based on Sauberer and Dirmhirn, 1958). 43
© Cambridge University Press www.cambridge.org
Cambridge University Press978-0-521-86295-0 - Mountain Weather and Climate, Third EditionRoger G. BarryFrontmatterMore information
2.10 Diffuse (sky) radiation versus cloud amount in winter and summer at different
elevations in the Alps (from Sauberer and Dirmhirn, 1958). 44
2.11 Curvilinear relationships between the cloud modification factor (CMF)
and UV radiation reported by different sources (from Calbo et al., 2005). 47
2.12 Altitudinal variation of seasonal and annual mean values of all-sky net
radiation (Rn, Wm�2 km�1) measured at ASRB stations in the Swiss Alps
(adapted from Marty et al., 2002). 50
2.13 The ratio of net radiation (Rn) to solar radiation (S) versus height in the
Caucasus in summer (after Voloshina, 1966). 51
2.14 Lapse rates of minimum, mean and maximum temperatures in the Alps
(after Rolland, 2003). 54
2.15 Schematic vertical temperature profiles on a clear winter night for three
topographic situations: (a) isolated mountain; (b) limited plateau;
(c) extensive plateau; and a generalized model of the effects of local and
large-scale mountain topography on the depth of the seasonally-modified
atmosphere (after Tabony, 1985). 55
2.16 The annual variation of altitudinal gradients of air temperature and 30 cm
soil temperature between two upland stations in the Pennines and the
lowland station of Newton Rigg (from Green and Harding, 1979). 56
2.17 Differences between altitudinal gradients of soil and air temperature at
pairs of stations in Europe (from Green and Harding, 1980). 58
2.18 Mean daily temperature range versus altitude in different mountain and
highland areas: I, Alps; II, western USA; III, eastern Africa; IV, Himalya;
V, Ethiopian highlands (after Lauscher, 1966). 59
2.19 Mean daily temperatures in the free air and at mountain stations in
the Alps (after Hauer, 1950). 62
2.20 Mean summit–free air temperature differences (K) in the Alps as a function
of time and wind speed (after Richner and Phillips, 1984). 63
2.21 Mean summit–free air temperature differences in the Alps as a function of
cloud cover (eighths) for 00 and 12 UT (after Richner and Phillips, 1984). 63
2.22 Components of the mean daily thermal circulation (cm s�1) above Tibet
(from Flohn, 1974). 66
2.23 Plots of the temperature structure above plateau surfaces at 900, 700 and
500mb, plotted as differences between the temperatures calculated above
elevated and sea-level surfaces for four values of Bowen ratio, � (from
Molnar and Emanuel, 1999). 67
2.24 Schematic illustration of the effects on surface and boundary layer
temperatures of lowland and high plateau surfaces and three different
atmospheric conditions: (a) dry, transparent atmosphere; (b) warm, moist,
semi-opaque atmosphere; (c) hot, moist opaque atmosphere (from Molnar
and Emanuel, 1999). 68
2.25 Schematic isentropes on slopes during surface heating and radiative cooling
(after Cramer and Lynott, 1961). 69
L I S T O F F I G U R E S viii
© Cambridge University Press www.cambridge.org
Cambridge University Press978-0-521-86295-0 - Mountain Weather and Climate, Third EditionRoger G. BarryFrontmatterMore information
2.26 Wind speeds observed on mountain summits (Vm) in Europe and at the
same level in the free air (Vf) (from Wahl, 1966). 73
2.27 Schematic illustration of streamlines over a hill showing phase tilt upwind
(dashed line) (from Smith, 1990). 76
2.28 Schematic illustration of a ‘‘dividing streamline’’ in stably-stratified airflow
encountering a hill (modified after Etling, 1989). 76
2.29 Generalized flow behavior over a hill for various stability conditions (after
Stull, 1988). 78
2.30 Schematic illustration of the forcing and response of airflow along (above)
and across (below) a heated barrier (from Crook and Turner, 2005). 79
2.31 Schematic illustration of the speed-up of boundary layer winds (DU) over a
low hill and the corresponding pattern of pressure anomalies (modified after
Taylor et al., 1987; Hunt and Simpson, 1982). 82
2.32 Examples of flow separation: (a) separation at a cliff top (S), joining at
J. A ‘‘bolster’’ eddy resulting from flow divergence is shown at the base of
the steep windward slope; (b) separation on a lee slope with a valley eddy.
The upper flow is unaffected; (c) separation with a small lee slope eddy.
A deep valley may cause the air to sink resulting in cloud dissipation above
it (from Scorer, 1978). 85
2.33 Average direct beam solar radiation (Wm�2) incident at the surface under
cloudless skies at Trier, West Germany and Tucson, Arizona, as a function
of slope, aspect, time of day and season of year (from Barry and Chorley,
1987, after Geiger, 1965 and Sellers, 1965). 88
2.34 Relative radiation on north- and south-facing slopes, at latitude 308N for daily
totals of extra-terrestrial direct beam radiation on 21 June (after Lee, 1978). 88
2.35 Annual totals of possible direct solar radiation according to latitude for
108 and 308 north- and south-facing slopes, in percentages relative to
those for a horizontal surface (from Kondratyev and Federova, 1977). 89
2.36 Computed global solar radiation for cloudless skies, assuming a transmission
coefficient of 0.75, between 0600 and 1000h on 23 September for Mt. Wilhelm
(D ¼ summit) area of Papua New Guinea (from Barry, 1978). 93
2.37 Components of solar and infrared radiation incident on slopes. 95
2.38 Relations between monthly soil temperatures (0–1 cm) and air temperature
(2m) near the forest limit, Obergurl, Austria (2072m), June 1954–July 1955
(Aulitsky, 1962, from Yoshino, 1975). 98
2.39 A ‘‘flagged’’ Engelmann spruce tree in the alpine forest–tundra ecotone, Niwot
Ridge, Colorado. Growth occurs only on the downward side of the stem. 99
2.40 Schematic relationships between terrain, microclimate, snow cover
and tree growth at the tree line (2170m) near Davos, Switzerland
(after Turner et al., 1975). 101
2.41 Direct and diffuse solar radiation measured on 308 slopes facingnorth-northwest and south-southwest at Hohenpeissenberg, Bavaria
(after Grunow, 1952). 103
L I S T O F F I G U R E S ix
© Cambridge University Press www.cambridge.org
Cambridge University Press978-0-521-86295-0 - Mountain Weather and Climate, Third EditionRoger G. BarryFrontmatterMore information
2.42 Differences in monthly mean ground temperatures, south slope minus
north slope, May 1950–September 1951 at Hohenpeissenberg, Bavaria.
Daily means (a) means at 1400 h (b) (after Grunow, 1952). 103
2.43 Daily mean maximum and minimum soil temperatures to 35 cm depth on
sunny and shaded slopes near the tree line, Davos (2170m) in January and
July 1968–70 (after Turner et al., 1975). 108
3.1 Schematic vertical section illustrating the response of the atmosphere to
westerly flow over a mountain range. (a) and (b) are barotropic atmospheres;
the clockwise (counterclockwise) arrows indicate the generation of anticyclonic
(cyclonic) vorticity for a northern hemisphere case. (c) and (d) are baroclinic
atmospheres (from Hoskins and Karoly, 1981). 127
3.2 The representation of northern hemisphere topography in one-degree
resolution data and in spectral models with triangular truncation at T42
and T63 (from Hoskins, 1980). 130
3.3 Flow patterns in plan view showing the effect of a three-dimensional ridge:
(a) for F� 1 large and a ridge length Ly<S; (b) the point of flow splitting
is close to the ridge (S�Ly) and a barrier jet forms; (c) cross-section
view from the south, corresponding to (a) showing lower flow splitting
around the barrier and upper flow passing over it; (d) cross-section view
corresponding to (b) showing isentropic surfaces that approximate flow
lines. (a) based on Pierrehumbert and Wyman (1985); (c) and (d) on
Shutts (1998). 133
3.4 Schematic illustration of barrier winds north of the Brooks range, Alaska,
where northerly upslope flow is deflected to give westerly components at
levels near the mountains: (a) vertical cross-section of stable air flowing
towards the Brooks Range; (b) plan view of the wind vector (after
Schwerdtfeger, 1975a). 135
3.5 Cold air damming east of the Appalachian Mountain, USA, looking north.
There is a sloping inversion above the cold air dome, a cold northeasterly low
level jet (LLJ), easterly warm advection over the cold dome, and a southwesterly
flow aloft (adapted from Bell and Bosart, 1988). 136
3.6 ‘‘Corner effect’’ on airflow east of the Massif Central (the Mistral), east
of the Pyrenees (the Tramontane), and east of the Cantabrian Mountains
of Spain (partly after Cruette, 1976). 137
3.7 An example of a streamline analysis for the Alps, omitting areas exceeding
750m altitude, 24 June 1978 (from Steinacker, 1981). 139
3.8 The effects of mountain barriers on frontal passages: (a) warm front
advance; (b) windward retardation; (c) separation. 140
3.9 Schematic picture of a cold front propagating across a mountain
ridge. The isolines depict potential vorticity (after Dickinson and
Knight, 2004). 141
3.10 Isochrones showing the passage of a cold front over the Alps, 0000 GMT
23 June to 1200 GMT 25 June 1978 (from Steinacker, 1981). 142
L I S T O F F I G U R E S x
© Cambridge University Press www.cambridge.org
Cambridge University Press978-0-521-86295-0 - Mountain Weather and Climate, Third EditionRoger G. BarryFrontmatterMore information
3.11 The density of cyclogenesis (per 106 km2 per month) in the northern
hemisphere analyzed from ECMWF ERA-15 reanalysis data, updated
with operational analyses, for December–February, 1979–2000 (from
Hoskins and Hodges, 2002). 143
3.12 Cyclonic eddies forming in westerly flow over a model Alpine/Pyrenean
topography (D. J. Boyer and Met. Atmos. Physics 1987, Springer). 145
3.13 Lee cyclogenesis associated with a frontal passage over the Alps.
(a) Surface pressure map, 3 April 1973, 0000GMT; (b) Cross-section
along the line C–D of (a). Isentropes (K) and isotachs (knots); (c) As (a)
for 1200GMT; (d) As (b) for 1200GMT along the line E–F (from Buzzi
and Tibaldi, 1978). 146
3.14 Types of airflow over a mountain barrier in relation to the vertical profile
of wind speed. (a) Laminar streaming; (b) Standing eddy streaming;
(c) Wave streaming, with a crest cloud and downwind rotor clouds;
(d) Rotor streaming (from Corby, 1954). 151
3.15 Lee wave clouds – a pile of plates, Sangre da Cristo, Colorado (E. McKim). 152
3.16 Lee wave clouds in the San Luis valley, Colorado (G. Kiladis). 152
3.17 The distribution of velocity, pressure and buoyancy perturbations in an
internal gravity wave in the x – z plane (from Durran, 1990). 154
3.18 Calculated streamlines showing wave development over a ridge for
two idealized profiles of wind speed (u) and potential temperature (�)
(from Sawyer, 1960). 156
3.19 Schematic illustrations of water flow over an obstacle in a channel.
(a) Absolutely subcritical flow; (b) partially blocked flow with a bore
progressing upstream at velocity c and a hydraulic jump in the lee;
(c) totally blocked flow; (d) absolutely supercritical flow (from
Long, 1969). 159
3.20 Lee waves developed in simulated northwesterly flow over a model Alpine/
Pyrenean topography. (D. J. Boyer and Met. Atmos. Physics 1987, Springer). 160
3.21 Streamlines for 16 February 1952 in the lee of the Sierra Nevada, based
on glider measurements, showing a large rotor and lenticular wave cloud
(adapted from Holmboe and Klieforth, 1957). 162
3.22 Lee wave locations in relation to wind direction in the French Alps
(after Gerbier and Berenger, 1961). 163
3.23 Vortex street downstream of the Cape Verde Islands, 5 January 2005,
as seen in MODIS bands 1, 3 and 4 (NASA-GSFC). 164
3.24 Schematic illustration of a von Karman vortex in the lee of a cylindrical
obstacle (after Chopra, 1973). 165
3.25 Wakes in the lee of the Windward Islands of the Lesser Antilles
(NASA Visible Earth). 166
3.26 Laboratory model of double eddy formation in the lee of a cylindrical obstacle
for easterly flow in a rotating water tank. (D. J. Boyer and the Royal Society,
London Phil. Trans. 1982, plate 6, pp. 542). 167
L I S T O F F I G U R E S xi
© Cambridge University Press www.cambridge.org
Cambridge University Press978-0-521-86295-0 - Mountain Weather and Climate, Third EditionRoger G. BarryFrontmatterMore information
3.27 Cirriform clouds at 8.5 km over the Himalaya (K. Steffen). 168
3.28 Adiabatic temperature changes associated with different mechanisms of
fohn descent. (a) Blocking of low-level air to windward slope, with adiabatic
heating on the lee (from Beran, 1967). (b) Ascent partially in cloud on
windward slope, giving cooling at SALR with descending air on lee slope
warming at the DALR. 171
3.29 Three types of fohn. (a) Cyclonic fohn in a stable atmosphere with
strong winds; (b) cyclonic fohn in a less stable atmosphere; and
(c) anticyclonic fohn with a damming up of cold air (after Cadez,
1967; from Yoshino, 1975). 172
3.30 Composite soundings for times of windstorms in Boulder, Colorado.
(a) Upwind sounding (west of the Continental Divide). (b) Downwind
soundings (Denver) for storms in Boulder or on the slopes just to the
west (from Brinkmann, 1974a). 180
3.31 A cross-section of potential temperature K based on aircraft data during a
windstorm in Boulder on 11 January 1972. The dashed line separates data
collected at different times. The three bands of turbulence above Boulder
were recorded along horizontal flight paths and are probably continuous
vertically (after Lilly, 1978). 181
3.32 Sketch of the forces involved in anabatic (left) and katabatic (right) slope
winds. The temperature of the air in columns A and B determines their
density (�). 187
3.33 Pilot balloon observations (B) and theoretical (T) slope winds on the
Nordkette, Innsbruck: (a) upslope; (b) downslope (from Defant, 1949). 188
3.34 Drainage wind velocity (v) on an 11.58 slope as a function of time, for
different values of lapse rate (�) and friction coefficient (k) (from Petkovsek and
Hocevar, 1971). 193
3.35 Pressure anomalies (schematic) in relation to the mountain and valley wind
system at 6-h intervals along the Gudbrandsdalen, Norway (after Sterten
and Knudsen, 1961). 197
3.36 Depth–width and shape relationships in idealized valley cross-sections for a
valley without and with a horizontal floor. See text (Muller and Whiteman,
1988). 199
3.37 Sections of wind vectors and potential temperature, respectively, (a) and (c)
cross-valley and (b) and (d) along-valley, for a WRF model simulation with
three-dimensional plains–valley topography. The cross-sections are 20 km
upvalley (from Rampanelli et al., 2004). 200
3.38 Mountain and valley winds in the vicinity of Mt. Rainier, Washington.
(a) Longitudal section in the upper Carbon River Valley, 8–10 August 1960;
(b) cross-section in the same valley, 9 July 1959 (from Buettner and Thyer, 1966). 201
3.39 An idealized view of the typical diurnal evolution of temperature (bold)
and wind structure in a 500-m-deep valley in western Colorado (from
Whiteman, 1990). 203
L I S T O F F I G U R E S xii
© Cambridge University Press www.cambridge.org
Cambridge University Press978-0-521-86295-0 - Mountain Weather and Climate, Third EditionRoger G. BarryFrontmatterMore information
3.40 Model of mountain and valley wind system in the Dischma Valley, Switzerland.
(a) Midnight to sunrise on the east-facing slope; (b) sunrise on the upper
east-facing slope; (c) whole facing slope in sunlight; (d) whole valley in
sunlight; onset of valley wind; (e) west-facing slope receiving more solar
radiation than east-facing slope; (f) solar radiation only tangential to east-facing
slope; (g) sunset on east-facing slope and valley floor; (h) after sunset on the
lower west-facing slope (from Urfer-Henneberger, 1970). 205
3.41 Plots of valley width/area (W/A) ratios (m�1) along Brush Creek, Colorado
(draining) and Gore Creek, Colorado (pooling) (from Whiteman, 1990,
after McKee and O’Neal, 1989). 209
3.42 Sodar returns (above) and tethersonde observations (below) during drainage
initiation in Willy’s Gulch, Colorado, 16 September 1986. (Neff and King, 1989,
J. appl. Met., 28, p. 522, Fig. 5). 210
3.43 Tubular stratocumulus cloud observed late morning in early September in a pass
near Kremmling, Colorado. (G. Kiladis). 212
3.44 Schematic model of the interacting winds during valley inversion break-up
(from Whiteman, 1982). 214
3.45 Regional-scale diurnal wind reversals over the Rocky Mountains,
Colorado, based on mountain-top observations of average resultant wind
from (a) 1200 to 1500MST for 26 August 1985 and (b) 0001 to 0300MST
for 27 August 1985 (from Bossert et al., 1989). 219
3.46 A model of nocturnal airflow over the Drakensberg foothills in winter
(from Tyson and Preston-Whyte, 1972). 220
3.47 Time section of local winds (m s�1) in and above Bushmans Valley,
Drakensberg Mountains, 12–13 March 1965 (from Tyson, 1968b). 220
3.48 Conceptual model of the regional-scale circulation system over the
inter-montane basins of the Colorado Rocky Mountains. (a) Daytime
inflow; (b) transition phase; (c) nocturnal outflow (from Bossert and
Cotton, 1994). 221
3.49 Conceptual model of a mountain–plains circulation east of the Front
Range, Colorado (from Wolyn and McKee, 1994). 222
3.50 Schematic diagram of the diurnal circulation over the Bolivian Altiplano
(from Egger et al., 2005; Fig. 1). 224
3.51 Thermal winds developed in the steady-state boundary layer over sloping terrain
in the northern hemisphere. The (a) nocturnal and (b) daytime
phases of temperature stratification and associated geostrophic wind
shear are shown (from Lettau, 1967). 225
4.1 The diurnal variation of surface energy fluxes averaged for 23–31 August
1985 at Mt. Werner (40.58N, 106.78W, 3250m), Flat Tops (40.08N, 107.38W,
3441m) and Crested Butte (38.98N, 107.98W, 3354m), Colorado (adapted from
Bossert and Cotton, 1994). 254
4.2 Hourly values of energy budget components in the Austrian Tyrol, 12 July
1977, at Obergurgl-Wiese (1960m) and Hohe Mut (2560m) (from Rott, 1979). 257
L I S T O F F I G U R E S xiii
© Cambridge University Press www.cambridge.org
Cambridge University Press978-0-521-86295-0 - Mountain Weather and Climate, Third EditionRoger G. BarryFrontmatterMore information
4.3 Calculated net radiation on north- and south-facing slopes of 308 in the
Caucasus at 400m and 3600m (based on Borzenkova, 1967). 258
4.4 Seasonal variations of net radiation and turbulent heat fluxes with altitude
in Croatia (after Plesko and Sinik, 1978). 259
4.5 Slope temperatures on the Nordkette, Innsbruck, 2 April 1930 (after
Wagner, 1930). 261
4.6 Equivalent black-body temperatures (TBB) measured by radiation
thermometer from an aircraft over Mt. Fuji, 0743–0756 JGT, 28 July 1967.
Solar altitude and azimuth is shown since sunrise (from Fujita et al., 1968). 263
4.7 Model of the thermal belt and cold air drainage on a mountain slope in
central Japan (from Yoshino, 1984). 264
4.8 Mean monthly maxima (a) and minima (b) of air temperature (1954–5)
near the forest limits on a west-northwest slope near Obergurgl (after
Aulitsky, 1967). 265
4.9 Schematic illustration of the effects of a mountain barrier on cloud
formation (modified after Banta, 1990). 267
4.10 Tephigram charts showing; (a) typical environment curves and
atmospheric stability; (b) cloud formation following surface heating
(from Barry and Chorley, 1987). 268
4.11 Observation of the daytime growth of cumulus over south-facing slopes
in alpine terrain: (a) 0700 UTC; (b) 0900 UTC; (c) 1300 UTC (from
Tucker 1954). 269
4.12 Low-level stratus filling the Swiss lowlands and valleys. (K. Steffen). 272
4.13 The diurnal frequency distributions with altitude of the tops of stratiform
cloud observed from the Zugspitze in summer and winter, 1939–48 (after
Hauer, 1950). 272
4.14 Schematic illustration of seeder–feeder clouds and enhancement of
precipitation over a hill (from Browing and Hill, 1981). 273
4.15 Model of warm sector rainfall based on radar studies over the Welsh hills
showing the role of potential instability in meso-scale precipitation areas
(MPAs) and orography (from Browning et al., 1974). 276
4.16 The relationship between altitude and orographic enhancement for
eight cases of cyclonic precipitation in south Wales. The inset shows
the effect of wind speed at 600m on the enhancement of rainfall rates
in the lowest 1500m for the same cases (modified from Hill et al., 1981). 277
4.17 Schematic profiles of mean annual precipitation (cm) versus altitude
in equatorial climates, tropical climates, middle latitudes, and
transitional regions. 284
4.18 Generalized profiles of mean annual precipitation (cm) versus altitude in
the tropics (from Lauer, 1975). 285
4.19 The altitudinal profile of mean annual precipitation (cm) for Austria as a
whole, for the Otzal in a lee situation and the Bregenz area in a windward
situation (from Lauscher, 1976a). 285
L I S T O F F I G U R E S xiv
© Cambridge University Press www.cambridge.org
Cambridge University Press978-0-521-86295-0 - Mountain Weather and Climate, Third EditionRoger G. BarryFrontmatterMore information
4.20 The relationship between annual precipitation and topographic
parameters: (a) an elevation–exposure index; (b) a slope–orientation
index for mountain ranges in middle and low latitudes (from
Basist et al., 1994). 287
4.21 Empirical relationship between monthly mean temperature (8C) andannual percentage frequency of solid precipitation in the northern
hemisphere compared with the regression (50–5T) (from Lauscher, 1976b). 293
4.22 The average number of days with snow lying versus altitude on various
mountains in Great Britain: (a) an average mountain in the west of
Great Britain; (b) an average mountain in the whole of Great Britain;
(c) an average mountain in central Scotland (from Jackson, 1978). 295
4.23 Snow cover depth and duration at different elevations in Austria
(F. Steinhauser, 1974). 296
4.24 The altitudinal gradient of winter precipitation (solid dots) determined
from snow-course data and accumulation measured on glaciers in the
Front Range, Colorado in 1970 expressed as snow water equivalent
(from Alford, 1985). 297
4.25 Orographically induced vertical motion for a simple barrier with westerly
flow: (a) f(z)¼ 0; (b) k¼ 0 (from Walker, 1961). 301
4.26 Calculated condensation and precipitation (mmh� 1) for the airflow case
shown in Figure 4.25(b) (from Walker, 1961). 302
4.27 Model simulations for a storm with a westerly airflow over northern
California, 21–23 December 1964: (a) computed steady-state vertical
motion field (cm s� 1); (b) computed precipitation rate (solid line) and
observed values (dots) (from Colton, 1976). 303
4.28 Precipitation rate (mmh� 1) for idealized terrain heights (km) in western
Oregon according to the linear theory of Smith and Barstad (2004) (from
Smith et al., 2005). 305
4.29 Schematic summary of processes and problems involved in the
determination of rain gauge catch (from Rodda, 1967). 307
4.30 WMO DFIR and Wyoming shield gauges (AGU, 2000). 309
4.31 The absence of any direct effect of the inclination angle of falling
precipitation on gauge catch (from Peck, 1972a). 312
4.32 Annual rainfall and fog catch versus elevation on Mauna Loa, Hawaii.
Left: lee slope. Right: windward slope. The percentage increase in annual
total due to fog catch is shown at the elevations of measurements (after
Juvik and Ekern, 1978). 318
4.33 (a) and (b) Rime needles (Hohenpeissenberg Observatory). 319
4.34 A weather screen on Mt. Coburg, Canadian Arctic (768N, 79.38W) heavily
coated with rime ice (K. Steffen). 322
4.35 Modes of snow transport by the wind (from Mellor, 1965). 324
4.36 Snow drift accumulation, 1974–5 at a site on Niwot ridge, Colorado
(3450m) (after Berg and Caine, 1975). 326
L I S T O F F I G U R E S xv
© Cambridge University Press www.cambridge.org
Cambridge University Press978-0-521-86295-0 - Mountain Weather and Climate, Third EditionRoger G. BarryFrontmatterMore information
4.37 Penitents approximately 5m high, formed by differential ablation on the
Khumbu Glacier (5000m) in the Nepal Himalaya (K. Steffen). 334
4.38 Estimated annual evaporation (cm) from water surfaces in central California
based on pan measurements and meteorological data (after Longacre and
Blaney, 1962). 338
4.39 Altitudinal profiles of mean annual precipitation (P), evaporation (E) and runoff
(D) for the Swiss Alps (after Baumgartner et al., 1983). 341
5.1 Generalized topography and annual rainfall (cm) along a cross-section
northward from Akoma on the Gulf of Papua to Kundiawa (1458E, 68 S),then northeastward to Madang (from Barry 1978; based on a rainfall map
produced by the Snowy Mountain Engineering Corporation, 1975). 365
5.2 Schematic view of daytime circulation, moisture advection, cloudiness and
precipitation on Mt. Kenya (adapted from Winiger, 1981). 367
5.3 Schematic illustration of nocturnal precipitation in the central Himalaya
(from Barros and Lang, 2003). 372
5.4 Precipitation gradients in the Annapurna region (adapted from Putkonen,
2004). Left: Altitudinal profile of October–May (solid) , June–September
(dashed) and annual precipitation. Right: A south–north transect of total
precipitation for 1 September 2000–31 August 2001 from Purkhot to the
main crest of the Himalaya (after Putkonen, 2004). 373
5.5 Schematic cloud patterns in summer and winter in the Khumbu region,
Nepal (after Yasunari, 1976a). 376
5.6 The range of mean monthly temperatures versus altitude in the Nepal
Himalaya (after Dobremez, 1976). 378
5.7 Annual rainfall (mm) versus altitude in the Hoggar in a wet year and dry
year (after Yacono, 1968). 379
5.8 Extent of precipitation systems affecting western and central North Africa
and typical tracks of Sudano–Saharan depressions (after Dubief, 1962;
Yacono, 1968). 380
5.9 Vertical gradients of annual precipitation in the Tien Shan and Pamir
ranges. The values are scaled relative to the annual totals at the equilibrium
line altitude (ELA) as estimated from the climatic snow line (adapted from
Getker and Shchetinnikov, 1992). 383
5.10 Typical vertical gradients of maximum snow water equivalent (SWE) on
macro-scale slopes in the Tien Shan and Pamir ranges (adapted from
Getker, 1985). 384
5.11 Annual precipitation (mm) versus elevation (m) in the mountains of
Central Asia. (a) Inylchek Glacier, Khan Tengry massif, central Tien Shan
(ca. 428N, 808E) (Aizen et al., 1997); (b) Hei He River basin, Qilian Shan,
China (ca. 398N, 1008E) (Kang et al., 1999). 385
5.12 Snow on the Alps (MODIS) (NASA). 387
5.13 Annual precipitation regimes at selected stations in the western Alps for
1931–60 (based on Fliri, 1974). 387
L I S T O F F I G U R E S xvi
© Cambridge University Press www.cambridge.org
Cambridge University Press978-0-521-86295-0 - Mountain Weather and Climate, Third EditionRoger G. BarryFrontmatterMore information
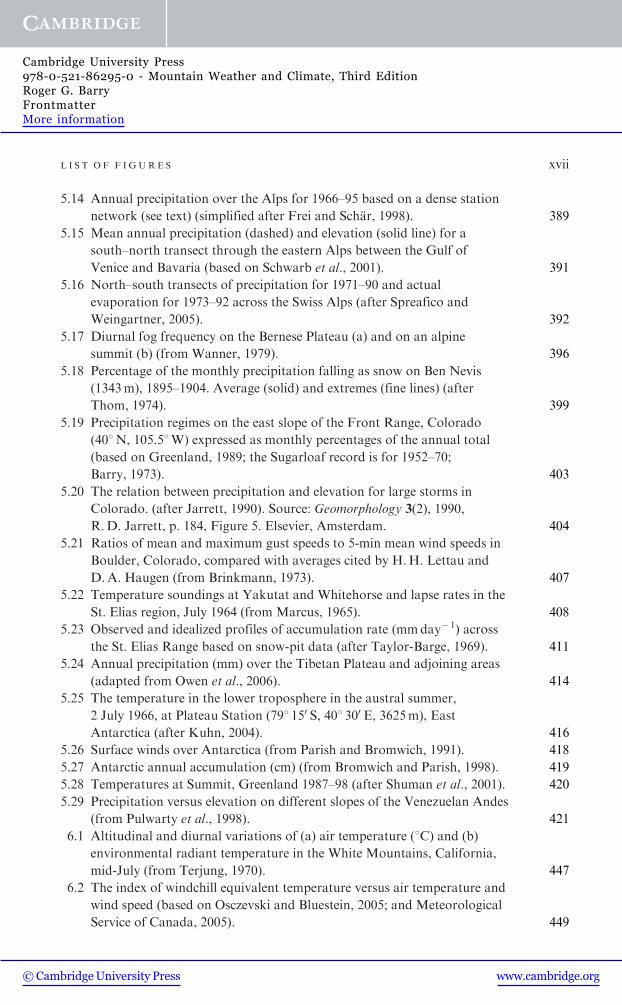
5.14 Annual precipitation over the Alps for 1966–95 based on a dense station
network (see text) (simplified after Frei and Schar, 1998). 389
5.15 Mean annual precipitation (dashed) and elevation (solid line) for a
south–north transect through the eastern Alps between the Gulf of
Venice and Bavaria (based on Schwarb et al., 2001). 391
5.16 North–south transects of precipitation for 1971–90 and actual
evaporation for 1973–92 across the Swiss Alps (after Spreafico and
Weingartner, 2005). 392
5.17 Diurnal fog frequency on the Bernese Plateau (a) and on an alpine
summit (b) (from Wanner, 1979). 396
5.18 Percentage of the monthly precipitation falling as snow on Ben Nevis
(1343m), 1895–1904. Average (solid) and extremes (fine lines) (after
Thom, 1974). 399
5.19 Precipitation regimes on the east slope of the Front Range, Colorado
(408N, 105.58W) expressed as monthly percentages of the annual total
(based on Greenland, 1989; the Sugarloaf record is for 1952–70;
Barry, 1973). 403
5.20 The relation between precipitation and elevation for large storms in
Colorado. (after Jarrett, 1990). Source: Geomorphology 3(2), 1990,
R.D. Jarrett, p. 184, Figure 5. Elsevier, Amsterdam. 404
5.21 Ratios of mean and maximum gust speeds to 5-min mean wind speeds in
Boulder, Colorado, compared with averages cited by H.H. Lettau and
D.A. Haugen (from Brinkmann, 1973). 407
5.22 Temperature soundings at Yakutat and Whitehorse and lapse rates in the
St. Elias region, July 1964 (from Marcus, 1965). 408
5.23 Observed and idealized profiles of accumulation rate (mmday� 1) across
the St. Elias Range based on snow-pit data (after Taylor-Barge, 1969). 411
5.24 Annual precipitation (mm) over the Tibetan Plateau and adjoining areas
(adapted from Owen et al., 2006). 414
5.25 The temperature in the lower troposphere in the austral summer,
2 July 1966, at Plateau Station (798 150 S, 408 300 E, 3625m), East
Antarctica (after Kuhn, 2004). 416
5.26 Surface winds over Antarctica (from Parish and Bromwich, 1991). 418
5.27 Antarctic annual accumulation (cm) (from Bromwich and Parish, 1998). 419
5.28 Temperatures at Summit, Greenland 1987–98 (after Shuman et al., 2001). 420
5.29 Precipitation versus elevation on different slopes of the Venezuelan Andes
(from Pulwarty et al., 1998). 421
6.1 Altitudinal and diurnal variations of (a) air temperature (8C) and (b)
environmental radiant temperature in the White Mountains, California,
mid-July (from Terjung, 1970). 447
6.2 The index of windchill equivalent temperature versus air temperature and
wind speed (based on Osczevski and Bluestein, 2005; and Meteorological
Service of Canada, 2005). 449
L I S T O F F I G U R E S xvii
© Cambridge University Press www.cambridge.org
Cambridge University Press978-0-521-86295-0 - Mountain Weather and Climate, Third EditionRoger G. BarryFrontmatterMore information
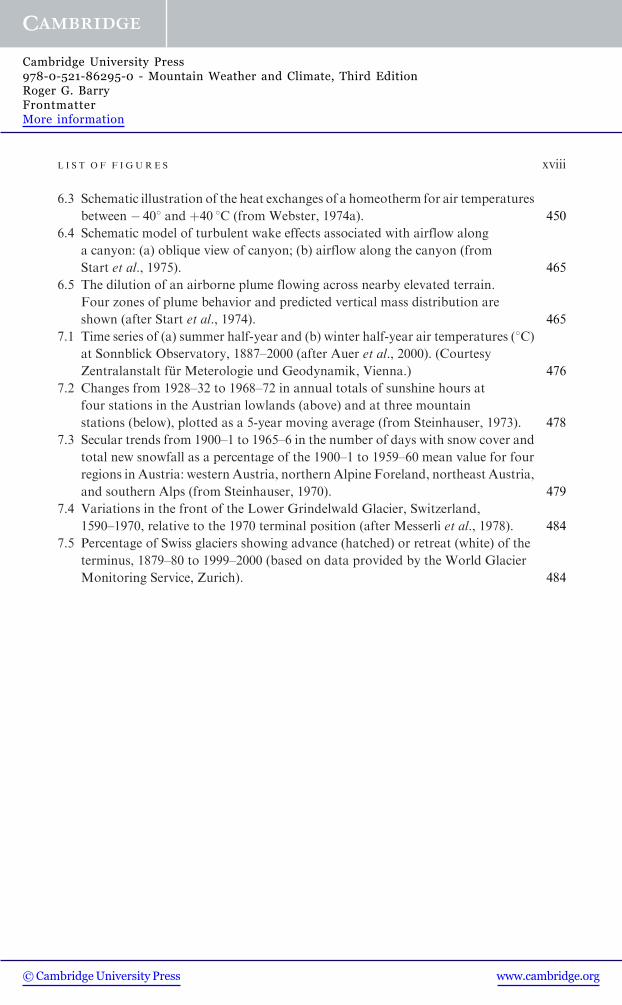
6.3 Schematic illustration of the heat exchanges of a homeotherm for air temperatures
between � 408 and þ40 8C (from Webster, 1974a). 450
6.4 Schematic model of turbulent wake effects associated with airflow along
a canyon: (a) oblique view of canyon; (b) airflow along the canyon (from
Start et al., 1975). 465
6.5 The dilution of an airborne plume flowing across nearby elevated terrain.
Four zones of plume behavior and predicted vertical mass distribution are
shown (after Start et al., 1974). 465
7.1 Time series of (a) summer half-year and (b) winter half-year air temperatures (8C)at Sonnblick Observatory, 1887–2000 (after Auer et al., 2000). (Courtesy
Zentralanstalt fur Meterologie und Geodynamik, Vienna.) 476
7.2 Changes from 1928–32 to 1968–72 in annual totals of sunshine hours at
four stations in the Austrian lowlands (above) and at three mountain
stations (below), plotted as a 5-year moving average (from Steinhauser, 1973). 478
7.3 Secular trends from 1900–1 to 1965–6 in the number of days with snow cover and
total new snowfall as a percentage of the 1900–1 to 1959–60 mean value for four
regions in Austria: western Austria, northern Alpine Foreland, northeast Austria,
and southern Alps (from Steinhauser, 1970). 479
7.4 Variations in the front of the Lower Grindelwald Glacier, Switzerland,
1590–1970, relative to the 1970 terminal position (after Messerli et al., 1978). 484
7.5 Percentage of Swiss glaciers showing advance (hatched) or retreat (white) of the
terminus, 1879–80 to 1999–2000 (based on data provided by the World Glacier
Monitoring Service, Zurich). 484
L I S T O F F I G U R E S xviii
© Cambridge University Press www.cambridge.org
Cambridge University Press978-0-521-86295-0 - Mountain Weather and Climate, Third EditionRoger G. BarryFrontmatterMore information
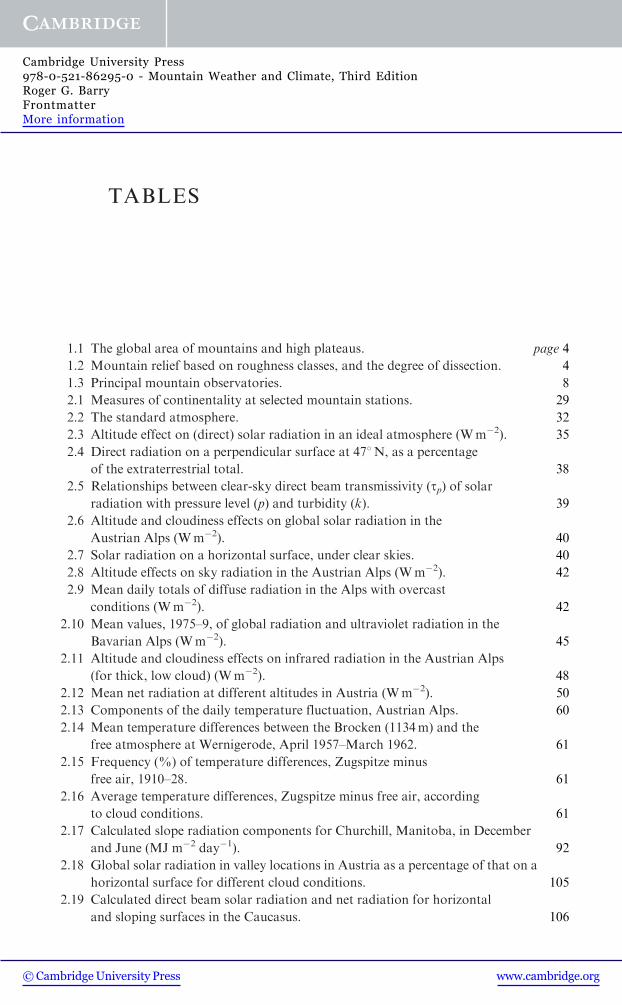
TABLES
1.1 The global area of mountains and high plateaus. page 4
1.2 Mountain relief based on roughness classes, and the degree of dissection. 4
1.3 Principal mountain observatories. 8
2.1 Measures of continentality at selected mountain stations. 29
2.2 The standard atmosphere. 32
2.3 Altitude effect on (direct) solar radiation in an ideal atmosphere (Wm�2). 35
2.4 Direct radiation on a perpendicular surface at 478N, as a percentage
of the extraterrestrial total. 38
2.5 Relationships between clear-sky direct beam transmissivity (tp) of solarradiation with pressure level (p) and turbidity (k). 39
2.6 Altitude and cloudiness effects on global solar radiation in the
Austrian Alps (Wm�2). 40
2.7 Solar radiation on a horizontal surface, under clear skies. 40
2.8 Altitude effects on sky radiation in the Austrian Alps (Wm�2). 42
2.9 Mean daily totals of diffuse radiation in the Alps with overcast
conditions (Wm�2). 42
2.10 Mean values, 1975–9, of global radiation and ultraviolet radiation in the
Bavarian Alps (Wm�2). 45
2.11 Altitude and cloudiness effects on infrared radiation in the Austrian Alps
(for thick, low cloud) (Wm�2). 48
2.12 Mean net radiation at different altitudes in Austria (Wm�2). 50
2.13 Components of the daily temperature fluctuation, Austrian Alps. 60
2.14 Mean temperature differences between the Brocken (1134m) and the
free atmosphere at Wernigerode, April 1957–March 1962. 61
2.15 Frequency (%) of temperature differences, Zugspitze minus
free air, 1910–28. 61
2.16 Average temperature differences, Zugspitze minus free air, according
to cloud conditions. 61
2.17 Calculated slope radiation components for Churchill, Manitoba, in December
and June (MJ m�2 day�1). 92
2.18 Global solar radiation in valley locations in Austria as a percentage of that on a
horizontal surface for different cloud conditions. 105
2.19 Calculated direct beam solar radiation and net radiation for horizontal
and sloping surfaces in the Caucasus. 106
© Cambridge University Press www.cambridge.org
Cambridge University Press978-0-521-86295-0 - Mountain Weather and Climate, Third EditionRoger G. BarryFrontmatterMore information
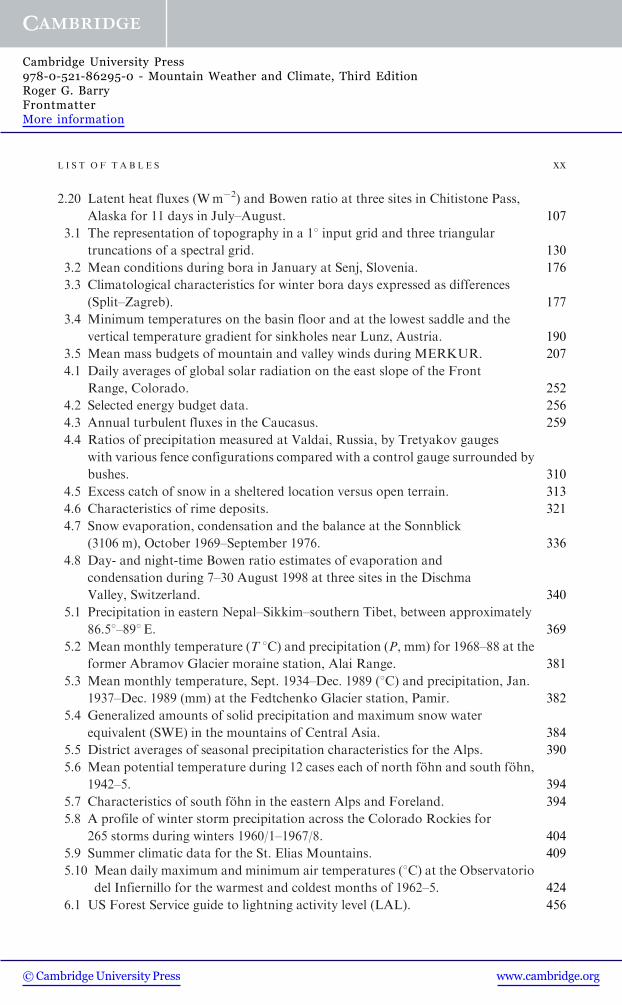
2.20 Latent heat fluxes (Wm�2) and Bowen ratio at three sites in Chitistone Pass,
Alaska for 11 days in July–August. 107
3.1 The representation of topography in a 18 input grid and three triangular
truncations of a spectral grid. 130
3.2 Mean conditions during bora in January at Senj, Slovenia. 176
3.3 Climatological characteristics for winter bora days expressed as differences
(Split–Zagreb). 177
3.4 Minimum temperatures on the basin floor and at the lowest saddle and the
vertical temperature gradient for sinkholes near Lunz, Austria. 190
3.5 Mean mass budgets of mountain and valley winds during MERKUR. 207
4.1 Daily averages of global solar radiation on the east slope of the Front
Range, Colorado. 252
4.2 Selected energy budget data. 256
4.3 Annual turbulent fluxes in the Caucasus. 259
4.4 Ratios of precipitation measured at Valdai, Russia, by Tretyakov gauges
with various fence configurations compared with a control gauge surrounded by
bushes. 310
4.5 Excess catch of snow in a sheltered location versus open terrain. 313
4.6 Characteristics of rime deposits. 321
4.7 Snow evaporation, condensation and the balance at the Sonnblick
(3106 m), October 1969–September 1976. 336
4.8 Day- and night-time Bowen ratio estimates of evaporation and
condensation during 7–30 August 1998 at three sites in the Dischma
Valley, Switzerland. 340
5.1 Precipitation in eastern Nepal–Sikkim–southern Tibet, between approximately
86.58–898E. 369
5.2 Mean monthly temperature (T 8C) and precipitation (P, mm) for 1968–88 at the
former Abramov Glacier moraine station, Alai Range. 381
5.3 Mean monthly temperature, Sept. 1934–Dec. 1989 (8C) and precipitation, Jan.
1937–Dec. 1989 (mm) at the Fedtchenko Glacier station, Pamir. 382
5.4 Generalized amounts of solid precipitation and maximum snow water
equivalent (SWE) in the mountains of Central Asia. 384
5.5 District averages of seasonal precipitation characteristics for the Alps. 390
5.6 Mean potential temperature during 12 cases each of north fohn and south fohn,
1942–5. 394
5.7 Characteristics of south fohn in the eastern Alps and Foreland. 394
5.8 A profile of winter storm precipitation across the Colorado Rockies for
265 storms during winters 1960/1–1967/8. 404
5.9 Summer climatic data for the St. Elias Mountains. 409
5.10 Mean daily maximum and minimum air temperatures (8C) at the Observatorio
del Infiernillo for the warmest and coldest months of 1962–5. 424
6.1 US Forest Service guide to lightning activity level (LAL). 456
L I S T O F T A B L E S xx
© Cambridge University Press www.cambridge.org
Cambridge University Press978-0-521-86295-0 - Mountain Weather and Climate, Third EditionRoger G. BarryFrontmatterMore information
PREFACE TO THE THIRD EDITION
Research into mountain weather and climate has gained momentum over the
15 years that have elapsed since the publication of the second edition. Studies of
the meteorology and climatology of mountains regions of Central Asia and South
America, in particular, have provided material for new sections in Chapter 5, with
shorter sections on the equatorial mountains of East Africa and the Southern Alps
of New Zealand. The high ice plateaus of Greenland and Antarctica are also
included. There has also been more attention paid to changes in mountain envir-
onments, as part of the widening concern over global warming and through the
International Panel on Climate Change (IPCC) for its second (1995), third (2001),
and fourth (2007) assessment reports. Accordingly, the scope of the material in
Chapter 7 has expanded. Research in mountain meteorology has benefited from
projects such as the Mesoscale Alpine Program (MAP) and other more local indivi-
dual endeavors in different parts of the world. Improvements in instrumentation,
data recording and transmitting, and new satellite, airborne and ground-based
remote sensing, are all changing the ways in which data can be collected. Data
analysis, combined with higher resolution numerical modeling, is also becoming
increasingly common.
The basic structure of the book remains unchanged, and apart from updating
throughout, and corrections where appropriate, most of the original text has been
retained. I believe firmly in recognizing important early contributions to the sub-
ject, as well as the latest advances. Some recent references incorporated in the
bibliographies are not discussed in the text.
© Cambridge University Press www.cambridge.org
Cambridge University Press978-0-521-86295-0 - Mountain Weather and Climate, Third EditionRoger G. BarryFrontmatterMore information

ACKNOWLEDGMENTS
I am particularly grateful to Matt Lloyd of Cambridge University Press for
supporting my proposal for a new Third Edition of the book and to Andrew Mould
of Routledge, Taylor, and Francis, for facilitating the transfer of publication rights.
Daryl Kohlerschmidt of the clerical staff at NSIDC helped greatly with the final
text formatting, while student Naomi Saliman ably prepared new and revised
figures and scanned all artwork, and Amy Borrows ¼ Poretsky handled figure
permissions, both supervised by Cindy Brekke. NSIDC library staff assisted with
locating literature not available electronically.
For answers to questions and for provision of reports and articles, I am grateful
to Ingeborg Auer, Tanja Cegnar, Josef Egger, Christoph Frei, Doug Hardy, Louis
Lliboutry, Gudrun Petersen, Mike Prentice, Rolf Philipona, Raymond
Pierrehumbert, Hans Richner, Bruno Schaedler, Glenn Shutts, Mathias Vuille,
Rolf Weingartner, David Whiteman, and Masatsoshi Yoshino.
I wish to thank the following for permission to reproduce illustrations: first and
foremost are the American Geophysical Union and American Meteorological
Society for their enlightened policies on figure reproduction, which so greatly
simplify and speed up the process of preparing an academic text. Wherever possi-
ble, figures from papers in their journals are used for this reason.
The following individuals and publishers have kindly granted permission for the
reproduction of illustrations and other material:
Dr. V. Aizen – Figure 5.11a
American Geophysical Union – Figures 2.11, 2.23, 2.24
AmericanMeteorological Society – Figures 2.14, 2.20, 2.21, 2.27, 3.1, 3.2, 3.3a, 3.5,
3.11, 3.17, 3.28, 3.31, 3.36, 3.37, 3.39, 3.41, 3.44, 3.45, 3.46, 3.48, 3.49, 4.1, 4.8, 4.9,
4.20, 4.28, 5.3, 5.26, 5.27, 5.28, 6.2
Dr. A.H. Auer, Jr. New Zealand Meteorological Service – Figure 3.15
Dr. I. Auer – Figure 7.1
Dr. W.A.R. Brinkmann – Figures 3.18, 5.9
Cornelsen – Figure 4.39
Deutscher Wetterdienst – Figure 4.12
© Cambridge University Press www.cambridge.org
Cambridge University Press978-0-521-86295-0 - Mountain Weather and Climate, Third EditionRoger G. BarryFrontmatterMore information
Eidgenossische Anstalt forstlich Versuchswesen, Birmensdorf – Figures 2.35, 2.40,
2.41
Elsevier – Figures 5.21, 5.24
Erdkunde – Figures 2.2a and 5.2
Dr. C. Frei – Figure 5.14
Gebruder Borntraeger, Berlin (Contrib. Atmos. Phys.) – Figure 3.3
Dr. M. J. Getker – Figures 5.9 and 5.10
Dr. D. Hardy – Figure 4.37
Institute of British Geographers – Figure 2.17
International Glaciological Society – Figure 5.11a
Dr. Kamg Ersi – Figure 5.11b
Dr. G. Kiladis – Figure 1.6, 3.15, 3.42
Kluwer Academic Publishers – Figure 2.29
Professor Dr. W. Lauer – Figure 4.18
The late Professor H.H. Lettau – Figure 3.51
Dr. R.R. Long – Figure 3.19
Dr. Eileen McKim – Figure 3.12
Meteorological Office, UK – Figures 2.15, 2.16
MTP Press Ltd (Butterworths) – Figure 6.2
NASA – Figures 3.20, 4.34
Dr. W.D. Neff – Figure 3.27
Norwegian Defence Research Establishment – Figure 3.35
Taylor &Francis [Metheun&Co. Ltd, Routledge] – Figures 1.1, 1.2, 2.22, 2.33, 3.7,
3.10, 4.10, 5.8
Royal Meteorological Society – Figures 3.13, 3.14, 3.19, 4.11, 4.15, 4.16
Royal Society, London – Figure 3.25
Smithsonian Institution Press – Figure 2.1
Sonnblick Verein – Figures 1.3, 2.3, 5.26, 7.1, 7.2, 7.3
Springer Verlag – Figures 2.8, 2.12, 2.39, 3.28, 3.32, 3.34, 4.1, 4.7, 4.17, 5.13, 5.29,
6.1. Tables 2.6, 2.8, 2.9, 2.11 and 2.12
A CKNOWL EDGM EN T S xxiii
© Cambridge University Press www.cambridge.org
Cambridge University Press978-0-521-86295-0 - Mountain Weather and Climate, Third EditionRoger G. BarryFrontmatterMore information
Dr. K. Steffen – Figures 3.26, 3.43, 4.30, 4.33
Swiss Federal Office for Water and Geology – Figures 5.15, 5.16
The late Dr. A. S. Thom – Figure 5.18
Professor P.D. Tyson – Figure 3.37
Universitaets Verlag, Wagner – Figure 5.13
University of Colorado Press – Figure 5.17
The late Dr. E. Wahl – Figure 2.23
The late Dr. E.R. Walker – Figures 4.20, 4.21
Dr. H. Wanner – Figure 5.17
J. Wiley and Sons – Figure 2.32
World Meteorological Organization – Figures 2.30, 3.7, 4.24
Professor M.M. Yoshino – Figures 2.34, 3.17, 3.24
A CKNOWL EDGMEN T S xxiv
© Cambridge University Press www.cambridge.org
Cambridge University Press978-0-521-86295-0 - Mountain Weather and Climate, Third EditionRoger G. BarryFrontmatterMore information


![Topic:- DU J18 MCOM Topic01 MCom.pdf · 1. Henry Ford [Option ID = 62950] 2. Henry Fayol [Option ID = 62948] 3. AH Maslow [Option ID = 62951] 22](https://img.pdfslide.us/doc/110x75/5ba7998f09d3f2d1118ba094/topic-du-j18-mcom-mcompdf-1-henry-ford-option-id-62950-2-henry-fayol.jpg)