Embed Size (px)
Citation preview
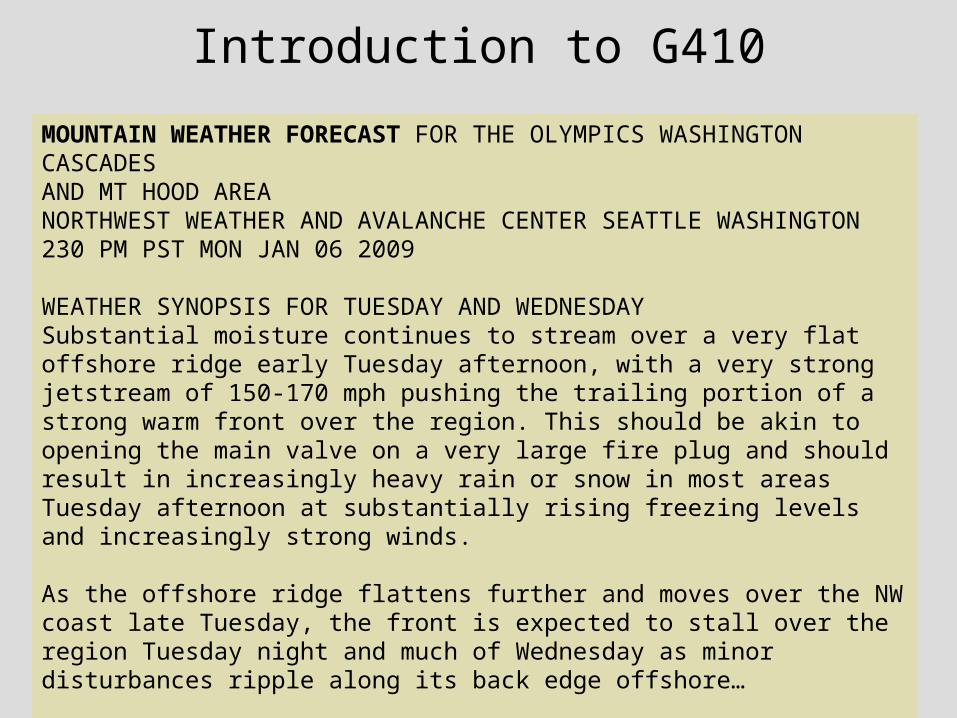
Introduction to G410
MOUNTAIN WEATHER FORECAST FOR THE OLYMPICS WASHINGTON CASCADES AND MT HOOD AREANORTHWEST WEATHER AND AVALANCHE CENTER SEATTLE WASHINGTON230 PM PST MON JAN 06 2009
WEATHER SYNOPSIS FOR TUESDAY AND WEDNESDAYSubstantial moisture continues to stream over a very flat offshore ridge early Tuesday afternoon, with a very strong jetstream of 150-170 mph pushing the trailing portion of a strong warm front over the region. This should be akin to opening the main valve on a very large fire plug and should result in increasingly heavy rain or snow in most areas Tuesday afternoon at substantially rising freezing levels and increasingly strong winds. As the offshore ridge flattens further and moves over the NW coast late Tuesday, the front is expected to stall over the region Tuesday night and much of Wednesday as minor disturbances ripple along its back edge offshore…

Four factors that affect the formation and release of avalanches

Why do we have to learn this?
Provides a better understanding of physical processes governing snowpack development metamorphism , and melt
Makes sense of weather observations and forecasts
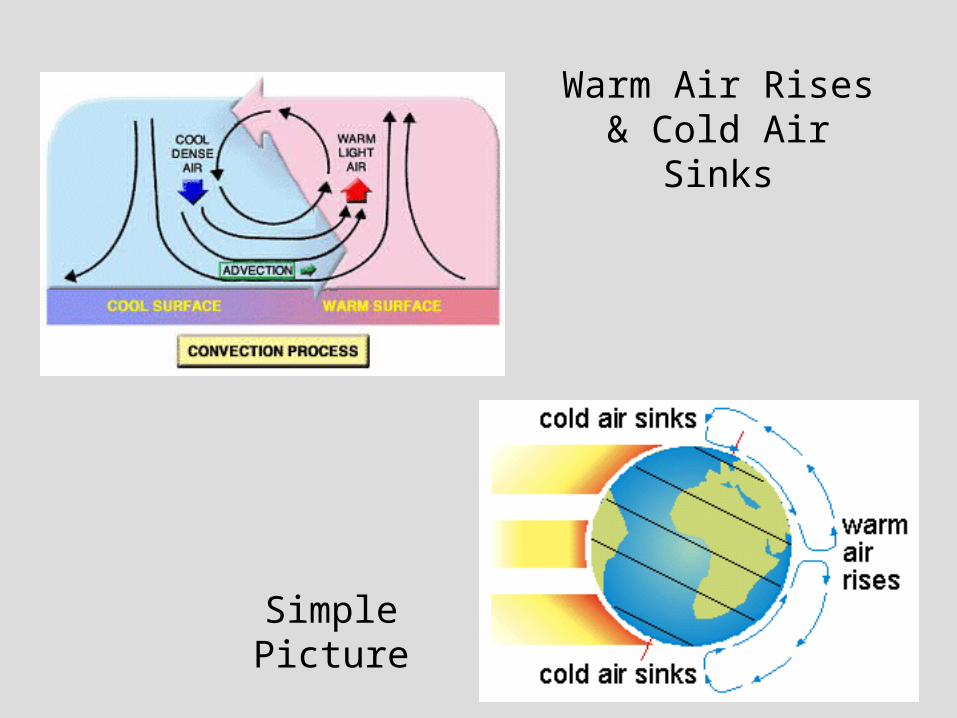
Warm Air Rises & Cold Air Sinks
Simple Picture

Differential heating of the Earth surface produces motion in the Earth's atmosphere.

H & L pressure circulation drives the wind
Global Scale: High and Low pressure systems develop

Atmospheric Pressure: Force exerted by the weight of the air
Mean sea level pressure for June, July, August, top and December, January, February, bottom.

Location of high or low pressure centers provides information about:
Wind direction
Wind speed
Cloud cover
Precipitation
Discrete Air Masses


Differences in pressure from one location to another causes:
1) Horizontal motions (wind)
2) Vertical motions (convection and subsidence)

The change in pressure measured across a given distance is called a "pressure gradient".

Northern HemisphereWinds blow clockwise out of a high pressure center.
Winds blow counterclockwise into a low pressure system
05 Jan 2009 500 mb

High Pressure Centers
A high pressure center is where the pressure has been measured to be the highest relative to its surroundings.
That means, moving in any direction away from the "High" will result in a decrease in pressure.
A high pressure center is indicated on a weather map by a blue "H".
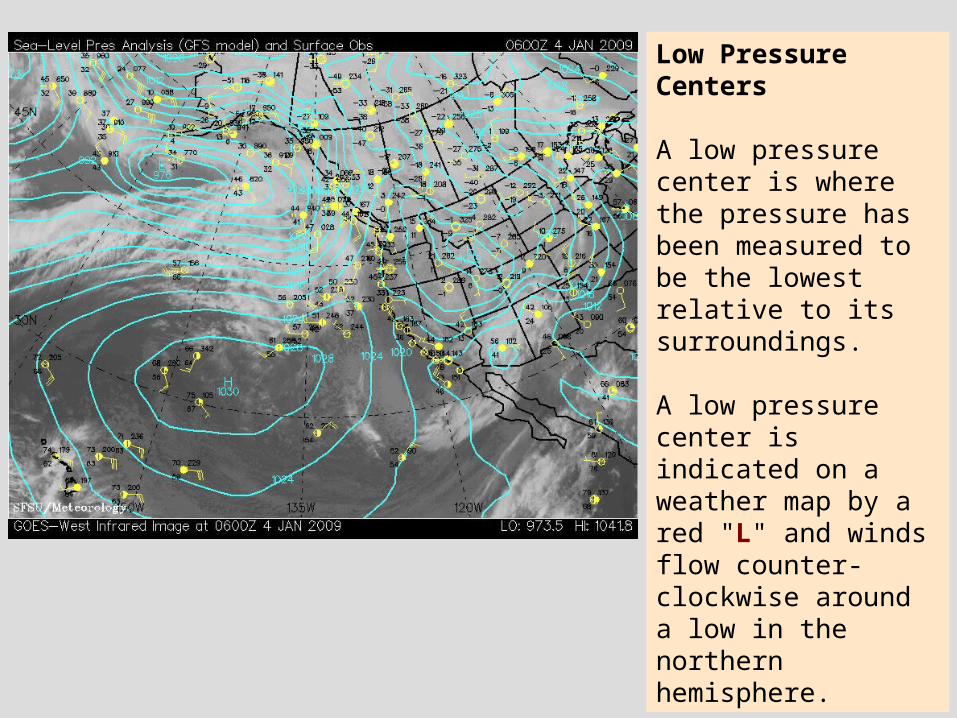
Low Pressure Centers
A low pressure center is where the pressure has been measured to be the lowest relative to its surroundings.
A low pressure center is indicated on a weather map by a red "L" and winds flow counter-clockwise around a low in the northern hemisphere.


As air flows out of a high pressure center, air from higher in the atmosphere sinks to replace it.
This subsidence produces warming, dissipation of clouds and precipitation
As air converges in a low pressure center, it rises and cools. If moist, cooling will cause moisture to condense and form clouds.

Pressure level maps (rather than heights)
Surface maps, at Earth surface
850 mb - available moisture for precipitation, ~1500m level
500mb - middle of atmosphere, troughs (lows) and ridges (highs), ~5500 m level
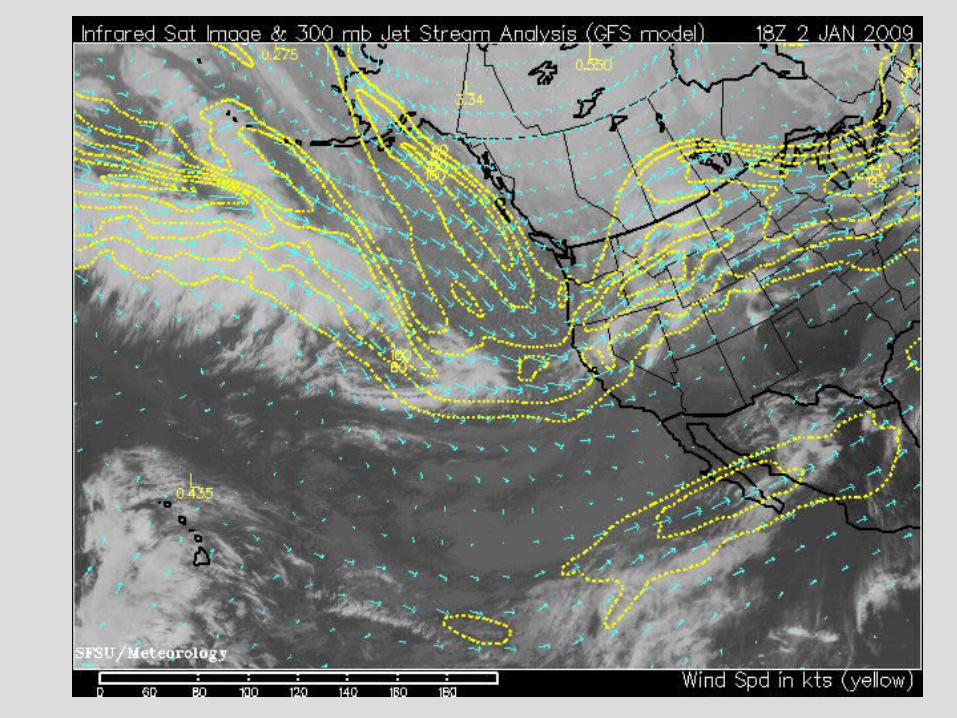
300 mb - jet streams at ~9100 m level
[The average atmospheric pressure at sea level is ~1000mb]

A line connecting points of equal pressure is called an isobar.
At every point along a given isobar, the values of pressure are the same.

Pressure reports in Washington are between 1004 mb and 1020 mb.
An area of relatively high pressure is centered in western S Pacific, while the pressure increases outward from this region.
An area of lower pressure is located in western B.C. & Ak.

Troughs: Elongated low pressure centers
Ridges: Elongated high pressure centers.
The small green numbers are contour labels, which identify the value of an isobar.


Small wave length waves or ripples are called short-wave troughs or ridges.
500 mb forecast for 1/21/1999. Troughs = red; solid lines = 500 mb height contours.

Surface Maps
Uses available surface data
Shows: Temperature Weather Dew point temperature Cloud cover Pressure Wind direction and speed (wind barb)


Observed Dew Point Temperature
Observed Temperaturestation reporting symbol
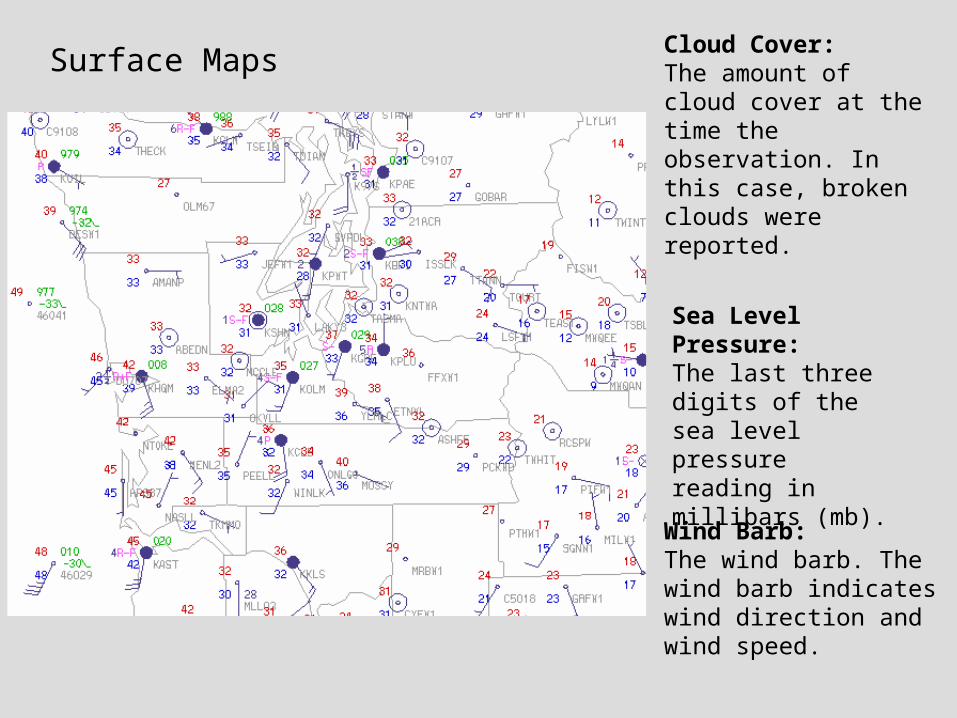
Surface MapsCloud Cover:The amount of cloud cover at the time the observation. In this case, broken clouds were reported.
Sea Level Pressure:The last three digits of the sea level pressure reading in millibars (mb).
Wind Barb:The wind barb. The wind barb indicates wind direction and wind speed.

Surface Maps
Use available surface data
Shows:TemperatureWeatherDew point temperatureCloud coverPressureWind direction and speed (wind barb)


![Washington Evening Times. (Washington, DC) 1910-12-22 [p 3].White Christmas Prophe-sied By the Weather Forecaster laattne tngoghnut tile day TlmsMlid Weather Bureau through thin morning](https://img.pdfslide.us/doc/110x75/5e664409244bf6769e210f52/washington-evening-times-washington-dc-1910-12-22-p-3-white-christmas-prophe-sied.jpg)