Embed Size (px)
Citation preview
Mortality trends in cardiovascular disease in schizophrenia in Sweden
Urban Ösby
MD, PhD, Senior ConsultantPsykiatri Nordöst, Stockholm County Council
Department of Clinical Neuroscience, Karolinska Institutet, Stockholm, Sweden

Declaration of interest: Urban Ösby
Grant support:Stockholm County Council, NARSAD, Bristol-Myers Squibb, Janssen-Cilag
Advisory Board/Consultant:AstraZeneca, Bristol-Myers Squibb, Eli Lilly, Pfizer
Speakers Bureau:AstraZeneca, Bristol-Myers Squibb, Eli Lilly, Pfizer

Risk factors for cardiovascular disase

LipidsHypertension
Age
Vasculardisease
Smoking
ObesityDiabetes
Diet
Family historySedentary lifestyle
Cardiovascular disease: A Multifactorial Condition
ENVIRONMENTAL
GENETICGender
Thromboticfactors

FoamFoamCellsCells
FattyFattyStreakStreak
IntermediateIntermediateLesionLesion AtheromaAtheroma
FibrousFibrousPlaquePlaque
ComplicatedComplicatedLesion/RuptureLesion/Rupture
Endothelial dysfunction
Smooth muscleand collagen
From first decadeFrom first decade From third decadeFrom third decade From fourth decadeFrom fourth decade
Growth mainly by lipid accumulationThrombosis,haematoma
Adapted from Stary HC et al. Circulation 1995;92:1355-1374.
Cardiovascular Timeline
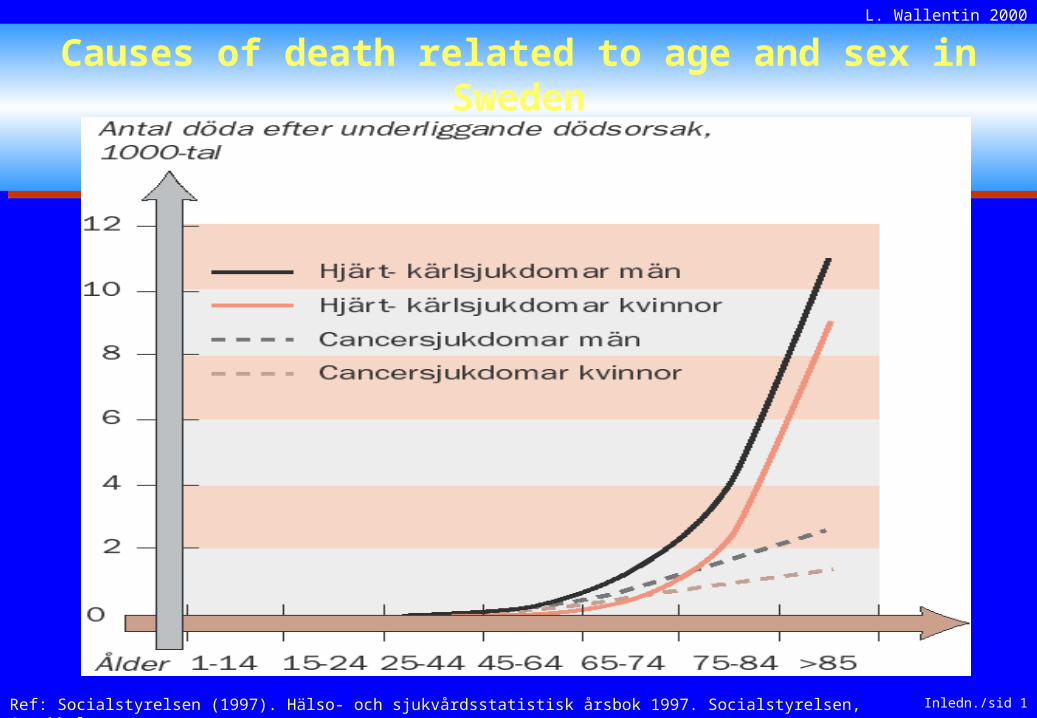
Causes of death related to age and sex in SwedenCauses of death related to age and sex in Sweden
Ref: Socialstyrelsen (1997). Hälso- och sjukvårdsstatistisk årsbok 1997. Socialstyrelsen, Stockholm.
L. Wallentin 2000
Inledn./sid 1
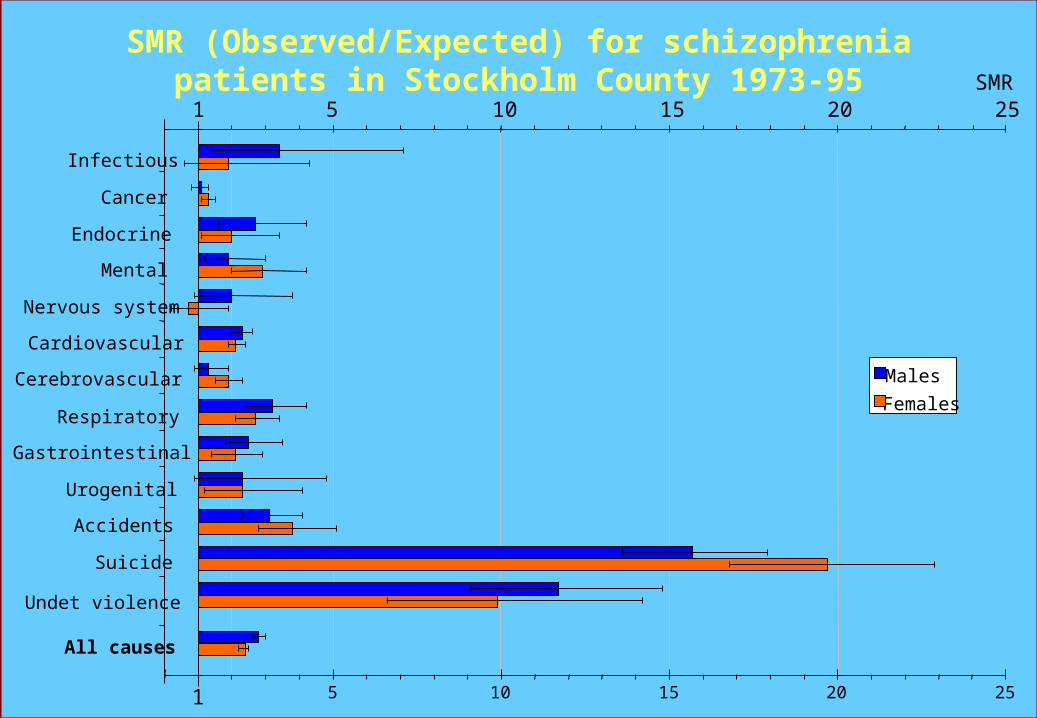
Infectious
Cancer
Endocrine
Mental
Nervous system
Cardiovascular
Cerebrovascular
Respiratory
Gastrointestinal
Urogenital
Accidents
Suicide
Undet violence
All causes
Males
Females
1 5 10 15 20 25
1 5 10 15 20 25
SMR (Observed/Expected) for schizophrenia patients in Stockholm County 1973-95 SMR
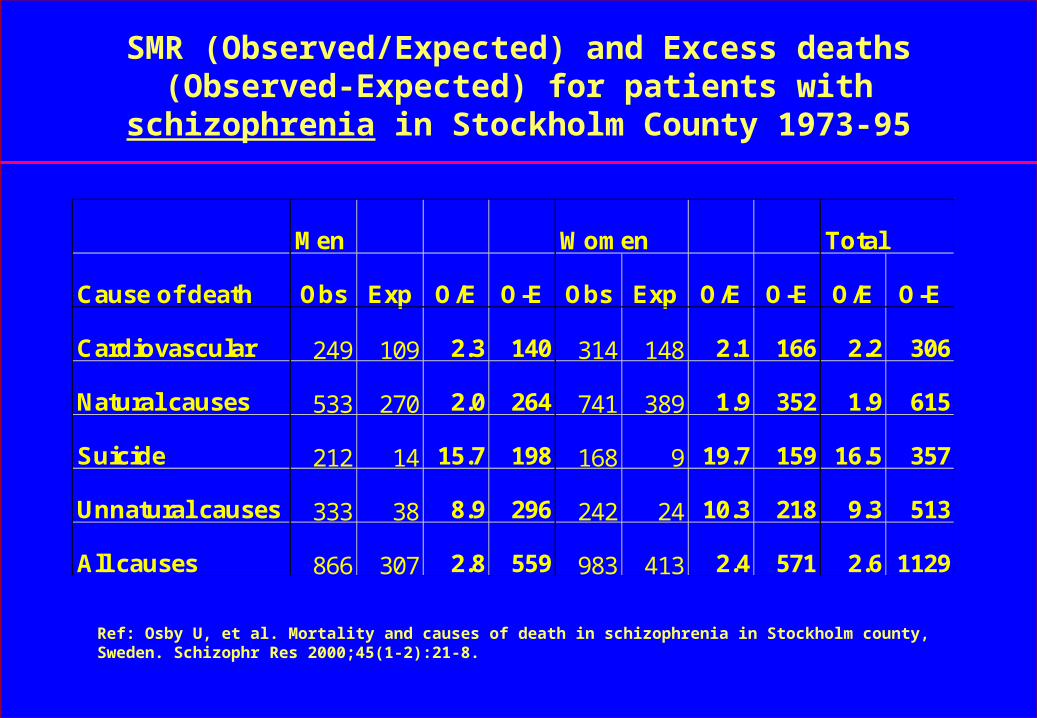
SMR (Observed/Expected) and Excess deaths (Observed-Expected) for patients with schizophrenia
in Stockholm County 1973-95
Men Women Total
Cause of death Obs Exp O/E O-E Obs Exp O/E O-E O/E O-E
Cardiovascular 249 109 2.3 140 314 148 2.1 166 2.2 306
Natural causes 533 270 2.0 264 741 389 1.9 352 1.9 615
Suicide 212 14 15.7 198 168 9 19.7 159 16.5 357
Unnatural causes 333 38 8.9 296 242 24 10.3 218 9.3 513
All causes 866 307 2.8 559 983 413 2.4 571 2.6 1129
Ref: Osby U, et al. Mortality and causes of death in schizophrenia in Stockholm county, Sweden. Schizophr Res 2000;45(1-2):21-8.
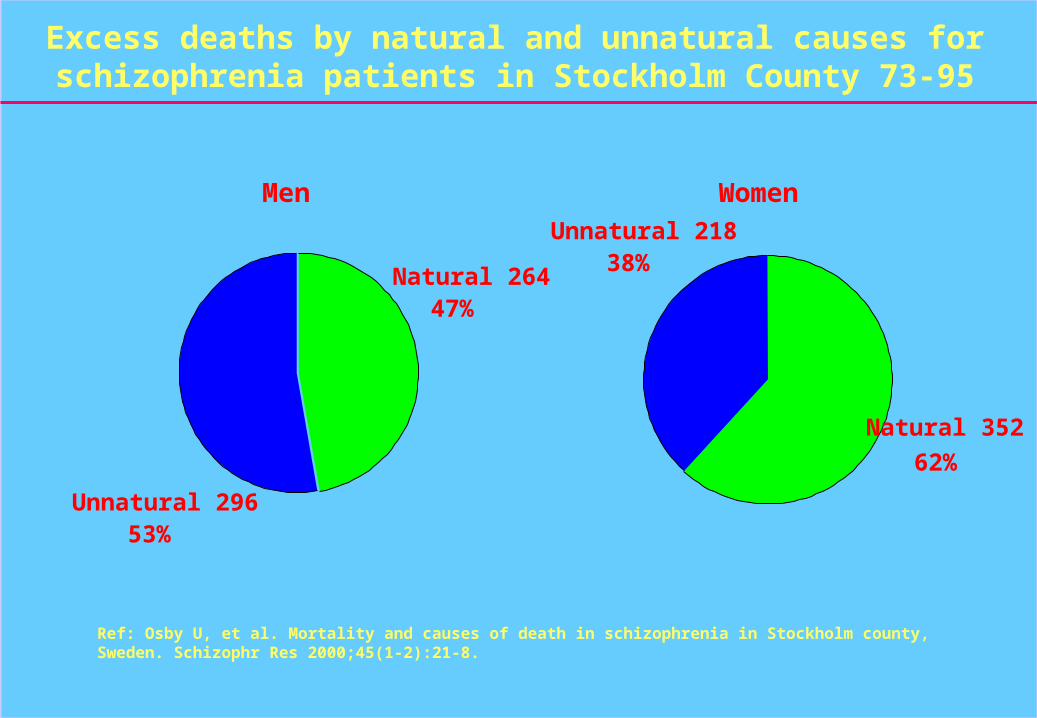
Excess deaths by natural and unnatural causes for schizophrenia patients in Stockholm County 73-95
Men
Natural 26447%
Unnatural 29653%
Women
Natural 352
62%
Unnatural 21838%
Ref: Osby U, et al. Mortality and causes of death in schizophrenia in Stockholm county, Sweden. Schizophr Res 2000;45(1-2):21-8.

SMR (O/E) and Excess deaths (O–E) for patients with bipolar disorder in Sweden 1973-95
Ref: Osby U, et al. Excess mortality in bipolar and unipolar disorder in Sweden. Arch Gen Psychiatry 2001;58(9):844-50.
Men Women Total
Cause of death Obs Exp O/E O-E Obs Exp O/E O-E O/E O-E
Cardiovascular 550 284 1.9 266 523 198 2.6 325 2.2 591
Natural causes 1185 624 1.9 561 1280 612 2.1 668 2.0 1229
Suicide 345 23 15.0 322 327 15 22.4 312 17.7 634
Unnatural causes 531 61 8.6 470 467 37 12.7 430 10.2 900
All causes 1716 686 2.5 1030 1747 648 2.7 1099 2.6 2129
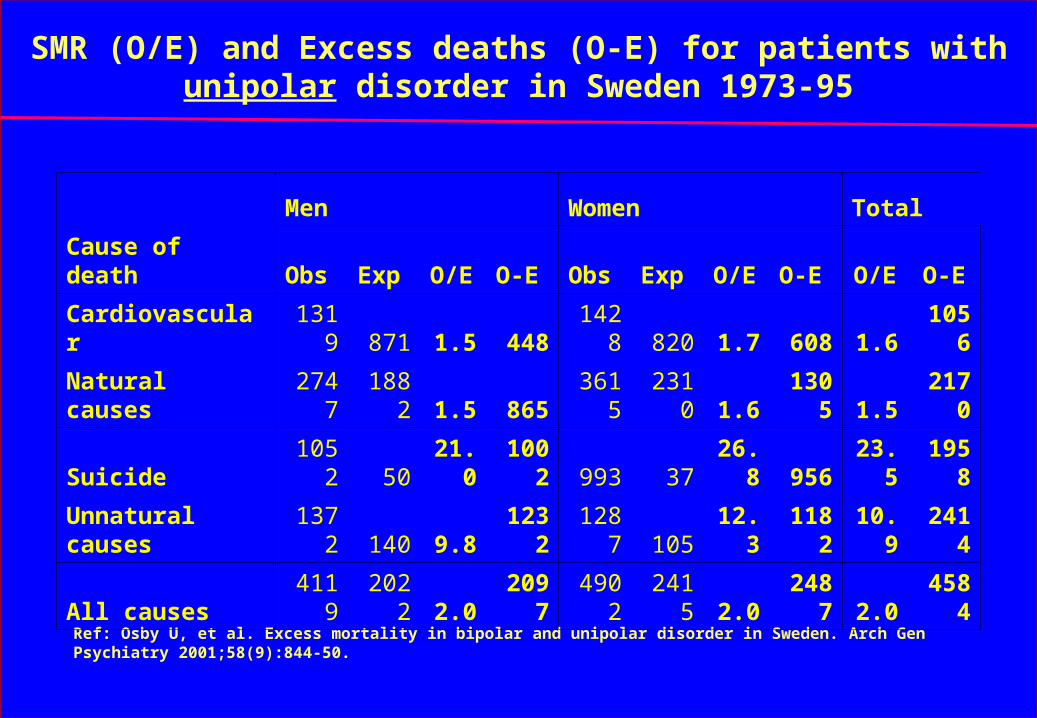
SMR (O/E) and Excess deaths (O-E) for patients with unipolar disorder in Sweden 1973-95
Ref: Osby U, et al. Excess mortality in bipolar and unipolar disorder in Sweden. Arch Gen Psychiatry 2001;58(9):844-50.
Men Women Total
Cause of death Obs Exp O/E O-E Obs Exp O/E O-E O/E O-E
Cardiovascular 1319 871 1.5 448 1428 820 1.7 608 1.6 1056
Natural causes 2747 1882 1.5 865 3615 2310 1.6 1305 1.5 2170
Suicide 1052 50 21.0 1002 993 37 26.8 956 23.5 1958
Unnatural causes 1372 140 9.8 1232 1287 105 12.3 1182 10.9 2414
All causes 4119 2022 2.0 2097 4902 2415 2.0 2487 2.0 4584
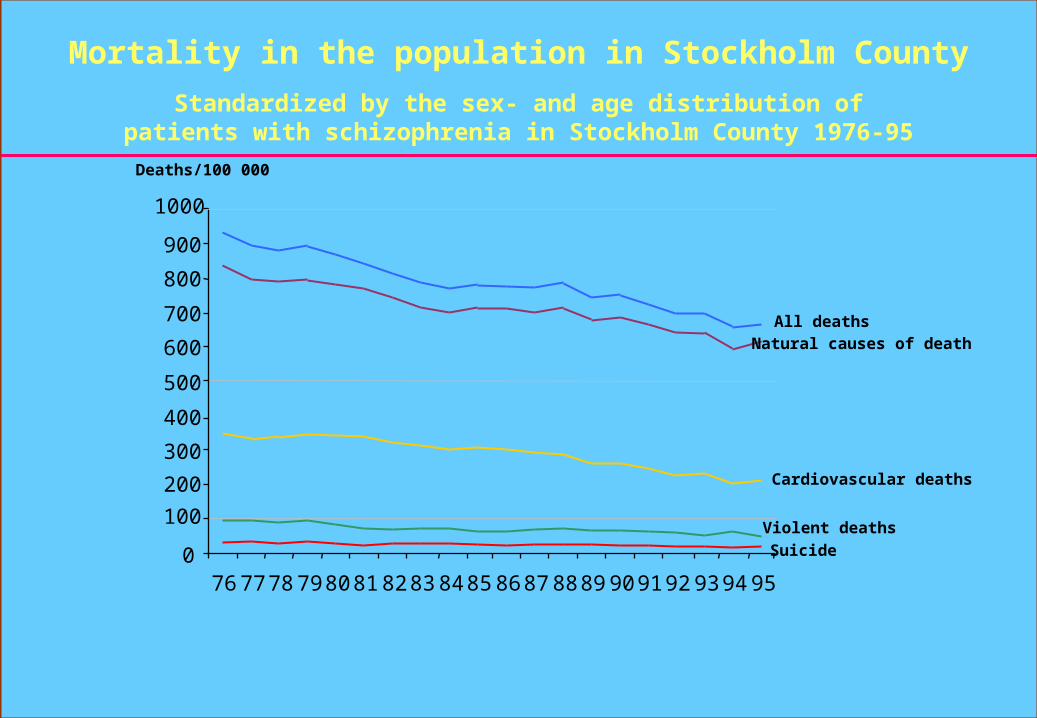
Mortality in the population in Stockholm County
Standardized by the sex- and age distribution of patients with schizophrenia in Stockholm County 1976-95
0
100
200
300
400
500
600
700
800
900
1000
7677787980818283848586878889909192939495
Deaths/100 000
All deathsNatural causes of death
Cardiovascular deaths
Violent deaths
Suicide
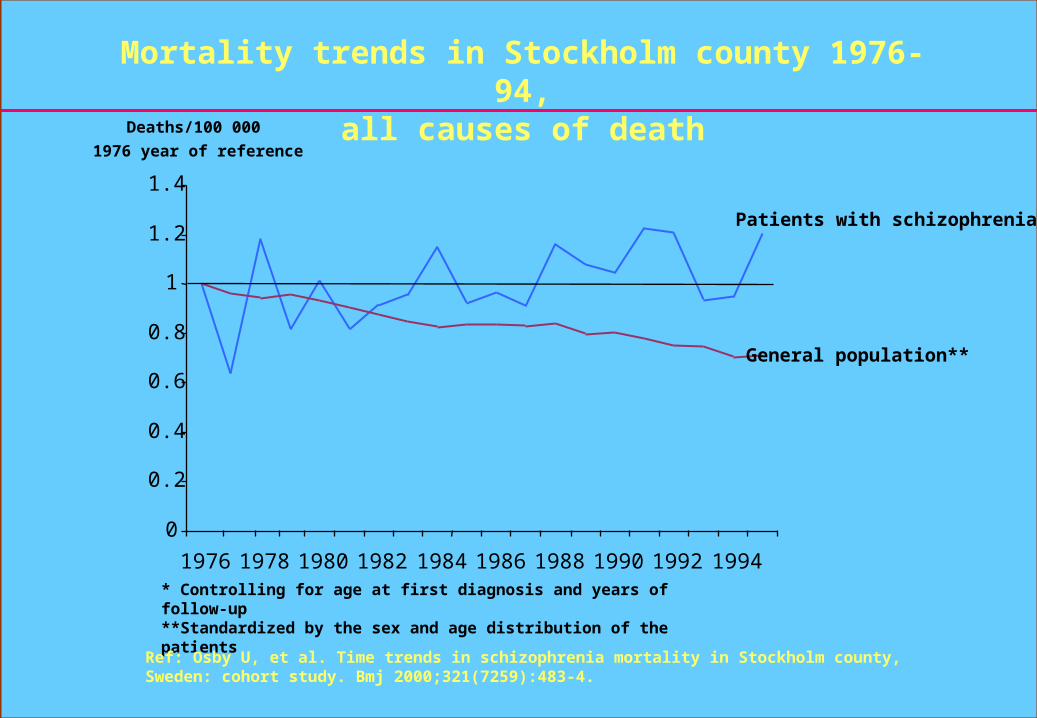
Mortality trends in Stockholm county 1976-94,all causes of death
0
0.2
0.4
0.6
0.8
1
1.2
1.4
1976 1978 1980 1982 1984 1986 1988 1990 1992 1994
Deaths/100 000 1976 year of reference
Patients with schizophrenia*
General population**
* Controlling for age at first diagnosis and years of follow-up**Standardized by the sex and age distribution of the patients
Ref: Osby U, et al. Time trends in schizophrenia mortality in Stockholm county, Sweden: cohort study. Bmj 2000;321(7259):483-4.
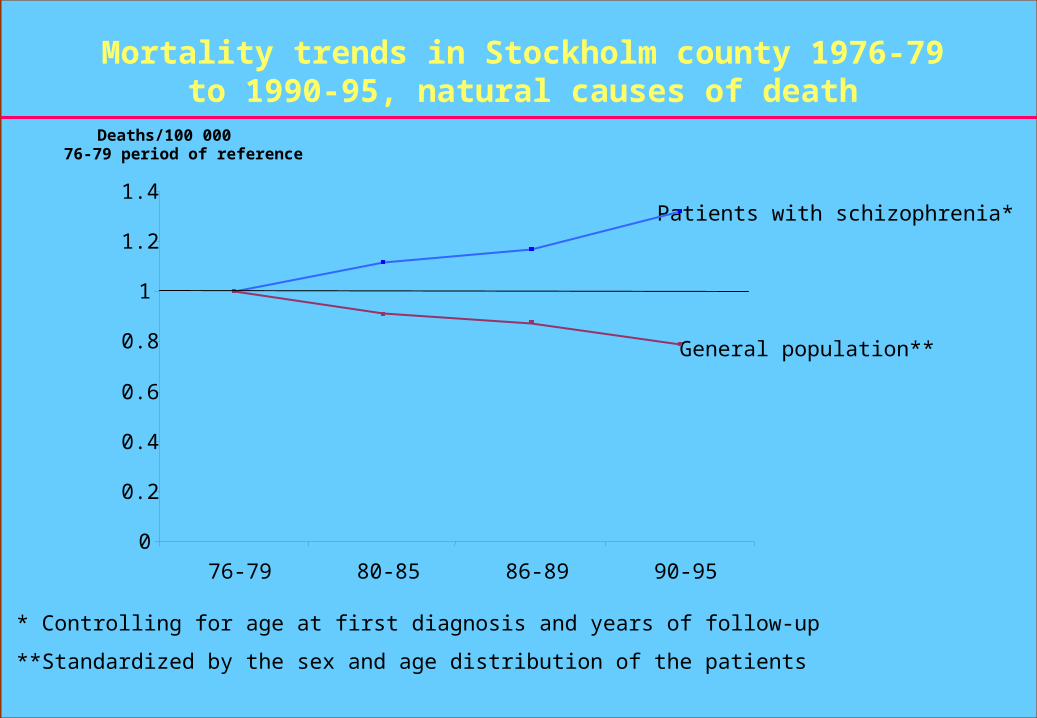
Deaths/100 000 76-79 period of reference
Patients with schizophrenia*
General population**
* Controlling for age at first diagnosis and years of follow-up
**Standardized by the sex and age distribution of the patients
Mortality trends in Stockholm county 1976-79 to 1990-95, natural causes of death
0
0.2
0.4
0.6
0.8
1
1.2
1.4
76-79 80-85 86-89 90-95
0
0.2
0.4
0.6
0.8
1
1.2
1.4
76-79 80-85 86-89 90-95
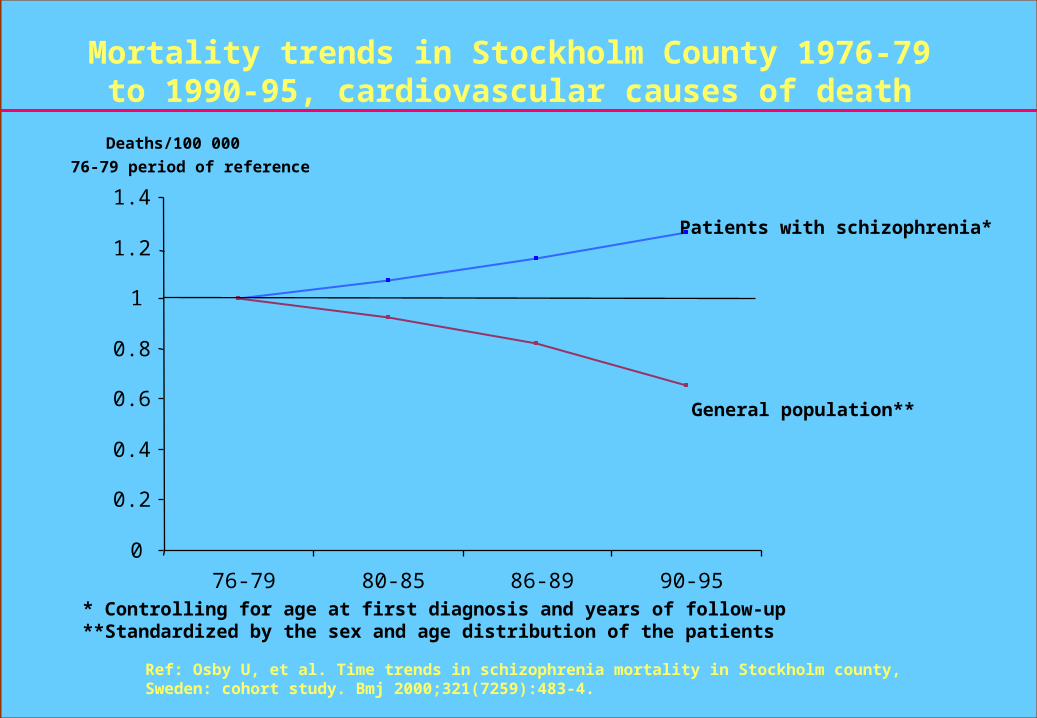
Deaths/100 000 76-79 period of reference
Patients with schizophrenia*
General population**
* Controlling for age at first diagnosis and years of follow-up**Standardized by the sex and age distribution of the patients
Mortality trends in Stockholm County 1976-79 to 1990-95, cardiovascular causes of death
Ref: Osby U, et al. Time trends in schizophrenia mortality in Stockholm county, Sweden: cohort study. Bmj 2000;321(7259):483-4.

Mortality trends in Sweden 1970-2003 adjusted for age
0
500
1 000
1 500
2 000
1970 1975 1980 1985 1990 1995 2000All causes of death Cardiovascular diseaseCoronary heart disease Acute myocardial infarction
Deaths per 100 000
Men

Mortality trends in Sweden 1970-2003adjusted for age
0
500
1 000
1 500
2 000
1970 1975 1980 1985 1990 1995 2000
All causes of death Cardiovascular diseaseCoronary heart disease Acute myocardial infarction
Women
Deaths per 100 000

SMR for schizophrenia in Sweden 1970-2003
0,0
0,5
1,0
1,5
2,0
2,5
All causes of death Cardiovascular disease Coronary heart disease Acute myocardialinfarction
SMRMen Women
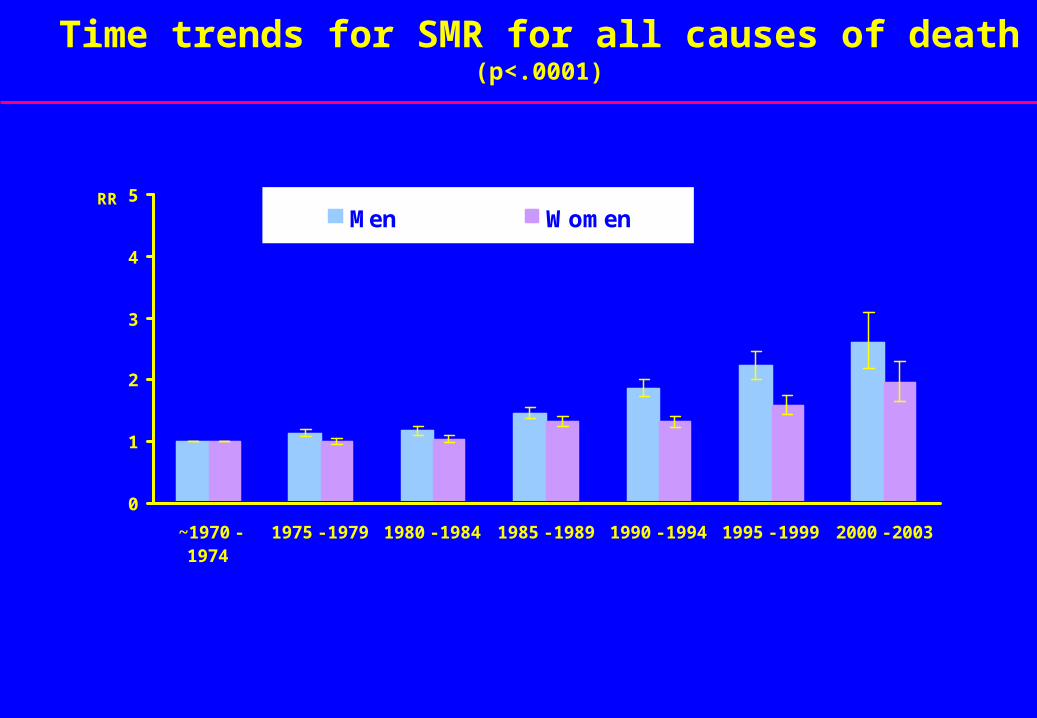
Time trends for SMR for all causes of death (p<.0001)
0
1
2
3
4
5
~1970 -1974
1975 - 1979 1980 - 1984 1985 - 1989 1990 - 1994 1995 - 1999 2000 - 2003
RRMen Women

Time trends for SMR for cardiovascular death (p<.0001)
0
1
2
3
4
5
~1970 -1974
1975 -1979
1980 -1984
1985 -1989
1990 -1994
1995 -1999
2000 -2003
RRMen Women
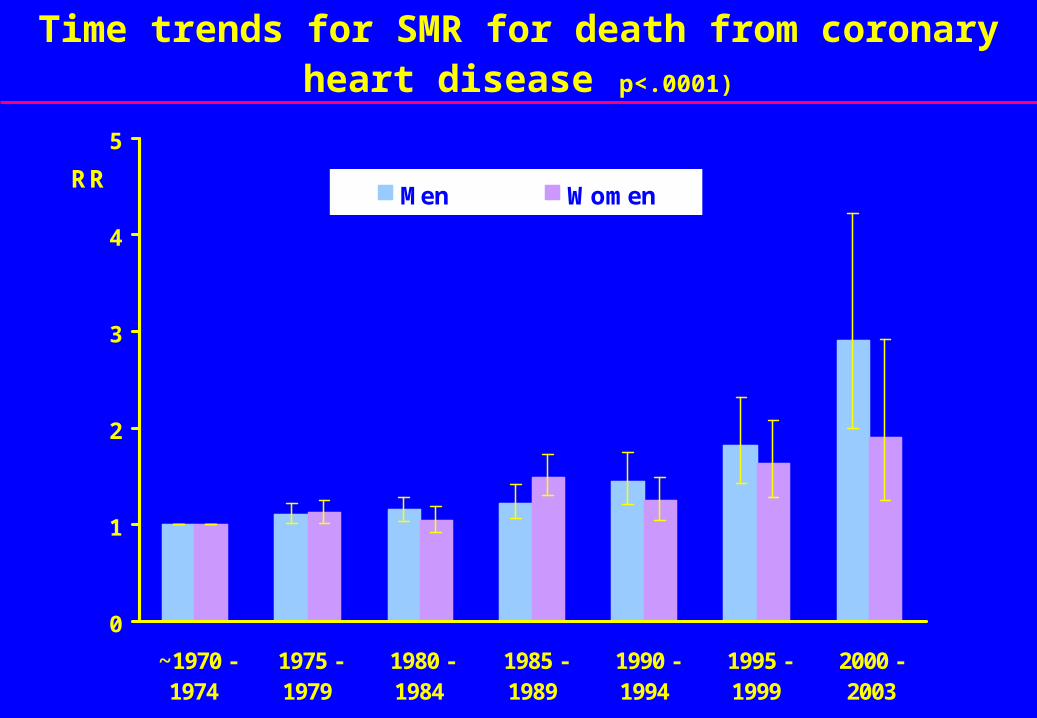
Time trends for SMR for death from coronary heart disease p<.0001)
0
1
2
3
4
5
~1970 -1974
1975 -1979
1980 -1984
1985 -1989
1990 -1994
1995 -1999
2000 -2003
RRMen Women
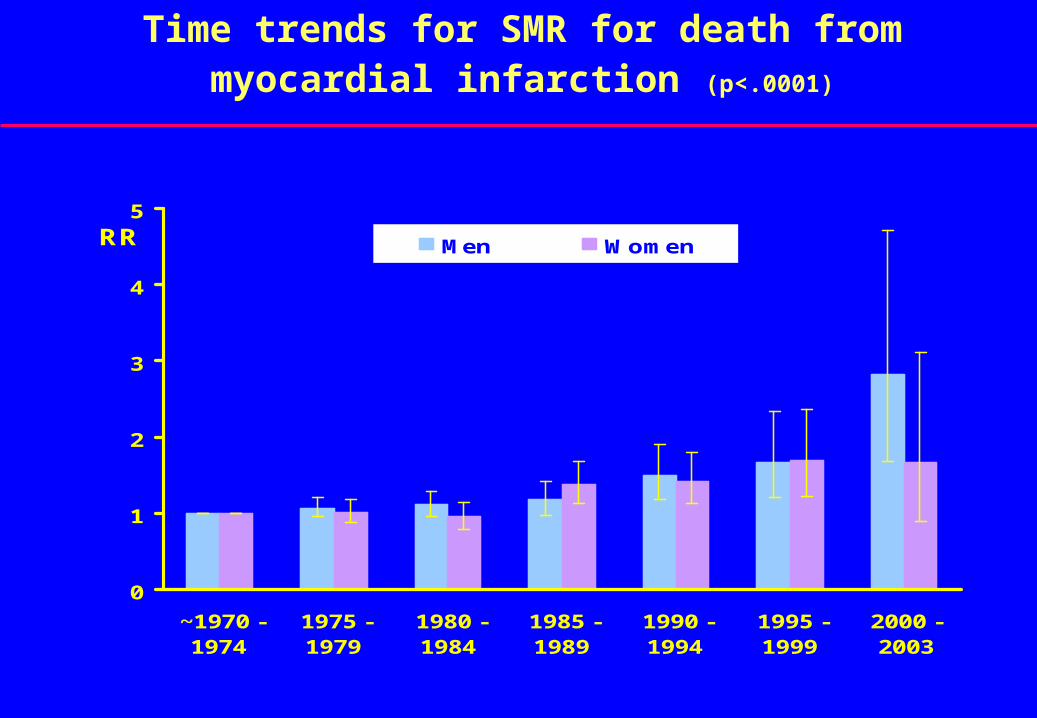
Time trends for SMR for death from myocardial infarction (p<.0001)
0
1
2
3
4
5
~1970 -1974
1975 -1979
1980 -1984
1985 -1989
1990 -1994
1995 -1999
2000 -2003
RR Men Women
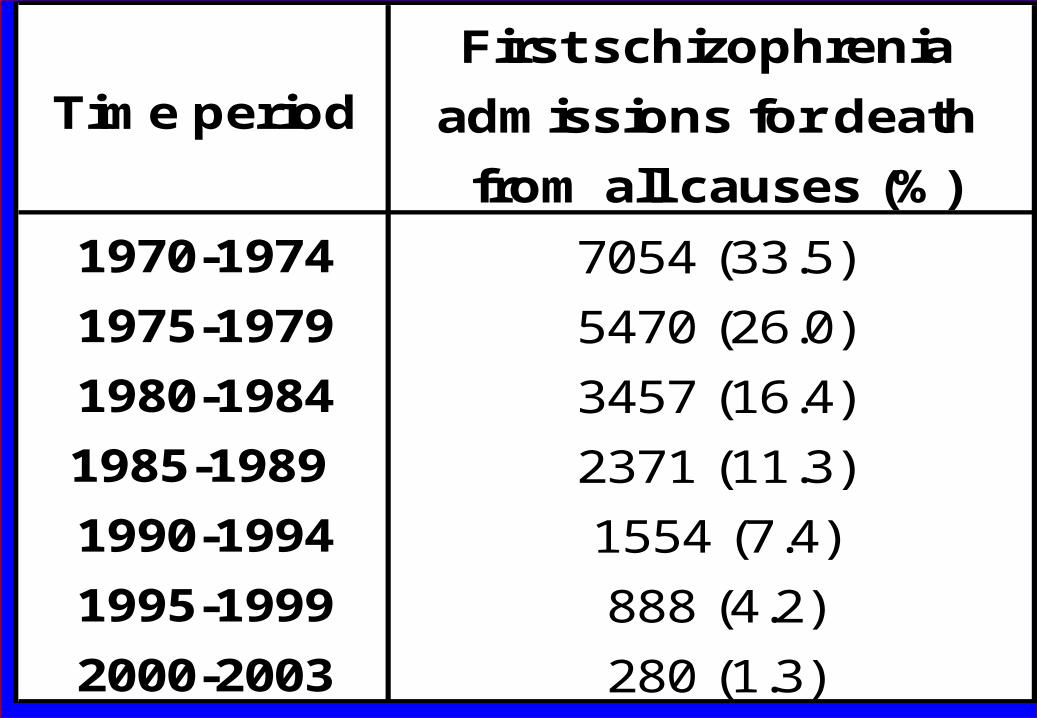
First schizophrenia
admissions for death
from all causes (%)
1970-1974 7054 (33.5)
1975-1979 5470 (26.0)
1980-1984 3457 (16.4)
1985-1989 2371 (11.3)
1990-1994 1554 (7.4)
1995-1999 888 (4.2)
2000-2003 280 (1.3)
Time period
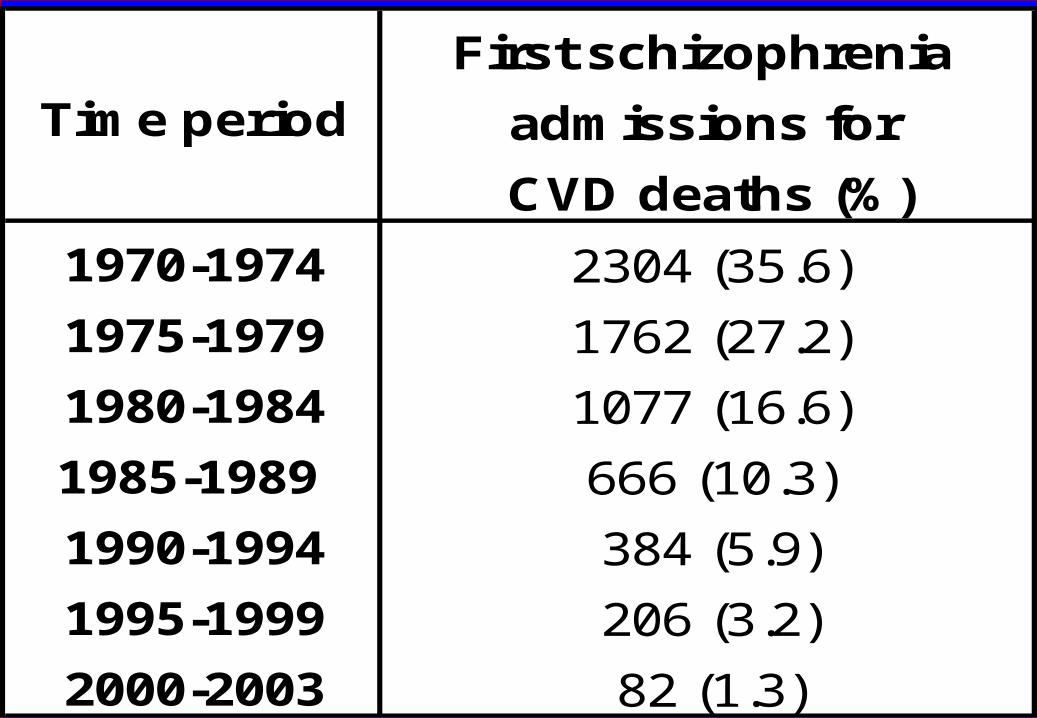
First schizophrenia
admissions for
CVD deaths (%)
1970-1974 2304 (35.6)
1975-1979 1762 (27.2)
1980-1984 1077 (16.6)
1985-1989 666 (10.3)
1990-1994 384 (5.9)
1995-1999 206 (3.2)
2000-2003 82 (1.3)
Time period
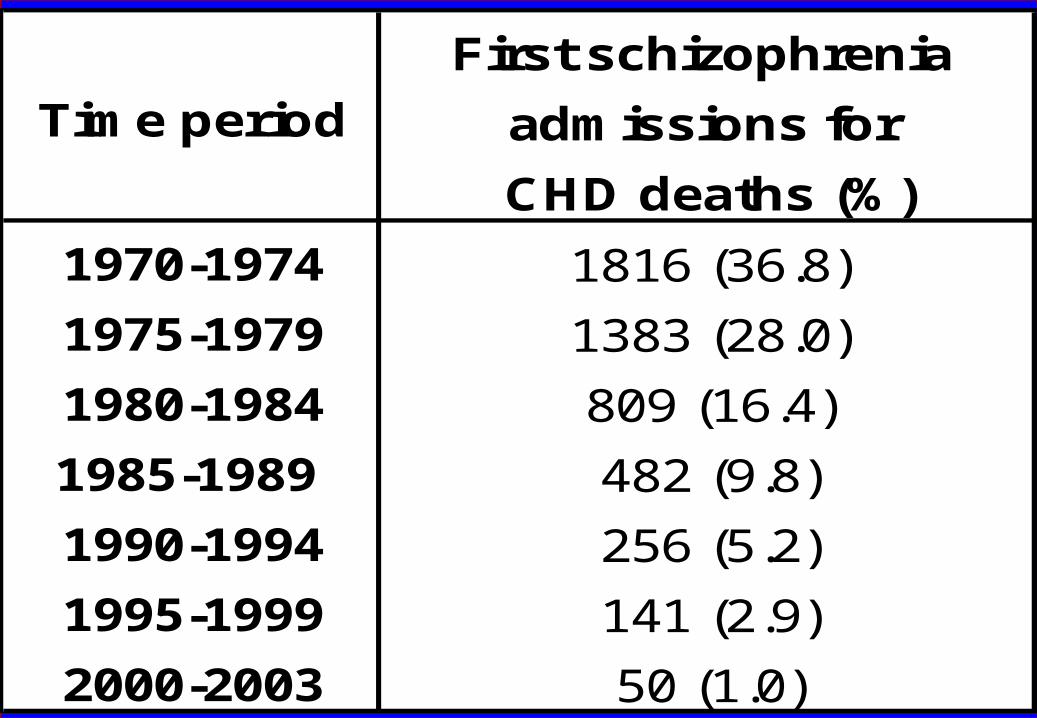
First schizophrenia
admissions for
CHD deaths (%)
1970-1974 1816 (36.8)
1975-1979 1383 (28.0)
1980-1984 809 (16.4)
1985-1989 482 (9.8)
1990-1994 256 (5.2)
1995-1999 141 (2.9)
2000-2003 50 (1.0)
Time period

First schizophrenia
admissions for
AMI deaths (%)
1970-1974 982 (37.2)
1975-1979 722 (27.4)
1980-1984 421 (16.0)
1985-1989 257 (9.7)
1990-1994 156 (5.9)
1995-1999 77 (2.9)
2000-2003 25 (1.0)
Time period

The Good NewsWe are living longer than ever!We are living longer than ever!