Embed Size (px)
Citation preview
1
Forthcoming in the Journal of Finance
More Than Words:
Quantifying Language to Measure Firms’ Fundamentals
PAUL C. TETLOCK, MAYTAL SAAR-TSECHANSKY, and SOFUS MACSKASSY*
ABSTRACT
We examine whether a simple quantitative measure of language can be used
to predict individual firms’ accounting earnings and stock returns. Our three
main findings are: (1) the fraction of negative words in firm-specific news
stories forecasts low firm earnings; (2) firms’ stock prices briefly underreact
to the information embedded in negative words; and (3) the earnings and
return predictability from negative words is largest for the stories that focus on
fundamentals. Together these findings suggest that linguistic media content
captures otherwise hard-to-quantify aspects of firms’ fundamentals, which
investors quickly incorporate into stock prices.
* Tetlock is with the Finance Department and Saar-Tsechansky is with the Information, Risk, and
Operations Management Department at the University of Texas at Austin, McCombs School of Business.
Macskassy is with Fetch Technologies. The authors are grateful for assiduous research assistance from Jie
Cao and Shuming Liu. We appreciate helpful comments from Brad Barber, John Griffin, Alok Kumar,
Terry Murray, David Musto, Terrance Odean, Chris Parsons, Mitchell Petersen, Laura Starks, Jeremy
Stein, and Sheridan Titman, and from seminar participants at Barclays, Goldman Sachs, INSEAD, the
Texas Finance Festival, University of California at Berkeley, University of Oregon, and University of
Texas at Austin. We also thank two anonymous referees. Finally, we are especially grateful to the editor,
Cam Harvey, and an anonymous associate editor for their excellent suggestions. The authors are
responsible for any errors.
2
“Language is conceived in sin and science is its redemption”
– W.V. Quine, The Roots of Reference, p. 68.
A voluminous literature examines the extent to which stock market prices incorporate
quantitative information. Although few researchers study the impact of qualitative verbal
information, there are compelling theoretical and empirical reasons to do so.1
Theoretically, efficient firm valuations should be equal to the expected present
discounted value of their cash flows conditional on investors’ information sets, which
include qualitative descriptions of firms’ business environments, operations, and
prospects in the financial press. Empirically, substantial movements in firms’ stock prices
do not seem to correspond to changes in quantitative measures of firms’ fundamentals
(e.g., Shiller (1981), Roll (1988) and Cutler, Poterba, and Summers (1989)), suggesting
that qualitative variables may help explain stock returns.
In this paper we quantify the language used in financial news stories in an effort
to predict firms’ accounting earnings and stock returns. Our study takes as a starting point
Tetlock (2007), who examines how qualitative information—in particular, the fraction of
negative words in a widely read news column about the stock market—is incorporated in
aggregate market valuations. We extend that analysis to address the impact of negative
words in all Wall Street Journal (WSJ) and Dow Jones News Service (DJNS) stories
about individual S&P 500 firms from 1980 to 2004.2 In addition to studying individual
firms’ stock returns, we investigate whether negative words can be used to improve
expectations of firms’ future cash flows. Overall, this study sheds light on whether and
why quantifying language provides novel information about firms’ earnings and returns.
Before delving into our tests, we call attention to two significant advantages to
using the language in everyday news stories to predict firms’ earnings and returns. First,

3
by quantifying language, researchers can examine and judge the directional impact of a
limitless variety of events, whereas most studies focus on one particular event type, such
as earnings announcements, mergers, or analysts’ recommendations. Analyzing a more
complete set of events that affect firms’ fundamental values allows researchers to identify
common patterns in firm responses and market reactions to events. Equally important,
examining all newsworthy events simultaneously limits the scope for “dredging for
anomalies”—the phrase used by Fama (1998) to describe running event studies on
different types of events until one obtains “significant” results.
Second, linguistic communication is a potentially important source of information
about firms’ fundamental values. Because very few stock market investors directly
observe firms’ production activities, they get most of their information secondhand. Their
three main sources are analysts’ forecasts, quantifiable publicly disclosed accounting
variables, and linguistic descriptions of firms’ current and future profit-generating
activities. If analyst and accounting variables are incomplete or biased measures of firms’
fundamentals, linguistic variables may have incremental explanatory power for firms’
future earnings and returns.
As an example of our linguistic quantification method, consider a January 8, 1999
DJNS article entitled “Consumer Groups Say Microsoft Has Overcharged for Software.”
We hypothesize that the fraction of negative words contained in the article is related to
the impact of the news event on Microsoft’s market value (Tetlock (2007)). The article’s
second sentence is: “The alleged ‘pricing abuse will only get worse if Microsoft is not
disciplined sternly by the antitrust court,’ said Mark Cooper, director of research for
Consumer Federal of America.” Based on the classification dictionary that we use, this
sentence’s fraction of negative words ranks in the 99th
percentile of sentences within our
news database.3 In this case, the abundance of negative words is consistent with an
4
intuitive reading of the story, and with Microsoft’s abnormally poor stock returns around
the news event.4
We do not claim that our crude quantitative measure of language subsumes or
dominates traditional accounting measures of firms’ fundamentals. Rather, we investigate
whether the fraction of negative words in firm-specific news stories can improve our
understanding of firms’ cash flows and whether firms’ stock market prices efficiently
incorporate linguistic information. Insofar as negative word counts are noisy measures of
qualitative information, the coefficients in our regressions should be biased toward zero,
understating the true importance of qualitative information.
Despite this large measurement error, our first main result is that negative words
convey negative information about firm earnings above and beyond stock analysts’
forecasts and historical accounting data. In other words, qualitative verbal information
does not merely echo easily quantifiable traditional measures of firm performance. We
also test whether stock market prices rationally reflect the effect of negative words on
firms’ expected earnings. Our second result is that stock market prices respond to the
information embedded in negative words with a small, one-day delay. As a result, we
identify potential profits from using daily trading strategies based on the words in a
continuous intraday news source (DJNS), but not from strategies based on a news source
updated less frequently (WSJ). Accounting for reasonable transaction costs could
eliminate the profitability of the high-frequency trading strategy, suggesting that short-
run frictions play an important role in how information is incorporated in asset prices. To
interpret these results further, we separately analyze negative words in news stories
whose content focuses on firms’ fundamentals. We find that negative words in stories
about fundamentals predict earnings and returns more effectively than negative words in
other stories. Collectively, our three findings suggest that linguistic media content
5
captures otherwise hard-to-quantify aspects of firms’ fundamentals, which investors
quickly incorporate into stock prices.
The layout of the paper is as follows. In Section I we conduct a brief review of
related research on qualitative information. Section II discusses the properties of the news
stories used in this study. Sections III and IV present the main tests for whether negative
words predict firms’ earnings and stock returns, respectively. In Section V, we assess
whether earnings and return predictability is strongest for timely (DJNS) news articles
that focus on firms’ fundamentals. In Section VI, we present our conclusions and outline
directions for further research on media content.
I. Research on Qualitative Information
To create a quantitative variable from text documents such as news stories, one
must devise a representation of the unstructured text. The most common representation is
the Bag-of-Words scheme, which represents all words appearing in news stories as a
document-term matrix—e.g., a row could be the 1/8/99 Microsoft story above, and
columns could be the terms “alleged,” “abuse,” “worse,” “happy,” and “neutral.” The
matrix elements are designed to capture the information value of each word in each news
story, which could be the relative frequencies of the five words within the 29-word
excerpt: [1/29, 1/29, 1/29, 0/29, 0/29]. The challenge in text analysis is to translate this
term-document matrix into a meaningful conceptual representation of the story, such as
the degree to which the story conveys positive or negative information.
In this paper, we collapse the document-term matrix into just two columns using
domain knowledge from the positive and negative word categories in the Harvard-IV-4
psychosocial dictionary. For reasons explained below, our primary focus is the negative

6
column. We make the simplifying assumption that all negative words in the
predetermined dictionary are equally informative, and other words are uninformative. As
in the example above, we measure a story’s negativity according to the relative frequency
of negative words in each news story. These procedures conform to Tetlock (2007) and
many psychological studies using the Harvard-IV-4 dictionary. A well-known and widely
used text analysis program called the General Inquirer features this same dictionary.5
A more sophisticated alternative to our approach would entail estimating the
information value of each word’s occurrence in a story, and determining which words are
most likely to appear in negative stories. Unfortunately, these nuances have significant
drawbacks. First, subjective human judgment may be necessary to assess whether a story
is negative. Second, determining which words are more likely to have negative meanings
requires the estimation of potentially thousands of likelihoods ratios—one for every word
used in classification. By contrast, we rely on extensive psychological research to identify
negative words, thereby avoiding this daunting estimation task and the need for
subjective human judgment. Our resulting word count measures are parsimonious,
objective, replicable, and transparent. At this early stage in research on qualitative
information, these four attributes are particularly important, and give word count
measures a reasonable chance of becoming widely adopted in finance.
In addition to Tetlock (2007), several new research projects investigate the
importance of qualitative information in finance. Our study is most closely related to
concurrent work by Li (2006) and Davis, Piger, and Sedor (2006), who analyze the tone
of qualitative information using objective word counts from corporate annual reports and
earnings press releases, respectively. Whereas Davis, Piger, and Sedor (2006) examine
the contemporaneous relationships between earnings, returns, and qualitative

7
information, Li (2006) focuses on the predictive ability of qualitative information as we
do.
Li (2006) finds that the two words “risk” and “uncertain” in firms’ annual reports
predict low annual earnings and stock returns, which the author interprets as
underreaction to “risk sentiment.” Our study differs from Li (2006) in that we examine
qualitative information in news stories at daily horizons rather than qualitative
information in annual reports at annual horizons. Our predictability tests use over 80
quarters of earnings and over 6,000 days of returns data, as compared to 12 years of
earnings and 12 years of returns data in Li (2006). Other differences between our studies,
such as the measures used, do not seem to be as important. When we use the words “risk”
and “uncertain” rather than the entire negative words category to measure qualitative
information, we find similar albeit slightly weaker earnings and return predictability.
Some prior and contemporaneous research analyzes qualitative information using
more sophisticated subjective measures, rather than simple objective word counts.
However, most of this work focuses on firms’ stock returns and ignores firms’ earnings.
For example, Antweiler and Frank (2004) and Das and Chen (2006) design algorithms to
reproduce humans’ “bullish,” “neutral,” or “bearish” ratings of internet chat room
messages and news stories. Neither study finds any statistically significant return
predictability in individual stocks. A recent study by Antweiler and Frank (2006), which
uses an algorithm to identify news stories by their topic rather than their tone, does find
some return predictability. For many of their topic classifications, Antweiler and Frank
(2006) find significant return reversals in the 10-day period around the news, which they
interpret as overreaction to news regardless of its tone.

8
II. Stylized Facts about Firm-Specific News Stories
We concentrate our analysis on the fraction of negative words in DJNS and WSJ
stories about S&P 500 firms from 1980 through 2004. We choose the S&P 500
constituent firms for reasons of importance and tractability. Firms in the S&P 500 index
encompass roughly three-quarters of the total U.S. market capitalization, and appear in
the news sufficiently often to make the analysis interesting.
We obtain S&P index constituents and their stock price data from the Center for
Research on Security Prices (CRSP), analyst forecast information from the Institutional
Brokers’ Estimate System (I/B/E/S), and accounting information from Compustat.
Merging the news stories and the financial information for a given firm requires matching
firms’ common names used in news stories to their permnos, CUSIPs, or gvkeys used in
the above financial data sets. Although firms’ common names usually resemble the firm
names appearing in financial data sets, perfect matches are rare.
To obtain the common names that we use as search strings for news stories, we
begin with the company name variable in the CRSP data for all S&P 500 index
constituents during the relevant time frame. We use the CRSP company name change file
to identify situations in which a firm in the index changes its name. We focus on news
stories featuring the company name most directly related to the stock. Thus, for
conglomerates, we use the holding company name, not the subsidiary names—e.g.,
PepsiCo, Inc., or Pepsi for short, rather than Gatorade or Frito-Lay. This means that we
may miss news stories about some firms’ major products, possibly weakening our results.
Our source for news stories is the Factiva database. To find the name that media
outlets use to refer to a firm, we use a combination of four different methods that are
described in detail in the Appendix. Because of the large number of firms and news
9
stories, we implement an automated story retrieval system. For each S&P 500 firm, the
system constructs a query that specifies the characteristics of the stories to be retrieved.
The system then submits the query and records the retrieved stories.
In total, we retrieve over 350,000 qualifying news stories—over 260,000 from
DJNS and over 90,000 from WSJ—that contain over 100,000,000 words. We find at least
one story for 1,063 of 1,110 (95.8%) of the firms in the S&P 500 from 1980 to 2004 (see
the Appendix for details). We include a news story in our analysis only if it occurs while
the firm is a member of the S&P index and is within our 25-year time frame. We also
exclude stories in the first week after a firm has been newly added to the index to prevent
the well-known price increase associated with a firm’s inclusion in the S&P 500 index
from affecting our analysis (Shleifer (1986)).
Each of the stories in our sample meets certain requirements that we impose to
eliminate irrelevant stories and blurbs. Specifically, we require that each firm-specific
story mentions the firm’s official name at least once within the first 25 words, including
the headline, and the firm’s popular name at least twice within the full story. In addition,
we require that each story contains at least 50 words in total, and at least five words that
are either “Positive” or “Negative,” where at least three of the five must be unique. We
impose these three word count filters to eliminate stories that contain only tables or lists
with company names and quantitative information, and to limit the influence of outliers
on the negative words measure described below.
Following Tetlock (2007), our primary measure of media content is the
standardized fraction of negative words in each news story. In unreported tests, we find
very similar results using combined measures of positive (P) and negative (N) words,
such as (P – N) / (P + N) and log((1 + P) / (1 + N)). However, using positive words in
isolation produces much weaker results, especially after controlling for negative words.

10
These results are consistent with the general analysis of word categories in Tetlock
(2007). That study shows that negative words summarize common variation in the entire
set of General Inquirer word categories better than any other single category, including
positive words—i.e., negatives are most highly correlated with the first eigenvector of the
N by N variance-covariance matrix for all N word categories. Tetlock (2007) also finds
that negative words have a much stronger correlation with stock returns than other words.
These results are also consistent with a large body of literature in psychology—e.g.,
Baumeister et al. (2001) and Rozin and Royzman (2001)—that argues negative
information has more impact and is more thoroughly processed than positive information
across a wide range of contexts.
Before counting instances of negative words, we combine all qualifying news
stories for each firm on a given trading day into a single composite story. We standardize
the fraction of negative words in each composite news story by subtracting the prior
year’s mean and dividing by the prior year’s standard deviation of the fraction of negative
words. Formally, we define two measures of negative words:
words totalof #
wordsnegative of #=Neg (1)
Neg
NegNegneg
σ
µ−= , (2)
where µNeg is the mean of Neg and σNeg is the standard deviation of Neg over the prior
calendar year. The standardization may be necessary if Neg is nonstationary, which could
happen if there are regime changes in the distribution of words in news stories—e.g., the
DJNS or WSJ changes its coverage or style. The variable neg is the stationary measure of
media content that we employ in our regression analyses.

11
Before analyzing the predictive power of linguistic media content, we document
an important stylized fact: there are many more firm-specific news stories in the days
immediately surrounding a firm’s earnings announcement. For each firm-specific news
story, we calculate the number of days until the firm’s next earnings announcement and
the number of days that have passed since the firm’s previous earnings announcement.
We plot a histogram of both variables back-to-back in Figure 1. Thus, each story is
counted exactly twice in Figure 1, once after the previous announcement and once before
the next announcement, except the stories that occur on the earnings announcement day.
[Insert Figure 1 around here.]
Figure 1 provides striking evidence that news stories concentrate around earnings
announcement days, as shown by the three adjacent spikes representing the firm-specific
news stories one day before, on the same day as, and one day after a firm’s earnings
announcement. This finding suggests that news stories could play an important role in
communicating and disseminating information about firms’ fundamentals. In the next
three sections, we provide further support for this interpretation of Figure 1.
III. Using Negative Words to Predict Earnings
We now formally investigate whether the language used by the media provides
new information about firms’ fundamentals and whether stock market prices efficiently
incorporate this information. In order to affect stock returns, negative words must convey
novel information about either firms’ cash flows or investors’ discount rates (Campbell
and Shiller (1987)). Our tests in this section focus on whether negative words can predict
earnings, a proxy for cash flows, and therefore permanent changes in prices. The return
predictability tests in Section IV address the possibility that negative words proxy for

12
changes in investors’ discount rates, and therefore lead to return reversals. The idea
underlying our earnings predictability tests is that negative words in a firm’s news stories
prior to the firm’s earnings announcement could measure otherwise hard-to-quantify
unfavorable aspects of the firm’s business environment.
We use two measures of firms’ quarterly accounting earnings as dependent
variables in our predictability tests, as the quarterly frequency is the highest frequency for
earnings data. Our main tests compute each firm’s standardized unexpected earnings
(SUE) following Bernard and Thomas (1989), who use a seasonal random walk with
trend model for each firm’s earnings:
4
−−= ttt EEUE (3)
t
t
UE
UEt
t
UESUE
σ
µ−= , (4)
where Et is the firm’s earnings in quarter t, and the trend and volatility of unexpected
earnings (UE) are equal to the mean (µ) and standard deviation (σ) of the firm’s previous
20 quarters of unexpected earnings data, respectively. As in Bernard and Thomas (1989),
we require that each firm have nonmissing earnings data for the most recent 10 quarters
and assume a zero trend for all firms with fewer than four years of earnings data.
We also use standardized analysts’ forecast errors (SAFE) as an alternative
measure of firms’ earnings to ensure robustness. SAFE is equal to the median stock
analyst’s earnings forecast error divided by earnings volatility (σ), which is the same as
the denominator of SUE. We use the median analyst forecast from the most recent
statistical period in the I/B/E/S summary file prior to three days before the earnings
announcement.6 We winsorize SUE and all analyst forecast variables at the 1% level to
reduce the impact of estimation error and extreme outliers, respectively. Despite the
13
well-known biases in stock analysts’ earnings forecasts, we find remarkably similar
results using SUE and SAFE.7
We attempt to match the frequency of our news measure to the frequency of our
quarterly earnings variable. Our measure of negative words (neg-30,-3) is the standardized
number of negative words in all news stories between 30 and three trading days prior to
an earnings announcement divided by the total number of words in these news stories.
That is, we construct the measure exactly analogous to the story-specific measure (neg)
defined earlier, where we treat all the words in the [-30,-3] time window as though they
form a single composite news story. We standardize neg-30,-3 by subtracting the prior
year’s mean and dividing by the prior year’s standard deviation.
The timing of neg-30,-3 is designed to include news stories about the upcoming
quarter’s earnings announcement. Because 30 trading days is roughly one-half of a
trading quarter, it is likely that most of the news stories in the [-30,-3] time window focus
on the firm’s upcoming announcement rather than its previous quarter’s announcement.
In addition, we allow for two full trading days between the last news story included in
this measure and the earnings announcement because Compustat earnings announcement
dates may not be exact. None of our qualitative results change if we set the beginning of
the time window to 20 or 40 trading days before the announcement, or set the ending of
the window to one or five trading days before the announcement.
In all earnings predictability regressions, we include control variables based on a
firm’s lagged earnings, size, book-to-market ratio, trading volume, three measures of
recent stock returns, analysts’ earnings forecast revisions, and analysts’ forecast
dispersion. We measure firms’ lagged earnings using last quarter’s SUE or SAFE
measure, depending on which of these two variables is the dependent variable in the
regression.8 We measure firm size (Log(Market Equity)) and book-to-market (Log(Book /

14
Market)) at the end of the preceding calendar year, following Fama and French (1992).
We compute trading volume as the log of annual shares traded divided by shares
outstanding (Log(Share Turnover)) at the end of the preceding calendar year.
Our three control variables for a firm’s past returns are based on a simple earnings
announcement event study methodology.9 We estimate benchmark returns using the
Fama-French (1993) three-factor model with an estimation window of [-252,-31] trading
days prior to the earnings announcement. We include two control variables for a firm’s
recent returns, the cumulative abnormal return from the [-30,-3] trading day window
(FFCAR-30,-3) and the abnormal return on day -2 (FFCAR-2,-2). These return windows end
one trading day after our [-30,-3] news story time window to ensure that we capture the
full price impact of the news stories. Our third control variable, FFAlpha-252,-31, is the
estimated intercept from the event study regression that spans the [-252,-31] time
window. We interpret the FFAlpha-252,-31 measure as the firm’s in-sample cumulative
abnormal return over the previous calendar year, skipping the most recent month. The
FFAlpha-252,-31 variable is related to the Jegadeesh and Titman (1993) return momentum
effect, which is based on firms’ relative returns over the previous calendar year excluding
the most recent month.
In all our earnings regressions, we include control variables for the median
analyst’s quarterly forecast revision and analysts’ quarterly forecast dispersion. We
compute the median analyst’s three-month earnings forecast revision (Forecast
Revisions) following Chan, Jegadeesh, and Lakonishok (1996). We use three-month
revision periods rather than six-month periods because these revisions capture new
information after the forecast preceding last quarter’s earnings announcement, which is
already included in our regressions as a separate control. This revision variable is equal to
the three-month sum of scaled changes in the median analyst’s forecast, where the scaling
15
factor is the firm’s stock price in the prior month. We compute analysts’ forecast
dispersion (Forecast Dispersion) as the standard deviation of analysts’ earnings forecasts
in the most recent time period prior to the announcement scaled by earnings volatility
(σ)—i.e., the denominator of SUE and SAFE. We construct both of these control variables
using quarterly analyst forecasts to match our dependent variables, which are based on
quarterly earnings measures. Because analysts’ quarterly forecasts are unavailable from
I/B/E/S between 1980 and 1983 and for firms without analyst coverage, the earnings
predictability regressions that we report do not include these observations.10
Even though the stock return control variable (FFCAR-30,-3) includes all of the
information embedded in news stories during the [-30,-3] time window, it is possible that
these stories are more recent than the most recent analyst forecast data. Indeed, many
WSJ and DJNS news stories explicitly mention stock analysts, suggesting negative words
in these stories may draw some predictive power from analysts’ qualitative insights. To
guard against the possibility that negative words predict returns solely because they
appear more recently than the quantitative analyst forecasts, we also calculate a “Before
Forecasts” negative words measure (neg-30,-3) that includes only the stories that occur at
least one trading day prior to the date of the most recent consensus analyst forecast.11
We estimate the ability of negative words (neg-30,-3) to predict earnings (SUE or
SAFE) using pooled ordinary least squares (OLS) regressions and standard errors
clustered by calendar quarter (Froot (1989)). The rationale is that the dependent variable
(SUE or SAFE) is already standardized to remove any firm effect, but does exhibit a time
effect because firms’ realized earnings are undoubtedly correlated within calendar
quarters. We confirm this reasoning using several diagnostic checks following Petersen
(2007). These tests also suggest that, if anything, our coefficients and standard errors are
conservative relative to a wide range of alternative estimation techniques.12
16
Table I reports estimates of the ability of negative words (neg-30,-3) to predict
quarterly earnings using six OLS regressions: two different dependent variables (SUE;
SAFE) regressed on negative words computed based on four sets of news stories (DJNS,
WSJ, “Before Forecasts,” and “All Stories”). The key result is that negative words
(neg-30,-3) consistently predict lower earnings, regardless of whether we use the SUE or
SAFE measure, and regardless of whether we use stories from DJNS or WSJ or from the
time period before stock analysts state their earnings forecasts.
[Insert Table I around here.]
Although negative words (neg-30,-3) from WSJ stories appear to predict SUE
slightly better than neg-30,-3 from DJNS stories, the WSJ coefficient estimates of neg-30,-3
are not statistically different from the DJNS estimates. All six estimates of the
dependence of earnings on negative words are negative and statistically significant at the
99% level. Because the independent and dependent variables are standardized, the rough
economic interpretation of the “All Stories” SUE estimate is that the conditional
expectation of SUE is 4*(0.064) = 0.255 standard deviations lower as neg-30,-3 increases
from two standard deviations below to two standard deviations above its mean value.
We now analyze the SUE and SAFE regressions that compute negative words
using stories from both news sources in greater detail. Columns 4 and 6 in Table I display
the coefficient estimates for all independent variables in these two regressions. As one
would expect, several control variables exhibit strong explanatory power for future
earnings. For example, lagged earnings, variables based on analysts’ forecasts and recent
stock returns (FFCAR-30,-3) are all powerful predictors of earnings.
To gain intuition on the importance of language in predicting fundamentals, we
compare the abilities of negative words in firm-specific news stories (neg-30,-3) and firms’
recent stock returns (FFCAR-30,-3) to predict future earnings. The logic of this comparison

17
is that both variables capture potentially relevant firm-specific information over the same
time horizon—their correlation is -0.05, and strongly statistically significant. This is a
particularly challenging comparison for language because the firm’s abnormal return
measures the representative investor’s interpretation of firm-specific news, which is
undoubtedly based on a more sophisticated reading of the linguistic content that we
quantify. In this respect, it is surprising that quantified language has any explanatory
power above and beyond market returns. Indeed, one could view a firm’s abnormal return
(FFCAR-30,-3) measured over the time horizon in which there is news ([-30,-3]) as an
alternative quantification of the tone of news (e.g., Chan (2003)).
Surprisingly, Columns 4 and 6 in Table I reveal that negative words and recent
stock returns have almost the same statistical impact and comparable economic impacts
on future earnings. After standardizing the coefficients to adjust for the different
variances of the independent variables, we find that the economic impact of past returns
is 0.127 SUE and the impact of negative words is 0.063 SUE—roughly half as large. We
infer that incorporating directly quantified language in earnings forecasts significantly
improves upon using stock returns alone to quantify investors’ reactions to news stories.
The “Before Forecasts” columns (3 and 5) in Table I show that negative words
(neg-30,-3) robustly predict both SUE and SAFE even after we exclude words from the
most recent stories. Surprisingly, the respective neg-30,-3 coefficients change in magnitude
by less than 3% relative to Columns 4 and 6, and both remain strongly significant at any
conventional level (p-values < 0.001).
In additional unreported tests, we run separate regressions for two subperiods,
pre-1995 and 1995 to 2004, based on the idea that media coverage changed significantly
in 1995 with the introduction of the Internet—e.g., the WSJ officially launched WSJ.com
on April 29, 1995. The main finding is that the significance and magnitude of all our
18
results are quite similar for both subperiods. In summary, the evidence consistently shows
that even a crude quantification of qualitative fundamentals (neg-30,-3) can predict
earnings above and beyond more recent measures of market prices and analysts’
forecasts.
We now examine the long-run time-series behavior of earnings surrounding the
release of negative words in firm-specific news stories. Figure 2 compares the earnings of
firms with negative and positive news stories from 10 fiscal quarters prior to an earnings
announcement up to 10 fiscal quarters after the earnings announcement. The dependent
variable in Figure 2 is a firm’s cumulative SUE beginning 10 quarters prior to the
earnings announcement when the news was released. Our cumulative SUE computation
does not discount earnings in different time periods. Using a positive discount rate would
make the effect of negative words on earnings appear larger and more permanent.
To compute SUE values after the news stories in Figure 2, we use only
benchmarks for unexpected earnings that are known at the time of the news—i.e., those
based on earnings information prior to quarter zero. We use the matching seasonal
earnings figure from before quarter zero to compute unexpected earnings after quarter
zero—e.g., we subtract E-3 from E1, E5, and E9 to obtain UE1, UE5, and UE9. To obtain
SUE measures, we standardize these unexpected earnings values using the mean and
volatility of unexpected earnings as measured in quarter zero.13
We define positive
(negative) news as news in which the variable Neg-30,-3 is in the bottom (top) quartile of
the previous year’s distribution of Neg-30,-3.14
[Insert Figure 2 around here.]
Figure 2 shows that firms with negative news stories before an earnings
announcement experience large negative shocks to their earnings that endure for at least
four quarters after the news. Although there are noticeable differences between firms

19
with positive stories and those with many negative stories that appear before the news is
released (0.772 cumulative SUE), the greatest discrepancy between the cumulative
earnings of the two types of firms (1.816 cumulative SUE) appears in the sixth fiscal
quarter after the news event. It appears as though most of the impact of negative words
on cumulative earnings is permanent—1.764 cumulative SUE after 10 quarters, which is
0.992 cumulative SUE more than prior to the news. However, it is difficult to judge the
magnitude and duration of the effect based on just 10 independent 10-quarter periods.
From the analysis above, we conclude that negative words in firm-specific stories
leading up to earnings announcements significantly contribute to a useful measure of
firms’ fundamentals. One view is that this result is surprising because numerous stock
analysts and investors closely monitor the actions of S&P 500 firms. Yet even after
controlling for recent stock returns, analyst forecasts and revisions, and other measures of
investors’ knowledge, we find that a rudimentary linguistic measure of negative news
still forecasts earnings. Furthermore, as we will demonstrate in Section V, it is possible to
improve substantially upon this basic negative word count measure.
An alternative view is that negative words are informative measures of firms’
fundamentals because they do not suffer from the same shortcomings as the quantitative
variables that one can use to forecast earnings. For example, it is widely known that stock
analysts’ earnings forecasts exhibit significant biases that limit their forecasting power. In
addition, stock market returns reflect revisions in investors’ expectations of the present
value of all future earnings as opposed to just next quarter’s earnings, which is the
dependent measure in our regressions. Even if investors and stock analysts are fully
aware of the information embedded in negative words, negative words may have
significant incremental explanatory power for future earnings because readily available
quantitative variables are not accurate representations of investors’ expectations.
20
IV. Using Negative Words to Predict Stock Returns
We subject the two competing views described above to empirical scrutiny in our
return predictability tests. Having established that negative words in news stories can
predict firms’ fundamentals, we now examine whether they provide novel information
not already represented in stock market prices. Unfortunately, we cannot test this
conjecture by looking at contemporaneous market returns. Although there is a significant
negative relationship between negative words and concurrent market returns, it is difficult
to know which variable causes the other. Instead, we hypothesize that investors do not
immediately respond in full to the news embedded in negative words. To test this theory,
we explore whether negative words predict firms’ future stock returns.
A. Predicting Returns in Story Event Time
In this subsection, we focus on OLS regression estimates of the effect of negative
words on future stock returns in event time relative to the release of the news story. We
use daily returns and news stories because these are the highest frequencies for which
both data are reliably available—i.e., all firms have daily returns for the entire sample,
and the WSJ is a daily publication. Other benefits of this choice are that the news and
return data frequency match each other and match the data frequency in Tetlock (2007).
Our main test assesses whether standardized fractions of negative words in
firm-specific news stories on day zero predict firms’ close-to-close stock returns on day
one. For all DJNS stories, we obtain precise time stamp data to exclude stories that occur
after 3:30pm on day zero—i.e., 30 minutes prior to market closing. To be conservative,
21
we use the last time stamp for each story, which indicates when the story was most
recently updated. Thus, in many cases, the negative words in DJNS stories became
known to investors much earlier, often by one hour, than we assume. This ensures that
traders have at least 30 minutes, and usually much longer, to digest and trade on the
information in these stories. For all WSJ stories, we assume that stories printed in the
morning’s WSJ are available to traders well before the market close on the same day.
In each regression, we include several standard control variables to assess whether
negative words predict returns above and beyond already-known sources of
predictability, including both firms’ characteristics (Daniel et al. (1997)) and firms’
covariances with priced risk factors (Fama and French (1993)). We include all of the
characteristic controls in the earnings predictability regressions, except the two analyst
earnings forecast variables.15
That is, we include the firm’s most recent earnings
announcement (SUE), along with its close-to-close abnormal returns on the day of the
news story (FFCAR0,0), each of the previous two trading days (FFCAR-1,-1 and FFCAR-2,-
2), the previous month (FFCAR-30,-3), and the previous year (FFAlpha-252,-31). These
controls are designed to capture return predictability from past earnings (e.g., Ball and
Brown (1968)) and past returns (e.g., Jegadeesh and Titman (1993)), which may be
distinct phenomena (e.g., Chan, Jegadeesh, and Lakonishok (1996)). In addition, we
control for firm size and book-to-market ratios using each firm’s log of market
capitalization and log of book-to-market equity measured at the end of the most recent
June. These controls mimic the variables that Fama and French (1992) use to predict
returns. We also control for trading volume using the log of share turnover.
We run two sets of regressions to ensure that firms’ return covariances with
priced risk factors do not drive our results. In the first set of regressions, we use each
firm’s next-day abnormal return as the dependent variable, where the Fama-French three-

22
factor model is the benchmark for expected returns.16
To ensure that our results do not
depend heavily on the benchmarking process, we run a second set of regressions in which
we use each firm’s next-day raw return as the dependent variable.
Table II reports the results from six OLS regressions, two different dependent
variables (raw and abnormal next-day returns) regressed on each of three different
negative words measures (DJNS, WSJ, and “All Stories”). The table shows the
coefficients on negative words in firm-specific news stories and their associated
t-statistics. We compute clustered standard errors (Froot (1989)) to account for the
correlations between firms’ stock returns within trading days. The reasons for choosing
OLS regression estimates and standard errors clustered by time period are analogous to
those discussed in Section III and are not repeated here. Table II reports the number of
clusters—i.e., trading days—and the adjusted R2 for each regression.
[Insert Table II around here.]
The main result in Table II is that negative words in firm-specific news stories
robustly predict slightly lower returns on the following trading day. The coefficients on
negative words (neg) are consistently significant in all four of the regressions where news
stories from DJNS are included. The magnitude of the DJNS regression coefficient on
neg, which is already standardized, implies that next-day abnormal returns (FFCAR+1,+1)
are 3.20 basis points lower after each one-standard deviation increase in negative words.
Interestingly, the coefficients on negative words are less than half as large and
statistically insignificant in the two regressions where only WSJ stories are included. One
interpretation is that DJNS releases intraday stories with extremely recent information
before the information is fully priced. By contrast, many morning WSJ stories are
recapitulations of the previous day’s events—some of which appeared in the DJNS—that
may already be incorporated in market prices.

23
We now analyze the Return+1,+1 and FFCAR+1,+1 regressions that include stories
from the DJNS (in Columns 2 and 5 of Table II) in greater detail. As one would expect in
an efficient market, very few control variables predict next-day returns, which is why the
R2 statistics in Table II are so low. Aside from the daily news and returns variables, only
firms’ earnings (SUE) have predictive power at the 1% level.
One pattern in these regressions is somewhat analogous to the main result in Chan
(2003). He shows that stocks in the news experience annual return continuations, whereas
those not in the news experience annual return reversals. Although Table II examines
daily horizons, the interpretation of the day 0 (day-of-news), and day -1 and -2 (usually
not news days) returns coefficients is quite similar. The positive coefficient on FFCAR0,0
shows that news-day returns continue on the next day, whereas the negative coefficients
on FFCAR-1,-1 and FFCAR-2,-2 show that non-news-day returns reverse themselves.
We now examine the market’s apparently sluggish reaction to negative words in
the four weeks surrounding the story’s release to the public. Figure 3 graphs a firm’s
abnormal returns from 10 trading days before a story’s release to 10 trading days after its
release. Again, we use the Fama-French three-factor model to estimate abnormal returns.
We label all news stories with a fraction of negative words (Neg) in the previous year’s
top (bottom) quartile as negative (positive) stories. We separately examine the market’s
response to positive and negative DJNS and WSJ stories. We also compute the difference
between the reaction to positive and negative news stories for each source.
[Insert Figure 3 around here.]
Although Figure 3 shows that the market reacts quite efficiently to positive and
negative news, there is some delayed reaction, particularly for the DJNS news stories.
From the top line in Figure 3, one can see that the 12-day market reaction, from day -2 to
day 10, to WSJ stories is virtually complete after the first two trading days—7.5 basis

24
points (bps) of underreaction after day 1 and only 2.4 bps after day 2. By contrast, the
second line in Figure 3 shows that more of the 12-day market reaction to DJNS stories
persists beyond the first two days—16.8 bps after day 1 and 6.2 bps after day 2.
The DJNS lines in Figure 3 show the day 1 delayed reaction to positive DJNS
news stories (6.6 bps) is somewhat larger than the delayed reaction to negative stories
(4.0 bps).17
Although the total day 1 delayed reaction to DJNS news stories is 10.6 bps
(see the difference line), this magnitude is relatively small (17.2%) as a percentage of the
total 12-day reaction of roughly 61.6 bps. The market appears even more efficient in its
reaction to WSJ stories, where the one-day delayed reaction (5.2 bps) is only 7.1% of the
12-day reaction (73.3 bps). However, there may be additional underreaction to WSJ
stories within the trading day that encompasses the morning release of the newspaper.
B. Predicting Returns in Calendar Time
The lingering difference between the abnormal returns of firms with positive and
negative DJNS news stories suggests that a simple trading strategy could earn positive
risk-adjusted profits. In this section, we explore this possibility, focusing on the apparent
short-run underreaction to negative words in the DJNS.
Specifically, at the close of each trading day, we form two equal-weighted
portfolios based on the content of each firm’s DJNS news stories during the prior trading
day.18
We use the same definitions for positive and negative stories as before. We include
all firms with positive DJNS news stories from 12:00am to 3:30pm on the prior trading
day in the long portfolio, and put all firms with negative stories in the short portfolio. We
hold both the long and short portfolios for one full trading day and rebalance at the end of
the next trading day. To keep the strategy simple, we exclude the rare days in which

25
either the long or the short portfolio contains no qualifying firms. Ignoring trading costs,
the cumulative raw returns of this long-short strategy would be 21.1% per year.
Table III shows the risk-adjusted daily returns from this daily news-based trading
strategy for three different time periods (1980 to 1994, 1995 to 2004, and 1980 to 2004).
We use the Fama-French three-factor (1993) and Carhart four-factor (1997) models to
adjust the trading strategy returns for the returns of contemporaneous market, size, book-
to-market, and momentum factors. Table III reports the alpha and factor loadings from
the time series regression of the long-short news-based portfolio returns on the four
factors. The first three columns report the results with the Fama-French benchmark,
whereas the last three columns use the Carhart benchmark. We compute all coefficient
standard errors using the White (1980) heteroskedasticity-consistent covariance matrix.
[Insert Table III around here.]
Consistent with Table II, Table III shows that the daily news-based trading
strategy would earn substantial risk-adjusted returns in a frictionless world with no
trading costs or price impact. Specifically, the average excess return (Fama-French alpha)
from news-based trading would be 9.2 bps per day from 1980 to 1994 and 11.8 bps per
day from 1995 to 2004. Using any return benchmark, the alpha from the trading strategy
is highly significant in all three time periods. Interestingly, the returns from news-based
trading are not strongly related to any of the Fama-French factors or the momentum
factor.19
The very low R2 statistics show that nearly all of the trading strategy risk is firm-
specific, as one might expect because we focus on firm-specific news stories.
For the 25 years between 1980 and 2004, Figure 4 depicts the distribution of the
average daily abnormal returns for the news-based trading strategy. In the median year,
the strategy’s abnormal return is 9.4 bps per day. In 21 out of 25 years, the news-based
strategy earns positive abnormal returns. Thus, we can reject the null hypothesis that

26
yearly news-based strategy returns follow the binomial distribution with an equal
likelihood of positive and negative returns (p-value < 0.0005). There is only one year
(1980) out of 25 in which the strategy lost more than 2 bps per day (-4.2 bps). By
contrast, in six out of 25 years, the strategy gained more than 20 bps per day. This
analysis suggests that the news-based trading strategy is not susceptible to catastrophic
risks that second moments of returns may fail to capture.
[Insert Figure 4 around here.]
Finally, we estimate the impact of reasonable transaction costs on the trading
strategy’s profitability. To judge the sensitivity of profits to trading costs, we recalculate
the trading strategy returns under the assumption that a trader must incur a round-trip
transaction cost of between zero and 10 bps. Table IV displays the abnormal and raw
annualized cumulative news-based strategy returns under these cost assumptions.
[Insert Table IV around here.]
From the evidence in Table IV, we see that the simple news-based trading
strategy explored here is no longer profitable after accounting for reasonable levels of
transaction costs—e.g., 10 bps. Of course, we cannot rule out the possibility that more
sophisticated trading rules that exploit the time-series and cross-sectional properties of
news stories and economize on trading costs would be profitable. For example, the next
subsection investigates a refined measure of negative words that predicts greater market
underreactions to particular negative words.
V. Interpreting the Earnings and Return Predictability
The key stylized facts documented thus far are: 1) news stories about firms are
concentrated around their earnings announcements; 2) negative words in firm-specific

27
stories predict low firm earnings in the next quarter; and 3) negative words about firms
predict low firm stock returns on the next trading day. In this section, we explore further
whether the ability of negative words to predict returns comes from underreaction to
news about firms’ fundamentals that is embedded in language.
Our specific hypothesis is that negative words in news stories that mention the
word stem “earn” contain more information about firms’ fundamentals than other stories.
If this is the case, we should observe three effects. First, negative words in stories that
include the word stem “earn” should be better predictors of earnings. Second, the
contemporaneous relationship between negative words and returns should be stronger for
stories that contain the word stem “earn.” Third, because these stories better capture news
about hard-to-quantify fundamentals, the magnitude of the market’s underreaction to
negative words should be greater for stories that contain the word stem “earn.”20
Before testing these three predictions, we establish an intuitive property of this
measure of fundamentals: the news stories near earnings announcements (see the spike in
Figure 1) are far more likely to mention the word stem “earn”—e.g., the word “earnings”
or any form of the verb “earn.” We construct a dummy variable (Fund) that indicates
whether a news story contains any words beginning with “earn.” We find that only 18.9%
of the stories more than one day away from an earnings announcement contain the word
stem “earn,” compared to 72.5% of the stories within a day of an announcement.
We test whether negative words in stories containing the word stem “earn” predict
earnings better than negative words in other stories. We add two new independent
variables to the regressions for SUE and SAFE shown earlier in Columns 4 and 6 of Table
I. The first new variable (Fund-30,-3) is the total number of words in news stories between
day -30 and day -3 that contain the word stem “earn” divided by the total number of
words in all news stories between day -30 and day -3. This measure is designed to
28
capture the fraction of words between day -30 and day -3 that are likely to provide
relevant information about firms’ fundamentals. The second new variable (neg-30,-3*Fund-
30,-3) is the interaction between Fund-30,-3 and the negative words measure (neg-30,-3). The
coefficient on the interaction term measures the extent to which negative words “about”
fundamentals are more useful predictors of firms’ earnings than other negative words.
[Insert Table V around here.]
Table V shows that the coefficients for both of the new independent variables in
the SUE and SAFE regressions are strongly negative and statistically significant. The
coefficient on the interaction term (neg-30,-3*Fund-30,-3) in the SUE regression shows that
negative words that are “about” fundamentals are much better predictors of firms’
earnings. Because the Fund-30,-3 variable is a fraction that ranges from zero to one, the
regression coefficients have meaningful economic interpretations. The sum of the
coefficient on the interaction (neg-30,-3*Fund-30,-3) and the coefficient on negative words
alone (neg-30,-3) estimates the dependence of firm earnings on negative words for
announcements in which all (Fund-30,-3 = 1) of the news stories between day -30 and day
-3 contain the stem “earn.” The coefficient on negative words (neg-30,-3) now estimates
the dependence of firm earnings on negative words when none (Fund-30,-3 = 0) of the
news stories between day -30 and day -3 contain the stem “earn.” Also, one can recover
the direct effect of negative words in a typical set of news stories, where 26.3% of the
words are about earnings (Fund-30,-3 = 0.263), by computing (coefficient on neg-30,-3) +
0.263 * (coefficient on neg-30,-3*Fund-30,-3). This last quantity is directly comparable to
the simple coefficients on neg-30,-3 that appear in Table I.
The point estimate of the sum of the interaction term and the neg-30,-3 coefficient
(-0.3359 SUE) is over 10 times greater than the neg-30,-3 coefficient (-0.0167 SUE),
suggesting that negative words derive almost all of their predictive power for SUE from

29
earnings-related stories. Negative words in stories unrelated to earnings (see coefficients
on neg-30,-3) only weakly predict lower earnings, and are much less important in economic
terms. Yet the direct effect of negative words on earnings in a “typical” set of stories with
26.3% earnings-related words remains strongly statistically and economically significant
at -0.0167 + 0.263 * -0.3192 = -0.1006 SUE. Similarly, negative words in earnings-
related stories can predict analyst forecast errors (SAFE) better by an order of magnitude.
We now test the other two predictions of our hypothesis: contemporaneous
market reactions and subsequent market underreactions should be larger for stories that
mention the word stem “earn” than for other stories. As before, we use pooled OLS
regressions with clustered standard errors to estimate the relationship between negative
words and returns. We also use the same set of firm characteristic and stock return
control variables. To conserve space, we report only the results where we use firms’
abnormal returns as the dependent variable and negative words in firm-specific stories
from DJNS as the key independent variable. Again, we use the DJNS stories that occur
more than 30 minutes before the market closes to explore the underreaction hypothesis
because Table II reveals that there is only minimal underreaction to WSJ stories.
Column 1 in Table VI reports the contemporaneous (same-day) relationship
between abnormal returns (FFCAR+0,+0) and negative words (neg). There are two new
independent variables in these regressions: the dummy variable that is equal to one if a
story mentions the word stem “earn” (Fund) and the interaction (neg*Fund) between this
dummy variable and standardized negative words (neg).
[Insert Table VI around here.]
Column 1 in Table VI reveals that not only is there is a strong relationship
between negative words (neg) and contemporaneous returns (FFCAR+0,+0), but also that
this relationship is much stronger in stories that contain the “earn” word stem dummy.

30
The sum of the coefficient on neg by itself (-8.57 bps) and the coefficient on the
neg*Fund term (-31.27 bps) provides an estimate of the contemporaneous market
response to negative words in news stories that mention earnings (-39.84 bps). In
economic terms, the coefficient magnitudes mean that the market response to negative
words in earnings-related stories is five times larger than the response to other negative
words. This evidence supports the hypothesis that negative words convey otherwise
hard-to-quantify information about firms’ fundamentals.21
In Column 2 of Table VI, we repeat the previous regression, except we use firms’
next-day abnormal returns (FFCAR+1,+1) as the dependent variable. The main result is
that the same variables that elicit the greatest contemporaneous market responses also
predict the greatest subsequent market underreaction. For example, the coefficient on the
interaction term (neg*Fund) is highly negative (Column 2 in Table VI), showing that
negative words in earnings-related stories predict greater market underreactions than
negative words in other stories (neg). In fact, the market’s underreaction to negative
words in stories not mentioning earnings is only one-seventh as large as its underreaction
to negative words in stories about earnings (-1.61 bps vs. -11.97 bps = -1.61 – 10.36).
The estimate of underreaction to negative words in “typical” stories that mention earnings
with probability 28.0% lies between the two previous values at -4.33 bps = -1.61 bps +
0.280 * -10.36 bps, and remains highly statistically significant.
We can gauge the degree of underreaction by comparing the sizes of the one-day
and two-day reactions to negative words. Table VI allows us to make this comparison for
negative words in earnings-related stories and those in other stories. The coefficients on
neg in the first column (-8.57 bps) and second column (-1.61 bps) measure the day 0 and
day 1 reactions for negative words unrelated to earnings. The sums of the coefficients on
neg and neg*Fund in the first column (-39.84 bps) and second column (-11.97 bps)

31
measure the day 0 and day 1 reactions for earnings-related words. From this, we can infer
that the market’s initial one-day reaction to negative words comprises the vast majority of
its two-day reaction for stories unrelated (84.2%) and related (76.9%) to earnings. One
interpretation is that investors remain almost equally attuned to the importance of
linguistic information about fundamentals even during earnings announcements, when
there is compelling quantitative information.
All three tests in this section suggest that negative words in stories about firms’
fundamentals are driving the earnings and return predictability results. Although news
stories that do not mention earnings can weakly forecast earnings and are associated with
contemporaneous market returns, these stories have very little ability to forecast future
market returns. Negative words in earnings-related stories evoke much greater initial
market responses presumably because these stories are better predictors of firms’
subsequent earnings. However, the initial market responses to negative words in
earnings-related stories are insufficiently large to prevent return continuations on the next
trading day. Investors seem to distinguish between earnings-related stories and others, but
do not fully account for the importance of linguistic information about fundamentals.
VI. Conclusion
Our first main result is that negative words in the financial press forecast low firm
earnings. That is, the words contained in news stories are not redundant information, but
instead capture otherwise hard-to-quantify aspects of firms’ fundamentals. Our second
result is that stock market prices incorporate the information embedded in negative words

32
with a slight delay. We demonstrate potential profits from using a simple trading strategy
based on the words in a timely news source (DJNS), but find that these profits could
easily vanish after accounting for reasonable levels of transaction costs. Finally, we show
that negative words in stories about fundamentals are particularly useful predictors of
both earnings and returns.
Our overall impression is that the stock market is relatively efficient with respect
to firms’ hard-to-quantify fundamentals. The market’s underreaction to negative words
after day 0 is typically small as compared to the market’s initial reaction to negative
words on day 0. Even if economists have neglected the possibility of quantifying
language to measure firms’ fundamentals, stock market investors have not.
Nevertheless, we do find that market prices consistently underreact to negative
words in firm-specific news stories, especially those that relate to fundamentals.
Although frictionless asset pricing models may not be able to explain these findings,
models in which equilibrium prices induce traders to acquire costly information—e.g.,
Grossman and Stiglitz (1980)—are broadly consistent with our results. Without some
slight underreaction in market prices, traders would have no motivation to monitor and
read the daily newswires. Future research on quantifying language has the potential to
improve our understanding of how information is incorporated in asset prices.
33
Appendix
To match firms’ names in CRSP with their common names used in the media, we
employ a combination of four methods. Our first method works well for firms that are
currently members of the S&P 500 index. We download common names for these firms
from the “S&P constituents” spreadsheet posted on Standard and Poor’s Web site,
http://www.standardpoor.com/. We match these common names to CRSP name strings,
which we use in our Factiva news queries for the 473 firms in the S&P at the end of our
data period (12/31/04) that remained in the index on the date that we downloaded the
spreadsheet. We identify the common names of the other 27 S&P 500 firms at the end of
2004 using the methods described below.
The other three methods entail matching the CRSP name strings with common
firm names from one of three Web-based data sources: Mergent Online, the Securities
and Exchange Commission (SEC), or Factiva. For all companies that exist after 1993, we
use the Mergent Online company search function to identify firms’ common names (336
firms). For the few post-1993 companies without Mergent data, we use the SEC company
name search function (20 firms). Finally, we identify the common names of firms prior to
1993 using the Factiva company name search function (285 firms).
In many cases, we manually tweak the CRSP names to improve the quality of the
company search. For example, if we do a company search for the CRSP name string
“PAN AMERN WORLD AWYS INC,” Factiva returns no results. Logically, we look for
“Pan American,” which seems to retrieve the appropriate company name: “Pan American
World Airways Inc.” Although this matching process introduces the possibility of minor
judgment errors, our searches uniquely identify matching firms in all cases, suggesting
our methods are reasonable.
34
We construct search queries for news stories using the common names that we
match to the CRSP name string. We spot-check all stories that mention S&P 500 firms in
the DJNS and WSJ to ensure that our search criteria do not exclude too many stories that
are relevant for firm valuation. For all firms with fewer than 10 news stories retrieved by
our automatically constructed search queries, we manually search for common names
using the Internet and other resources.
Ultimately, our search methods retrieve at least one news story for 1,063 of 1,110
(95.8%) of the firms in the S&P 500 from 1980 to 2004. In addition, we lose another 80
of the 1,063 firms with news stories (7.5%) because these firms did not make the news
during the time in which they were in the S&P 500 between 1980 and 2004, which may
be quite brief if a firm exits the S&P index shortly after 1980. Also, Factiva’s coverage of
news stories from 1980 to 1984 appears somewhat incomplete, possibly leading to
missing news stories. Finally, after deleting all stories with fewer than three unique
positive and negative words or fewer than five total positive and negative words, we lose
another three firms, leaving us with 980 qualifying firms. The median firm has 156 news
stories, and 929 of 980 firms have at least 10 news stories.
It is possible that we retrieve no news stories for the missing 47 of the initial set
of 1,110 S&P 500 firms because of errors in our matching algorithm. Fortunately,
although the exact magnitude of our results depends on the matching methodology
employed, the sign and significance of all key coefficients does not change for the firms
that have been matched using each of the four different processes. Thus, we infer that it is
unlikely that matching errors introduce sufficient systematic errors in our tests that would
significantly change the results. Moreover, our key results depend on cross-sectional and
time-series variation in earnings and returns but not the levels of these variables, which
could be affected by survivorship bias.
35
Notes
1 In Section I, we discuss several recent studies that examine qualitative verbal
information.
2 As in Tetlock (2007), we use negative words from the General Inquirer’s Harvard-IV-4
classification dictionary to measure qualitative information. Our results are similar for
alternative measures that include positive words from this same dictionary. See Section II
for further discussion.
3 There are five negative words (alleged, abuse, worse, sternly, and antitrust) among the
29 total words in the sentence, or 17.2%, which exceeds the cutoff for the 99th
percentile
of our 1998 news story data. The tone of the sentence is representative of the entire
article, which also ranks in the top decile for 1998.
4 Microsoft’s cumulative abnormal stock returns were -42, -141, and -194 basis points for
the three trading days surrounding the news event.
5 The Harvard-IV-4 dictionary on the General Inquirer’s Web site lists each word in the
negative category: http://www.webuse.umd.edu:9090/tags/TAGNeg.html. See Riffe,
Lacy, and Fico (1998) for a survey of content analysis and its application to the media.
6 Based on our conversations with Wharton Research Data Services representatives, the
median forecast comes from the distribution that includes only the most up-to-date
forecasts from each brokerage.
7 Several studies argue that analyst earnings forecasts are too optimistic (e.g., Easterwood
and Nutt (1999)), overreact to certain pieces of information (e.g., De Bondt and Thaler

36
(1990)), and underreact to other information (e.g., Abarbanell and Bernard (1992)),
among other biases.
8 The inclusion of additional lags of the dependent variables does not change the results.
9 Controlling for alternative measures of past returns such as raw event returns and the
past calendar year’s return does not change our qualitative results.
10 If we omit the two analyst variables and include these remaining observations in our
regressions, we find very similar results.
11 Because I/B/E/S reviews and updates the accuracy and timing of analyst forecasts even
after the consensus forecast date, it is unlikely that news stories from one trading day
earlier contain information not reflected in the consensus. In addition, allowing three
trading days does not change our qualitative results.
12 If we use fixed-effects models instead, the point estimates of the key coefficients
increase and the standard errors remain similar. This robustness is comforting because
fixed-effects estimators and pooled OLS estimators for dynamic panel data models with
lagged dependent variables show opposite small sample biases (see Nickell (1981)). We
also find qualitatively similar estimates using quarterly cross-sectional Fama-MacBeth
(1973) regressions and Newey-West (1987) standard errors for the coefficients. Including
yearly time dummies in the pooled OLS regressions also does not affect our results.
13 We correct for the longer time intervals (T years) between the benchmark and
unexpected earnings using the seasonal random walk assumption that the mean of
unexpected earnings scales linearly (µT) and the volatility increases with the square root
of the time interval (σT1/2
). To mitigate any benchmarking biases, we also rescale SUE in

37
each quarter so that its unconditional mean is zero, which affects the level of the lines in
Figure 2 but has no impact on the difference between them.
14 As one would expect, the fractions of positive and negative words in news stories are
negatively correlated (-0.18, p-value < 0.001). For this reason, defining positive stories as
those with relatively few negative words also produces stories with relatively more
positive words.
15 When we include the two analyst forecast variables, we find that both revisions and
dispersion are statistically and economically insignificant predictors of returns in our
sample. The coefficients on the key variables do not change materially. Thus, we omit the
analyst variables to include any S&P 500 firms without analyst coverage and the first
four years of our sample in the regression results.
16 We also find that including time dummies for each trading day—i.e., demeaning
returns by trading day—does not change our results, suggesting an omitted common
news factor is not driving our results.
17 The contemporaneous reactions to positive news stories are also larger. We observe the
opposite asymmetry for the positive and negative news stories about fundamentals that
we examine in Section IV.
18 Forming two story-weighted or value-weighted portfolios produces very similar
results.
19 The strategy’s negative loading on HML is a minor exception, possibly driven by the
numerous positive news stories about growth firms during the late 1990s.

38
20
Pritamani and Singhal (2001) document a fact that may be related to this third
hypothesis. Although they do not examine the tone of news stories, they do find return
momentum following market reactions to earnings-related news stories.
21 The negative market responses to the presence of earnings-related words (Fund) could
represent earnings warnings from firm management prior to earnings announcements.
39
References
Abarbanell, Jeffrey S., and Victor L. Bernard, 1992, Tests of analysts’
overreaction/underreaction to earnings information as an explanation for
anomalous stock price behavior, Journal of Finance 47, 1181-1207.
Antweiler, Werner, and Murray Z. Frank, 2004, Is all that talk just noise? The
information content of internet stock message boards, Journal of Finance 59,
1259-1294.
Antweiler, Werner, and Murray Z. Frank, 2006, Do U.S. stock markets typically
overreact to corporate news stories? Working paper, University of British
Columbia.
Ball, Ray, and Philip Brown, 1968, An empirical examination of accounting numbers,
Journal of Accounting Research 6, 159-178.
Baumeister, Roy F., Ellen Bratslavsky, Catrin Finkenauer, and Kathleen D. Vohs, 2001,
Bad is stronger than good, Review of General Psychology 5, 323-370.
Bernard, Victor L. and Jacob K. Thomas, 1989, Post-earnings-announcement drift:
delayed price response or risk premium, Journal of Accounting Research 27,
1-36.
Campbell, John Y., and Robert J. Shiller, 1987, Cointegration and tests of present value
models, Journal of Political Economy 95, 1062–1088.
Carhart, Mark M., 1997, On the persistence of mutual fund performance, Journal of
Finance 52, 57-82.

40
Chan, Louis K.C., Narasimhan Jegadeesh, and Josef Lakonishok, 1996, Momentum
strategies, Journal of Finance 51, 1681-1713.
Chan, Wesley S., 2003, Stock price reaction to news and no-news: drift and reversal after
headlines,” Journal of Financial Economics 70, 223-260.
Cutler, David M., James M. Poterba, and Lawrence H. Summers, 1989, What moves
stock prices? Journal of Portfolio Management 15, 4-12.
Daniel, Kent D., Mark Grinblatt, Sheridan Titman, and Russ Wermers, 1997, Measuring
mutual fund performance with characteristic-based benchmarks, Journal of
Finance 52, 1035-1058.
Das, Sanjiv, and Mike Chen, 2006, Yahoo! for Amazon: sentiment extraction from small
talk on the web, Working paper, Santa Clara University.
Davis, Angela K., Jeremy M. Piger, and Lisa M. Sedor, 2006, Beyond the numbers: an
analysis of optimistic and pessimistic language in earnings press releases,
Working paper, Federal Reserve Bank of St. Louis.
De Bondt, Werner F.M., and Richard H. Thaler, 1990, Do security analysts overreact?
American Economic Review 80, 52-57.
Easterwood, John C., and Stacey R. Nutt, 1999, Inefficiency in analysts’ earnings
forecasts: systematic misreaction or systematic optimism? Journal of Finance 54,
1777-1797.
Fama, Eugene F., 1998, Market efficiency, long-term returns, and behavioral finance,
Journal of Financial Economics 49, 283-306.
Fama, Eugene F., and Kenneth R. French, 1992, The cross-section of expected stock
returns, Journal of Finance 47, 427-465.

41
Fama, Eugene F., and Kenneth R. French, 1993, Common risk factors in the returns of
stocks and bonds, Journal of Financial Economics 33, 3-56.
Fama, Eugene F., and James MacBeth, 1973, Risk and return: some empirical tests,
Journal of Political Economy 81, 607-636.
Froot, Kenneth A., 1989, Consistent covariance matrix estimation with cross-sectional
dependence and heteroskedasticity in financial data, Journal of Financial and
Quantitative Analysis 24, 333-355.
Grossman, Sanford J., and Joseph E. Stiglitz, 1980, On the impossibility of
informationally efficient markets, American Economic Review 70, 393-408.
Jegadeesh, Narasimhan, and Sheridan Titman, 1993, Returns to buying winners and
selling losers: implications for stock market efficiency, Journal of Finance 48,
65-91.
Li, Feng, 2006, Do stock market investors understand the risk sentiment of corporate
annual reports? Working paper, University of Michigan.
Newey, Whitney K., and Kenneth D. West, 1987, A simple positive semi-definite,
heteroskedasticity and autocorrelation consistent covariance matrix estimator,
Econometrica 55, 703-708.
Nickell, Stephen J., 1981, Biases in dynamic models with fixed effects, Econometrica 49,
1417-1426.
Petersen, Mitchell A., 2007, Estimating standard errors in finance panel data sets:
comparing approaches, Working paper, Northwestern University.
Pritamani, Mahesh, and Vijay Singal, 2001, Return predictability following large price
changes and information releases, Journal of Banking and Finance 25, 631-656.

42
Quine, Willard Van Orman, 1974, The roots of reference (Open Court Publishing
Company: La Salle, Illinois).
Riffe, Daniel, Stephen Lacy, and Frederick G. Fico, 1998, Analyzing media messages:
using quantitative content analysis in research (Lawrence Erlbaum Associates:
London).
Roll, Richard W., 1988, R-squared, Journal of Finance 43, 541-566.
Rozin, Paul, and Edward B. Royzman, 2001, Negativity bias, negativity dominance, and
contagion, Personality and Social Psychology Review 5, 296-320.
Shiller, Robert J., 1981, Do stock prices move too much to be justified by subsequent
changes in dividends? American Economic Review 71, 421-436.
Shleifer, Andrei, 1986, Do demand curves for stocks slope down? Journal of Finance 41,
579-590.
Tetlock, Paul C., 2007, Giving content to investor sentiment: the role of media in the
stock market, Journal of Finance 62, 1139-1168.
White, Halbert, 1980, A heteroskedasticity-consistent covariance matrix and a direct test
for heteroskedasticity, Econometrica 48, 817-838.
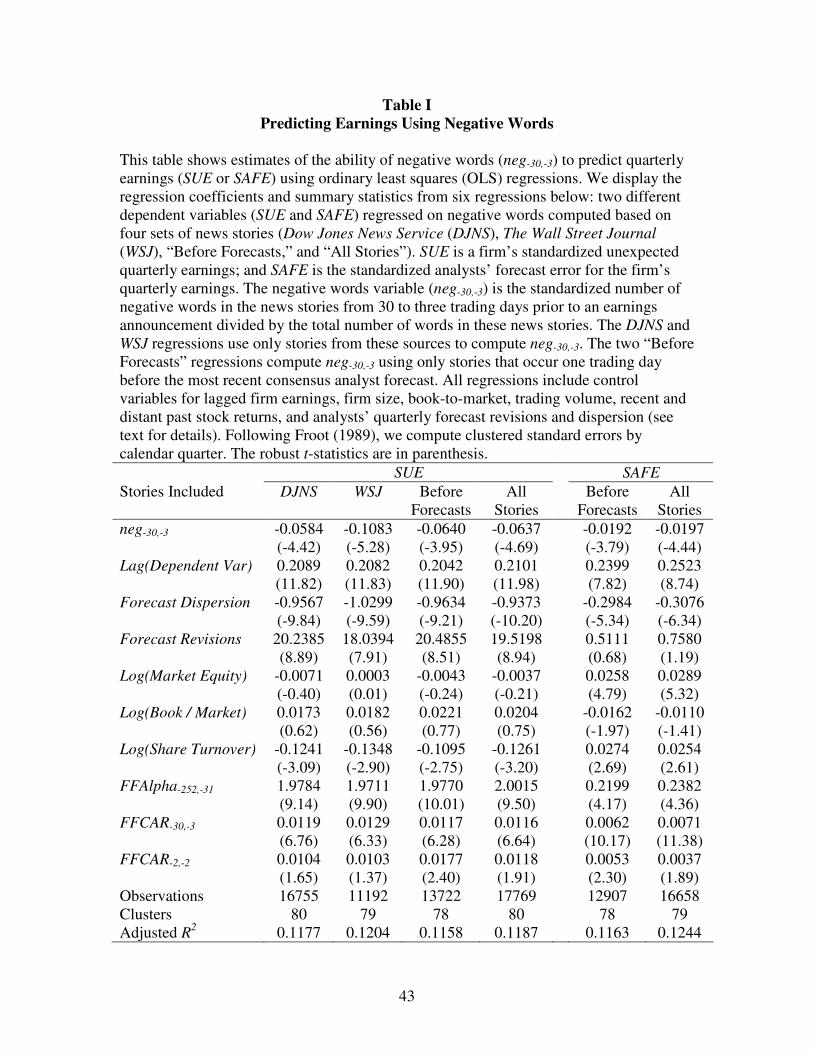
43
Table I
Predicting Earnings Using Negative Words
This table shows estimates of the ability of negative words (neg-30,-3) to predict quarterly
earnings (SUE or SAFE) using ordinary least squares (OLS) regressions. We display the
regression coefficients and summary statistics from six regressions below: two different
dependent variables (SUE and SAFE) regressed on negative words computed based on
four sets of news stories (Dow Jones News Service (DJNS), The Wall Street Journal
(WSJ), “Before Forecasts,” and “All Stories”). SUE is a firm’s standardized unexpected
quarterly earnings; and SAFE is the standardized analysts’ forecast error for the firm’s
quarterly earnings. The negative words variable (neg-30,-3) is the standardized number of
negative words in the news stories from 30 to three trading days prior to an earnings
announcement divided by the total number of words in these news stories. The DJNS and
WSJ regressions use only stories from these sources to compute neg-30,-3. The two “Before
Forecasts” regressions compute neg-30,-3 using only stories that occur one trading day
before the most recent consensus analyst forecast. All regressions include control
variables for lagged firm earnings, firm size, book-to-market, trading volume, recent and
distant past stock returns, and analysts’ quarterly forecast revisions and dispersion (see
text for details). Following Froot (1989), we compute clustered standard errors by
calendar quarter. The robust t-statistics are in parenthesis.
SUE SAFE
Stories Included DJNS WSJ Before
Forecasts
All
Stories
Before
Forecasts
All
Stories
neg-30,-3 -0.0584 -0.1083 -0.0640 -0.0637 -0.0192 -0.0197
(-4.42) (-5.28) (-3.95) (-4.69) (-3.79) (-4.44)
Lag(Dependent Var) 0.2089 0.2082 0.2042 0.2101 0.2399 0.2523
(11.82) (11.83) (11.90) (11.98) (7.82) (8.74)
Forecast Dispersion -0.9567 -1.0299 -0.9634 -0.9373 -0.2984 -0.3076
(-9.84) (-9.59) (-9.21) (-10.20) (-5.34) (-6.34)
Forecast Revisions 20.2385 18.0394 20.4855 19.5198 0.5111 0.7580
(8.89) (7.91) (8.51) (8.94) (0.68) (1.19)
Log(Market Equity) -0.0071 0.0003 -0.0043 -0.0037 0.0258 0.0289
(-0.40) (0.01) (-0.24) (-0.21) (4.79) (5.32)
Log(Book / Market) 0.0173 0.0182 0.0221 0.0204 -0.0162 -0.0110
(0.62) (0.56) (0.77) (0.75) (-1.97) (-1.41)
Log(Share Turnover) -0.1241 -0.1348 -0.1095 -0.1261 0.0274 0.0254
(-3.09) (-2.90) (-2.75) (-3.20) (2.69) (2.61)
FFAlpha-252,-31 1.9784 1.9711 1.9770 2.0015 0.2199 0.2382
(9.14) (9.90) (10.01) (9.50) (4.17) (4.36)
FFCAR-30,-3 0.0119 0.0129 0.0117 0.0116 0.0062 0.0071
(6.76) (6.33) (6.28) (6.64) (10.17) (11.38)
FFCAR-2,-2 0.0104 0.0103 0.0177 0.0118 0.0053 0.0037
(1.65) (1.37) (2.40) (1.91) (2.30) (1.89)
Observations 16755 11192 13722 17769 12907 16658
Clusters 80 79 78 80 78 79
Adjusted R2
0.1177 0.1204 0.1158 0.1187 0.1163 0.1244

44
Table II
Predicting Returns Using Negative Words
This table shows the relationship between standardized fractions of negative words (neg)
in firm-specific news stories and firms’ stock returns on the following day (Return+1,+1 or
FFCAR+1,+1). The coefficients on neg-30,-3 and summary statistics from six regressions are
displayed below: two different dependent variables (Return+1,+1 and FFCAR+1,+1)
regressed on negative words from each of three sets of news stories (Dow Jones News
Service, The Wall Street Journal, and all stories). We exclude stories that occur after
3:30pm (30 minutes prior to market closing). We assume that WSJ stories printed in the
morning’s WSJ are available to traders before the market close on the same day. The two
dependent variables are the firm’s raw close-to-close return (Return+1,+1) and the firm’s
abnormal return (FFCAR+1,+1). We use the Fama-French three-factor model with a [-
252,-31] trading day estimation period relative to the release of the news story as the
benchmark for expected returns. The key independent variable is neg, the fraction of
negative words in each news story standardized using the prior year’s distribution. Each
regression also includes control variables for the firm’s most recent earnings
announcement (SUE), market equity, book-to-market equity, trading volume, and close-
to-close returns on the day of the news story, each of the previous two trading days, and
the previous calendar year. Following Froot (1989), we compute clustered standard errors
by trading day. The robust t-statistics are in parentheses.
Return+1,+1 FFCAR+1,+1
Stories Included DJNS WSJ All DJNS WSJ All
neg -0.0277 -0.0105 -0.0221 -0.0320 -0.0102 -0.0253
(-3.67) (-1.24) (-3.72) (-4.83) (-1.37) (-4.88)
FFCAR0,0 0.0285 0.0229 0.0246 0.0259 0.0224 0.0226
(5.28) (2.92) (5.43) (5.00) (2.94) (5.19)
FFCAR-1,-1 -0.0272 -0.0154 -0.0222 -0.0254 -0.0106 -0.0190
(-3.63) (-2.17) (-4.21) (-3.86) (-1.68) (-4.13)
FFCAR-2,-2 -0.0215 -0.0094 -0.0179 -0.0207 -0.0104 -0.0183
(-3.16) (-1.10) (-3.39) (-3.10) (-1.22) (-3.60)
FFCAR-30,-3 -0.0005 0.0016 -0.0002 0.0004 0.0018 0.0005
(-0.30) (0.73) (-0.13) (0.28) (0.85) (0.38)
FFAlpha-252,-31 0.0559 0.1470 0.1046 0.1201 0.1686 0.1465
(0.57) (1.29) (1.27) (1.36) (1.67) (2.02)
Earnings (SUE) 0.0160 0.0082 0.0125 0.0152 0.0055 0.0115
(2.84) (1.33) (2.68) (3.46) (1.09) (3.25)
Log(Market Equity) -0.0152 -0.0159 -0.0154 -0.0120 -0.0121 -0.0109
(-2.02) (-1.99) (-2.39) (-2.19) (-1.97) (-2.51)
Log(Book / Market) -0.0027 0.0087 -0.0010 -0.0246 -0.0061 -0.0201
(-0.18) (0.60) (-0.08) (-2.12) (-0.52) (-2.22)
Log(Share Turnover) -0.0324 -0.0278 -0.0300 -0.0189 -0.0167 -0.0145
(-1.66) (-1.43) (-1.76) (-1.35) (-1.16) (-1.27)
Observations 141541 84019 208898 141541 84019 208898
Clusters (Days) 6260 6229 6272 6260 6229 6272
Adjusted R2 0.0024 0.0014 0.0018 0.0026 0.0014 0.0019

45
Table III
Risk-Adjusted News-Based Trading Strategy Returns
This table shows the daily risk-adjusted returns (Alpha) from a news-based trading
strategy for three different time periods (1980 to 1994, 1995 to 2004, and 1980 to 2004).
The first three regressions use the Fama-French (1993) three-factor model to adjust the
trading strategy returns for the impact of contemporaneous market (Market), size (SMB),
and book-to-market (HML) factors. The last three regressions use the Carhart (1997)
four-factor model to account for incremental impact of the momentum factor (UMD).
Table III reports the alpha and loadings from the time-series regression of the long-short
news-based portfolio returns on each of the four factors. We assemble the portfolio for
the trading strategy at the close of each trading day. We form two equal-weighted
portfolios based on the content of each firm’s Dow Jones News Service stories during the
prior trading day. We label all news stories with a fraction of negative words in the
previous year’s top (bottom) quartile as negative (positive) stories. We include all firms
with positive news stories in the long portfolio and all firms with negative news stories in
the short portfolio. We hold both the long and short portfolios for one full trading day and
rebalance at the end of the next trading day. We exclude the rare days in which there are
no qualifying firms in either the long or the short portfolio. We compute all coefficient
standard errors using the White (1980) heteroskedasticity-consistent covariance matrix.
The robust t-statistics are in parentheses.
1980-
1994
1995-
2004
1980-
2004
1980-
1994
1995-
2004
1980-
2004
Alpha 0.0919 0.1175 0.1031 0.0952 0.1131 0.1013
(2.83) (3.93) (4.55) (2.81) (3.78) (4.38)
Market -0.0994 -0.1087 -0.0983 -0.0831 -0.1001 -0.0999
(-0.93) (-1.99) (-1.86) (-0.75) (-1.87) (-1.87)
SMB -0.0767 0.0475 -0.0081 -0.0647 0.0341 -0.0128
(-0.35) (0.70) (-0.08) (-0.29) (0.49) (-0.12)
HML -0.1869 -0.2590 -0.2372 -0.1819 -0.2500 -0.2365
(-1.24) (-2.81) (-2.94) (-1.20) (-2.75) (-2.93)
UMD -0.0911 0.0930 0.0444
(-0.74) (2.01) (0.90)
Trading Days 3398 2497 5895 3398 2497 5895
Adjusted R2 0.0003 0.0081 0.0026 0.0004 0.0106 0.0027

46
Table IV
Sensitivity of News-Based Trading Returns to Trading Cost Assumptions
This table shows estimates of the impact of transaction costs on the news-based trading
strategy’s profitability (see the text or Table III for strategy details). We recalculate the
trading strategy returns for 11 alternative assumptions about a trader’s round-trip
transaction costs: 0, 1, 2, 3 … or 10 basis points (bps) per round-trip trade. The abnormal
and raw annualized cumulative news-based strategy returns for each assumption appear
below. The risk-adjustment is based on the full-sample Fama-French three-factor
loadings of the news-based portfolio shown in Table III.
Trading Costs
(bps)
Abnormal Annualized
Returns (%)
Raw Annualized
Returns (%)
0 23.17 21.07
1 20.30 18.25
2 17.50 15.49
3 14.76 12.80
4 12.09 10.17
5 9.47 7.60
6 6.92 5.09
7 4.43 2.64
8 1.99 0.25
9 -0.39 -2.09
10 -2.71 -4.37

47
Table V
Predicting Earnings Using Negative Words about Fundamentals
This table reports the results from two OLS regressions with different dependent
variables (SUE and SAFE) regressed on negative words (neg-30,-3), fundamental words
(Fund-30,-3), and the interaction between these words (neg-30,-3*Fund-30,-3). SUE is a firm’s
standardized unexpected quarterly earnings; SAFE is the standardized analysts’ forecast
error for the firm’s quarterly earnings. Both regressions include all news stories from
both news sources (Dow Jones News Service and The Wall Street Journal) over the time
period from 1984 through 2004. The measure of negative words (neg-30,-3) is the
standardized fraction of words that are negative in the news stories from 30 trading days
prior up to three trading days prior to an earnings announcement. Fundamental words
(Fund-30,-3) is the fraction of words that are contained in news stories that mention the
word stem “earn” from 30 trading days prior up to three trading days prior to an earnings
announcement. All regressions include control variables for lagged firm earnings and
numerous firm characteristics (see text for details). To allow for correlations among
announced firm earnings within the same calendar quarter, we compute clustered
standard errors (Froot (1989)). The robust t-statistics are in parentheses.
SUE SAFE
neg-30,-3 -0.0167 -0.0072
(-1.19) (-1.65)
neg-30,-3*Fund-30,-3 -0.3192 -0.0824
(-8.00) (-5.48)
Fund-30,-3 -0.4676 -0.1033
(-7.27) (-5.59)
Lag(Dependent Var) 0.2080 0.2517
(12.22) (8.69)
Forecast Dispersion -0.9280 -0.3049
(-10.32) (-6.35)
Forecast Revisions 19.1856 0.7068
(9.06) (1.11)
Log(Market Equity) -0.0062 0.0285
(-0.36) (5.31)
Log(Book / Market) 0.0126 -0.0127
(0.48) (-1.60)
Log(Share Turnover) -0.1086 0.0299
(-2.89) (3.08)
FFAlpha-252,-31 1.9760 0.2317
(9.59) (4.30)
FFCAR-30,-3 0.0102 0.0067
(5.74) (11.20)
FFCAR-2,-2 0.0110 0.0036
(1.81) (1.87)
Observations 17769 16658
Clusters 80 79
Adjusted R2 0.1282 0.1285
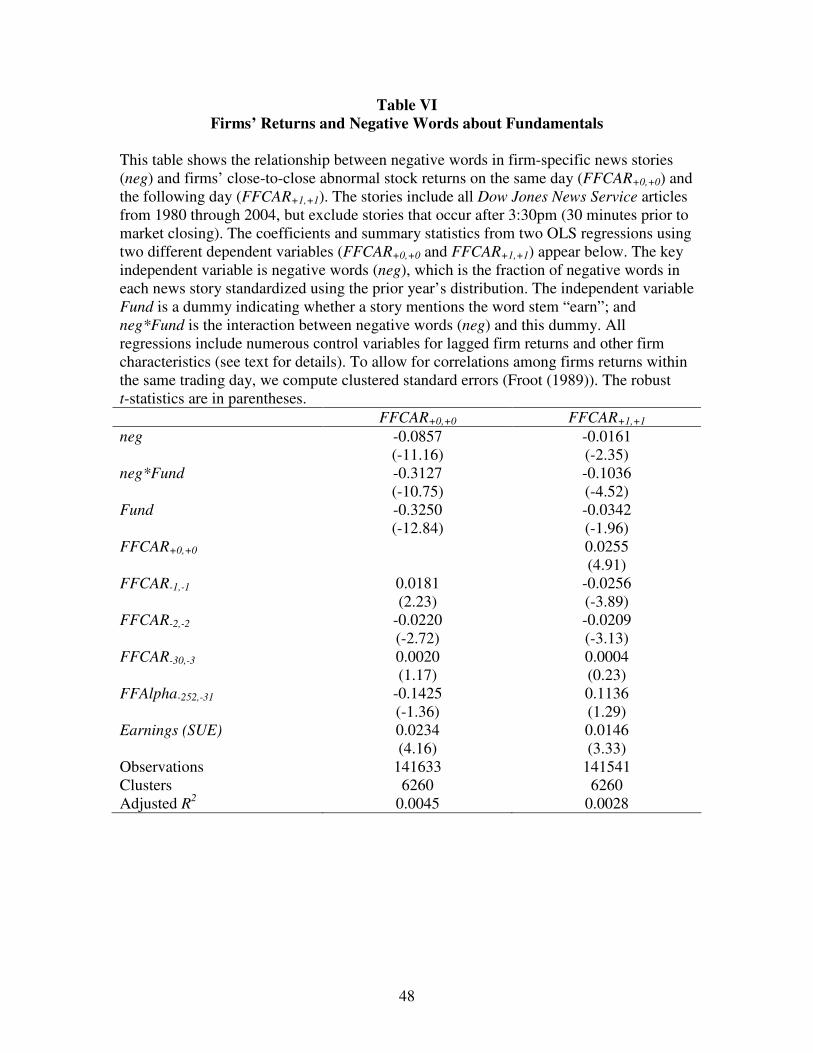
48
Table VI
Firms’ Returns and Negative Words about Fundamentals
This table shows the relationship between negative words in firm-specific news stories
(neg) and firms’ close-to-close abnormal stock returns on the same day (FFCAR+0,+0) and
the following day (FFCAR+1,+1). The stories include all Dow Jones News Service articles
from 1980 through 2004, but exclude stories that occur after 3:30pm (30 minutes prior to
market closing). The coefficients and summary statistics from two OLS regressions using
two different dependent variables (FFCAR+0,+0 and FFCAR+1,+1) appear below. The key
independent variable is negative words (neg), which is the fraction of negative words in
each news story standardized using the prior year’s distribution. The independent variable
Fund is a dummy indicating whether a story mentions the word stem “earn”; and
neg*Fund is the interaction between negative words (neg) and this dummy. All
regressions include numerous control variables for lagged firm returns and other firm
characteristics (see text for details). To allow for correlations among firms returns within
the same trading day, we compute clustered standard errors (Froot (1989)). The robust
t-statistics are in parentheses.
FFCAR+0,+0 FFCAR+1,+1
neg -0.0857 -0.0161
(-11.16) (-2.35)
neg*Fund -0.3127 -0.1036
(-10.75) (-4.52)
Fund -0.3250 -0.0342
(-12.84) (-1.96)
FFCAR+0,+0 0.0255
(4.91)
FFCAR-1,-1 0.0181 -0.0256
(2.23) (-3.89)
FFCAR-2,-2 -0.0220 -0.0209
(-2.72) (-3.13)
FFCAR-30,-3 0.0020 0.0004
(1.17) (0.23)
FFAlpha-252,-31 -0.1425 0.1136
(-1.36) (1.29)
Earnings (SUE) 0.0234 0.0146
(4.16) (3.33)
Observations 141633 141541
Clusters 6260 6260
Adjusted R2 0.0045 0.0028

49
Figure 1. Media coverage around earnings announcements. This figure depicts the
relationship between the number of firm-specific news stories and the number of days
away from a firm’s earnings announcement. All stories included in the figure are about
S&P 500 firms, appear in either Dow Jones News Service or The Wall Street Journal
from 1980 through 2004, and meet basic minimum word requirements (see text for
details). For each news story, we calculate the number of days until the firm’s next
earnings announcement and the number of days that have passed since the firm’s last
earnings announcement. We plot a histogram of both variables back-to-back in Figure 1.
Thus, each story is counted twice in Figure 1, once before and once after the nearest
announcement, except the stories occurring on the earnings announcement day.

50
Figure 2. Firms’ fundamentals around positive and negative news stories. In this
figure, we graph firms’ cumulative standardized unexpected earnings (SUE) from 10
fiscal quarters preceding media coverage of an earnings announcement to 10 quarters
after the media coverage. We define media coverage of the announcement as positive
(negative) when it contains a fraction of negative words (Neg-30,-3) in the previous year’s
top (bottom) quartile. The measure of negative words (Neg-30,-3) is the fraction of words
that are negative in the news stories from 30 trading days prior up to three trading days
prior to an earnings announcement. We separately analyze the firms with positive and
negative media coverage prior to their earnings announcements. We compute the
cumulative SUE for both sets of firms, beginning 10 quarters prior to the news and
ending 10 quarters after the news. To compute SUE values after the news stories, we use
only unexpected earnings benchmarks known at the time of the news—i.e., those based
on earnings prior to quarter zero (see text for details).
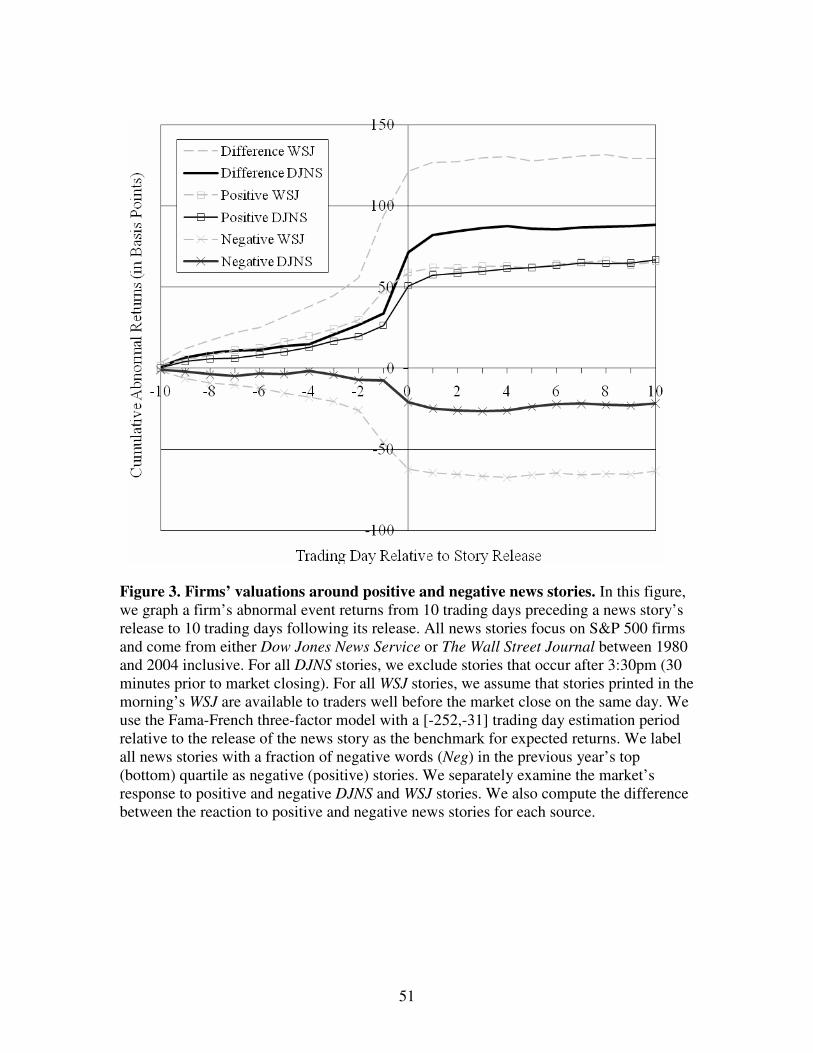
51
Figure 3. Firms’ valuations around positive and negative news stories. In this figure,
we graph a firm’s abnormal event returns from 10 trading days preceding a news story’s
release to 10 trading days following its release. All news stories focus on S&P 500 firms
and come from either Dow Jones News Service or The Wall Street Journal between 1980
and 2004 inclusive. For all DJNS stories, we exclude stories that occur after 3:30pm (30
minutes prior to market closing). For all WSJ stories, we assume that stories printed in the
morning’s WSJ are available to traders well before the market close on the same day. We
use the Fama-French three-factor model with a [-252,-31] trading day estimation period
relative to the release of the news story as the benchmark for expected returns. We label
all news stories with a fraction of negative words (Neg) in the previous year’s top
(bottom) quartile as negative (positive) stories. We separately examine the market’s
response to positive and negative DJNS and WSJ stories. We also compute the difference
between the reaction to positive and negative news stories for each source.

52
Figure 4. Distribution of daily abnormal returns for the news-based trading
strategy. For the 25 years from 1980 to 2004, the figure depicts the distribution of the
average daily abnormal returns for the news-based trading strategy described below. Each
frequency bin encompasses a 5% range of abnormal returns described by the two
numbers adjacent to the bin—e.g., the frequency of the leftmost return bin (four years) is
the number of years in which the trading strategy’s average daily return is between -5
basis points and zero basis points. We assemble the portfolio for the news-based trading
strategy at the close of each trading day. We form two equal-weighted portfolios based
on the content of each firm’s Dow Jones News Service stories during the prior trading
day. We label all news stories with a fraction of negative words in the previous year’s top
(bottom) quartile as negative (positive) stories. We include all firms with positive news
stories in the long portfolio and all firms with negative news stories in the short portfolio.
We hold both the long and short portfolios for one full trading day and rebalance at the
end of the next trading day. We exclude the rare days in which either the long or the short
portfolio contains no qualifying firms. To adjust the returns for risk, we use the full-
sample estimates of the Fama-French three-factor loadings of the news-based portfolio
displayed in Table III.