Embed Size (px)
Citation preview

8/6/2019 Monthly Report Dec 2010
http://slidepdf.com/reader/full/monthly-report-dec-2010 1/10
REPÚBLICA DEMOCRÁTICA DE TIMOR‐LESTE
Ministério das Finanças DIRECÇÃO‐GERAL DE ANÁLISE E PESQUISA
DIRECÇÃO NACIONAL DE ESTATÍSTICA EXTERNAL TRADE STATISTICS
DECEMBER 2010
www.dne.mof.gov.tl
Direcção Nacional de Estatistica Telefone:+(670)3339527 Rua de Caicoli Apartado 10/PO.BOX 10 Dili,Timor‐Leste
Email:[email protected]

8/6/2019 Monthly Report Dec 2010
http://slidepdf.com/reader/full/monthly-report-dec-2010 2/10
Summary of Key Data
For the Period: December 01, 2010 to December 31, 2010
REPÚBLICA DEMOCRÁTICA DE TIMOR-LESTEMINISTÉRIO DAS FINANÇASDIRECÇÃO-GERAL DE ANÁLISE E PESQUIZADIRECÇÃO NACIONAL DE ESTATISTICA
Merchandise Trade Statistics Timor-Leste
Merchandise Imports excludes values for goods imported for use by foreign Embassies andHigh Commissions, goods imported for the provision of foreign forces and goods imported byUNMIT. Imports of goods by these organisations are deemed to be "Non MerchandiseImports".
Merchandise Imports
Non Merchandise Imports
Total Imports
$29,815,555
$665,404
$30,480,959
Exports
Re Exports
Total Exports
$1,417,249
$1,971,131
$3,388,380
NOTE:
Exports are goods comprising at least 50 percent Timor-Leste content by value.
Re Exports are goods for export that were previously imported into Timor-Leste and compriseless than 50 percent Timor-Leste content by value.
Friday, February 11, 2011

8/6/2019 Monthly Report Dec 2010
http://slidepdf.com/reader/full/monthly-report-dec-2010 3/10
Exports of CoffeeFor the Period: December 01, 2010 to December 31, 2010
REPÚBLICA DEMOCRÁTICA DE TIMOR-LESTEMINISTÉRIO DAS FINANÇASDIRECÇÃO-GERAL DE ANÁLISE E PESQUIZADIRECÇÃO NACIONAL DE ESTATISTICA
Country of Destination Quantity (Kg) Value ($US)
Germany 480,000 576,960
Portugal 74,400 195,120
Japan 35,370 174,618
Australia 57,600 170,796
Singapore 38,400 129,024
Belgium 49,500 89,100
United States of America 18,000 63,861
Korea Republic of 6,960 16,200
Totals 760,230 $1,415,679
NOTE: This report aggregates values for exports of coffee in various forms - green beans, roasted beans andground coffee.
Friday, February 11, 2011 Page 1 of 1

8/6/2019 Monthly Report Dec 2010
http://slidepdf.com/reader/full/monthly-report-dec-2010 4/10
Exports by Country of Destination.For the Period: December 01, 2010 to December 31, 2010
REPÚBLICA DEMOCRÁTICA DE TIMOR-LESTEMINISTÉRIO DAS FINANÇASDIRECÇÃO-GERAL DE ANÁLISE E PESQUIZADIRECÇÃO NACIONAL DE ESTATISTICA
Country of Destination Value ($000)
Germany 577
Portugal 195
Japan 175
Australia 171
Singapore 129
Belgium 89
United States of America 64
Korea Republic of 16
Swaziland 2
$1,417Exports
Re Exports
Total Exports
$1,971
$3,388
NOTE: Due to the effects of rounding individual values may not add to totals.
Friday, February 11, 2011 Page 1 of 1
8/6/2019 Monthly Report Dec 2010
http://slidepdf.com/reader/full/monthly-report-dec-2010 5/10
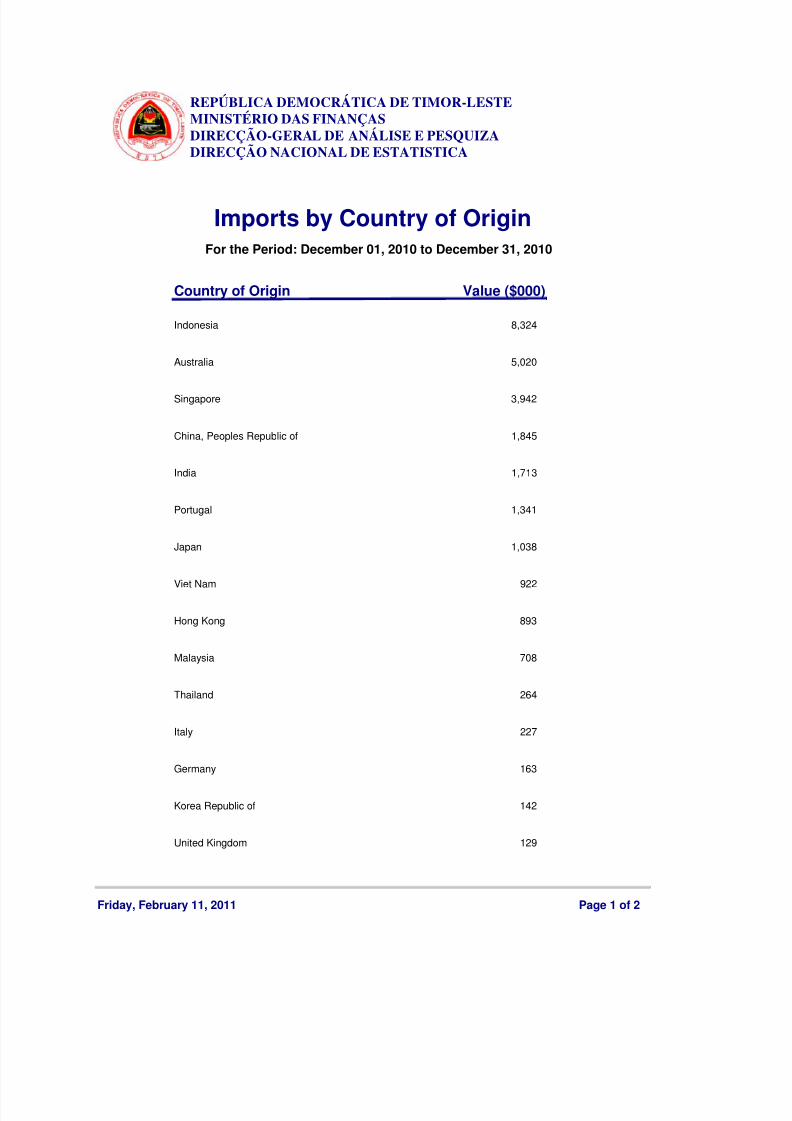
Imports by Country of OriginFor the Period: December 01, 2010 to December 31, 2010
REPÚBLICA DEMOCRÁTICA DE TIMOR-LESTEMINISTÉRIO DAS FINANÇASDIRECÇÃO-GERAL DE ANÁLISE E PESQUIZADIRECÇÃO NACIONAL DE ESTATISTICA
Country of Origin Value ($000)
Indonesia 8,324
Australia 5,020
Singapore 3,942
China, Peoples Republic of 1,845
India 1,713
Portugal 1,341
Japan 1,038
Viet Nam 922
Hong Kong 893
Malaysia 708
Thailand 264
Italy 227
Germany 163
Korea Republic of 142
United Kingdom 129
Friday, February 11, 2011 Page 1 of 2

8/6/2019 Monthly Report Dec 2010
http://slidepdf.com/reader/full/monthly-report-dec-2010 6/10
Country of Origin Value ($000)
Brunei Darussalam 87
Denmark 61
New Zealand 56
Philippines 46
Qatar 17
Belgium 10
Canada 10
Macau 7
United States of America 5
Turkey 4
South Africa 4
Taiwan 2
Merchandise Imports*
Non Merchandise Imports
Total Imports
$26,980
$665
$30,481
NOTE: * Excludes values for goods imported for use by foreign Embassies and High Commissions, goodsimported for the provision of foreign forces and goods imported by UNMIT. Imports of goods by theseorganisations are deemed to be "Non Merchandise Imports".
Due to the effects of rounding individual values may not add to totals.
Friday, February 11, 2011 Page 2 of 2
8/6/2019 Monthly Report Dec 2010
http://slidepdf.com/reader/full/monthly-report-dec-2010 7/10
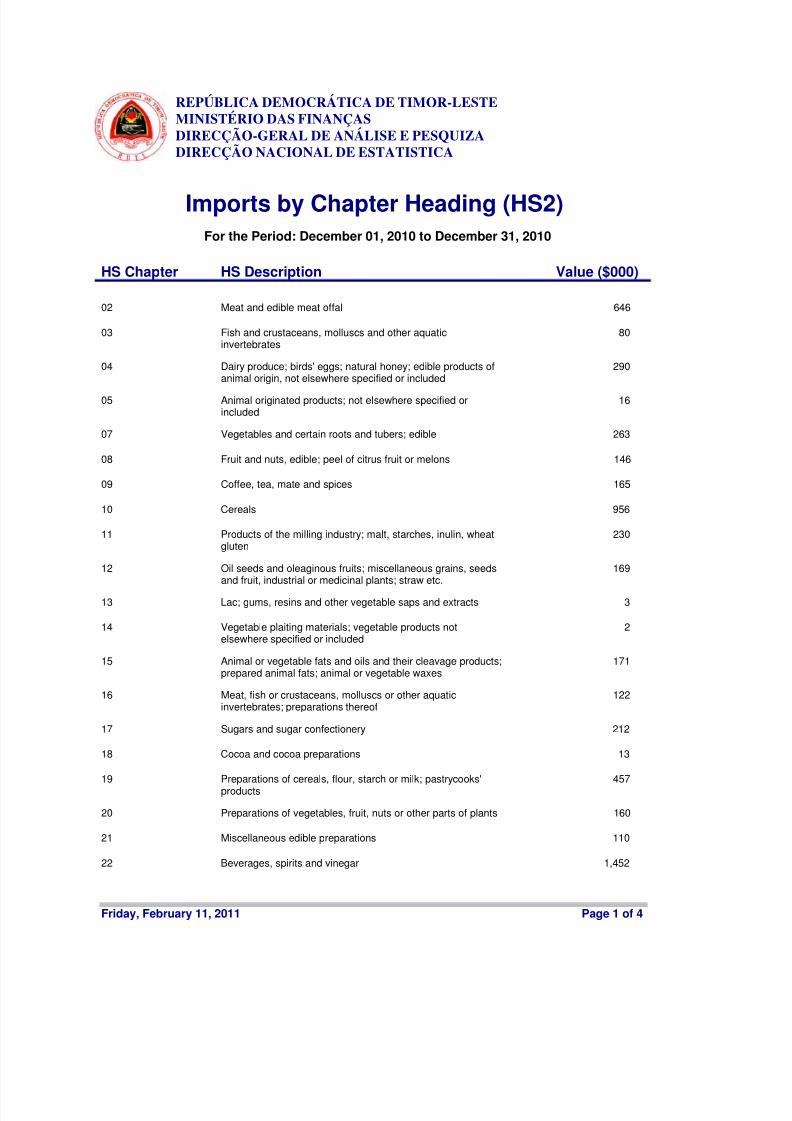
Imports by Chapter Heading (HS2)
REPÚBLICA DEMOCRÁTICA DE TIMOR-LESTEMINISTÉRIO DAS FINANÇASDIRECÇÃO-GERAL DE ANÁLISE E PESQUIZADIRECÇÃO NACIONAL DE ESTATISTICA
For the Period: December 01, 2010 to December 31, 2010
HS Chapter HS Description Value ($000)
02 Meat and edible meat offal 646
03 Fish and crustaceans, molluscs and other aquaticinvertebrates
80
04 Dairy produce; birds' eggs; natural honey; edible products ofanimal origin, not elsewhere specified or included
290
05 Animal originated products; not elsewhere specified orincluded
16
07 Vegetables and certain roots and tubers; edible 263
08 Fruit and nuts, edible; peel of citrus fruit or melons 146
09 Coffee, tea, mate and spices 165
10 Cereals 956
11 Products of the milling industry; malt, starches, inulin, wheatgluten
230
12 Oil seeds and oleaginous fruits; miscellaneous grains, seedsand fruit, industrial or medicinal plants; straw etc.
169
13 Lac; gums, resins and other vegetable saps and extracts 3
14 Vegetable plaiting materials; vegetable products notelsewhere specified or included
2
15 Animal or vegetable fats and oils and their cleavage products;prepared animal fats; animal or vegetable waxes
171
16 Meat, fish or crustaceans, molluscs or other aquaticinvertebrates; preparations thereof
122
17 Sugars and sugar confectionery 212
18 Cocoa and cocoa preparations 13
19 Preparations of cereals, flour, starch or milk; pastrycooks'products
457
20 Preparations of vegetables, fruit, nuts or other parts of plants 160
21 Miscellaneous edible preparations 110
22 Beverages, spirits and vinegar 1,452
Friday, February 11, 2011 Page 1 of 4

8/6/2019 Monthly Report Dec 2010
http://slidepdf.com/reader/full/monthly-report-dec-2010 8/10
HS Chapter HS Description Value ($000)
23 Food industries, residues and wastes thereof; preparedanimal fodder
28
24 Tobacco and manufactured tobacco substitutes 284
25 Salt; sulphur; earths, stone; plastering materials, lime andcement
793
26 Ores, slag and ash 11
27 Mineral fuels, mineral oils and products of their distillation;bituminous substances; mineral waxes
3,064
28 Inorganic chemicals; organic and inorganic compounds ofprecious metals; of rare earth metals
70
29 Organic chemicals 162
30 Pharmaceutical products 176
31 Fertilizers 101
32 Tanning or dyeing extracts; tannins and their derivatives;dyes, pigments and other colouring matter; paints etc.
75
33 Essential oils and resinoids; perfumery, cosmetic or toiletpreparations
89
34 Soap, organic surface-active agents; washing, lubricating,polishing or scouring preparations
425
35 Albuminoidal substances; modified starches; glues; enzymes 25
36 Explosives; pyrotechnic products; matches; pyrophoric alloys;certain combustible preparations
6
37 Photographic or cinematographic goods 7
38 Chemical products n.e.s. 956
39 Plastics and articles thereof 380
40 Rubber and articles thereof 412
41 Raw hides and skins (other than furskins) and leather 8
42 Articles of leather; saddlery and harness; travel goods,handbags and similar containers; articles of animal gut
16
43 Furskins and artificial fur; manufactures thereof 105
44 Wood and articles of wood; wood charcoal 375
45 Cork and articles of cork 19
48 Paper and paperboard; articles of paper pulp, of paper orpaperboard
179
49 Printed books, newspapers, pictures and other products ofthe printing industry; manuscripts etc.
27
50 Silk 11
Friday, February 11, 2011 Page 2 of 4
8/6/2019 Monthly Report Dec 2010
http://slidepdf.com/reader/full/monthly-report-dec-2010 9/10
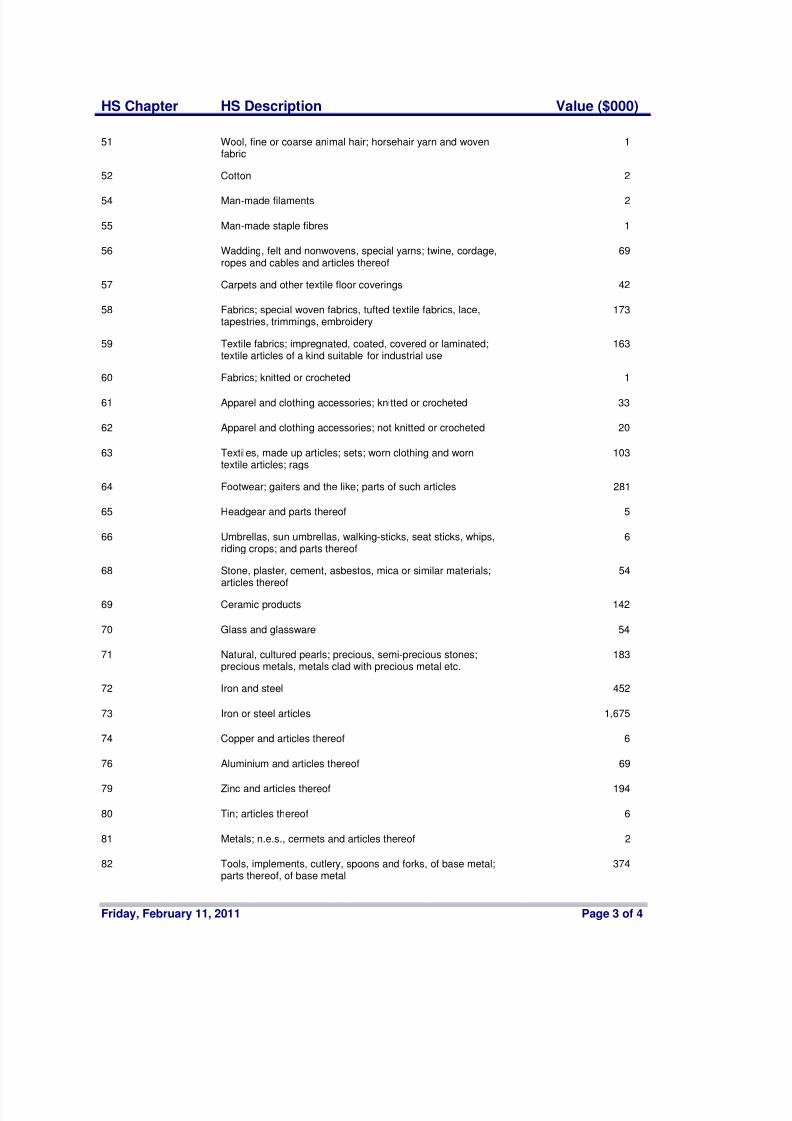
HS Chapter HS Description Value ($000)
51 Wool, fine or coarse animal hair; horsehair yarn and wovenfabric
1
52 Cotton 2
54 Man-made filaments 2
55 Man-made staple fibres 1
56 Wadding, felt and nonwovens, special yarns; twine, cordage,ropes and cables and articles thereof
69
57 Carpets and other textile floor coverings 42
58 Fabrics; special woven fabrics, tufted textile fabrics, lace,tapestries, trimmings, embroidery
173
59 Textile fabrics; impregnated, coated, covered or laminated;textile articles of a kind suitable for industrial use
163
60 Fabrics; knitted or crocheted 1
61 Apparel and clothing accessories; knitted or crocheted 33
62 Apparel and clothing accessories; not knitted or crocheted 20
63 Textiles, made up articles; sets; worn clothing and worntextile articles; rags
103
64 Footwear; gaiters and the like; parts of such articles 281
65 Headgear and parts thereof 5
66 Umbrellas, sun umbrellas, walking-sticks, seat sticks, whips,riding crops; and parts thereof
6
68 Stone, plaster, cement, asbestos, mica or similar materials;articles thereof
54
69 Ceramic products 142
70 Glass and glassware 54
71 Natural, cultured pearls; precious, semi-precious stones;precious metals, metals clad with precious metal etc.
183
72 Iron and steel 452
73 Iron or steel articles 1,675
74 Copper and articles thereof 6
76 Aluminium and articles thereof 69
79 Zinc and articles thereof 194
80 Tin; articles thereof 6
81 Metals; n.e.s., cermets and articles thereof 2
82 Tools, implements, cutlery, spoons and forks, of base metal;parts thereof, of base metal
374
Friday, February 11, 2011 Page 3 of 4
8/6/2019 Monthly Report Dec 2010
http://slidepdf.com/reader/full/monthly-report-dec-2010 10/10
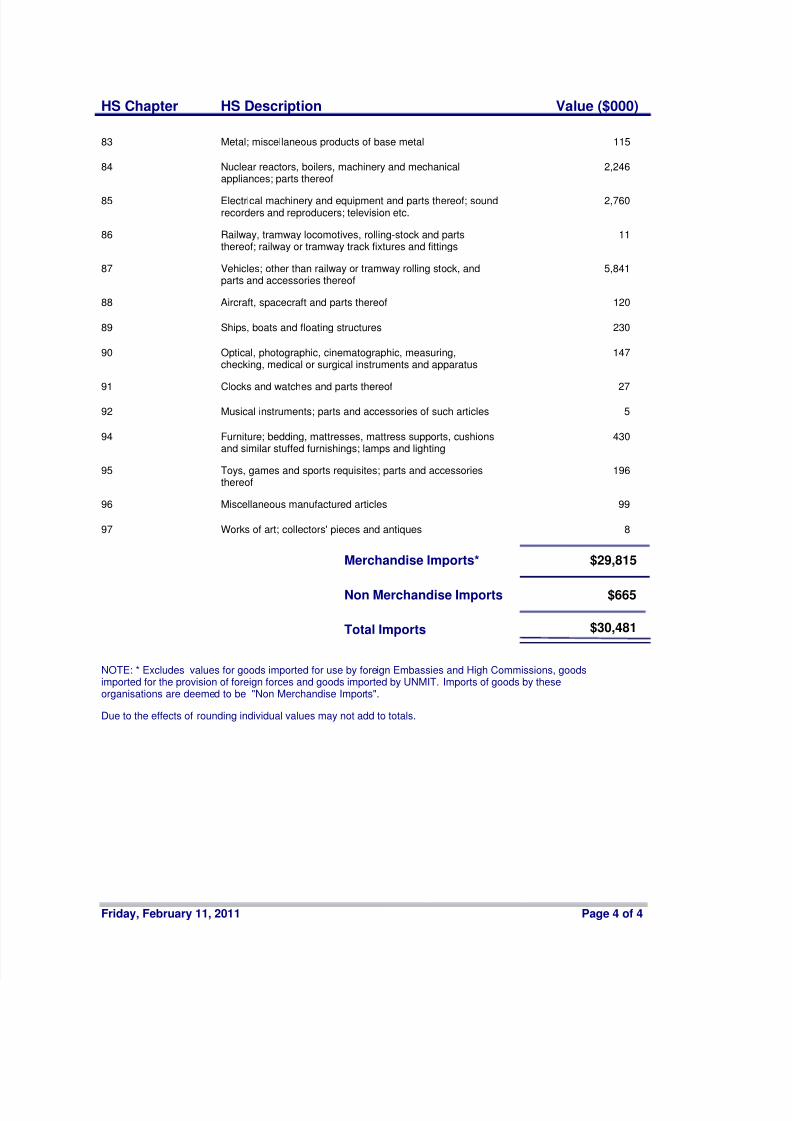
HS Chapter HS Description Value ($000)
83 Metal; miscellaneous products of base metal 115
84 Nuclear reactors, boilers, machinery and mechanicalappliances; parts thereof
2,246
85 Electrical machinery and equipment and parts thereof; soundrecorders and reproducers; television etc.
2,760
86 Railway, tramway locomotives, rolling-stock and partsthereof; railway or tramway track fixtures and fittings
11
87 Vehicles; other than railway or tramway rolling stock, andparts and accessories thereof
5,841
88 Aircraft, spacecraft and parts thereof 120
89 Ships, boats and floating structures 230
90 Optical, photographic, cinematographic, measuring,checking, medical or surgical instruments and apparatus
147
91 Clocks and watches and parts thereof 27
92 Musical instruments; parts and accessories of such articles 5
94 Furniture; bedding, mattresses, mattress supports, cushionsand similar stuffed furnishings; lamps and lighting
430
95 Toys, games and sports requisites; parts and accessoriesthereof
196
96 Miscellaneous manufactured articles 99
97 Works of art; collectors' pieces and antiques 8
$29,815Merchandise Imports*
Non Merchandise Imports
Total Imports
$665
$30,481
NOTE: * Excludes values for goods imported for use by foreign Embassies and High Commissions, goodsimported for the provision of foreign forces and goods imported by UNMIT. Imports of goods by theseorganisations are deemed to be "Non Merchandise Imports".
Due to the effects of rounding individual values may not add to totals.
Friday, February 11, 2011 Page 4 of 4