Embed Size (px)
Citation preview
7/27/2019 Flpiu1207pdf - Monthly Report Dec 07
http://slidepdf.com/reader/full/flpiu1207pdf-monthly-report-dec-07 1/17
Contents
SectionsExecutive summary 1
Review 3
Outlook 6
Annexure 11
FiguresInput costs firm up 4
Domestic steel prices remain firm 4
Analysis of US steel consumption 8
Analysis of Chinese steel consumption 8
Analysis of Indian steel consumption 9
Tables
Outlook on domestic steel industry 1 Availability and consumption of steel 5
Industry aggregate 11
Aggregate for players with iron ore mines 11
Aggregate for players without iron ore mines 11
Steel Authority Of India Ltd – Interim results 12
Tata Steel Ltd – Interim results 12
Ispat Industries Ltd – Interim results 13
Essar Steel Ltd – Interim results 13
Bhushan Steel Ltd – Interim results 14
J S W Steel Ltd – Interim results 14
International players’ financial performance 14
Highlights
! Operating margins remain stable in
first half of 2007-08, to decline over
next 2 – 3 quarters
! Input costs firm up
! Steel prices to rise, though not in the
same proportion as input costs
China: Limited growth potential
Steel products
This document has been prepared by Dhimant Kothari and Ashutosh Satsangi (Head of
Research). For any queries, please get in touch with our client servicing desk.
([email protected]; Phone: 022-66913561) December 2007
7/27/2019 Flpiu1207pdf - Monthly Report Dec 07
http://slidepdf.com/reader/full/flpiu1207pdf-monthly-report-dec-07 2/17
Industry Information Service
Industry Information Service presents a detailed and comprehensive analysis of the current trends and the long-term
performance outlook on 47 industries in India. It covers the evolution of an industry, the regulatory environment, cost
structures and the extent of competition. It also provides the key success factors and an analysis of the global trends along withstatistical information on capacities, production, imports-exports, domestic and international prices, and consumption patterns
and player profiles. The parameters are updated on an annual and monthly basis.
About CRISIL Limited
CRISIL is India's leading Ratings, Research, Risk and Policy Advisory Company.
CRISIL offers domestic and international customers a unique combination of local insights and global perspectives, delivering
independent information, opinions and solutions that help them make better informed business and investment decisions,
improve the efficiency of markets and market participants, and help shape infrastructure policy and projects. Its integrated range
of capabilities includes credit ratings and risk assessment; research on India's economy, industries and companies; global
equity research; fund services; risk management and infrastructure advisory services.
About CRISIL Research
CRISIL Research is India's largest independent, integrated research house. We leverage our unique, integrated research
platform and capabilities spanning the entire economy-industry-company spectrum to deliver superior perspectives and insightsto over 600 domestic and global clients, through a range of subscription products and customised solutions.
Disclaimer
CRISIL Research, a Division of CRISIL Limited has taken due care and caution in preparing this Report. Information has been
obtained by CRISIL from sources which it considers reliable. However, CRISIL does not guarantee the accuracy, adequacy or
completeness of any information and is not responsible for any errors or omissions or for the results obtained from the use of
such information. CRISIL is not liable for investment decisions which may be based on the views expressed in this Report.
CRISIL especially states that it has no financial liability whatsoever to the subscribers/ users/ transmitters/ distributors of this
Report. CRISIL Research operates independently of, and does not have access to information obtained by CRISIL’s Ratings
Division, which may, in its regular operations, obtain information of a confidential nature which is not available to CRISIL
Research. No part of this Report may be published/reproduced in any form without CRISIL’s prior written approval.
7/27/2019 Flpiu1207pdf - Monthly Report Dec 07
http://slidepdf.com/reader/full/flpiu1207pdf-monthly-report-dec-07 3/17
CRISIL RESEARCH STEEL PRODUCTS UPDATE: DECEMBER 2007, 14 PAGES 1
Executive summary
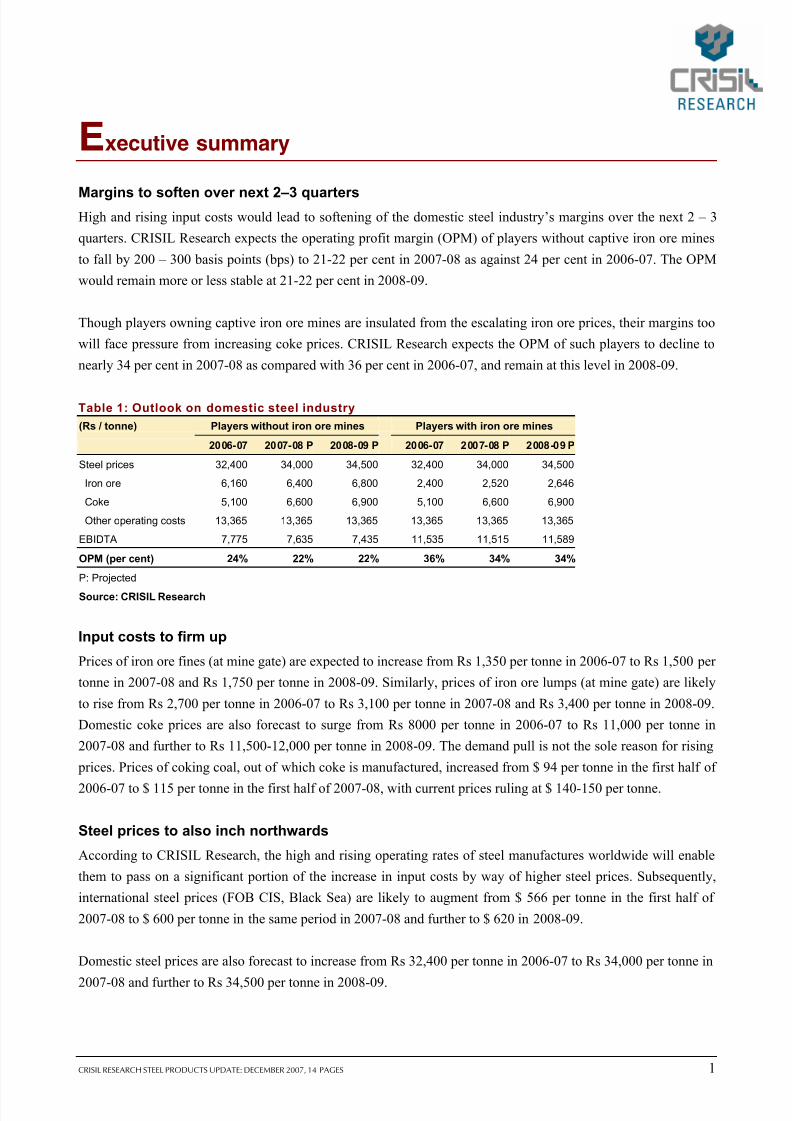
Margins to soften over next 2–3 quartersHigh and rising input costs would lead to softening of the domestic steel industry’s margins over the next 2 – 3
quarters. CRISIL Research expects the operating profit margin (OPM) of players without captive iron ore mines
to fall by 200 – 300 basis points (bps) to 21-22 per cent in 2007-08 as against 24 per cent in 2006-07. The OPM
would remain more or less stable at 21-22 per cent in 2008-09.
Though players owning captive iron ore mines are insulated from the escalating iron ore prices, their margins too
will face pressure from increasing coke prices. CRISIL Research expects the OPM of such players to decline to
nearly 34 per cent in 2007-08 as compared with 36 per cent in 2006-07, and remain at this level in 2008-09.
Table 1: Outlook on domestic steel industry
(Rs / tonne) Players without iron ore mines Players with iron ore mines
2006-07 2007-08 P 2008-09 P 2006-07 2007-08 P 2008-09 P
Steel prices 32,400 34,000 34,500 32,400 34,000 34,500
Iron ore 6,160 6,400 6,800 2,400 2,520 2,646
Coke 5,100 6,600 6,900 5,100 6,600 6,900
Other operating costs 13,365 13,365 13,365 13,365 13,365 13,365
EBIDTA 7,775 7,635 7,435 11,535 11,515 11,589
OPM (per cent) 24% 22% 22% 36% 34% 34%
P: Projected
Source: CRISIL Research
Input costs to firm up
Prices of iron ore fines (at mine gate) are expected to increase from Rs 1,350 per tonne in 2006-07 to Rs 1,500 per
tonne in 2007-08 and Rs 1,750 per tonne in 2008-09. Similarly, prices of iron ore lumps (at mine gate) are likely
to rise from Rs 2,700 per tonne in 2006-07 to Rs 3,100 per tonne in 2007-08 and Rs 3,400 per tonne in 2008-09.
Domestic coke prices are also forecast to surge from Rs 8000 per tonne in 2006-07 to Rs 11,000 per tonne in
2007-08 and further to Rs 11,500-12,000 per tonne in 2008-09. The demand pull is not the sole reason for rising
prices. Prices of coking coal, out of which coke is manufactured, increased from $ 94 per tonne in the first half of
2006-07 to $ 115 per tonne in the first half of 2007-08, with current prices ruling at $ 140-150 per tonne.
Steel prices to also inch northwards
According to CRISIL Research, the high and rising operating rates of steel manufactures worldwide will enable
them to pass on a significant portion of the increase in input costs by way of higher steel prices. Subsequently,
international steel prices (FOB CIS, Black Sea) are likely to augment from $ 566 per tonne in the first half of
2007-08 to $ 600 per tonne in the same period in 2007-08 and further to $ 620 in 2008-09.
Domestic steel prices are also forecast to increase from Rs 32,400 per tonne in 2006-07 to Rs 34,000 per tonne in
2007-08 and further to Rs 34,500 per tonne in 2008-09.
7/27/2019 Flpiu1207pdf - Monthly Report Dec 07
http://slidepdf.com/reader/full/flpiu1207pdf-monthly-report-dec-07 4/17
2 CRISIL RESEARCH STEEL PRODUCTS UPDATE: DECEMBER 2007, 14 PAGES
Limited scope for growth in China’s steel consumption
An analysis of the steel consumption in the US and China leads CRISIL Research to conclude that the buoyancy
in growth of Chinese steel demand would continue for not more than 3–4 years; the same is likely to decelerate
for a few years thereafter.
During 1992-2006, Chinese steel off-take for capital-based applications such as construction, infrastructure and
manufacturing capital goods was nearly 2.3 billion tonnes. This implies consumption of 236 tonnes per square
kilometer of land in China.
Between 1941 and 1975, the phase of major economic growth in the US, the steel off-take for similar capital-
based applications was around 2.1 billion tonnes. This translates into consumption of 230 tonnes per square
kilometer of land in the US.
Thus, we can conclude that the scope for growth in steel demand for capital-based applications, which accounts
for nearly 90 per cent of steel off-take in China, is very limited, even if we consider greater steel intensity in
infrastructural and construction applications and more high rises. Consequently, China’s demand for long
products that are primarily used for construction would slow down considerably over the next 8–10 years.
On the other hand, if we consider consumption-based applications, like steel used in manufacturing automobiles
and consumer durables, the per capita penetration is low in China as compared with the US. Consumption-based
applications amounted to 30 million tonnes in the US and 36 million tonnes in China in 2006. This translates into
per capita usage of steel of 99 kilograms (kg) for US and merely 27 kg for China. Therefore, although these
applications currently account only for 10–12 per cent of steel off-take in China, there still exists tremendous potential for their growth in the country.
7/27/2019 Flpiu1207pdf - Monthly Report Dec 07
http://slidepdf.com/reader/full/flpiu1207pdf-monthly-report-dec-07 5/17
CRISIL RESEARCH STEEL PRODUCTS UPDATE: DECEMBER 2007, 14 PAGES 3
Review
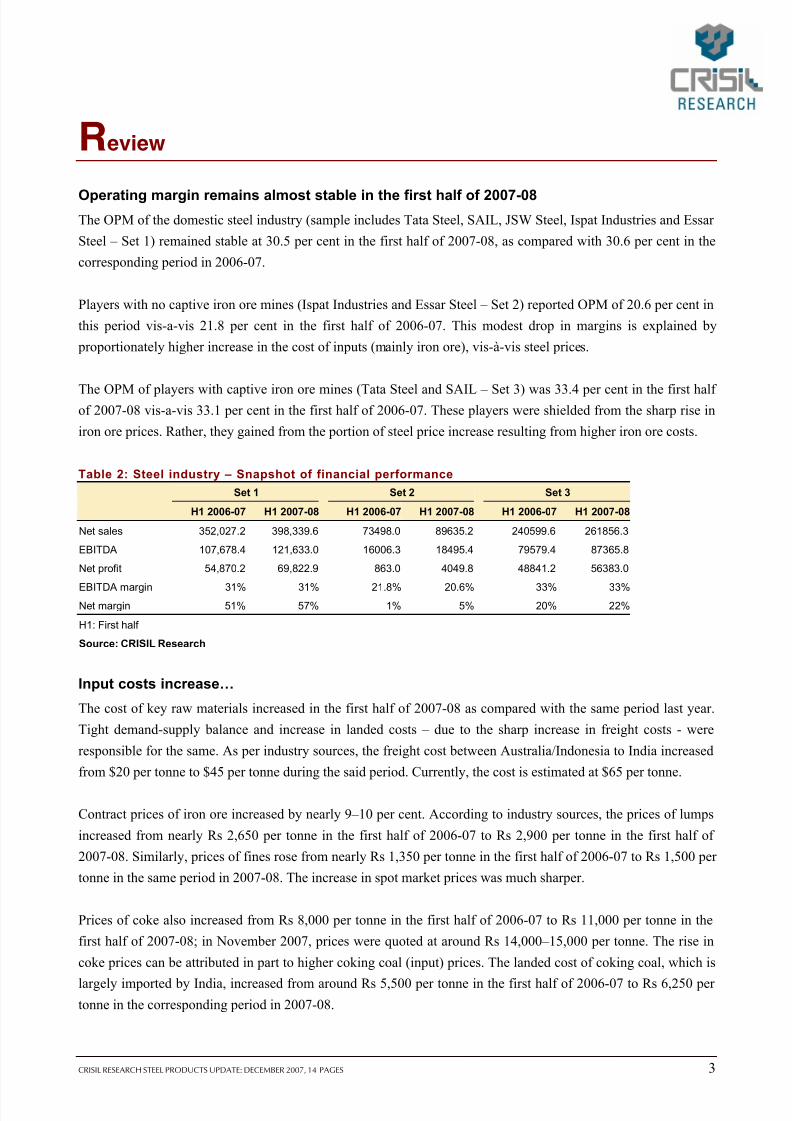
Operating margin remains almost stable in the first half of 2007-08The OPM of the domestic steel industry (sample includes Tata Steel, SAIL, JSW Steel, Ispat Industries and Essar
Steel – Set 1) remained stable at 30.5 per cent in the first half of 2007-08, as compared with 30.6 per cent in the
corresponding period in 2006-07.
Players with no captive iron ore mines (Ispat Industries and Essar Steel – Set 2) reported OPM of 20.6 per cent in
this period vis-a-vis 21.8 per cent in the first half of 2006-07. This modest drop in margins is explained by
proportionately higher increase in the cost of inputs (mainly iron ore), vis-à-vis steel prices.
The OPM of players with captive iron ore mines (Tata Steel and SAIL – Set 3) was 33.4 per cent in the first half of 2007-08 vis-a-vis 33.1 per cent in the first half of 2006-07. These players were shielded from the sharp rise in
iron ore prices. Rather, they gained from the portion of steel price increase resulting from higher iron ore costs.
Table 2: Steel industry – Snapshot of financial performance
Set 1 Set 2 Set 3
H1 2006-07 H1 2007-08 H1 2006-07 H1 2007-08 H1 2006-07 H1 2007-08
Net sales 352,027.2 398,339.6 73498.0 89635.2 240599.6 261856.3
EBITDA 107,678.4 121,633.0 16006.3 18495.4 79579.4 87365.8
Net profit 54,870.2 69,822.9 863.0 4049.8 48841.2 56383.0
EBITDA margin 31% 31% 21.8% 20.6% 33% 33%Net margin 51% 57% 1% 5% 20% 22%
H1: First half
Source: CRISIL Research
Input costs increase…
The cost of key raw materials increased in the first half of 2007-08 as compared with the same period last year.
Tight demand-supply balance and increase in landed costs – due to the sharp increase in freight costs - were
responsible for the same. As per industry sources, the freight cost between Australia/Indonesia to India increased
from $20 per tonne to $45 per tonne during the said period. Currently, the cost is estimated at $65 per tonne.
Contract prices of iron ore increased by nearly 9–10 per cent. According to industry sources, the prices of lumps
increased from nearly Rs 2,650 per tonne in the first half of 2006-07 to Rs 2,900 per tonne in the first half of
2007-08. Similarly, prices of fines rose from nearly Rs 1,350 per tonne in the first half of 2006-07 to Rs 1,500 per
tonne in the same period in 2007-08. The increase in spot market prices was much sharper.
Prices of coke also increased from Rs 8,000 per tonne in the first half of 2006-07 to Rs 11,000 per tonne in the
first half of 2007-08; in November 2007, prices were quoted at around Rs 14,000–15,000 per tonne. The rise in
coke prices can be attributed in part to higher coking coal (input) prices. The landed cost of coking coal, which is
largely imported by India, increased from around Rs 5,500 per tonne in the first half of 2006-07 to Rs 6,250 per
tonne in the corresponding period in 2007-08.
7/27/2019 Flpiu1207pdf - Monthly Report Dec 07
http://slidepdf.com/reader/full/flpiu1207pdf-monthly-report-dec-07 6/17
4 CRISIL RESEARCH STEEL PRODUCTS UPDATE: DECEMBER 2007, 14 PAGES
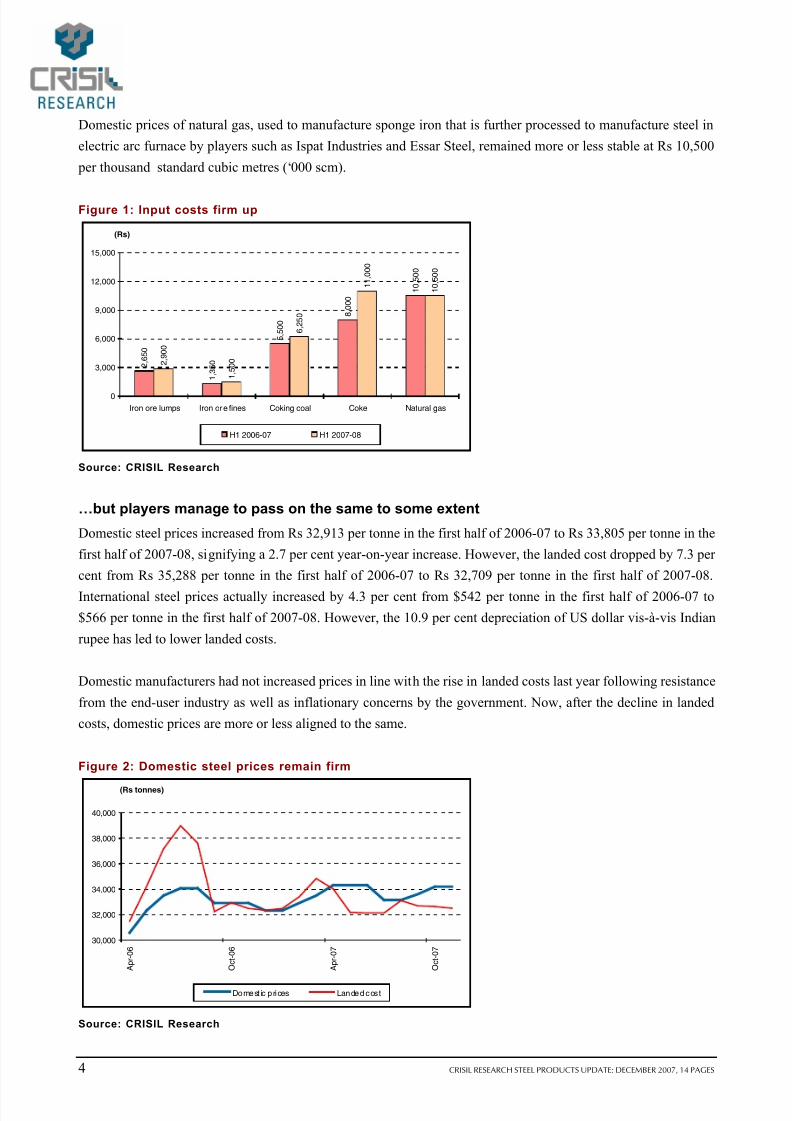
Domestic prices of natural gas, used to manufacture sponge iron that is further processed to manufacture steel in
electric arc furnace by players such as Ispat Industries and Essar Steel, remained more or less stable at Rs 10,500
per thousand standard cubic metres (‘000 scm).
Figure 1: Input costs firm up
2 , 6
5 0
1 , 3
5 0
5 , 5
0 0
8 , 0
0 0
1 0 , 5
0 0
2 , 9
0 0
1 , 5
0 0
6 , 2
5 0
1 1 , 0
0 0
1 0 , 5
0 0
0
3,000
6,000
9,000
12,000
15,000
Iron ore lumps Iron ore fines Coking coal Coke Natural gas
(Rs)
H1 2006-07 H1 2007-08
Source: CRISIL Research
…but players manage to pass on the same to some extent
Domestic steel prices increased from Rs 32,913 per tonne in the first half of 2006-07 to Rs 33,805 per tonne in the
first half of 2007-08, signifying a 2.7 per cent year-on-year increase. However, the landed cost dropped by 7.3 per
cent from Rs 35,288 per tonne in the first half of 2006-07 to Rs 32,709 per tonne in the first half of 2007-08.
International steel prices actually increased by 4.3 per cent from $542 per tonne in the first half of 2006-07 to
$566 per tonne in the first half of 2007-08. However, the 10.9 per cent depreciation of US dollar vis-à-vis Indian
rupee has led to lower landed costs.
Domestic manufacturers had not increased prices in line with the rise in landed costs last year following resistance
from the end-user industry as well as inflationary concerns by the government. Now, after the decline in landed
costs, domestic prices are more or less aligned to the same.
Figure 2: Domestic steel prices remain firm
30,000
32,000
34,000
36,000
38,000
40,000
A p r - 0 6
O c t - 0 6
A p r - 0 7
O c t - 0 7
(Rs tonnes)
Domest ic prices Landed cost
Source: CRISIL Research
7/27/2019 Flpiu1207pdf - Monthly Report Dec 07
http://slidepdf.com/reader/full/flpiu1207pdf-monthly-report-dec-07 7/17
CRISIL RESEARCH STEEL PRODUCTS UPDATE: DECEMBER 2007, 14 PAGES 5
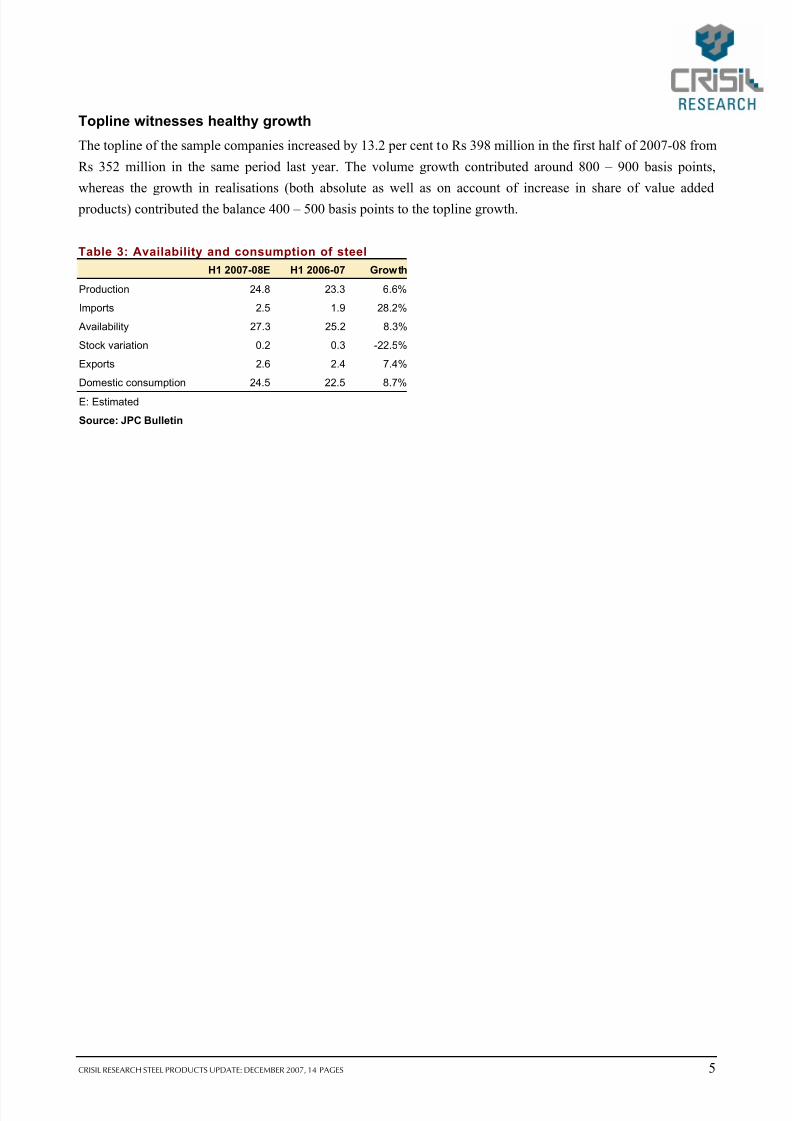
Topline witnesses healthy growth
The topline of the sample companies increased by 13.2 per cent to Rs 398 million in the first half of 2007-08 from
Rs 352 million in the same period last year. The volume growth contributed around 800 – 900 basis points,
whereas the growth in realisations (both absolute as well as on account of increase in share of value added
products) contributed the balance 400 – 500 basis points to the topline growth.
Table 3: Availability and consumption of steel
H1 2007-08E H1 2006-07 Growth
Production 24.8 23.3 6.6%
Imports 2.5 1.9 28.2%
Availability 27.3 25.2 8.3%
Stock variation 0.2 0.3 -22.5%
Exports 2.6 2.4 7.4%
Domestic consumption 24.5 22.5 8.7%
E: Estimated
Source: JPC Bulletin
7/27/2019 Flpiu1207pdf - Monthly Report Dec 07
http://slidepdf.com/reader/full/flpiu1207pdf-monthly-report-dec-07 8/17
6 CRISIL RESEARCH STEEL PRODUCTS UPDATE: DECEMBER 2007, 14 PAGES
Outlook
Players to face some margin pressureCRISIL Research believes that players who do not own captive iron ore mines may experience a decline in the
OPM over the next few quarters. The OPM of such players would decline by 200-300 bps to nearly 21-22 per cent
in 2007-08 as against 24 per cent in 2006-07. The OPM would remain more or less stable at 21-22 per cent in
2008-09.
Though players owning captive iron ore mines are insulated from the sharp surge iron ore prices, they will also
face pressure on margins due to increasing coke prices. CRISIL Research expects the OPM of such players to
decline to nearly 34 per cent in 2007-08 as against 36 per cent in 2006-07, and remain at this level in 2008-09.
Input costs to firm up
Over the past 3-4 years, iron ore prices have witnessed a sharp uptrend - prices of iron ore fines (at mine gate)
have increased from Rs 800 per tonne in 2004-05 to Rs 1,350 per tonne in 2006-07. CRISIL Research expects the
same to cost Rs 1,500 per tonne in 2007-08 and Rs 1,750 per tonne in 2008-09. Similarly, the prices of iron ore
lumps (at mine gate) have increased from Rs 1,175 per tonne in 2004-05 to Rs 2,700 per tonne in 2006-07.
CRISIL Research expects the same to cost Rs 3,100 per tonne in 2007-08 and Rs 3,400 per tonne in 2008-09.
Global iron ore (fines) spot prices, which have risen from $65 per tonne in the first half of 2006-07 to $100 per
tonne in the same period in 2007-08, are currently ruling at around $120-130 per tonne. The contract price for 2007-08 is at $82 per tonne vis-à-vis $75 per tonne in 2006-07. As per industry sources, the contract price for
2008-09 is expected to be negotiated at around $120-125 per tonne; spot prices would more or less remain firm at
this level.
Coke prices have also escalated in the last 3 – 4 months. Domestic coke prices have increased to Rs 11,000 per
tonne in the first half of 2007-08 from Rs 8000 per tonne in the corresponding period last year. CRISIL Research
expects the same to touch Rs 11,500-12,000 per tonne in 2008-09. Prices increased because of both demand pull
and cost push – the prices of coking coal, the raw material for coke, increased from $94 per tonne in the first half
of 2006-07 to $115 per tonne in the same period in 2007-08, with current prices ruling at $140-150 per tonne.
In addition to robust demand, rising freight costs have fuelled the price rise of iron ore and coking coal. The Baltic
exchange dry bulk index (BDI), the benchmark index of shipping freight for dry bulk cargo, rose to 6590 in the
first half of 2007-08 from around 3070 in the corresponding period last year. Currently, the BDI is quoted at
nearly 10,000 - 10,500.
7/27/2019 Flpiu1207pdf - Monthly Report Dec 07
http://slidepdf.com/reader/full/flpiu1207pdf-monthly-report-dec-07 9/17
CRISIL RESEARCH STEEL PRODUCTS UPDATE: DECEMBER 2007, 14 PAGES 7
Steel prices to inch northwards
International steel prices (FOB CIS, Black Sea) are forecast to augment from $566 per tonne in the first half of
2007-08 to $600 per tonne in the second half and further to $620 in 2008-09. The global operating rates of the
steel industry are already high at 90 per cent and are increasing. Hence, a significant portion of the increase in
input costs is expected to be passed on by way of higher steel prices.
Although significant capacity additions have been lined up, especially in China and India, the same is not
sufficient to match demand growth. As against incremental demand of around 270 million tonnes between 2006
and 2009, capacity addition is expected to be around 250 million tonnes. Accordingly, operating rates are forecast
to inch up from 90 per cent in 2006 to 92 per cent in 2009.
Domestic steel prices are also expected to increase from Rs 32,400 per tonne in 2006-07 to Rs 34,000 per tonne in
2007-08 and further to Rs 34,500 per tonne in 2008-09. The increase in domestic prices is expected to be
relatively lower than that in international prices due to further appreciation likely in rupee vis-à-vis the US dollar.
This would not only exert pressure on domestic prices that largely move in tandem with landed costs, but will also
pressurise export realisations.
Limited scope for growth in China’s steel consumption
During 1992-2006, steel consumption registered a CAGR of 12.3 per cent; the critical question that arises is –
how long will the growth momentum sustain?
CRISIL Research believes the scope for further growth in Chinese demand for steel is limited. Demand growth is
likely to decelerate significantly over the next 8–10 years. Therefore, we believe the growth momentum will
continue only for next 3 – 4 years.
Methodology
We have tried to study the pattern of steel consumption by the US and have attempted to make a comparison with
China and India.
Firstly, we have segregated the steel off-take for all three countries into capital-based and consumption-based
applications. The former includes steel used for construction (real estate, infrastructure and industrial), and
manufacturing capital or engineering goods, whereas the latter includes steel used for manufacturing automobiles
and consumer durables. Thus, rising infrastructural and fixed asset investments would drive capital-based demand
for steel, whereas rising consumer expenditure would boost consumption-based demand. The division is based on
current steel application pattern for each country as adjusted for the trends in the end-user industry.
Subsequently, we have made an effort to identify the period during which fixed asset and infrastructural
investment have been the highest as the growth phase in the economy of each country.
Accordingly, the period between 1941 and 1975 has been identified as the growth phase in the US economy.
During this period, which followed the famous economic crisis of 1930 and World War Two, sizeable fixed assetinvestments were made in the US.
7/27/2019 Flpiu1207pdf - Monthly Report Dec 07
http://slidepdf.com/reader/full/flpiu1207pdf-monthly-report-dec-07 10/17
8 CRISIL RESEARCH STEEL PRODUCTS UPDATE: DECEMBER 2007, 14 PAGES
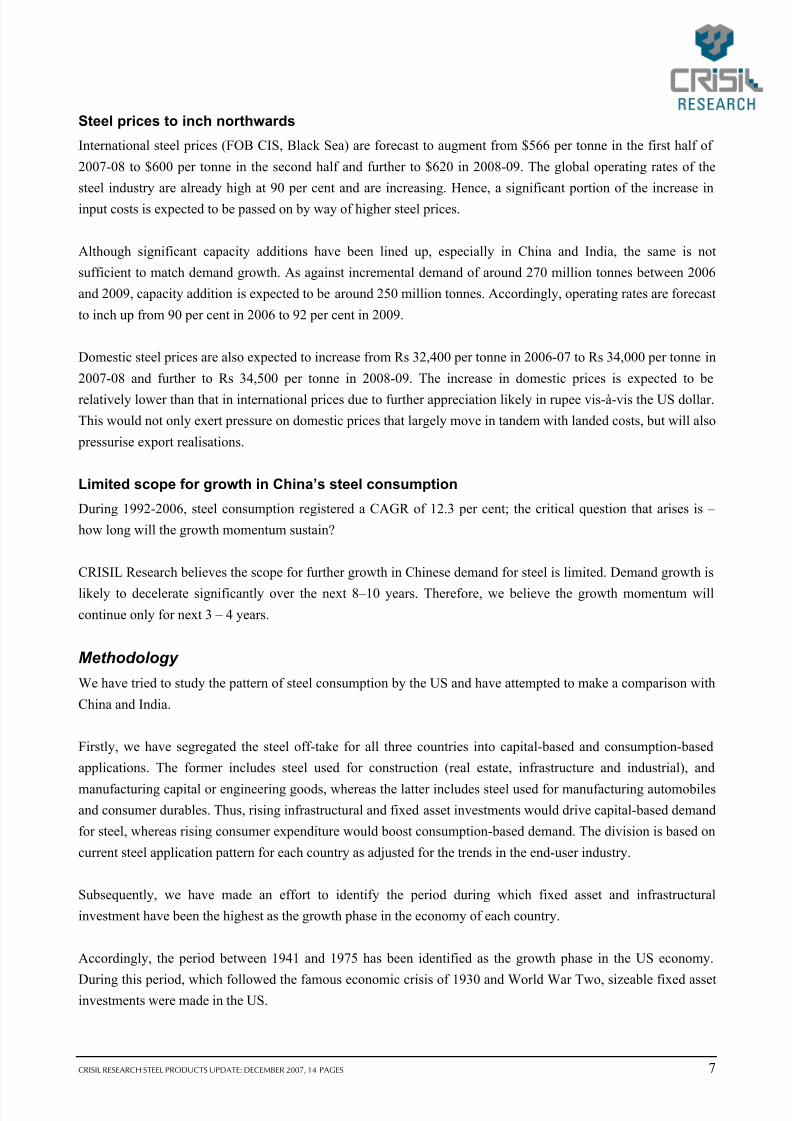
Figure 3: Analysis of US steel consumption
0
20
40
60
80
100
120
140
1 9 0 7
1 9 1 6
1 9 2 5
1 9 3 4
1 9 4 3
1 9 5 2
1 9 6 1
1 9 7 0
1 9 7 9
1 9 8 8
1 9 9 7
2 0 0 6
(million tonnes)
Consumption applications Investment applications
Source: USGS, IISI, CRISIL Research
US steel consumption CAGR (%)
Phase I (1907-1940) 1.7
Phase II (1941-1970) 5.6
Phase III (1971-2006) 0.7
During this phase, the cumulative capital-based off-take of steel was around 2,100 million tonnes. This translates
into consumption of 230 tonnes per square kilometer of land (9.2 million square kilometers).
Similarly, the period between 1992 and 2006 has been identified as the growth phase in the Chinese economy.
China saw significant fixed capital and infrastructural investments during this period. The country opened up its
economy for trade and FDI (open door policy) in the early 1990s. Since then, FDI surged from $11 billion in 1992
to $75 billion in 2006 (CAGR 14.7 per cent). Low labour costs made China competitive in many manufactured
goods, which led to increasing investments in capital goods.
Figure 4: Analysis of Chinese steel consumption
0
50
100
150
200
250
300
350
400
1 9 5 6
1 9 6 1
1 9 6 6
1 9 7 1
1 9 7 6
1 9 8 1
1 9 8 6
1 9 9 1
1 9 9 6
2 0 0 1
2 0 0 6
(million tonnes)
Consumption applications Investment applications
Source: IISI, CRISIL Research
Chinese steel consumption CAGR (%)
Phase I (1972-1991) 5.2
Phase II (1992-2006) 12.3
7/27/2019 Flpiu1207pdf - Monthly Report Dec 07
http://slidepdf.com/reader/full/flpiu1207pdf-monthly-report-dec-07 11/17
CRISIL RESEARCH STEEL PRODUCTS UPDATE: DECEMBER 2007, 14 PAGES 9
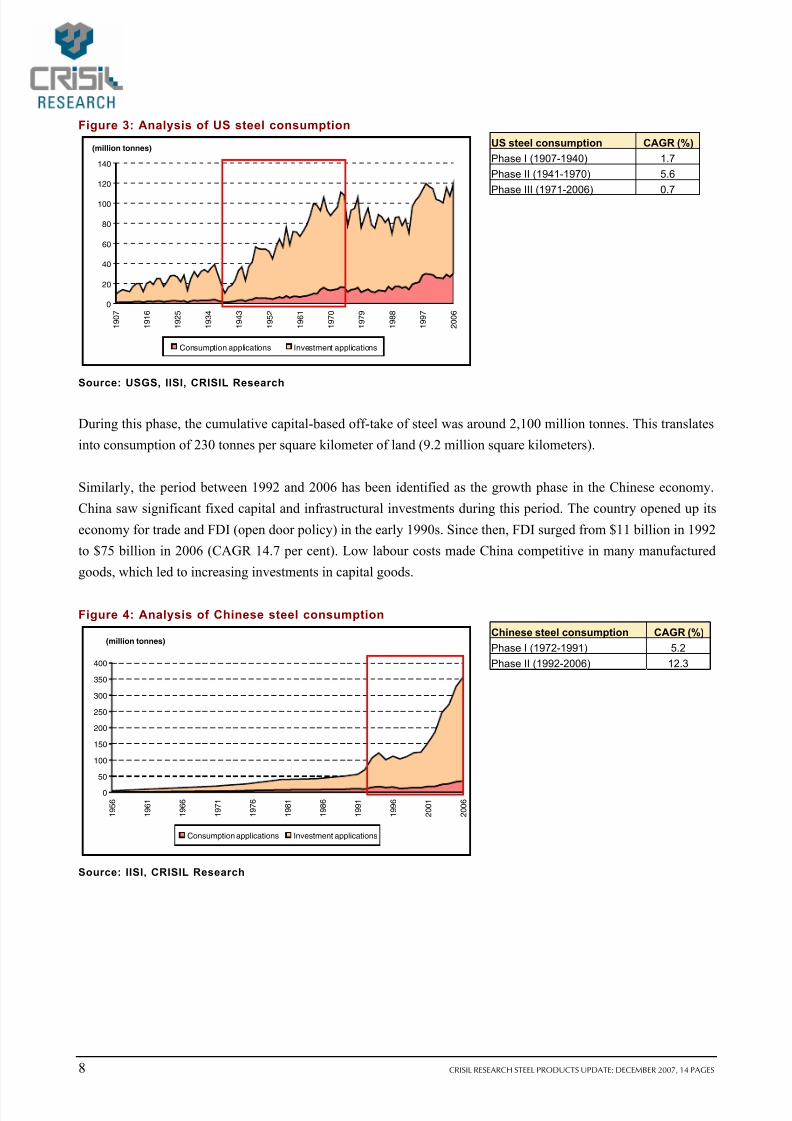
During this phase, the cumulative capital based off-take of steel was around 2,300 million tonnes. This denotes
consumption of 236 tonnes per square kilometer of land (9.3 million square kilometers). Thus, it has already
achieved the level as that of US.
1992-2006 has been identified as the growth phase for the Indian economy as well. Post liberalisation of India’s
industry policy in 1991, FDI has been increasingly promoted in the country. Accordingly, the Indian economy has
started seeing increasing fixed asset investments. With falling interest rates, both consumption and capital
investments started witnessing significant growth in the last 4–5 years.
Figure 5: Analysis of Indian steel consumption
0
5
10
15
20
25
30
35
40
45
50
1 9 5 6
1 9 6 1
1 9 6 6
1 9 7 1
1 9 7 6
1 9 8 1
1 9 8 6
1 9 9 1
1 9 9 6
2 0 0 1
2 0 0 6
(million tonnes)
Consumption applications Investment applications
Source: IISI, CRISIL Research
Indian steel consumption CAGR (%)
Phase I (1952-1991) 6.6
Phase II (1992-2001) 6.9
Phase II (2002-2006) 10.5
During this phase, the cumulative capital based off-take of steel was around 355 million tonnes. This translates to
consumption of merely 119 tonnes per square kilometer of land (3 million square kilometers).
Conclusion
Long products
As per the above analysis, potential for further growth in steel demand for capital-based applications, which
accounts for nearly 90 per cent of steel off-take in China, is very limited even if we consider increase in steel
intensity in infrastructural and construction applications and more number of high rises. As a result, double-digit
growth in Chinese demand for long products, which are primarily used for construction, is unlikely to last beyond
next 3–4 years. Thereafter, demand growth will slow down significantly for few years. US steel demand also
plunged during the late 1970’s and early 1980’s after posting robust growth during 1941-1975.
However, India still has a long way to go in infrastructural and industrial investments. Consequently, demand for
long products is expected to register growth of 11–12 per cent per annum over the next 8–10 years.
7/27/2019 Flpiu1207pdf - Monthly Report Dec 07
http://slidepdf.com/reader/full/flpiu1207pdf-monthly-report-dec-07 12/17
10 CRISIL RESEARCH STEEL PRODUCTS UPDATE: DECEMBER 2007, 14 PAGES
Flat products
If we consider consumption-based applications, the per capita penetration continues to be low in China as well as
India. In 2006, consumption-based applications amounted to 30 million tonnes in US, 36 million tonnes in China
and 4 million tonnes in India. This translates into per capita consumption of 99 kg for US, 27 kg for China and 4
kg for India. Thus, we can conclude that there still exists huge scope for growth in steel demand for these
applications in China and India.
Hence, demand for flat products, which are mainly used for consumption based applications like manufacturing
automobiles and consumer durables, is expected grow by 11–12 per cent per annum over the next 8–10 years in
both these countries.
7/27/2019 Flpiu1207pdf - Monthly Report Dec 07
http://slidepdf.com/reader/full/flpiu1207pdf-monthly-report-dec-07 13/17
CRISIL RESEARCH STEEL PRODUCTS UPDATE: DECEMBER 2007, 14 PAGES 11
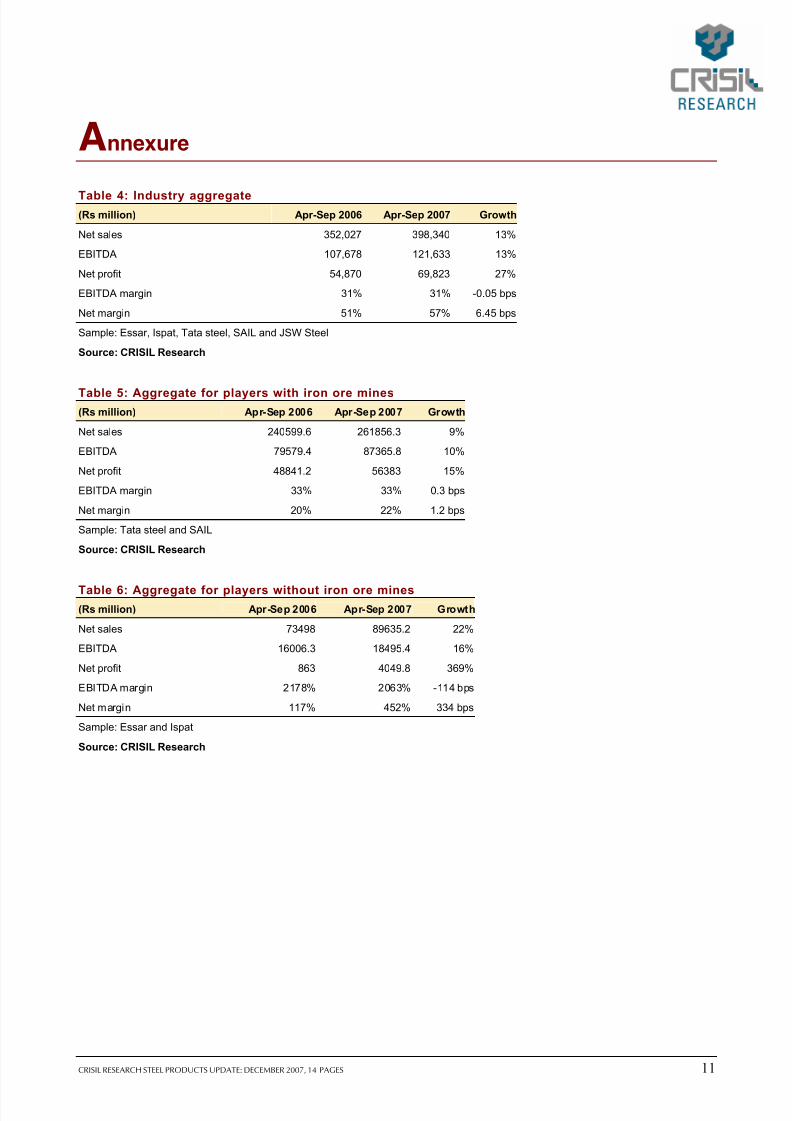
Annexure
Table 4: Industry aggregate(Rs million) Apr-Sep 2006 Apr-Sep 2007 Growth
Net sales 352,027 398,340 13%
EBITDA 107,678 121,633 13%
Net profit 54,870 69,823 27%
EBITDA margin 31% 31% -0.05 bps
Net margin 51% 57% 6.45 bps
Sample: Essar, Ispat, Tata steel, SAIL and JSW Steel
Source: CRISIL Research
Table 5: Aggregate for players with iron ore mines(Rs million) Apr-Sep 2006 Apr-Sep 2007 Growth
Net sales 240599.6 261856.3 9%
EBITDA 79579.4 87365.8 10%
Net profit 48841.2 56383 15%
EBITDA margin 33% 33% 0.3 bps
Net margin 20% 22% 1.2 bps
Sample: Tata steel and SAIL
Source: CRISIL Research
Table 6: Aggregate for players without iron ore mines(Rs million) Apr-Sep 2006 Apr-Sep 2007 Growth
Net sales 73498 89635.2 22%
EBITDA 16006.3 18495.4 16%
Net profit 863 4049.8 369%
EBITDA margin 2178% 2063% -114 bps
Net margin 117% 452% 334 bps
Sample: Essar and Ispat
Source: CRISIL Research
7/27/2019 Flpiu1207pdf - Monthly Report Dec 07
http://slidepdf.com/reader/full/flpiu1207pdf-monthly-report-dec-07 14/17
12 CRISIL RESEARCH STEEL PRODUCTS UPDATE: DECEMBER 2007, 14 PAGES
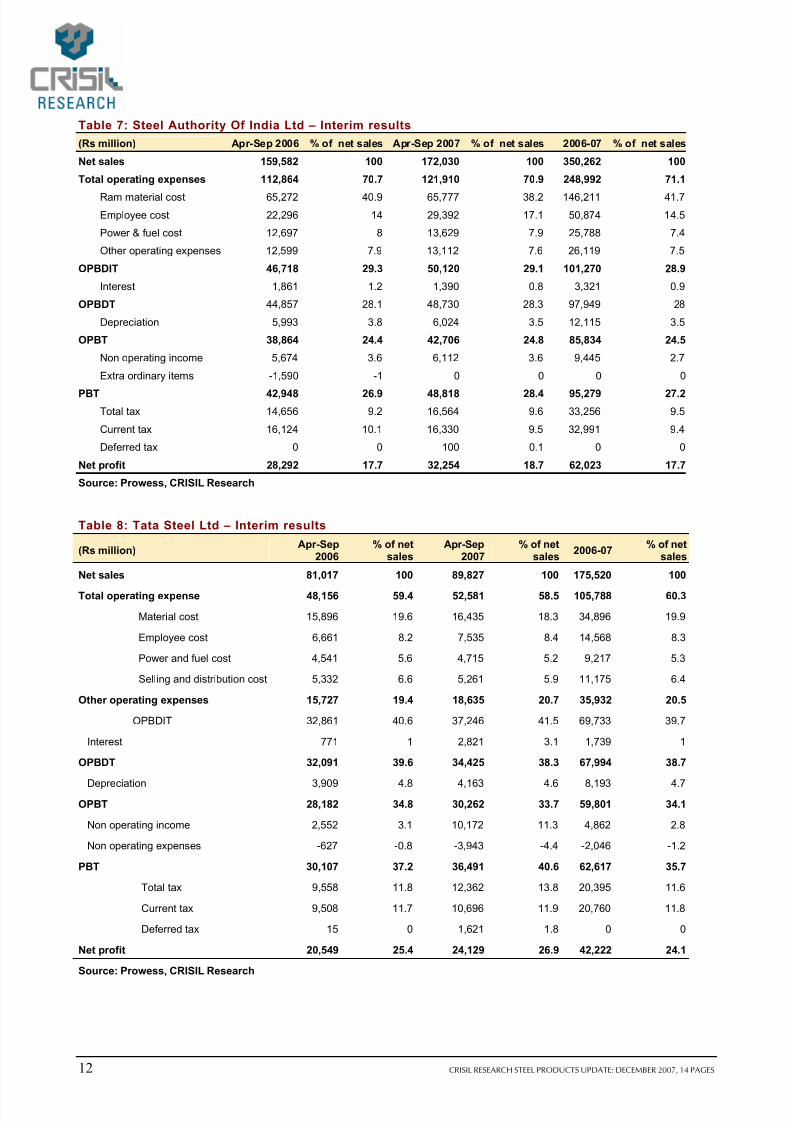
Table 7: Steel Authority Of India Ltd – Interim results
(Rs million) Apr-Sep 2006 % of net sales Apr-Sep 2007 % of net sales 2006-07 % of net sales
Net sales 159,582 100 172,030 100 350,262 100
Total operating expenses 112,864 70.7 121,910 70.9 248,992 71.1
Ram material cost 65,272 40.9 65,777 38.2 146,211 41.7
Employee cost 22,296 14 29,392 17.1 50,874 14.5
Power & fuel cost 12,697 8 13,629 7.9 25,788 7.4
Other operating expenses 12,599 7.9 13,112 7.6 26,119 7.5
OPBDIT 46,718 29.3 50,120 29.1 101,270 28.9
Interest 1,861 1.2 1,390 0.8 3,321 0.9
OPBDT 44,857 28.1 48,730 28.3 97,949 28
Depreciation 5,993 3.8 6,024 3.5 12,115 3.5
OPBT 38,864 24.4 42,706 24.8 85,834 24.5
Non operating income 5,674 3.6 6,112 3.6 9,445 2.7
Extra ordinary items -1,590 -1 0 0 0 0
PBT 42,948 26.9 48,818 28.4 95,279 27.2
Total tax 14,656 9.2 16,564 9.6 33,256 9.5
Current tax 16,124 10.1 16,330 9.5 32,991 9.4
Deferred tax 0 0 100 0.1 0 0
Net profit 28,292 17.7 32,254 18.7 62,023 17.7
Source: Prowess, CRISIL Research
Table 8: Tata Steel Ltd – Interim results
(Rs million)Apr-Sep
2006% of net
salesApr-Sep
2007% of net
sales2006-07
% of netsales
Net sales 81,017 100 89,827 100 175,520 100
Total operating expense 48,156 59.4 52,581 58.5 105,788 60.3
Material cost 15,896 19.6 16,435 18.3 34,896 19.9
Employee cost 6,661 8.2 7,535 8.4 14,568 8.3
Power and fuel cost 4,541 5.6 4,715 5.2 9,217 5.3
Selling and distribution cost 5,332 6.6 5,261 5.9 11,175 6.4
Other operating expenses 15,727 19.4 18,635 20.7 35,932 20.5
OPBDIT 32,861 40.6 37,246 41.5 69,733 39.7
Interest 771 1 2,821 3.1 1,739 1
OPBDT 32,091 39.6 34,425 38.3 67,994 38.7
Depreciation 3,909 4.8 4,163 4.6 8,193 4.7
OPBT 28,182 34.8 30,262 33.7 59,801 34.1
Non operating income 2,552 3.1 10,172 11.3 4,862 2.8
Non operating expenses -627 -0.8 -3,943 -4.4 -2,046 -1.2
PBT 30,107 37.2 36,491 40.6 62,617 35.7
Total tax 9,558 11.8 12,362 13.8 20,395 11.6
Current tax 9,508 11.7 10,696 11.9 20,760 11.8
Deferred tax 15 0 1,621 1.8 0 0
Net profit 20,549 25.4 24,129 26.9 42,222 24.1
Source: Prowess, CRISIL Research
7/27/2019 Flpiu1207pdf - Monthly Report Dec 07
http://slidepdf.com/reader/full/flpiu1207pdf-monthly-report-dec-07 15/17
CRISIL RESEARCH STEEL PRODUCTS UPDATE: DECEMBER 2007, 14 PAGES 13
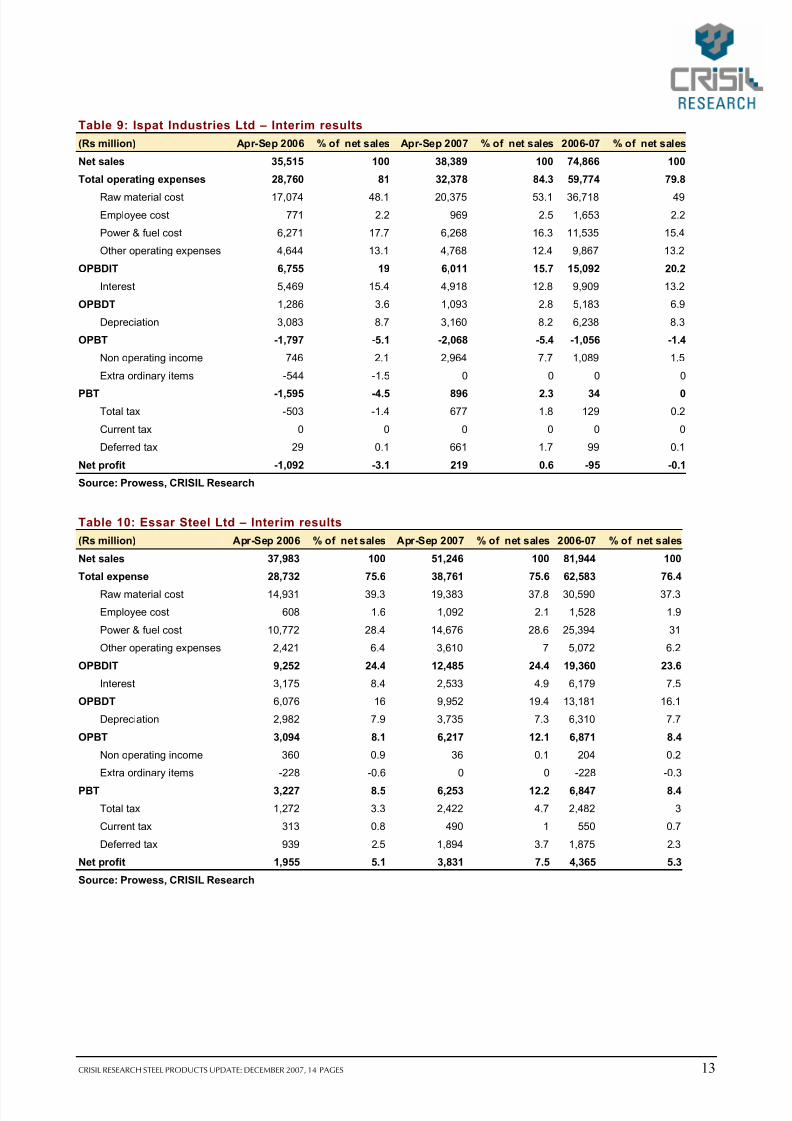
Table 9: Ispat Industries Ltd – Interim results
(Rs million) Apr-Sep 2006 % of net sales Apr-Sep 2007 % of net sales 2006-07 % of net sales
Net sales 35,515 100 38,389 100 74,866 100
Total operating expenses 28,760 81 32,378 84.3 59,774 79.8
Raw material cost 17,074 48.1 20,375 53.1 36,718 49
Employee cost 771 2.2 969 2.5 1,653 2.2
Power & fuel cost 6,271 17.7 6,268 16.3 11,535 15.4
Other operating expenses 4,644 13.1 4,768 12.4 9,867 13.2
OPBDIT 6,755 19 6,011 15.7 15,092 20.2
Interest 5,469 15.4 4,918 12.8 9,909 13.2
OPBDT 1,286 3.6 1,093 2.8 5,183 6.9
Depreciation 3,083 8.7 3,160 8.2 6,238 8.3
OPBT -1,797 -5.1 -2,068 -5.4 -1,056 -1.4
Non operating income 746 2.1 2,964 7.7 1,089 1.5
Extra ordinary items -544 -1.5 0 0 0 0
PBT -1,595 -4.5 896 2.3 34 0
Total tax -503 -1.4 677 1.8 129 0.2
Current tax 0 0 0 0 0 0
Deferred tax 29 0.1 661 1.7 99 0.1
Net profit -1,092 -3.1 219 0.6 -95 -0.1
Source: Prowess, CRISIL Research
Table 10: Essar Steel Ltd – Interim results
(Rs million) Apr-Sep 2006 % of net sales Apr-Sep 2007 % of net sales 2006-07 % of net sales
Net sales 37,983 100 51,246 100 81,944 100
Total expense 28,732 75.6 38,761 75.6 62,583 76.4
Raw material cost 14,931 39.3 19,383 37.8 30,590 37.3
Employee cost 608 1.6 1,092 2.1 1,528 1.9
Power & fuel cost 10,772 28.4 14,676 28.6 25,394 31
Other operating expenses 2,421 6.4 3,610 7 5,072 6.2
OPBDIT 9,252 24.4 12,485 24.4 19,360 23.6
Interest 3,175 8.4 2,533 4.9 6,179 7.5
OPBDT 6,076 16 9,952 19.4 13,181 16.1
Depreciation 2,982 7.9 3,735 7.3 6,310 7.7
OPBT 3,094 8.1 6,217 12.1 6,871 8.4
Non operating income 360 0.9 36 0.1 204 0.2
Extra ordinary items -228 -0.6 0 0 -228 -0.3
PBT 3,227 8.5 6,253 12.2 6,847 8.4
Total tax 1,272 3.3 2,422 4.7 2,482 3
Current tax 313 0.8 490 1 550 0.7
Deferred tax 939 2.5 1,894 3.7 1,875 2.3
Net profit 1,955 5.1 3,831 7.5 4,365 5.3
Source: Prowess, CRISIL Research
7/27/2019 Flpiu1207pdf - Monthly Report Dec 07
http://slidepdf.com/reader/full/flpiu1207pdf-monthly-report-dec-07 16/17
14 CRISIL RESEARCH STEEL PRODUCTS UPDATE: DECEMBER 2007, 14 PAGES
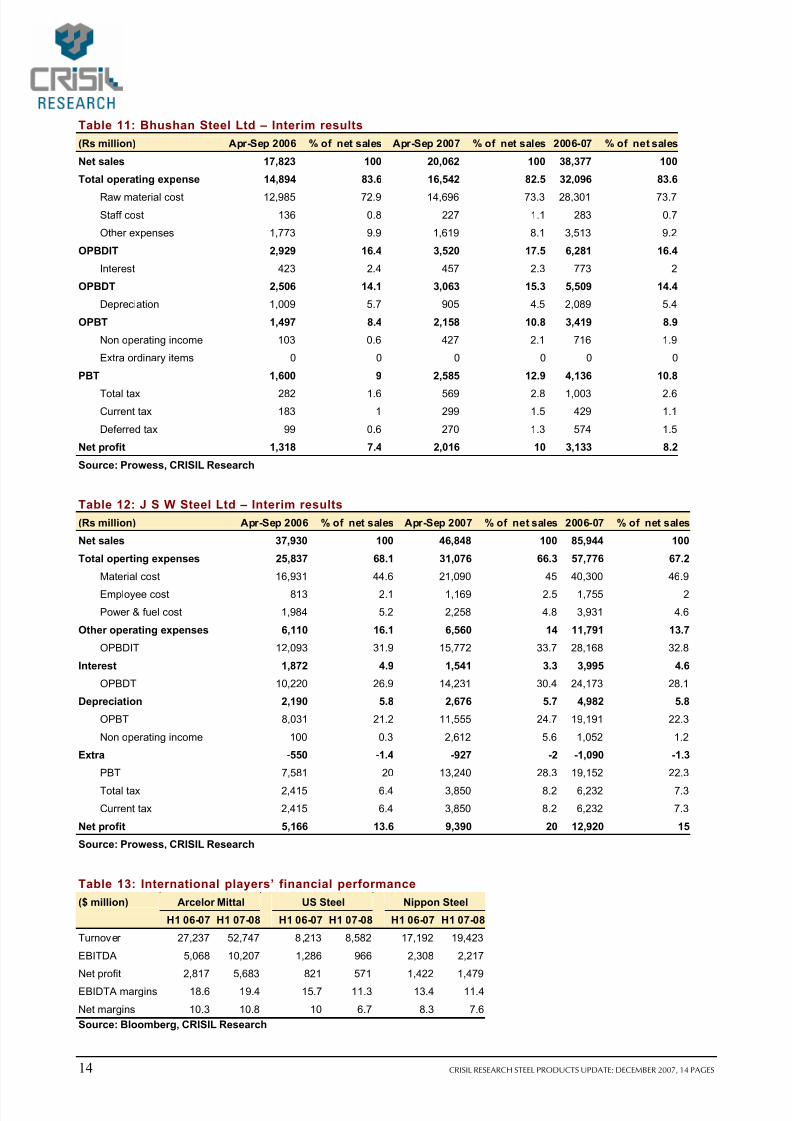
Table 11: Bhushan Steel Ltd – Interim results
(Rs million) Apr-Sep 2006 % of net sales Apr-Sep 2007 % of net sales 2006-07 % of net sales
Net sales 17,823 100 20,062 100 38,377 100
Total operating expense 14,894 83.6 16,542 82.5 32,096 83.6
Raw material cost 12,985 72.9 14,696 73.3 28,301 73.7
Staff cost 136 0.8 227 1.1 283 0.7
Other expenses 1,773 9.9 1,619 8.1 3,513 9.2
OPBDIT 2,929 16.4 3,520 17.5 6,281 16.4
Interest 423 2.4 457 2.3 773 2
OPBDT 2,506 14.1 3,063 15.3 5,509 14.4
Depreciation 1,009 5.7 905 4.5 2,089 5.4
OPBT 1,497 8.4 2,158 10.8 3,419 8.9
Non operating income 103 0.6 427 2.1 716 1.9
Extra ordinary items 0 0 0 0 0 0
PBT 1,600 9 2,585 12.9 4,136 10.8
Total tax 282 1.6 569 2.8 1,003 2.6
Current tax 183 1 299 1.5 429 1.1
Deferred tax 99 0.6 270 1.3 574 1.5
Net profit 1,318 7.4 2,016 10 3,133 8.2
Source: Prowess, CRISIL Research
Table 12: J S W Steel Ltd – Interim results
(Rs million) Apr-Sep 2006 % of net sales Apr-Sep 2007 % of net sales 2006-07 % of net sales
Net sales 37,930 100 46,848 100 85,944 100
Total operting expenses 25,837 68.1 31,076 66.3 57,776 67.2
Material cost 16,931 44.6 21,090 45 40,300 46.9
Employee cost 813 2.1 1,169 2.5 1,755 2
Power & fuel cost 1,984 5.2 2,258 4.8 3,931 4.6
Other operating expenses 6,110 16.1 6,560 14 11,791 13.7
OPBDIT 12,093 31.9 15,772 33.7 28,168 32.8
Interest 1,872 4.9 1,541 3.3 3,995 4.6
OPBDT 10,220 26.9 14,231 30.4 24,173 28.1
Depreciation 2,190 5.8 2,676 5.7 4,982 5.8
OPBT 8,031 21.2 11,555 24.7 19,191 22.3
Non operating income 100 0.3 2,612 5.6 1,052 1.2
Extra -550 -1.4 -927 -2 -1,090 -1.3
PBT 7,581 20 13,240 28.3 19,152 22.3
Total tax 2,415 6.4 3,850 8.2 6,232 7.3
Current tax 2,415 6.4 3,850 8.2 6,232 7.3
Net profit 5,166 13.6 9,390 20 12,920 15
Source: Prowess, CRISIL Research
Table 13: International players’ financial performance
($ million) Arcelor Mittal US Steel Nippon Steel
H1 06-07 H1 07-08 H1 06-07 H1 07-08 H1 06-07 H1 07-08
Turnover 27,237 52,747 8,213 8,582 17,192 19,423
EBITDA 5,068 10,207 1,286 966 2,308 2,217
Net profit 2,817 5,683 821 571 1,422 1,479
EBIDTA margins 18.6 19.4 15.7 11.3 13.4 11.4
Net margins 10.3 10.8 10 6.7 8.3 7.6
Source: Bloomberg, CRISIL Research
7/27/2019 Flpiu1207pdf - Monthly Report Dec 07
http://slidepdf.com/reader/full/flpiu1207pdf-monthly-report-dec-07 17/17
Mumbai
1061, Solitaire Corporate Park
Andheri-Ghatkopar Link Road,
Andheri (East), Mumbai 400 093.
Phone +91 (22) 6758 8035
FAX +91 (22) 6758 8088
New Delhi
The Mira, G-1, 1st Floor
Plot No. 1 & 2, Ishwar Nagar,
Near Okhla Crossing, New Delhi 110 065.
Phone +91 (11) 4250 5100, 2693 0117 - 121
FAX +91 (11) 2684 2212/13
E-mail: [email protected]
Bangalore
W-101, Sunrise Chambers,
22, Ulsoor Road,
Bangalore 560 042.
Phone +91 (80) 4117 0622
FAX +91 (80) 2559 4801
Kolkata
Horizon, 4th floor,
57 Chowringhee Road,
Kolkata 700 071.
Phone +91 (33) 2283 0595
FAX +91 (33) 2283 0597
www.crisil.com