Embed Size (px)
Citation preview
Pease International Tradeport • 273 Corporate Drive • Portsmouth, NH 03801 • www.primebuchholz.com • 603.433.1143
May 31, 2012
MONTHLY MARKET REVIEW
Europe’s fragile economic and political condition re-emerged as a
defining issue for investors on several fronts as the optimism
surrounding the European Central Bank’s (ECB’s) long-term refinancing
operation (LTRO) abated. The uncertainty emanating from Europe once
again contributed to a sharp sell-off in risk assets across the globe; the
S&P 500 Index posted its worst monthly loss since September 2011; and
non-U.S. equities, emerging markets equities, commodities, and natural
resources stocks all posted notable declines while long Treasuries posted
strong gains. May served as a strong reminder of the importance of
building a portfolio that contains ample exposure to hedges to help
provide balance for the growth engine of the portfolio.
Within Europe, political resistance to the Franco-German austerity
model has spread from the periphery to core countries like France and
the Netherlands, causing investors to question the direction and
likelihood of success for the policy initiatives being enacted in the region.
Problems intensified among the PIIGS countries, particularly in Greece
and Spain. Inconclusive Greek election results on May 6th and anti-
bailout parties prevented a coalition government from being formed and
postponed possible resolution until elections are held on June 17th.
Pessimism rose regarding Greece’s future in the common currency block,
which would have significant ramifications for the global economy and
financial markets. As the events in Greece unfolded, investors also
became increasingly concerned with Spain, which continued to be
plagued by high unemployment and a troubled banking system where a
debt-fueled property bubble has left many Spanish banks undercapitalized.
The government recently took control of Bankia—the country’s fourth
largest lender—despite announcing the nation will miss deficit reduction
targets. In addition to supporting its banking system and its independent
regions, the country faces higher borrowing costs at a time when it needs
to rollover 45% of its normal government debt issuance during the
remainder of the year. Another factor driving market apprehension in
Europe has been the lack of support the ECB has provided for the
sovereign market recently as it may be an indication the ECB is unwilling
to serve as the lender of last resort. Since the second LTRO on February
29th, the ECB made only one modest weekly purchase of €27 million in
sovereign debt during the week of March 9th—much lower than previous
weekly purchases, which averaged €3.5 billion.
0
5,000
10,000
15,000
20,000
25,000
ECB Weekly Sovereign Bond Purchases
Securities Market Program(€1M)
Market Returns (%)
MTD QTD YTD 1 Year 2 Year 3 Year 5 Year 10 Year
S&P 500 -6.0 -6.6 5.2 -0.4 12.0 14.9 -0.9 4.1
MSCI EAFE -11.5 -13.2 -3.8 -20.5 1.9 3.4 -7.3 4.0
MSCI EME -11.2 -12.3 0.1 -20.3 1.3 7.9 0.1 12.7
Barclays Aggregate 0.9 2.0 2.3 7.1 6.5 7.1 6.7 5.7
Barclays Long Treasury 7.4 12.1 5.6 31.5 17.7 14.3 12.2 9.3
Barclays Global TSY (Unhedged) -0.6 0.9 0.4 2.8 7.6 5.6 7.1 7.3
Market Returns (%)
MTD QTD YTD 1 Year 2 Year 3 Year 5 Year 10 Year
Barclays TIPS 1.7 3.7 4.6 13.2 10.8 10.0 8.5 7.4
FTSE EPRA/NAREIT Glbl Index -6.3 -4.1 8.2 -6.3 12.1 17.0 -5.2 9.2
S&P GSSI Nat. Resources -11.8 -13.2 -9.5 -22.6 4.4 6.0 -1.4 9.3
DJ UBS Commodity -9.1 -9.5 -8.7 -22.9 1.3 1.0 -4.9 4.6
Fund Weighted Hedge Index -1.6 -2.1 2.5 -4.7 3.2 5.6 1.4 5.9
Barclays 1-3 Month T-Bill 0.0 0.0 0.0 0.0 0.1 0.1 0.9 1.8
MONTHLY MARKET REVIEW – May 31, 2012
As hope for progress in Europe evaporated, investors sought relative
safety, driving capital to the U.S. dollar (USD) and the Japanese yen.
During the month, the USD rose sharply relative to most other
currencies, serving as a headwind for U.S.-based investors allocated
abroad. Eastern European countries were among the worst-performing
currencies relative to the USD during the month, with the Hungarian
forint, Polish zloty, and the Czech Republic koruna posting noteworthy
losses. This dynamic was partially driven by the potential economic
contagion from contraction in the broader European region. Elsewhere,
signs of slowing growth in China led to heightened fears regarding the
path of global growth and put downward pressure on commodity prices.
In this environment, the currencies of several commodity-driven
economies did poorly within both emerging markets (Russia and South
Africa) and the developed world (Australia and New Zealand). Near
month-end, Bloomberg reported that many emerging markets countries
recently took intervention measures to stem currency losses, including
Brazil, South Korea, India, Russia, and Indonesia. In the case of Brazil,
this action to halt currency depreciation stands in stark contrast to
measures taken in 2010/2011 to stem appreciation of the real. In early
October 2010, the Brazilian government raised the IOF tax (tax on
financial transactions) on foreign bond purchasers from 2% to 4%, and
then subsequently raised it to 6%. As recently as April 2012, the
government had also extended the maturities covered under the IOF tax
and the central bank cut the Selic Rate to 8.5% on May 30th,
representing its lowest rate on record in the Bloomberg database.
Long U.S. Treasuries (+7.4%) continued to serve as the asset of choice
during periods of market stress, despite yields at or near historical lows
along much of the curve. However, it is worth noting the significant
dispersion among the maturity segments within the Treasury market, as
the one- to three-year portion was essentially flat for the month and the
five- to ten-year segment gained only 2.1%. The Federal Reserve’s
Operation Twist is scheduled to be completed at the end of June, with
$45 billion in additional purchases focused on nominal Treasuries
maturing in eight years or more. It remains to be seen how the market
will react when this source of demand ceases, but we note that the next
Federal Reserve meeting is scheduled for June 20th, and several market
participants have dramatically raised the possibility for another round of
quantitative easing. Ten-year U.S. Treasuries ended May at their lowest
level on record according to Bloomberg data, while the 30-year yield was
essentially in line with the record low reached in December 2008. In
contrast to long U.S. Treasuries, gold dropped sharply in May. This
represented the fourth straight monthly decline, which is the first such
streak since 1999. Gold’s status as a hedge against uncertainty has been
in question of late, and the precious metal has recently traded more
closely in line with other commodities. This trend may have been first
seen in September 2011, when gold declined 11.1% amidst European
sovereign worries and an equity market decline. The strengthening USD,
sales by investors to fund short-term capital needs, and/or concerns over
current prices after multi-year increases all likely contributed to the drop
in gold prices. However, without an income stream or fundamental use
for the precious metal, valuation metrics are speculative and we remain
skeptical of gold’s role as a reliable hedge for the total portfolio.
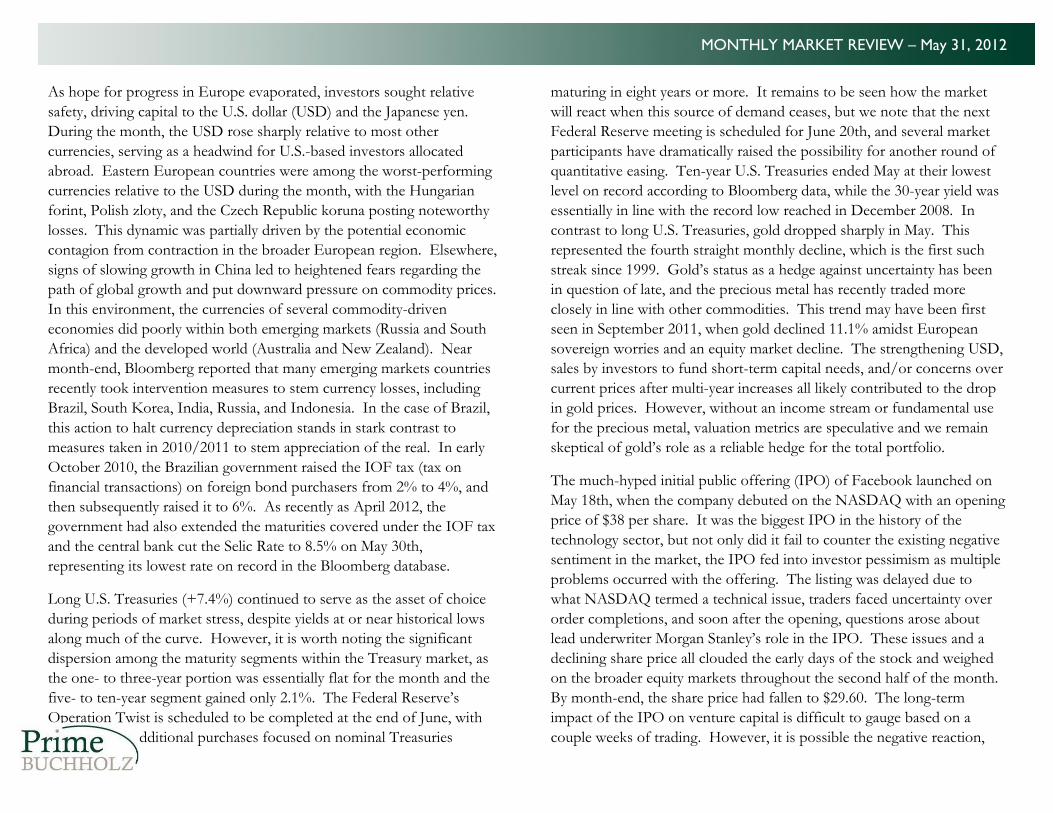
The much-hyped initial public offering (IPO) of Facebook launched on
May 18th, when the company debuted on the NASDAQ with an opening
price of $38 per share. It was the biggest IPO in the history of the
technology sector, but not only did it fail to counter the existing negative
sentiment in the market, the IPO fed into investor pessimism as multiple
problems occurred with the offering. The listing was delayed due to
what NASDAQ termed a technical issue, traders faced uncertainty over
order completions, and soon after the opening, questions arose about
lead underwriter Morgan Stanley’s role in the IPO. These issues and a
declining share price all clouded the early days of the stock and weighed
on the broader equity markets throughout the second half of the month.
By month-end, the share price had fallen to $29.60. The long-term
impact of the IPO on venture capital is difficult to gauge based on a
couple weeks of trading. However, it is possible the negative reaction,
MONTHLY MARKET REVIEW – May 31, 2012
coupled with market volatility following the robust IPO period of the
first quarter 2012, could lead to a slowdown in technology-related IPO
activity similar to that of 2011. For example, soon after the Facebook
IPO, Kayak Software Corporation shelved its IPO plans for the time
being.
-30%
-25%
-20%
-15%
-10%
-5%
0%
5%
Facebook IPO – Cumulative Return through May 31, 2012
Indices referenced are unmanaged and cannot be invested in directly. Index returns do not reflect any investment management fees or transaction expenses. Past performance is not an
indication of future results. This report is intended for informational purposes only; it does not constitute an offer, nor does it invite anyone to make an offer to buy or sell securities.
Information herein has been obtained from third-party sources that are believed to be reliable; however, the accuracy of the data is not guaranteed and may not have been independently
verified. The content of this report is current as of the date indicated and is subject to change without notice. It does not take into account the specific investment objectives, financial situations,
or needs of individual or institutional investors. All commentary contained within is the opinion of Prime Buchholz and intended solely for our clients. Unless otherwise noted, Bloomberg was the
source for data used in this report.
ABOUT PRIME BUCHHOLZ
Prime, Buchholz & Associates, Inc. was established in 1988 and has grown to become
a leading, uniquely independent investment advisory firm providing comprehensive
investment solutions for more than 260 institutional clients. Headquartered in
Portsmouth, NH—with offices in Boston and Atlanta—Prime Buchholz was one of the
first investment advisors to develop in-depth expertise in alternative investments such
as hedge funds, private equity, and real assets.
Our clients include educational endowments, private and public foundations, cultural
and faith-based organizations, health care and insurance organizations, pension plans,
and high net worth families. We work closely with our clients to create, implement,
and monitor investment policies and asset allocation strategies to meet their unique
investment goals.
Long-term client partnerships are a cornerstone at Prime Buchholz. We are
employee-owned, and clients can expect personal service from a deeply experienced
team that puts client needs first.
www.primebuchholz.com Tel: 603.433.1143
-3
0
3
6
9
12
15Historical U.S. Inflation
Core CPI Index CPI YOY Index
0
5
10
15
20
25
30
Historical Trailing PE
S&P 500 MSCI EAFE MSCI EM
MACRO ENVIRONMENT
(%)
MONTHLY MARKET REVIEW – May 31, 2012
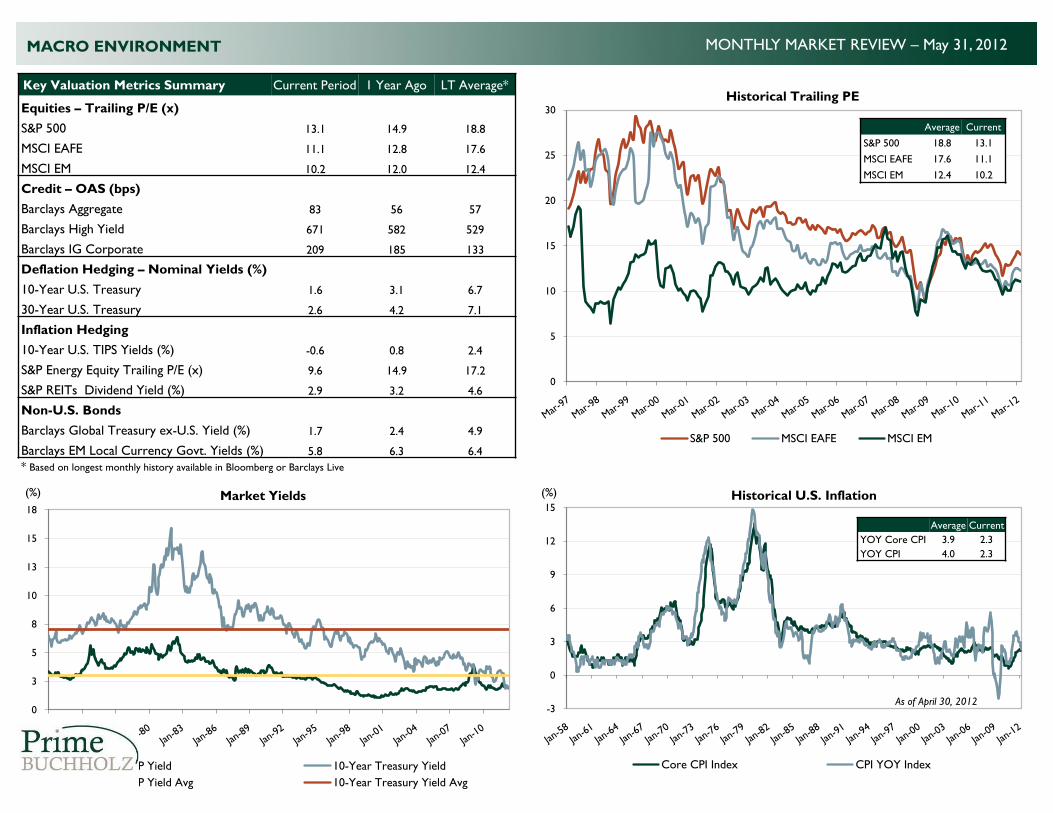
Key Valuation Metrics Summary Current Period 1 Year Ago LT Average*
Equities – Trailing P/E (x)
S&P 500 13.1 14.9 18.8
MSCI EAFE 11.1 12.8 17.6
MSCI EM 10.2 12.0 12.4
Credit – OAS (bps)
Barclays Aggregate 83 56 57
Barclays High Yield 671 582 529
Barclays IG Corporate 209 185 133
Deflation Hedging – Nominal Yields (%)
10-Year U.S. Treasury 1.6 3.1 6.7
30-Year U.S. Treasury 2.6 4.2 7.1
Inflation Hedging
10-Year U.S. TIPS Yields (%) -0.6 0.8 2.4
S&P Energy Equity Trailing P/E (x) 9.6 14.9 17.2
S&P REITs Dividend Yield (%) 2.9 3.2 4.6
Non-U.S. Bonds
Barclays Global Treasury ex-U.S. Yield (%) 1.7 2.4 4.9
Barclays EM Local Currency Govt. Yields (%) 5.8 6.3 6.4
* Based on longest monthly history available in Bloomberg or Barclays Live
Average Current
S&P 500 18.8 13.1
MSCI EAFE 17.6 11.1
MSCI EM 12.4 10.2
(%)
Average Current
YOY Core CPI 3.9 2.3
YOY CPI 4.0 2.3
As of April 30, 20120
3
5
8
10
13
15
18
Market Yields
S&P Yield 10-Year Treasury Yield
S&P Yield Avg 10-Year Treasury Yield Avg

0.0
0.5
1.0
1.5
2.0
2.5
3.0Market Inflation Forecast
U.S. Breakeven 10-Year Index U.S. Breakeven 10-Year Index Avg.
0
5
10
15
20
25
Historical Central Bank Policy Rates
BOJ BOE ECB Fed
-15
-10
-5
0
5
10
15
20
Quarterly U.S. GDP Growth
-40
-30
-20
-10
0
10
20
30
40
50
60
70
Year-Over-Year U.S. Corporate Profits(%)(%)
(%)
MACRO ENVIRONMENT MONTHLY MARKET REVIEW – May 31, 2012
(%)
As of March 31, 2012As of March 31, 2012Source: Federal Reserve
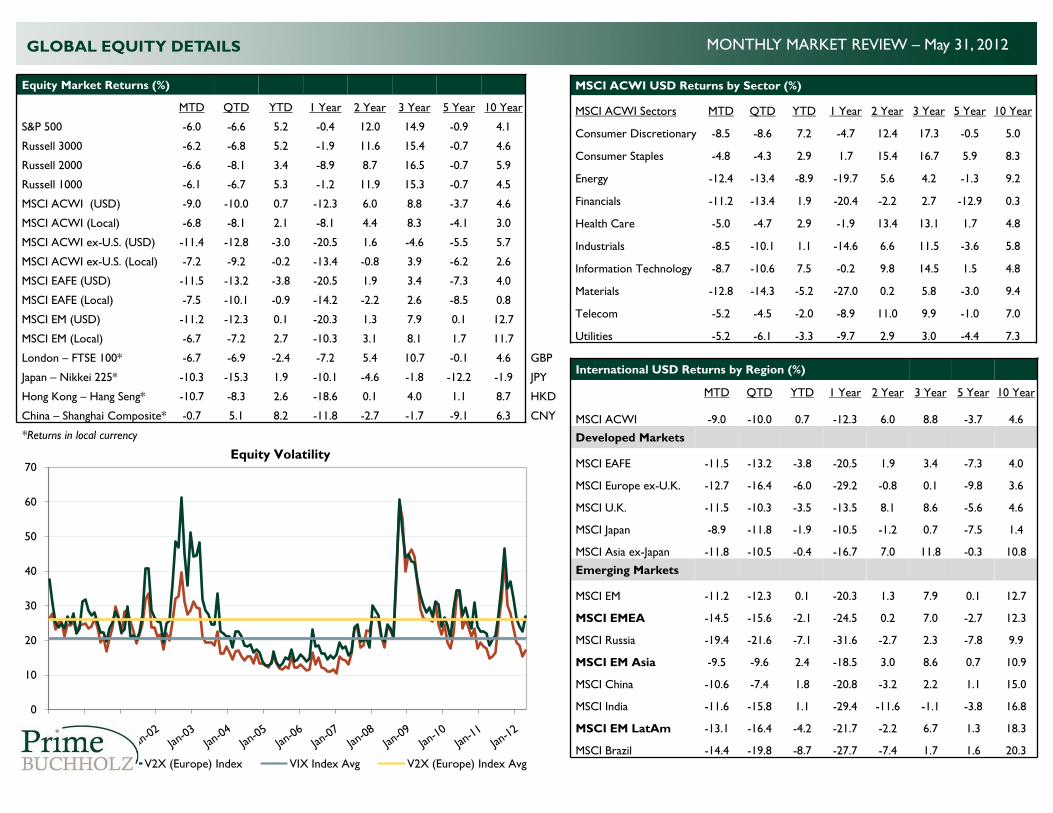
International USD Returns by Region (%)
MTD QTD YTD 1 Year 2 Year 3 Year 5 Year 10 Year
MSCI ACWI -9.0 -10.0 0.7 -12.3 6.0 8.8 -3.7 4.6
Developed Markets
MSCI EAFE -11.5 -13.2 -3.8 -20.5 1.9 3.4 -7.3 4.0
MSCI Europe ex-U.K. -12.7 -16.4 -6.0 -29.2 -0.8 0.1 -9.8 3.6
MSCI U.K. -11.5 -10.3 -3.5 -13.5 8.1 8.6 -5.6 4.6
MSCI Japan -8.9 -11.8 -1.9 -10.5 -1.2 0.7 -7.5 1.4
MSCI Asia ex-Japan -11.8 -10.5 -0.4 -16.7 7.0 11.8 -0.3 10.8
Emerging Markets
MSCI EM -11.2 -12.3 0.1 -20.3 1.3 7.9 0.1 12.7
MSCI EMEA -14.5 -15.6 -2.1 -24.5 0.2 7.0 -2.7 12.3
MSCI Russia -19.4 -21.6 -7.1 -31.6 -2.7 2.3 -7.8 9.9
MSCI EM Asia -9.5 -9.6 2.4 -18.5 3.0 8.6 0.7 10.9
MSCI China -10.6 -7.4 1.8 -20.8 -3.2 2.2 1.1 15.0
MSCI India -11.6 -15.8 1.1 -29.4 -11.6 -1.1 -3.8 16.8
MSCI EM LatAm -13.1 -16.4 -4.2 -21.7 -2.2 6.7 1.3 18.3
MSCI Brazil -14.4 -19.8 -8.7 -27.7 -7.4 1.7 1.6 20.3
MSCI ACWI USD Returns by Sector (%)
MSCI ACWI Sectors MTD QTD YTD 1 Year 2 Year 3 Year 5 Year 10 Year
Consumer Discretionary -8.5 -8.6 7.2 -4.7 12.4 17.3 -0.5 5.0
Consumer Staples -4.8 -4.3 2.9 1.7 15.4 16.7 5.9 8.3
Energy -12.4 -13.4 -8.9 -19.7 5.6 4.2 -1.3 9.2
Financials -11.2 -13.4 1.9 -20.4 -2.2 2.7 -12.9 0.3
Health Care -5.0 -4.7 2.9 -1.9 13.4 13.1 1.7 4.8
Industrials -8.5 -10.1 1.1 -14.6 6.6 11.5 -3.6 5.8
Information Technology -8.7 -10.6 7.5 -0.2 9.8 14.5 1.5 4.8
Materials -12.8 -14.3 -5.2 -27.0 0.2 5.8 -3.0 9.4
Telecom -5.2 -4.5 -2.0 -8.9 11.0 9.9 -1.0 7.0
Utilities -5.2 -6.1 -3.3 -9.7 2.9 3.0 -4.4 7.3
Equity Market Returns (%)
MTD QTD YTD 1 Year 2 Year 3 Year 5 Year 10 Year
S&P 500 -6.0 -6.6 5.2 -0.4 12.0 14.9 -0.9 4.1
Russell 3000 -6.2 -6.8 5.2 -1.9 11.6 15.4 -0.7 4.6
Russell 2000 -6.6 -8.1 3.4 -8.9 8.7 16.5 -0.7 5.9
Russell 1000 -6.1 -6.7 5.3 -1.2 11.9 15.3 -0.7 4.5
MSCI ACWI (USD) -9.0 -10.0 0.7 -12.3 6.0 8.8 -3.7 4.6
MSCI ACWI (Local) -6.8 -8.1 2.1 -8.1 4.4 8.3 -4.1 3.0
MSCI ACWI ex-U.S. (USD) -11.4 -12.8 -3.0 -20.5 1.6 -4.6 -5.5 5.7
MSCI ACWI ex-U.S. (Local) -7.2 -9.2 -0.2 -13.4 -0.8 3.9 -6.2 2.6
MSCI EAFE (USD) -11.5 -13.2 -3.8 -20.5 1.9 3.4 -7.3 4.0
MSCI EAFE (Local) -7.5 -10.1 -0.9 -14.2 -2.2 2.6 -8.5 0.8
MSCI EM (USD) -11.2 -12.3 0.1 -20.3 1.3 7.9 0.1 12.7
MSCI EM (Local) -6.7 -7.2 2.7 -10.3 3.1 8.1 1.7 11.7
London – FTSE 100* -6.7 -6.9 -2.4 -7.2 5.4 10.7 -0.1 4.6 GBP
Japan – Nikkei 225* -10.3 -15.3 1.9 -10.1 -4.6 -1.8 -12.2 -1.9 JPY
Hong Kong – Hang Seng* -10.7 -8.3 2.6 -18.6 0.1 4.0 1.1 8.7 HKD
China – Shanghai Composite* -0.7 5.1 8.2 -11.8 -2.7 -1.7 -9.1 6.3 CNY
*Returns in local currency
GLOBAL EQUITY DETAILS MONTHLY MARKET REVIEW – May 31, 2012
0
10
20
30
40
50
60
70Equity Volatility
VIX Index V2X (Europe) Index VIX Index Avg V2X (Europe) Index Avg
0
1,000
2,000
3,000
4,000
5,000
6,000
0%
5%
10%
15%
20%
25%
30%
35%
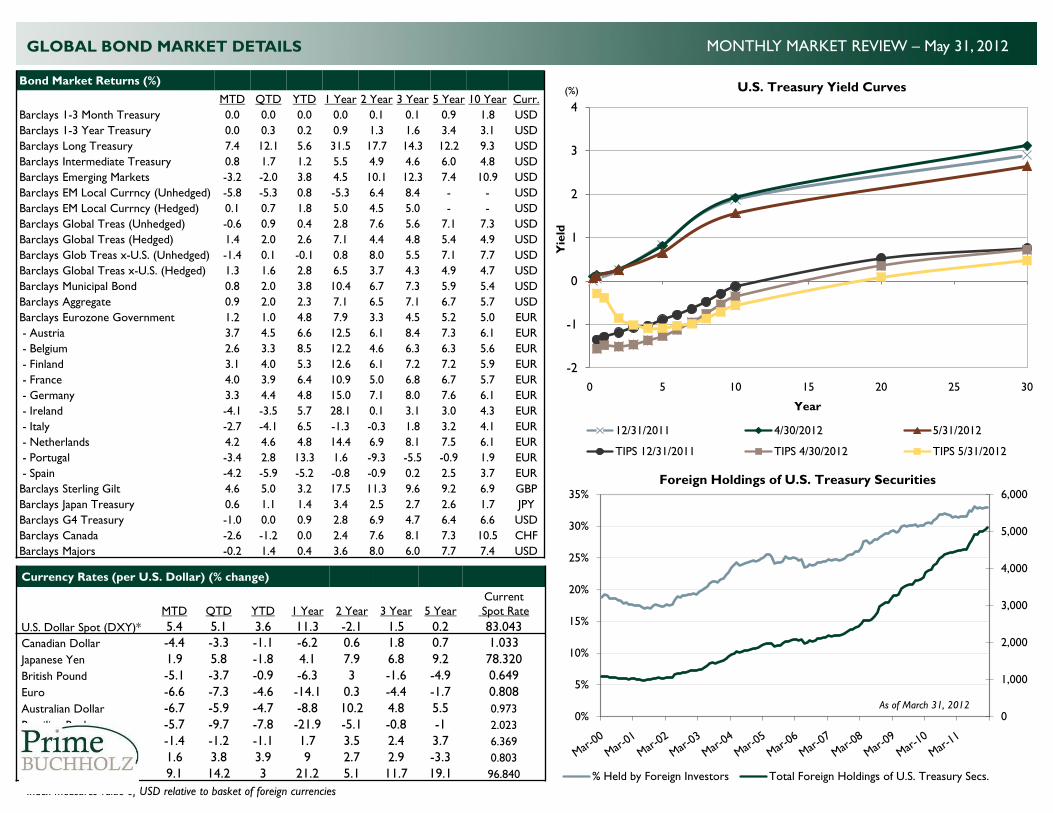
Foreign Holdings of U.S. Treasury Securities
% Held by Foreign Investors Total Foreign Holdings of U.S. Treasury Secs.
As of March 31, 2012
Currency Rates (per U.S. Dollar) (% change)
MTD QTD YTD 1 Year 2 Year 3 Year 5 Year
Current
Spot Rate
U.S. Dollar Spot (DXY)* 5.4 5.1 3.6 11.3 -2.1 1.5 0.2 83.043
Canadian Dollar -4.4 -3.3 -1.1 -6.2 0.6 1.8 0.7 1.033
Japanese Yen 1.9 5.8 -1.8 4.1 7.9 6.8 9.2 78.320
British Pound -5.1 -3.7 -0.9 -6.3 3 -1.6 -4.9 0.649
Euro -6.6 -7.3 -4.6 -14.1 0.3 -4.4 -1.7 0.808
Australian Dollar -6.7 -5.9 -4.7 -8.8 10.2 4.8 5.5 0.973
Brazilian Real -5.7 -9.7 -7.8 -21.9 -5.1 -0.8 -1 2.023
Chinese Yuan/Renminbi -1.4 -1.2 -1.1 1.7 3.5 2.4 3.7 6.369
GBP/Euro 1.6 3.8 3.9 9 2.7 2.9 -3.3 0.803
Yen/Euro 9.1 14.2 3 21.2 5.1 11.7 19.1 96.840
*Index measures value of USD relative to basket of foreign currencies
Bond Market Returns (%)
MTD QTD YTD 1 Year 2 Year 3 Year 5 Year 10 Year Curr.
Barclays 1-3 Month Treasury 0.0 0.0 0.0 0.0 0.1 0.1 0.9 1.8 USD
Barclays 1-3 Year Treasury 0.0 0.3 0.2 0.9 1.3 1.6 3.4 3.1 USD
Barclays Long Treasury 7.4 12.1 5.6 31.5 17.7 14.3 12.2 9.3 USD
Barclays Intermediate Treasury 0.8 1.7 1.2 5.5 4.9 4.6 6.0 4.8 USD
Barclays Emerging Markets -3.2 -2.0 3.8 4.5 10.1 12.3 7.4 10.9 USD
Barclays EM Local Currncy (Unhedged) -5.8 -5.3 0.8 -5.3 6.4 8.4 - - USD
Barclays EM Local Currncy (Hedged) 0.1 0.7 1.8 5.0 4.5 5.0 - - USD
Barclays Global Treas (Unhedged) -0.6 0.9 0.4 2.8 7.6 5.6 7.1 7.3 USD
Barclays Global Treas (Hedged) 1.4 2.0 2.6 7.1 4.4 4.8 5.4 4.9 USD
Barclays Glob Treas x-U.S. (Unhedged) -1.4 0.1 -0.1 0.8 8.0 5.5 7.1 7.7 USD
Barclays Global Treas x-U.S. (Hedged) 1.3 1.6 2.8 6.5 3.7 4.3 4.9 4.7 USD
Barclays Municipal Bond 0.8 2.0 3.8 10.4 6.7 7.3 5.9 5.4 USD
Barclays Aggregate 0.9 2.0 2.3 7.1 6.5 7.1 6.7 5.7 USD
Barclays Eurozone Government 1.2 1.0 4.8 7.9 3.3 4.5 5.2 5.0 EUR
- Austria 3.7 4.5 6.6 12.5 6.1 8.4 7.3 6.1 EUR
- Belgium 2.6 3.3 8.5 12.2 4.6 6.3 6.3 5.6 EUR
- Finland 3.1 4.0 5.3 12.6 6.1 7.2 7.2 5.9 EUR
- France 4.0 3.9 6.4 10.9 5.0 6.8 6.7 5.7 EUR
- Germany 3.3 4.4 4.8 15.0 7.1 8.0 7.6 6.1 EUR
- Ireland -4.1 -3.5 5.7 28.1 0.1 3.1 3.0 4.3 EUR
- Italy -2.7 -4.1 6.5 -1.3 -0.3 1.8 3.2 4.1 EUR
- Netherlands 4.2 4.6 4.8 14.4 6.9 8.1 7.5 6.1 EUR
- Portugal -3.4 2.8 13.3 1.6 -9.3 -5.5 -0.9 1.9 EUR
- Spain -4.2 -5.9 -5.2 -0.8 -0.9 0.2 2.5 3.7 EUR
Barclays Sterling Gilt 4.6 5.0 3.2 17.5 11.3 9.6 9.2 6.9 GBP
Barclays Japan Treasury 0.6 1.1 1.4 3.4 2.5 2.7 2.6 1.7 JPY
Barclays G4 Treasury -1.0 0.0 0.9 2.8 6.9 4.7 6.4 6.6 USD
Barclays Canada -2.6 -1.2 0.0 2.4 7.6 8.1 7.3 10.5 CHF
Barclays Majors -0.2 1.4 0.4 3.6 8.0 6.0 7.7 7.4 USD
MONTHLY MARKET REVIEW – May 31, 2012GLOBAL BOND MARKET DETAILS
-2
-1
0
1
2
3
4
0 5 10 15 20 25 30
Yie
ld
Year
U.S. Treasury Yield Curves
12/31/2011 4/30/2012 5/31/2012
TIPS 12/31/2011 TIPS 4/30/2012 TIPS 5/31/2012
(%)
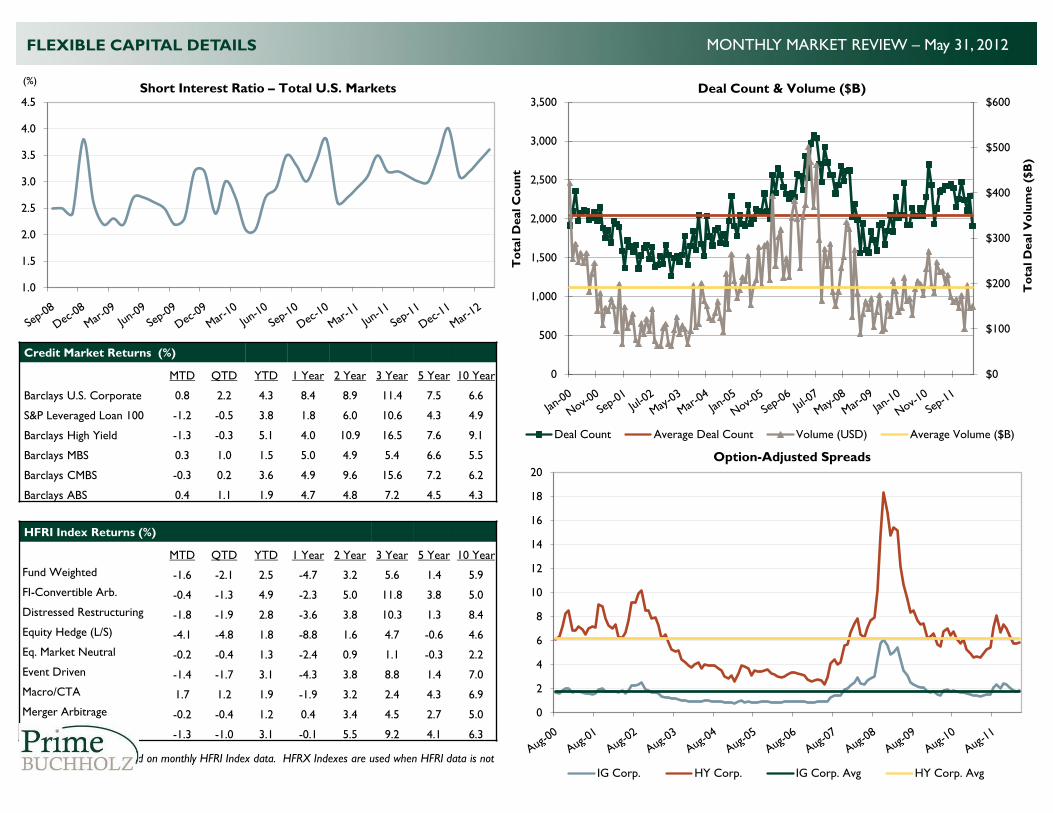
Credit Market Returns (%)
MTD QTD YTD 1 Year 2 Year 3 Year 5 Year 10 Year
Barclays U.S. Corporate 0.8 2.2 4.3 8.4 8.9 11.4 7.5 6.6
S&P Leveraged Loan 100 -1.2 -0.5 3.8 1.8 6.0 10.6 4.3 4.9
Barclays High Yield -1.3 -0.3 5.1 4.0 10.9 16.5 7.6 9.1
Barclays MBS 0.3 1.0 1.5 5.0 4.9 5.4 6.6 5.5
Barclays CMBS -0.3 0.2 3.6 4.9 9.6 15.6 7.2 6.2
Barclays ABS 0.4 1.1 1.9 4.7 4.8 7.2 4.5 4.3
HFRI Index Returns (%)
MTD QTD YTD 1 Year 2 Year 3 Year 5 Year 10 Year
Fund Weighted -1.6 -2.1 2.5 -4.7 3.2 5.6 1.4 5.9
FI-Convertible Arb. -0.4 -1.3 4.9 -2.3 5.0 11.8 3.8 5.0
Distressed Restructuring -1.8 -1.9 2.8 -3.6 3.8 10.3 1.3 8.4
Equity Hedge (L/S) -4.1 -4.8 1.8 -8.8 1.6 4.7 -0.6 4.6
Eq. Market Neutral -0.2 -0.4 1.3 -2.4 0.9 1.1 -0.3 2.2
Event Driven -1.4 -1.7 3.1 -4.3 3.8 8.8 1.4 7.0
Macro/CTA 1.7 1.2 1.9 -1.9 3.2 2.4 4.3 6.9
Merger Arbitrage -0.2 -0.4 1.2 0.4 3.4 4.5 2.7 5.0
Relative Value Arb. -1.3 -1.0 3.1 -0.1 5.5 9.2 4.1 6.3
NOTE: Returns are based on monthly HFRI Index data. HFRX Indexes are used when HFRI data is not
available.
MONTHLY MARKET REVIEW – May 31, 2012FLEXIBLE CAPITAL DETAILS
0
2
4
6
8
10
12
14
16
18
20
Option-Adjusted Spreads
IG Corp. HY Corp. IG Corp. Avg HY Corp. Avg
1.0
1.5
2.0
2.5
3.0
3.5
4.0
4.5Short Interest Ratio – Total U.S. Markets
(%)
$0
$100
$200
$300
$400
$500
$600
0
500
1,000
1,500
2,000
2,500
3,000
3,500
To
tal D
eal V
olu
me (
$B
)
To
tal D
eal C
ou
nt
Deal Count & Volume ($B)
Deal Count Average Deal Count Volume (USD) Average Volume ($B)
0
2
4
6
8
10
12
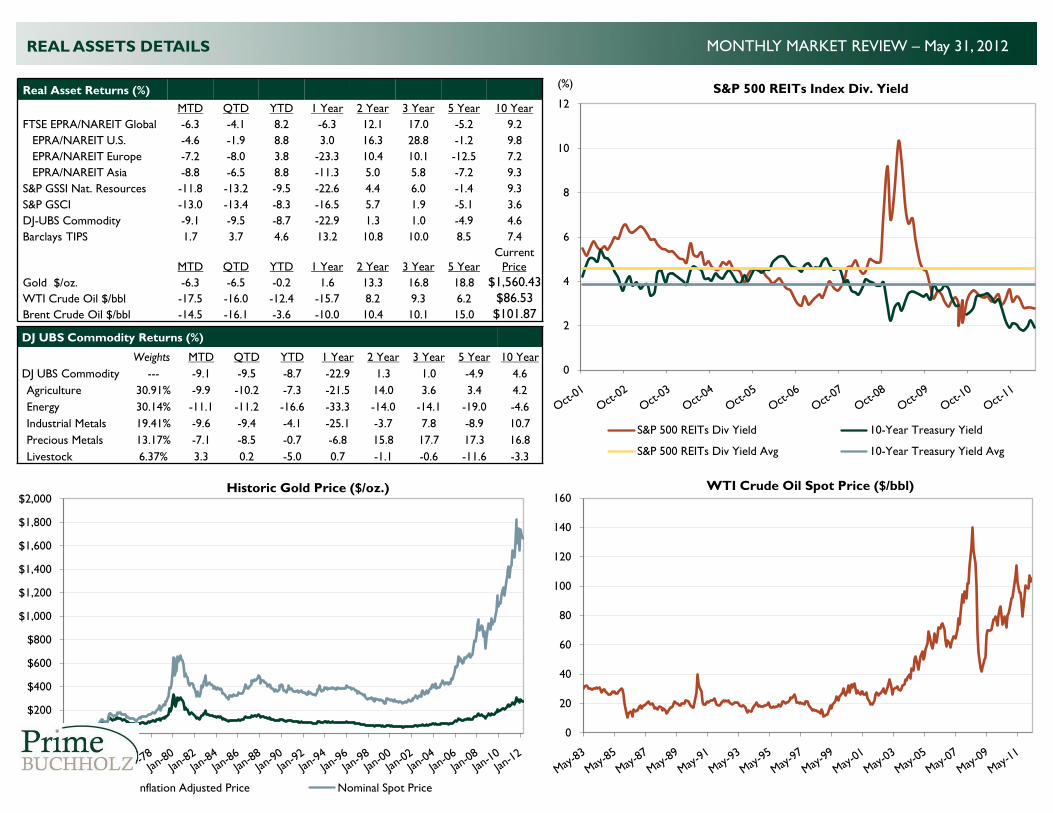
S&P 500 REITs Index Div. Yield
S&P 500 REITs Div Yield 10-Year Treasury Yield
S&P 500 REITs Div Yield Avg 10-Year Treasury Yield Avg
Real Asset Returns (%)
MTD QTD YTD 1 Year 2 Year 3 Year 5 Year 10 Year
FTSE EPRA/NAREIT Global -6.3 -4.1 8.2 -6.3 12.1 17.0 -5.2 9.2
EPRA/NAREIT U.S. -4.6 -1.9 8.8 3.0 16.3 28.8 -1.2 9.8
EPRA/NAREIT Europe -7.2 -8.0 3.8 -23.3 10.4 10.1 -12.5 7.2
EPRA/NAREIT Asia -8.8 -6.5 8.8 -11.3 5.0 5.8 -7.2 9.3
S&P GSSI Nat. Resources -11.8 -13.2 -9.5 -22.6 4.4 6.0 -1.4 9.3
S&P GSCI -13.0 -13.4 -8.3 -16.5 5.7 1.9 -5.1 3.6
DJ-UBS Commodity -9.1 -9.5 -8.7 -22.9 1.3 1.0 -4.9 4.6
Barclays TIPS 1.7 3.7 4.6 13.2 10.8 10.0 8.5 7.4
MTD QTD YTD 1 Year 2 Year 3 Year 5 Year
Current
Price
Gold $/oz. -6.3 -6.5 -0.2 1.6 13.3 16.8 18.8 $1,560.43
WTI Crude Oil $/bbl -17.5 -16.0 -12.4 -15.7 8.2 9.3 6.2 $86.53
Brent Crude Oil $/bbl -14.5 -16.1 -3.6 -10.0 10.4 10.1 15.0 $101.87
MONTHLY MARKET REVIEW – May 31, 2012
DJ UBS Commodity Returns (%)
Weights MTD QTD YTD 1 Year 2 Year 3 Year 5 Year 10 Year
DJ UBS Commodity --- -9.1 -9.5 -8.7 -22.9 1.3 1.0 -4.9 4.6
Agriculture 30.91% -9.9 -10.2 -7.3 -21.5 14.0 3.6 3.4 4.2
Energy 30.14% -11.1 -11.2 -16.6 -33.3 -14.0 -14.1 -19.0 -4.6
Industrial Metals 19.41% -9.6 -9.4 -4.1 -25.1 -3.7 7.8 -8.9 10.7
Precious Metals 13.17% -7.1 -8.5 -0.7 -6.8 15.8 17.7 17.3 16.8
Livestock 6.37% 3.3 0.2 -5.0 0.7 -1.1 -0.6 -11.6 -3.3
REAL ASSETS DETAILS
(%)
$0
$200
$400
$600
$800
$1,000
$1,200
$1,400
$1,600
$1,800
$2,000Historic Gold Price ($/oz.)
Inflation Adjusted Price Nominal Spot Price
0
20
40
60
80
100
120
140
160WTI Crude Oil Spot Price ($/bbl)
4
MONTHLY MARKET REVIEW – May 31, 2012
Mergers and Acquisitions (M&A) is a general term used to refer to the
consolidation of companies. A merger is a combination of two companies to form a
new company, while an acquisition is the purchase of one company by another in which
no new company is formed. ―Deal count‖ and ―volume‖ each quantify the mergers and
acquisitions activity occurring within a given time period. Deal count represents the
actual number of deals that were completed each month, while ―volume‖ represents the
total dollar value of the deals that were completed during the month. The premium is
the difference between the actual cost for acquiring a target firm versus the estimate
made of its value before the acquisition.
Short Interest Ratio is an indicator that is derived by dividing the short interest by
the average daily volume for a stock. This indicator is used by both fundamental and
technical traders to identify the prevailing sentiment the market has for a specific stock.
U.S. Corporate Profits is a statistic reported quarterly by the Bureau of Economic
Analysis (BEA) that summarizes the net income of corporations in the National Income
and Product Accounts (NIPA). Corporate profits are an economic indicator
that calculates net income using several different measures: profits from current
production; book profits, and after-tax profits.
Barclays Aggregate Index comprises government securities, mortgage-backed
securities, asset-backed securities, and corporate securities to simulate the universe of
bonds in the market. The maturities of the bonds in the Index are over one year.
Barclays Global Treasury ex-U.S. Index includes government bonds issued by
investment-grade countries outside the United States, in local currencies, that have a
remaining maturity of one year or more and are rated investment grade.
Barclays U.S. TIPS Index is a rules-based, market value-weighted Index that tracks
inflation protected securities issued by the U.S. Treasury.
Chicago Board Options Exchange Volatility Index (VIX) measures traders'
expectations of volatility in the stock market by tracking bid/ask quotes on the Standard
& Poor's 500 Stock Index.
DJ-UBS Commodity Index is composed of futures contracts on physical
commodities. It is composed of commodities traded on U.S. exchanges, with the
exception of aluminum, nickel, and zinc, which trade on the London Metal Exchange
(LME).
FTSE EPRA/NAREIT Developed Index is designed to represent general trends in
eligible real estate equities worldwide. Relevant real estate activities are defined as the
ownership, disposure, and development of income-producing real estate. The Index
series includes a range of regional and country indices.
HFRX Equity Market Neutral Index is designed to reflect the performance of
Equity Market Neutral strategies which employ sophisticated quantitative techniques of
analyzing price data to ascertain information about future price movement and
relationships between securities and select securities for purchase and sale. These can
include both Factor-based and Statistical Arbitrage/Trading strategies. Equity Market
Neutral Strategies typically maintain net equity market exposure no greater than 10%
long or short.
HFRX Global Hedge Index is designed to be representative of the overall
composition of the hedge fund universe. It is comprised of eight strategies: convertible
arbitrage, distressed securities, equity, equity market neutral, event-driven, macro,
merger arbitrage, and relative value arbitrage.
HFRX Relative Value Arbitrage Index is designed to represent investment
managers who maintain positions in which the investment thesis is predicated on
realization of a valuation discrepancy in the relationship between multiple securities.
MSCI ACWI (All Country World Index) Index is a free float-adjusted market
capitalization weighted index that is designed to measure the equity market
performance of developed and emerging markets. The Index consists of a mix of
developed and emerging market country indices.
MSCI China Index is a free float-adjusted market capitalization weighted index that is
designed to measure the equity market performance of Chinese companies listed on the
Hong Kong exchange, which are frequently referred to as H shares.
MSCI EAFE Net Index is a free float-adjusted market capitalization index that is
designed to measure the equity market performance of developed markets, excluding
the U.S. & Canada.
MSCI EM (Emerging Markets) Index is a free float-adjusted market capitalization
index that is designed to measure equity market performance of emerging markets.
Russell 3000 Index measures the performance of the largest 3,000 U.S. companies,
representing approximately 98% of the investable U.S. equity market.
Russell 3000 Growth Index measures the performance of the broad growth segment
of the U.S. equity universe. It includes those Russell 3000 companies with higher price-
to-book ratios and higher forecasted growth values.
Russell 3000 Value Index measures the performance of the broad value segment of
U.S. equity value universe. It includes those Russell 3000 companies with lower price-
to-book ratios and lower forecasted growth values.
Russell Midcap Index measures the performance of the mid cap segment of the U.S.
equity universe. The Index is a subset of the Russell 1000 Index. It includes
approximately 800 of the smallest securities based on a combination of their market cap
and current Index membership.
S&P 500 Index is a gauge of the U.S. equities market and includes 500 leading
companies in leading industries of the U.S. economy.
U.S. Dollar Index indicates the general international value of the U.S. dollar (USD) by
averaging the exchange rates between the USD and six major world currencies.
INDEX DESCRIPTIONS
MK12014_060712 © 2012 Prime, Buchholz & Associates, Inc.
MarketValue
% ofPortfolio 1 Mo. 3 Mo.
FiscalYTD
CalendarYTD 1 YR 3 YRS 5 YRS 10 YRS
ReturnSince
InceptionDate
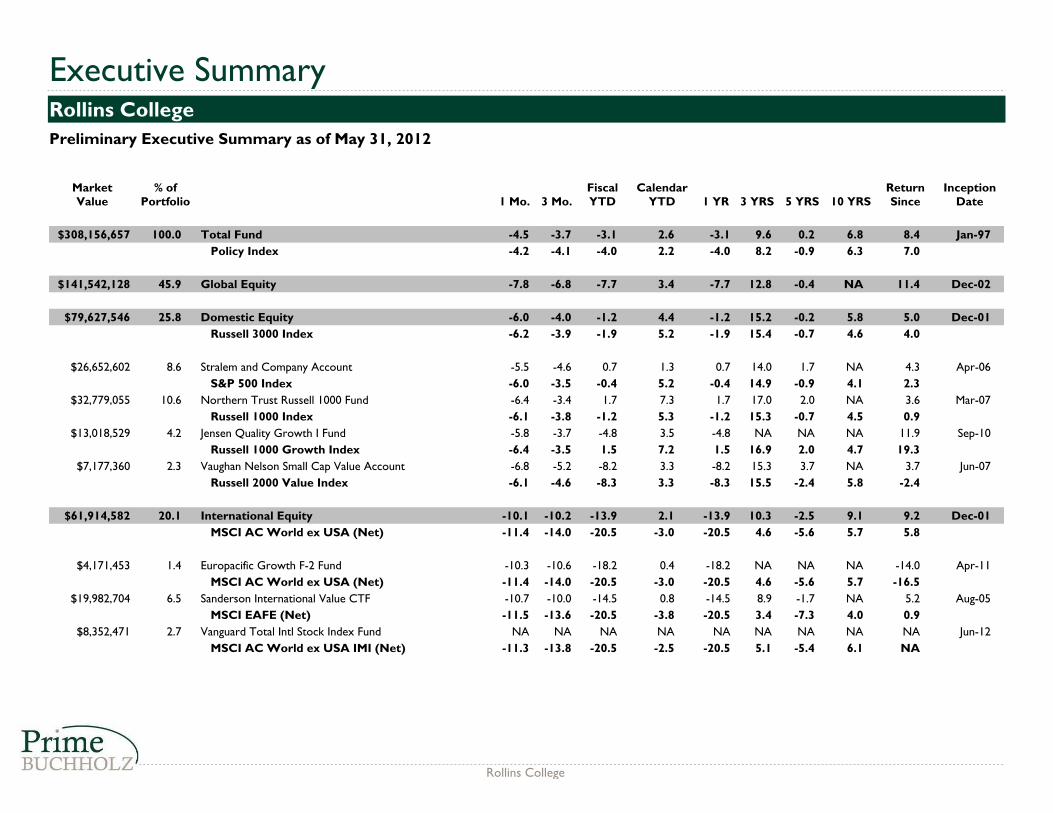
$308,156,657 100.0 Total Fund -4.5 -3.7 -3.1 2.6 -3.1 9.6 0.2 6.8 8.4 Jan-97
Policy Index -4.2 -4.1 -4.0 2.2 -4.0 8.2 -0.9 6.3 7.0
$141,542,128 45.9 Global Equity -7.8 -6.8 -7.7 3.4 -7.7 12.8 -0.4 NA 11.4 Dec-02
$79,627,546 25.8 Domestic Equity -6.0 -4.0 -1.2 4.4 -1.2 15.2 -0.2 5.8 5.0 Dec-01
Russell 3000 Index -6.2 -3.9 -1.9 5.2 -1.9 15.4 -0.7 4.6 4.0
$26,652,602 8.6 Stralem and Company Account -5.5 -4.6 0.7 1.3 0.7 14.0 1.7 NA 4.3 Apr-06
S&P 500 Index -6.0 -3.5 -0.4 5.2 -0.4 14.9 -0.9 4.1 2.3
$32,779,055 10.6 Northern Trust Russell 1000 Fund -6.4 -3.4 1.7 7.3 1.7 17.0 2.0 NA 3.6 Mar-07
Russell 1000 Index -6.1 -3.8 -1.2 5.3 -1.2 15.3 -0.7 4.5 0.9
$13,018,529 4.2 Jensen Quality Growth I Fund -5.8 -3.7 -4.8 3.5 -4.8 NA NA NA 11.9 Sep-10
Russell 1000 Growth Index -6.4 -3.5 1.5 7.2 1.5 16.9 2.0 4.7 19.3
$7,177,360 2.3 Vaughan Nelson Small Cap Value Account -6.8 -5.2 -8.2 3.3 -8.2 15.3 3.7 NA 3.7 Jun-07
Russell 2000 Value Index -6.1 -4.6 -8.3 3.3 -8.3 15.5 -2.4 5.8 -2.4
$61,914,582 20.1 International Equity -10.1 -10.2 -13.9 2.1 -13.9 10.3 -2.5 9.1 9.2 Dec-01
MSCI AC World ex USA (Net) -11.4 -14.0 -20.5 -3.0 -20.5 4.6 -5.6 5.7 5.8
$4,171,453 1.4 Europacific Growth F-2 Fund -10.3 -10.6 -18.2 0.4 -18.2 NA NA NA -14.0 Apr-11
MSCI AC World ex USA (Net) -11.4 -14.0 -20.5 -3.0 -20.5 4.6 -5.6 5.7 -16.5
$19,982,704 6.5 Sanderson International Value CTF -10.7 -10.0 -14.5 0.8 -14.5 8.9 -1.7 NA 5.2 Aug-05
MSCI EAFE (Net) -11.5 -13.6 -20.5 -3.8 -20.5 3.4 -7.3 4.0 0.9
$8,352,471 2.7 Vanguard Total Intl Stock Index Fund NA NA NA NA NA NA NA NA NA Jun-12
MSCI AC World ex USA IMI (Net) -11.3 -13.8 -20.5 -2.5 -20.5 5.1 -5.4 6.1 NA
Executive SummaryRollins College
Preliminary Executive Summary as of May 31, 2012
Rollins College
Executive SummaryRollins College
Preliminary Executive Summary as of May 31, 2012
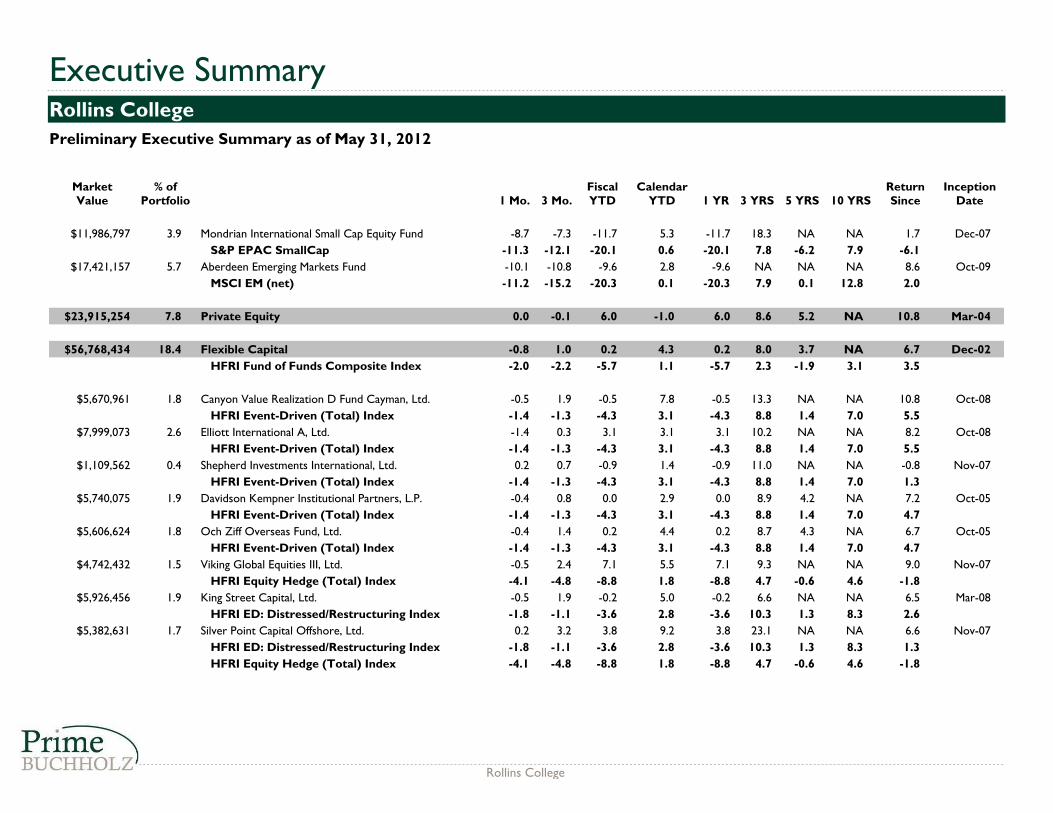
MarketValue
% ofPortfolio 1 Mo. 3 Mo.
FiscalYTD
CalendarYTD 1 YR 3 YRS 5 YRS 10 YRS
ReturnSince
InceptionDate
$11,986,797 3.9 Mondrian International Small Cap Equity Fund -8.7 -7.3 -11.7 5.3 -11.7 18.3 NA NA 1.7 Dec-07
S&P EPAC SmallCap -11.3 -12.1 -20.1 0.6 -20.1 7.8 -6.2 7.9 -6.1
$17,421,157 5.7 Aberdeen Emerging Markets Fund -10.1 -10.8 -9.6 2.8 -9.6 NA NA NA 8.6 Oct-09
MSCI EM (net) -11.2 -15.2 -20.3 0.1 -20.3 7.9 0.1 12.8 2.0
$23,915,254 7.8 Private Equity 0.0 -0.1 6.0 -1.0 6.0 8.6 5.2 NA 10.8 Mar-04
$56,768,434 18.4 Flexible Capital -0.8 1.0 0.2 4.3 0.2 8.0 3.7 NA 6.7 Dec-02
HFRI Fund of Funds Composite Index -2.0 -2.2 -5.7 1.1 -5.7 2.3 -1.9 3.1 3.5
$5,670,961 1.8 Canyon Value Realization D Fund Cayman, Ltd. -0.5 1.9 -0.5 7.8 -0.5 13.3 NA NA 10.8 Oct-08
HFRI Event-Driven (Total) Index -1.4 -1.3 -4.3 3.1 -4.3 8.8 1.4 7.0 5.5
$7,999,073 2.6 Elliott International A, Ltd. -1.4 0.3 3.1 3.1 3.1 10.2 NA NA 8.2 Oct-08
HFRI Event-Driven (Total) Index -1.4 -1.3 -4.3 3.1 -4.3 8.8 1.4 7.0 5.5
$1,109,562 0.4 Shepherd Investments International, Ltd. 0.2 0.7 -0.9 1.4 -0.9 11.0 NA NA -0.8 Nov-07
HFRI Event-Driven (Total) Index -1.4 -1.3 -4.3 3.1 -4.3 8.8 1.4 7.0 1.3
$5,740,075 1.9 Davidson Kempner Institutional Partners, L.P. -0.4 0.8 0.0 2.9 0.0 8.9 4.2 NA 7.2 Oct-05
HFRI Event-Driven (Total) Index -1.4 -1.3 -4.3 3.1 -4.3 8.8 1.4 7.0 4.7
$5,606,624 1.8 Och Ziff Overseas Fund, Ltd. -0.4 1.4 0.2 4.4 0.2 8.7 4.3 NA 6.7 Oct-05
HFRI Event-Driven (Total) Index -1.4 -1.3 -4.3 3.1 -4.3 8.8 1.4 7.0 4.7
$4,742,432 1.5 Viking Global Equities III, Ltd. -0.5 2.4 7.1 5.5 7.1 9.3 NA NA 9.0 Nov-07
HFRI Equity Hedge (Total) Index -4.1 -4.8 -8.8 1.8 -8.8 4.7 -0.6 4.6 -1.8
$5,926,456 1.9 King Street Capital, Ltd. -0.5 1.9 -0.2 5.0 -0.2 6.6 NA NA 6.5 Mar-08
HFRI ED: Distressed/Restructuring Index -1.8 -1.1 -3.6 2.8 -3.6 10.3 1.3 8.3 2.6
$5,382,631 1.7 Silver Point Capital Offshore, Ltd. 0.2 3.2 3.8 9.2 3.8 23.1 NA NA 6.6 Nov-07
HFRI ED: Distressed/Restructuring Index -1.8 -1.1 -3.6 2.8 -3.6 10.3 1.3 8.3 1.3
HFRI Equity Hedge (Total) Index -4.1 -4.8 -8.8 1.8 -8.8 4.7 -0.6 4.6 -1.8
Rollins College
Executive SummaryRollins College
Preliminary Executive Summary as of May 31, 2012
MarketValue
% ofPortfolio 1 Mo. 3 Mo.
FiscalYTD
CalendarYTD 1 YR 3 YRS 5 YRS 10 YRS
ReturnSince
InceptionDate
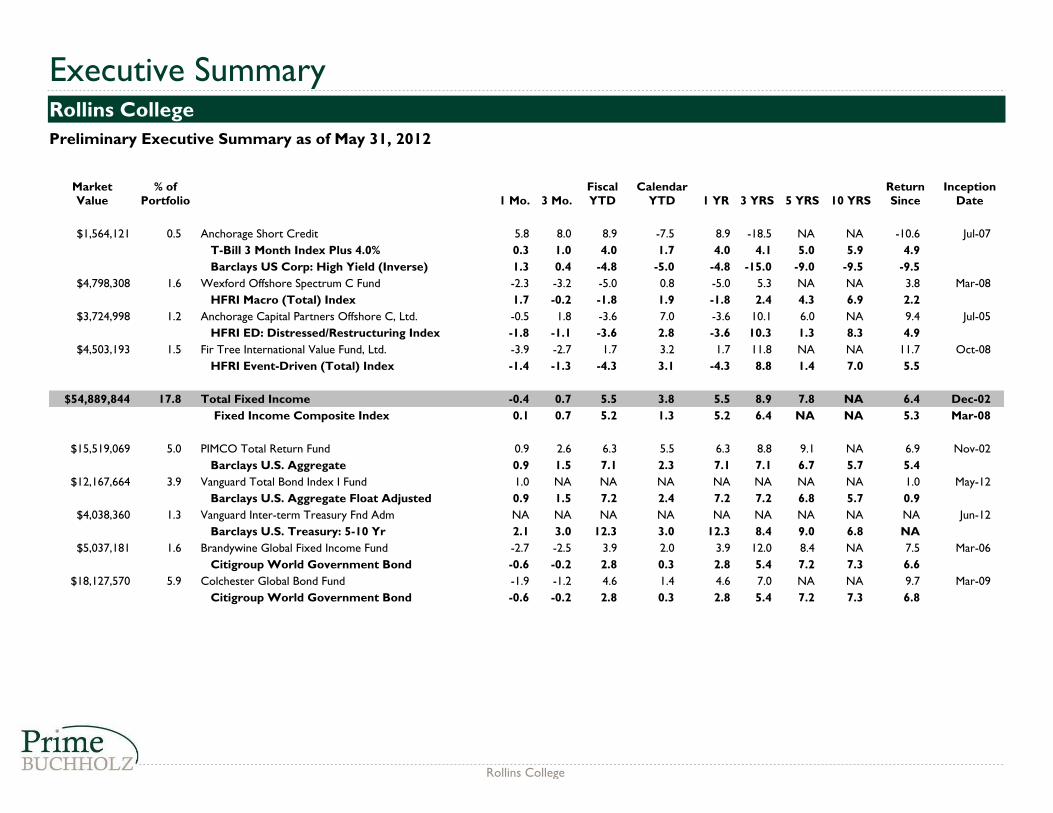
$1,564,121 0.5 Anchorage Short Credit 5.8 8.0 8.9 -7.5 8.9 -18.5 NA NA -10.6 Jul-07
T-Bill 3 Month Index Plus 4.0% 0.3 1.0 4.0 1.7 4.0 4.1 5.0 5.9 4.9
Barclays US Corp: High Yield (Inverse) 1.3 0.4 -4.8 -5.0 -4.8 -15.0 -9.0 -9.5 -9.5
$4,798,308 1.6 Wexford Offshore Spectrum C Fund -2.3 -3.2 -5.0 0.8 -5.0 5.3 NA NA 3.8 Mar-08
HFRI Macro (Total) Index 1.7 -0.2 -1.8 1.9 -1.8 2.4 4.3 6.9 2.2
$3,724,998 1.2 Anchorage Capital Partners Offshore C, Ltd. -0.5 1.8 -3.6 7.0 -3.6 10.1 6.0 NA 9.4 Jul-05
HFRI ED: Distressed/Restructuring Index -1.8 -1.1 -3.6 2.8 -3.6 10.3 1.3 8.3 4.9
$4,503,193 1.5 Fir Tree International Value Fund, Ltd. -3.9 -2.7 1.7 3.2 1.7 11.8 NA NA 11.7 Oct-08
HFRI Event-Driven (Total) Index -1.4 -1.3 -4.3 3.1 -4.3 8.8 1.4 7.0 5.5
$54,889,844 17.8 Total Fixed Income -0.4 0.7 5.5 3.8 5.5 8.9 7.8 NA 6.4 Dec-02
Fixed Income Composite Index 0.1 0.7 5.2 1.3 5.2 6.4 NA NA 5.3 Mar-08
$15,519,069 5.0 PIMCO Total Return Fund 0.9 2.6 6.3 5.5 6.3 8.8 9.1 NA 6.9 Nov-02
Barclays U.S. Aggregate 0.9 1.5 7.1 2.3 7.1 7.1 6.7 5.7 5.4
$12,167,664 3.9 Vanguard Total Bond Index I Fund 1.0 NA NA NA NA NA NA NA 1.0 May-12
Barclays U.S. Aggregate Float Adjusted 0.9 1.5 7.2 2.4 7.2 7.2 6.8 5.7 0.9
$4,038,360 1.3 Vanguard Inter-term Treasury Fnd Adm NA NA NA NA NA NA NA NA NA Jun-12
Barclays U.S. Treasury: 5-10 Yr 2.1 3.0 12.3 3.0 12.3 8.4 9.0 6.8 NA
$5,037,181 1.6 Brandywine Global Fixed Income Fund -2.7 -2.5 3.9 2.0 3.9 12.0 8.4 NA 7.5 Mar-06
Citigroup World Government Bond -0.6 -0.2 2.8 0.3 2.8 5.4 7.2 7.3 6.6
$18,127,570 5.9 Colchester Global Bond Fund -1.9 -1.2 4.6 1.4 4.6 7.0 NA NA 9.7 Mar-09
Citigroup World Government Bond -0.6 -0.2 2.8 0.3 2.8 5.4 7.2 7.3 6.8
Rollins College
Executive SummaryRollins College
Preliminary Executive Summary as of May 31, 2012
MarketValue
% ofPortfolio 1 Mo. 3 Mo.
FiscalYTD
CalendarYTD 1 YR 3 YRS 5 YRS 10 YRS
ReturnSince
InceptionDate
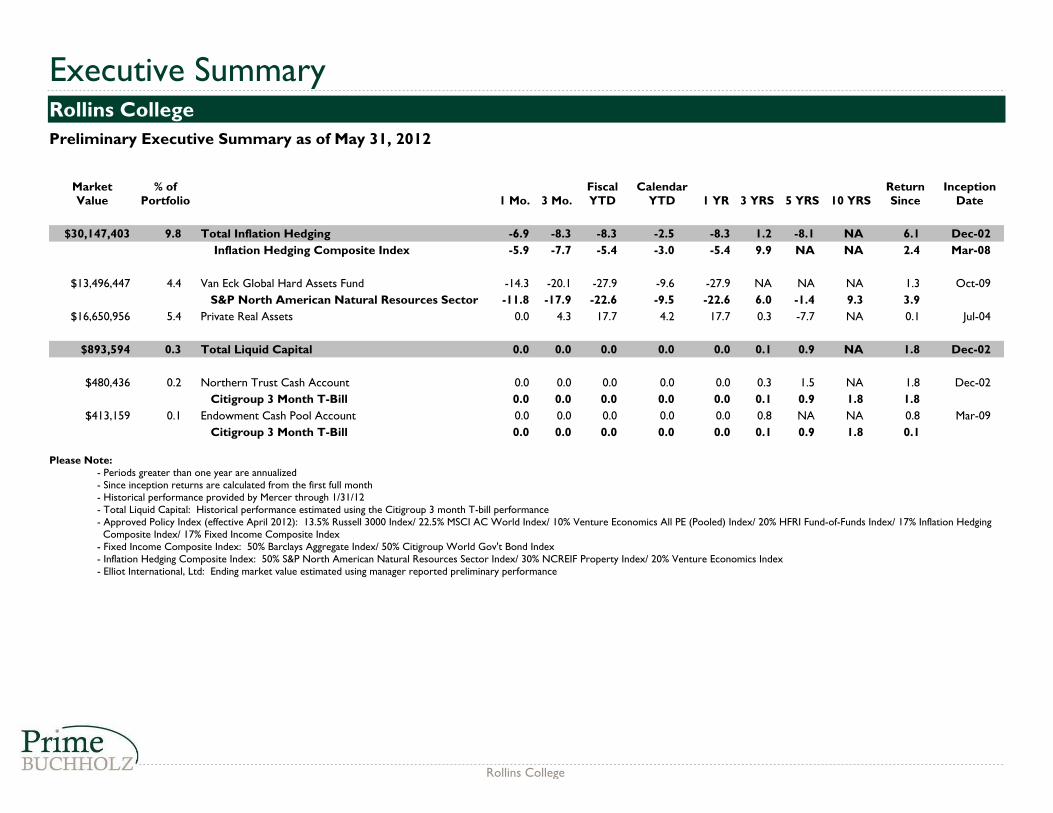
$30,147,403 9.8 Total Inflation Hedging -6.9 -8.3 -8.3 -2.5 -8.3 1.2 -8.1 NA 6.1 Dec-02
Inflation Hedging Composite Index -5.9 -7.7 -5.4 -3.0 -5.4 9.9 NA NA 2.4 Mar-08
$13,496,447 4.4 Van Eck Global Hard Assets Fund -14.3 -20.1 -27.9 -9.6 -27.9 NA NA NA 1.3 Oct-09
S&P North American Natural Resources Sector -11.8 -17.9 -22.6 -9.5 -22.6 6.0 -1.4 9.3 3.9
$16,650,956 5.4 Private Real Assets 0.0 4.3 17.7 4.2 17.7 0.3 -7.7 NA 0.1 Jul-04
$893,594 0.3 Total Liquid Capital 0.0 0.0 0.0 0.0 0.0 0.1 0.9 NA 1.8 Dec-02
$480,436 0.2 Northern Trust Cash Account 0.0 0.0 0.0 0.0 0.0 0.3 1.5 NA 1.8 Dec-02
Citigroup 3 Month T-Bill 0.0 0.0 0.0 0.0 0.0 0.1 0.9 1.8 1.8
$413,159 0.1 Endowment Cash Pool Account 0.0 0.0 0.0 0.0 0.0 0.8 NA NA 0.8 Mar-09
Citigroup 3 Month T-Bill 0.0 0.0 0.0 0.0 0.0 0.1 0.9 1.8 0.1
Please Note:- Periods greater than one year are annualized- Since inception returns are calculated from the first full month- Historical performance provided by Mercer through 1/31/12- Total Liquid Capital: Historical performance estimated using the Citigroup 3 month T-bill performance- Approved Policy Index (effective April 2012): 13.5% Russell 3000 Index/ 22.5% MSCI AC World Index/ 10% Venture Economics All PE (Pooled) Index/ 20% HFRI Fund-of-Funds Index/ 17% Inflation Hedging Composite Index/ 17% Fixed Income Composite Index- Fixed Income Composite Index: 50% Barclays Aggregate Index/ 50% Citigroup World Gov't Bond Index- Inflation Hedging Composite Index: 50% S&P North American Natural Resources Sector Index/ 30% NCREIF Property Index/ 20% Venture Economics Index- Elliot International, Ltd: Ending market value estimated using manager reported preliminary performance
Rollins College
CapitalCommitment
CommitmentDate
CapitalContributed
%Funded
RemainingCommitment
CapitalReturned
MarketValue
Net Growthof Portfolio
DPIMultiple
TVPIMultiple
IRR(%)
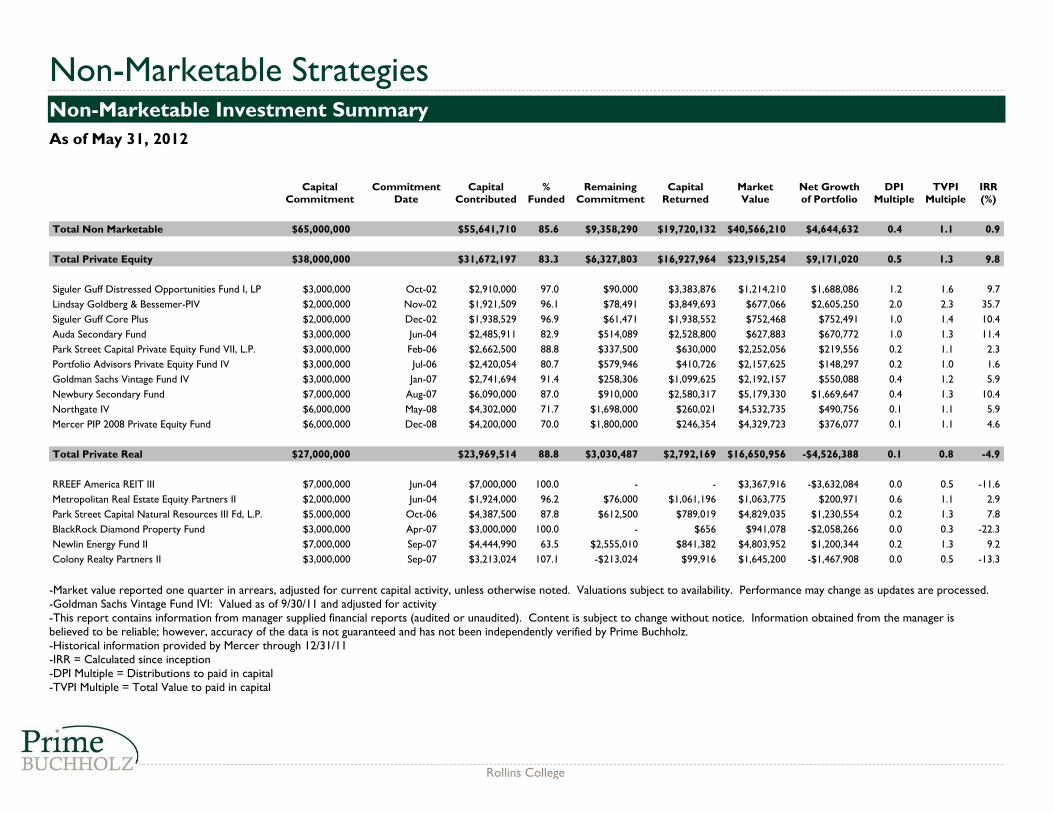
Total Non Marketable $65,000,000 $55,641,710 85.6 $9,358,290 $19,720,132 $40,566,210 $4,644,632 0.4 1.1 0.9
Total Private Equity $38,000,000 $31,672,197 83.3 $6,327,803 $16,927,964 $23,915,254 $9,171,020 0.5 1.3 9.8
Siguler Guff Distressed Opportunities Fund I, LP $3,000,000 Oct-02 $2,910,000 97.0 $90,000 $3,383,876 $1,214,210 $1,688,086 1.2 1.6 9.7
Lindsay Goldberg & Bessemer-PIV $2,000,000 Nov-02 $1,921,509 96.1 $78,491 $3,849,693 $677,066 $2,605,250 2.0 2.3 35.7
Siguler Guff Core Plus $2,000,000 Dec-02 $1,938,529 96.9 $61,471 $1,938,552 $752,468 $752,491 1.0 1.4 10.4
Auda Secondary Fund $3,000,000 Jun-04 $2,485,911 82.9 $514,089 $2,528,800 $627,883 $670,772 1.0 1.3 11.4
Park Street Capital Private Equity Fund VII, L.P. $3,000,000 Feb-06 $2,662,500 88.8 $337,500 $630,000 $2,252,056 $219,556 0.2 1.1 2.3
Portfolio Advisors Private Equity Fund IV $3,000,000 Jul-06 $2,420,054 80.7 $579,946 $410,726 $2,157,625 $148,297 0.2 1.0 1.6
Goldman Sachs Vintage Fund IV $3,000,000 Jan-07 $2,741,694 91.4 $258,306 $1,099,625 $2,192,157 $550,088 0.4 1.2 5.9
Newbury Secondary Fund $7,000,000 Aug-07 $6,090,000 87.0 $910,000 $2,580,317 $5,179,330 $1,669,647 0.4 1.3 10.4
Northgate IV $6,000,000 May-08 $4,302,000 71.7 $1,698,000 $260,021 $4,532,735 $490,756 0.1 1.1 5.9
Mercer PIP 2008 Private Equity Fund $6,000,000 Dec-08 $4,200,000 70.0 $1,800,000 $246,354 $4,329,723 $376,077 0.1 1.1 4.6
Total Private Real $27,000,000 $23,969,514 88.8 $3,030,487 $2,792,169 $16,650,956 -$4,526,388 0.1 0.8 -4.9
RREEF America REIT III $7,000,000 Jun-04 $7,000,000 100.0 - - $3,367,916 -$3,632,084 0.0 0.5 -11.6
Metropolitan Real Estate Equity Partners II $2,000,000 Jun-04 $1,924,000 96.2 $76,000 $1,061,196 $1,063,775 $200,971 0.6 1.1 2.9
Park Street Capital Natural Resources III Fd, L.P. $5,000,000 Oct-06 $4,387,500 87.8 $612,500 $789,019 $4,829,035 $1,230,554 0.2 1.3 7.8
BlackRock Diamond Property Fund $3,000,000 Apr-07 $3,000,000 100.0 - $656 $941,078 -$2,058,266 0.0 0.3 -22.3
Newlin Energy Fund II $7,000,000 Sep-07 $4,444,990 63.5 $2,555,010 $841,382 $4,803,952 $1,200,344 0.2 1.3 9.2
Colony Realty Partners II $3,000,000 Sep-07 $3,213,024 107.1 -$213,024 $99,916 $1,645,200 -$1,467,908 0.0 0.5 -13.3
-Market value reported one quarter in arrears, adjusted for current capital activity, unless otherwise noted. Valuations subject to availability. Performance may change as updates are processed.-Goldman Sachs Vintage Fund IVI: Valued as of 9/30/11 and adjusted for activity-This report contains information from manager supplied financial reports (audited or unaudited). Content is subject to change without notice. Information obtained from the manager isbelieved to be reliable; however, accuracy of the data is not guaranteed and has not been independently verified by Prime Buchholz.-Historical information provided by Mercer through 12/31/11-IRR = Calculated since inception-DPI Multiple = Distributions to paid in capital-TVPI Multiple = Total Value to paid in capital
Non-Marketable StrategiesNon-Marketable Investment Summary
As of May 31, 2012
Rollins College
MarketValue
% ofPortfolio 1 Mo. 3 Mo.
FiscalYTD
CalendarYTD 1 YR 3 YRS 5 YRS 10 YRS
ReturnSince
InceptionDate
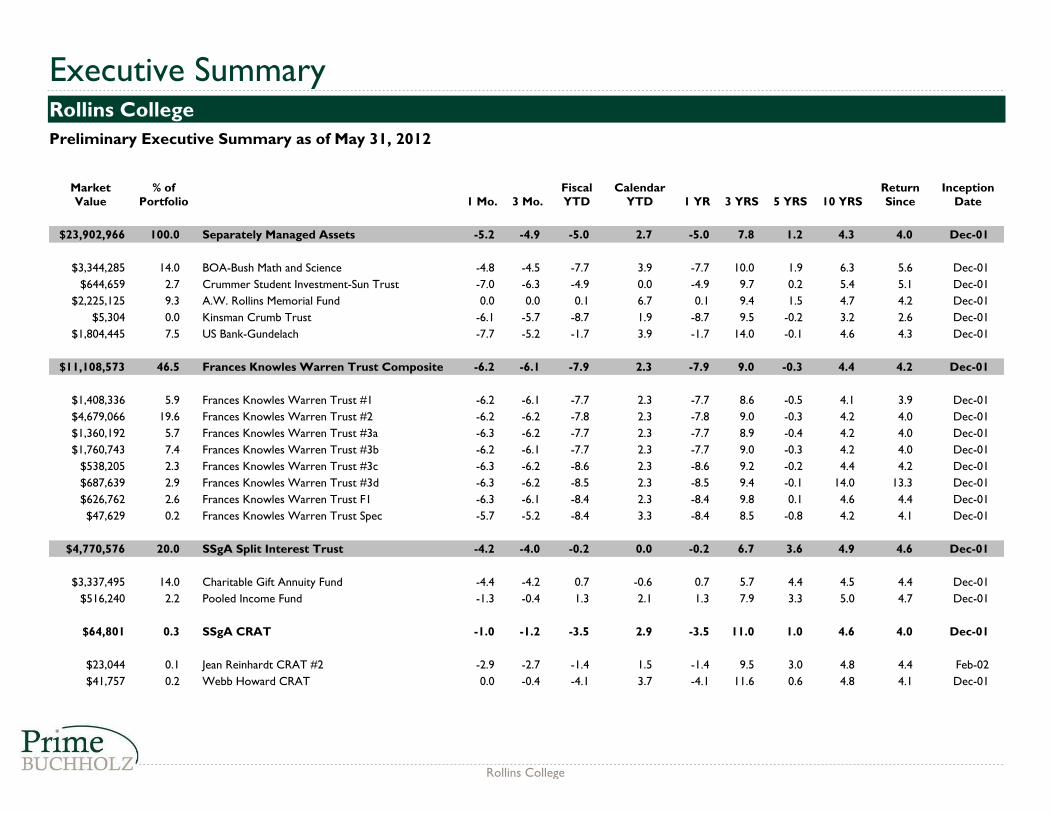
$23,902,966 100.0 Separately Managed Assets -5.2 -4.9 -5.0 2.7 -5.0 7.8 1.2 4.3 4.0 Dec-01
$3,344,285 14.0 BOA-Bush Math and Science -4.8 -4.5 -7.7 3.9 -7.7 10.0 1.9 6.3 5.6 Dec-01
$644,659 2.7 Crummer Student Investment-Sun Trust -7.0 -6.3 -4.9 0.0 -4.9 9.7 0.2 5.4 5.1 Dec-01
$2,225,125 9.3 A.W. Rollins Memorial Fund 0.0 0.0 0.1 6.7 0.1 9.4 1.5 4.7 4.2 Dec-01
$5,304 0.0 Kinsman Crumb Trust -6.1 -5.7 -8.7 1.9 -8.7 9.5 -0.2 3.2 2.6 Dec-01
$1,804,445 7.5 US Bank-Gundelach -7.7 -5.2 -1.7 3.9 -1.7 14.0 -0.1 4.6 4.3 Dec-01
$11,108,573 46.5 Frances Knowles Warren Trust Composite -6.2 -6.1 -7.9 2.3 -7.9 9.0 -0.3 4.4 4.2 Dec-01
$1,408,336 5.9 Frances Knowles Warren Trust #1 -6.2 -6.1 -7.7 2.3 -7.7 8.6 -0.5 4.1 3.9 Dec-01
$4,679,066 19.6 Frances Knowles Warren Trust #2 -6.2 -6.2 -7.8 2.3 -7.8 9.0 -0.3 4.2 4.0 Dec-01
$1,360,192 5.7 Frances Knowles Warren Trust #3a -6.3 -6.2 -7.7 2.3 -7.7 8.9 -0.4 4.2 4.0 Dec-01
$1,760,743 7.4 Frances Knowles Warren Trust #3b -6.2 -6.1 -7.7 2.3 -7.7 9.0 -0.3 4.2 4.0 Dec-01
$538,205 2.3 Frances Knowles Warren Trust #3c -6.3 -6.2 -8.6 2.3 -8.6 9.2 -0.2 4.4 4.2 Dec-01
$687,639 2.9 Frances Knowles Warren Trust #3d -6.3 -6.2 -8.5 2.3 -8.5 9.4 -0.1 14.0 13.3 Dec-01
$626,762 2.6 Frances Knowles Warren Trust F1 -6.3 -6.1 -8.4 2.3 -8.4 9.8 0.1 4.6 4.4 Dec-01
$47,629 0.2 Frances Knowles Warren Trust Spec -5.7 -5.2 -8.4 3.3 -8.4 8.5 -0.8 4.2 4.1 Dec-01
$4,770,576 20.0 SSgA Split Interest Trust -4.2 -4.0 -0.2 0.0 -0.2 6.7 3.6 4.9 4.6 Dec-01
$3,337,495 14.0 Charitable Gift Annuity Fund -4.4 -4.2 0.7 -0.6 0.7 5.7 4.4 4.5 4.4 Dec-01
$516,240 2.2 Pooled Income Fund -1.3 -0.4 1.3 2.1 1.3 7.9 3.3 5.0 4.7 Dec-01
$64,801 0.3 SSgA CRAT -1.0 -1.2 -3.5 2.9 -3.5 11.0 1.0 4.6 4.0 Dec-01
$23,044 0.1 Jean Reinhardt CRAT #2 -2.9 -2.7 -1.4 1.5 -1.4 9.5 3.0 4.8 4.4 Feb-02
$41,757 0.2 Webb Howard CRAT 0.0 -0.4 -4.1 3.7 -4.1 11.6 0.6 4.8 4.1 Dec-01
Executive SummaryRollins College
Preliminary Executive Summary as of May 31, 2012
Rollins College
Executive SummaryRollins College
Preliminary Executive Summary as of May 31, 2012
MarketValue
% ofPortfolio 1 Mo. 3 Mo.
FiscalYTD
CalendarYTD 1 YR 3 YRS 5 YRS 10 YRS
ReturnSince
InceptionDate
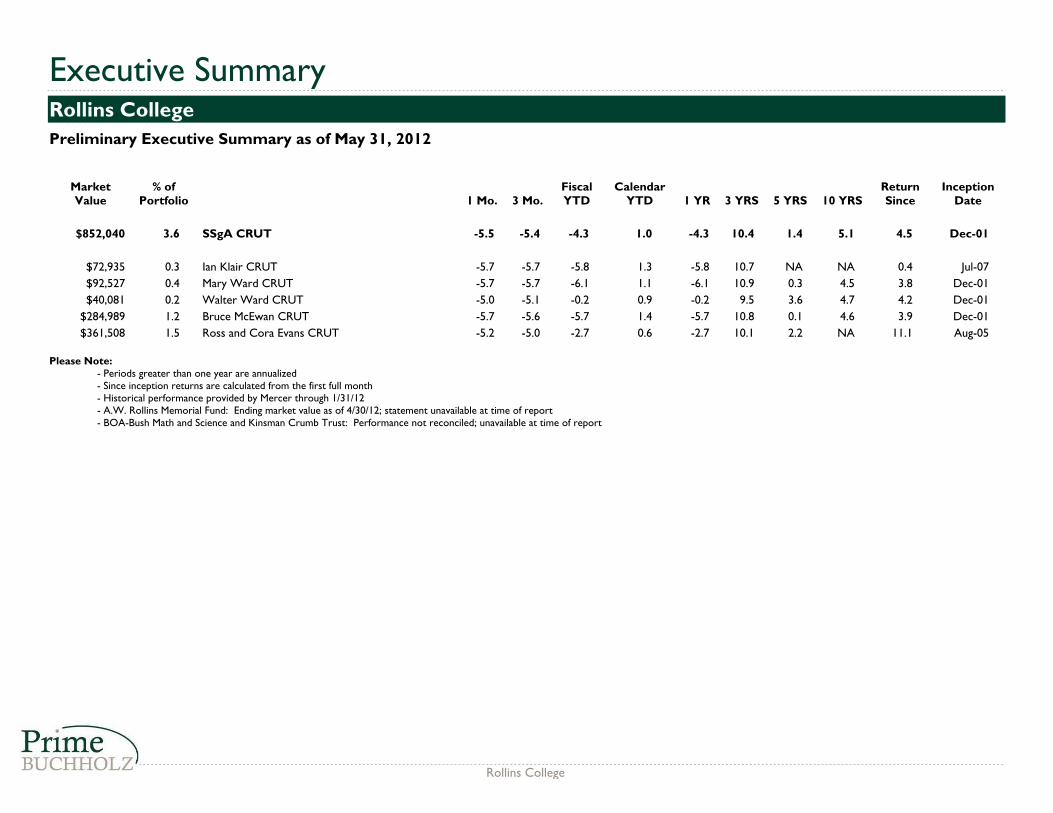
$852,040 3.6 SSgA CRUT -5.5 -5.4 -4.3 1.0 -4.3 10.4 1.4 5.1 4.5 Dec-01
$72,935 0.3 Ian Klair CRUT -5.7 -5.7 -5.8 1.3 -5.8 10.7 NA NA 0.4 Jul-07
$92,527 0.4 Mary Ward CRUT -5.7 -5.7 -6.1 1.1 -6.1 10.9 0.3 4.5 3.8 Dec-01
$40,081 0.2 Walter Ward CRUT -5.0 -5.1 -0.2 0.9 -0.2 9.5 3.6 4.7 4.2 Dec-01
$284,989 1.2 Bruce McEwan CRUT -5.7 -5.6 -5.7 1.4 -5.7 10.8 0.1 4.6 3.9 Dec-01
$361,508 1.5 Ross and Cora Evans CRUT -5.2 -5.0 -2.7 0.6 -2.7 10.1 2.2 NA 11.1 Aug-05
Please Note:- Periods greater than one year are annualized- Since inception returns are calculated from the first full month- Historical performance provided by Mercer through 1/31/12- A.W. Rollins Memorial Fund: Ending market value as of 4/30/12; statement unavailable at time of report- BOA-Bush Math and Science and Kinsman Crumb Trust: Performance not reconciled; unavailable at time of report
Rollins College
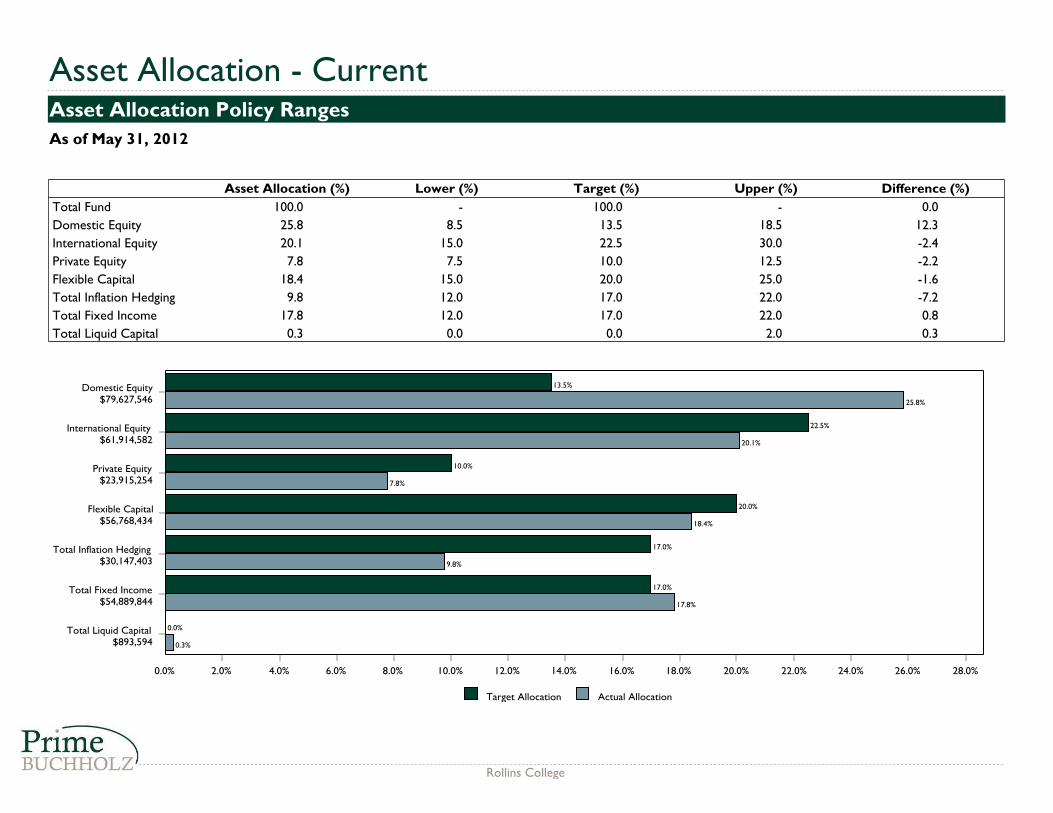
Asset Allocation (%) Lower (%) Target (%) Upper (%) Difference (%)
Total Fund 100.0 - 100.0 - 0.0
Domestic Equity 25.8 8.5 13.5 18.5 12.3
International Equity 20.1 15.0 22.5 30.0 -2.4
Private Equity 7.8 7.5 10.0 12.5 -2.2
Flexible Capital 18.4 15.0 20.0 25.0 -1.6
Total Inflation Hedging 9.8 12.0 17.0 22.0 -7.2
Total Fixed Income 17.8 12.0 17.0 22.0 0.8
Total Liquid Capital 0.3 0.0 0.0 2.0 0.3
Target Allocation Actual Allocation
0.0% 2.0% 4.0% 6.0% 8.0% 10.0% 12.0% 14.0% 16.0% 18.0% 20.0% 22.0% 24.0% 26.0% 28.0%
Total Liquid Capital$893,594
Total Fixed Income$54,889,844
Total Inflation Hedging$30,147,403
Flexible Capital$56,768,434
Private Equity$23,915,254
International Equity$61,914,582
Domestic Equity$79,627,546
0.0%
17.0%
17.0%
20.0%
10.0%
22.5%
13.5%
0.3%
17.8%
9.8%
18.4%
7.8%
20.1%
25.8%
Asset Allocation - CurrentAsset Allocation Policy Ranges
As of May 31, 2012
Rollins College