Embed Size (px)
Citation preview

Tissue Perfusion: It really is everything! 3/5/12 [email protected]
1
Monitoring Tissue Perfusion in ICCU:
B. McLean, MN, RN, CCRN, CCNS, ANP-BC, FCCM
Hemodynamic Monitoring Truth
• No monitoring device, no matter how simple or complex, invasive or non-invasive, inaccurate or precise will improve outcome • Unless coupled to a treatment, which itself improves outcome
Pinsky & Payen. FuncEonal Hemodynamic Monitoring, Springer, 2004
Goals For Monitoring
• To assure the adequacy of perfusion • Early detection of inadequacy of perfusion • To titrate therapy to specific hemodynamic
end point • To differentiate among various organ
system dysfunctions
Hemodynamic monitoring for individual pa4ent should be physiologically based and goal oriented.

Tissue Perfusion: It really is everything! 3/5/12 [email protected]
2
Hemodynamic monitors
• Traditional invasive monitors: Dynamic pressures and oxygenation
• Arterial line • CVP & ScvO2 • PA catheter, CCO, SvO2
• Functional pressure variation • Affected pressures and oxygenation
• Pulse pressure variation • Stroke volume variation • Tissue oxygenation
Goals for cardiocirculatory therapy
• ScvO2 >70% or SvO2 >65% • MAP (mean arterial pressure) >65 mmHg • Cardiac Index >2.0 l/min/m2 • CVP 8–15 mmHg (dependent on ventilation
mode) • SVV < 13 % • PAOP 12–15 mmHg • Diuresis >0.5 ml/kgBW/h • Lactate <3 mmol/l
GMS German Medical Science 2010, Vol. 8, pp 1-‐25 Carl,M. Alms,A. et al
Surrogate Monitoring • All left sided measures
– PAP – PaOP – CVP – B/P – RVEDVI/LVEDVI – RVSWI/LVSWI
Pinsky & Payen. FuncEonal Hemodynamic Monitoring, Springer, 2004

Tissue Perfusion: It really is everything! 3/5/12 [email protected]
3
Tissue Hypoxia
InflammaEon
Volume
Perfusion
Micro-‐ circulaEon
Multi Organ Failure
But it really is about the microcirculation
Functional Monitoring • Will cardiac output increase when volume given?
– How much? • State of vascular tone?
– Increased – Decreased – Normal
• Can the heart maintain cardiac output under pressure without failure?
Pinsky & Payen. FuncEonal Hemodynamic Monitoring, Springer, 2004
Review of physiology
Tissue Perfusion: It really is everything! 3/5/12 [email protected]
4
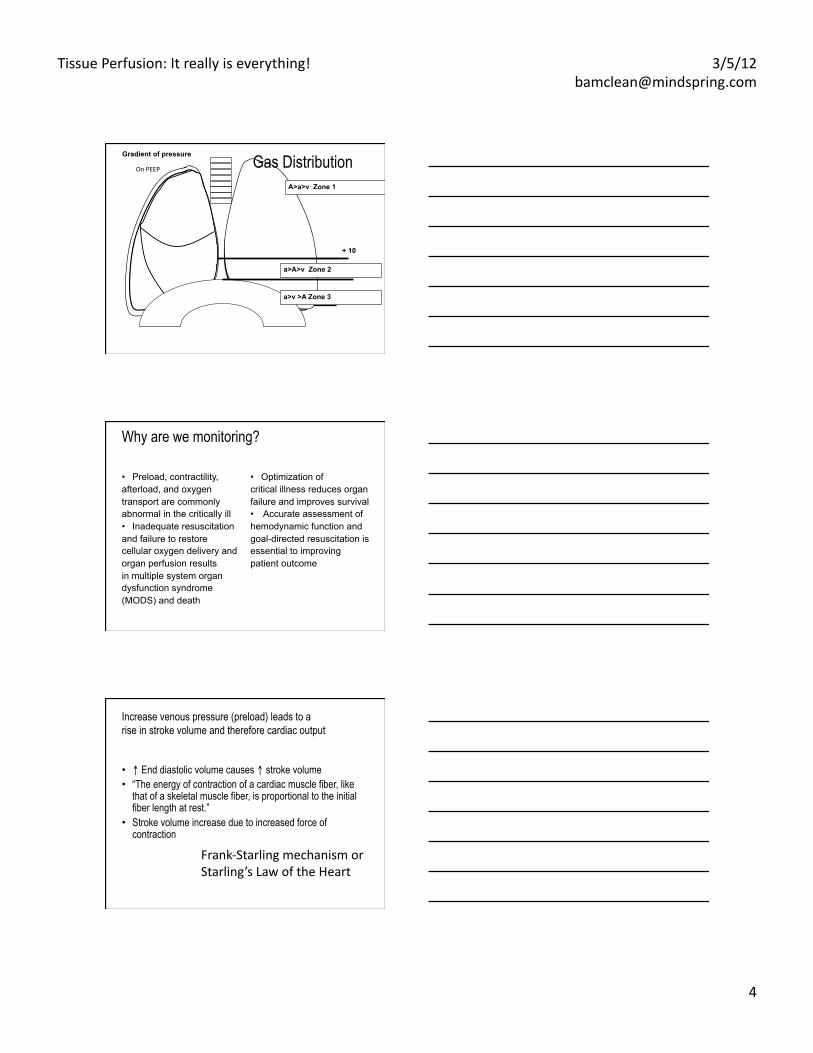
+ 10
Gradient of pressure Gas Distribution A>a>v Zone 1
a>A>v Zone 2
a>v >A Zone 3
On PEEP
Why are we monitoring?
• Preload, contractility, afterload, and oxygen transport are commonly abnormal in the critically ill • Inadequate resuscitation and failure to restore cellular oxygen delivery and organ perfusion results in multiple system organ dysfunction syndrome (MODS) and death
• Optimization of critical illness reduces organ failure and improves survival • Accurate assessment of hemodynamic function and goal-directed resuscitation is essential to improving patient outcome
Increase venous pressure (preload) leads to a rise in stroke volume and therefore cardiac output
• ↑ End diastolic volume causes ↑ stroke volume • “The energy of contraction of a cardiac muscle fiber, like
that of a skeletal muscle fiber, is proportional to the initial fiber length at rest.”
• Stroke volume increase due to increased force of contraction
Frank-‐Starling mechanism or Starling’s Law of the Heart

Tissue Perfusion: It really is everything! 3/5/12 [email protected]
5
What does dynamic monitoring offer to me?
Remember……
A searchlight cannot be used effectively without a fairly thorough knowledge of the
territory to be searched. Fergus Macartney, FRCP
Volume Responsiveness in Critically Ill patients • PPV causes changes in venous return, which
is accentuated in hypovolemic patients • take advantage of the swings in venous
return in order to determine the fluid responsiveness of hypotensive patients
• 2 major tools to look at this: – Echo – Arterial Line – looking at changes in the pulse
contour, and in the pulse pressure
Tissue Perfusion: It really is everything! 3/5/12 [email protected]
6
The Perfect Volume Status Monitor
• Fast • Easy to learn • Validated in all critically ill patients. (medical,
surgical, trauma, neurosurgical on positive pressure ventilaiton)
• Available outside of the ICU, not require any highly specialized equipment
• Give an easy answer • If you do not have a variation, do nt give
volume
Dynamic Methods to look at Hemodynamics and Volume Status in the MICU
• Take advantage of the Heart-Lung interactions during positive pressure ventilation.
• Arterial Line Monitoring with dynamic analysis of the wave form and pulse pressure variability
• Echocardiography to predict volume responsiveness (not going to be covered in this 20 minute talk!) – LV, IVC, SVC
.
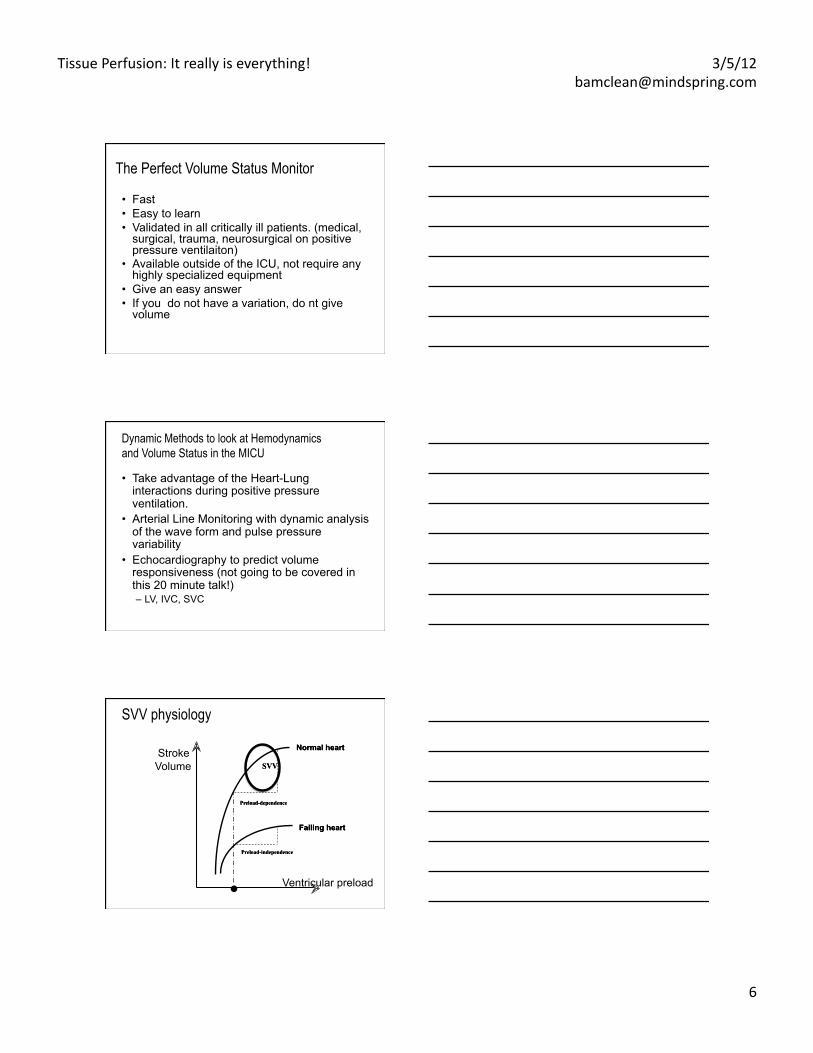
Stroke Volume
Ventricular preload
SVV physiology
Tissue Perfusion: It really is everything! 3/5/12 [email protected]
7
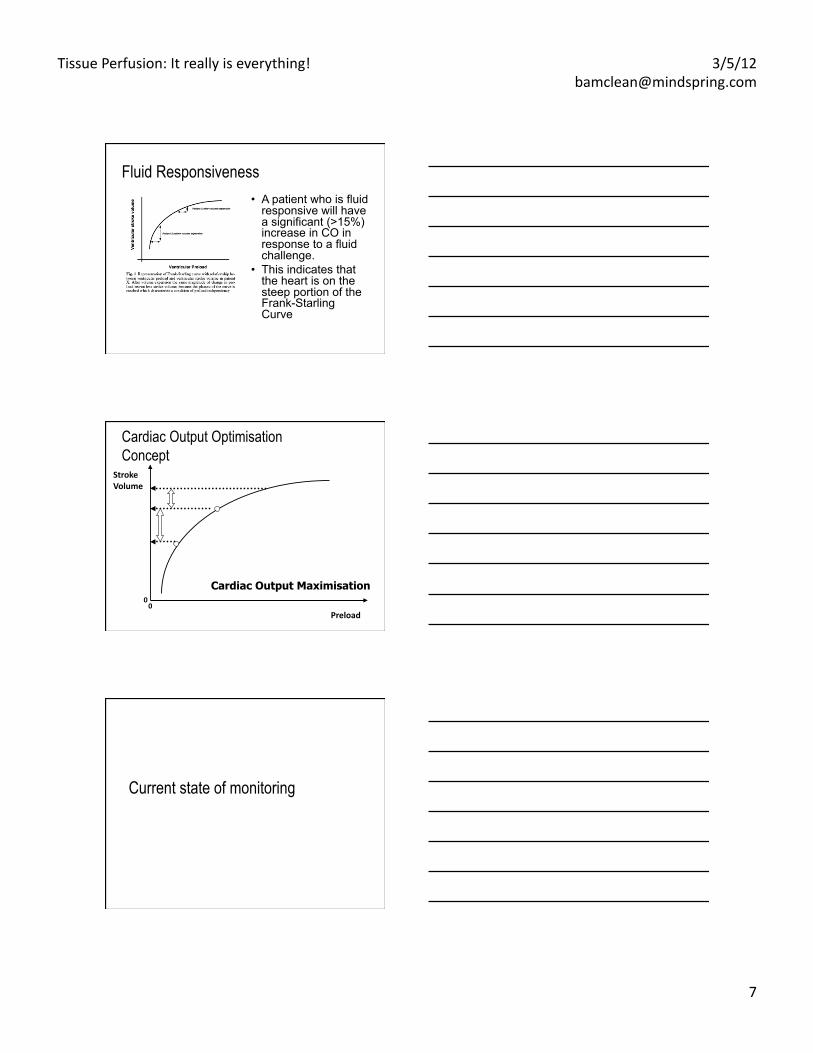
Fluid Responsiveness • A patient who is fluid
responsive will have a significant (>15%) increase in CO in response to a fluid challenge.
• This indicates that the heart is on the steep portion of the Frank-Starling Curve
Preload
Stroke Volume
0 0
Cardiac Output Maximisation
Cardiac Output Optimisation Concept
Current state of monitoring
Tissue Perfusion: It really is everything! 3/5/12 [email protected]
8
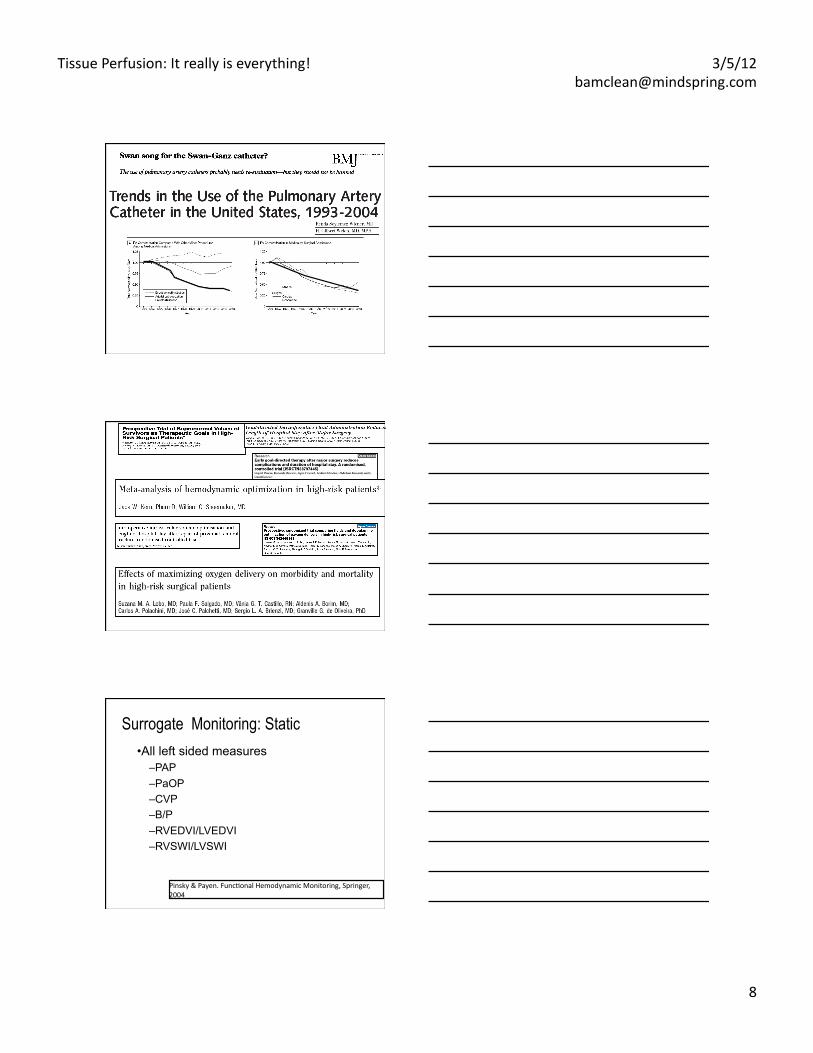
Surrogate Monitoring: Static • All left sided measures
– PAP – PaOP – CVP – B/P – RVEDVI/LVEDVI – RVSWI/LVSWI
Pinsky & Payen. FuncEonal Hemodynamic Monitoring, Springer, 2004
Tissue Perfusion: It really is everything! 3/5/12 [email protected]
9
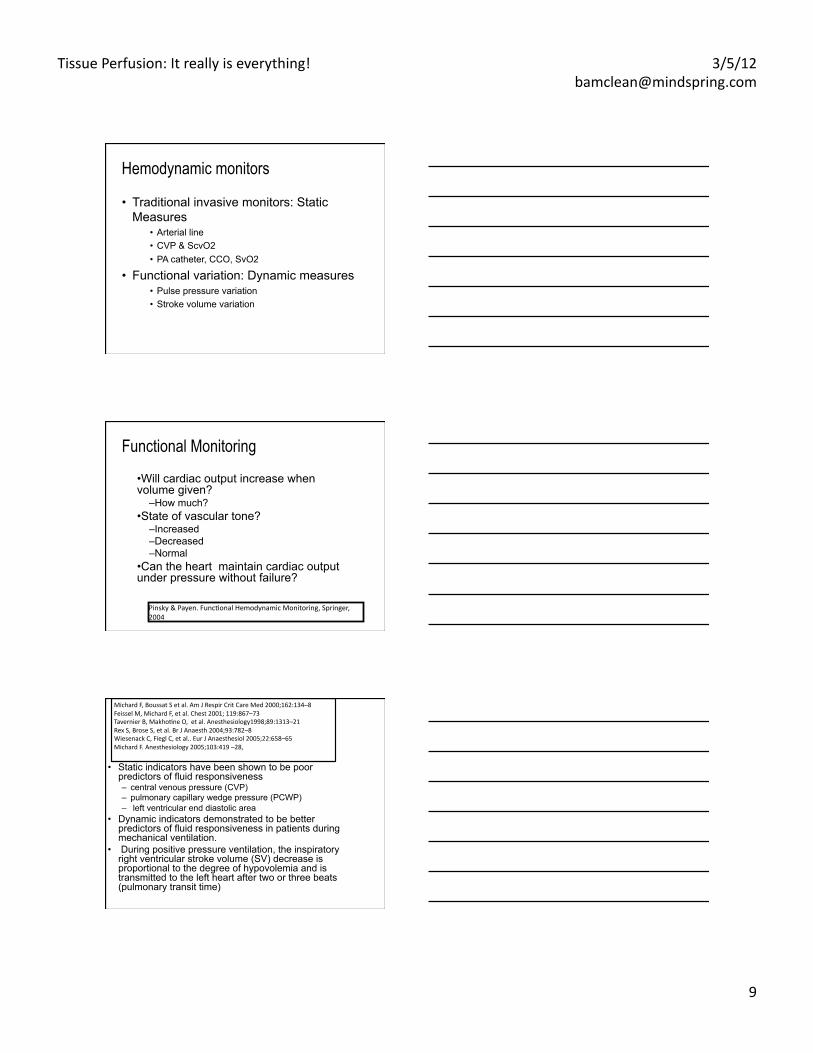
Hemodynamic monitors
• Traditional invasive monitors: Static Measures
• Arterial line • CVP & ScvO2 • PA catheter, CCO, SvO2
• Functional variation: Dynamic measures • Pulse pressure variation • Stroke volume variation
Functional Monitoring
• Will cardiac output increase when volume given?
– How much? • State of vascular tone?
– Increased – Decreased – Normal
• Can the heart maintain cardiac output under pressure without failure?
Pinsky & Payen. FuncEonal Hemodynamic Monitoring, Springer, 2004
• Static indicators have been shown to be poor predictors of fluid responsiveness – central venous pressure (CVP) – pulmonary capillary wedge pressure (PCWP) – left ventricular end diastolic area
• Dynamic indicators demonstrated to be better predictors of fluid responsiveness in patients during mechanical ventilation.
• During positive pressure ventilation, the inspiratory right ventricular stroke volume (SV) decrease is proportional to the degree of hypovolemia and is transmitted to the left heart after two or three beats (pulmonary transit time)
Michard F, Boussat S et al. Am J Respir Crit Care Med 2000;162:134–8 Feissel M, Michard F, et al. Chest 2001; 119:867–73 Tavernier B, MakhoEne O, et al. Anesthesiology1998;89:1313–21 Rex S, Brose S, et al. Br J Anaesth 2004;93:782–8 Wiesenack C, Fiegl C, et al.. Eur J Anaesthesiol 2005;22:658–65 Michard F. Anesthesiology 2005;103:419 –28,
Tissue Perfusion: It really is everything! 3/5/12 [email protected]
10
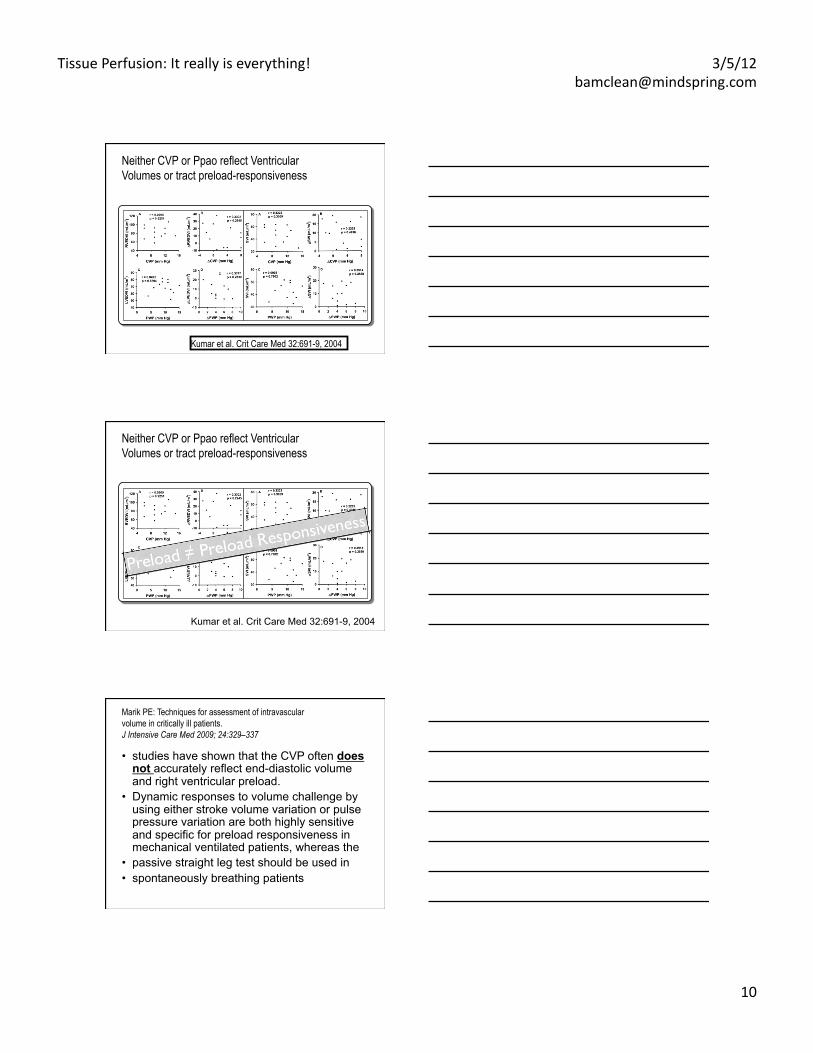
Neither CVP or Ppao reflect Ventricular Volumes or tract preload-responsiveness
Kumar et al. Crit Care Med 32:691-9, 2004
Neither CVP or Ppao reflect Ventricular Volumes or tract preload-responsiveness
Kumar et al. Crit Care Med 32:691-9, 2004
Marik PE: Techniques for assessment of intravascular volume in critically ill patients. J Intensive Care Med 2009; 24:329–337
• studies have shown that the CVP often does not accurately reflect end-diastolic volume and right ventricular preload.
• Dynamic responses to volume challenge by using either stroke volume variation or pulse pressure variation are both highly sensitive and specific for preload responsiveness in mechanical ventilated patients, whereas the
• passive straight leg test should be used in • spontaneously breathing patients

Tissue Perfusion: It really is everything! 3/5/12 [email protected]
11
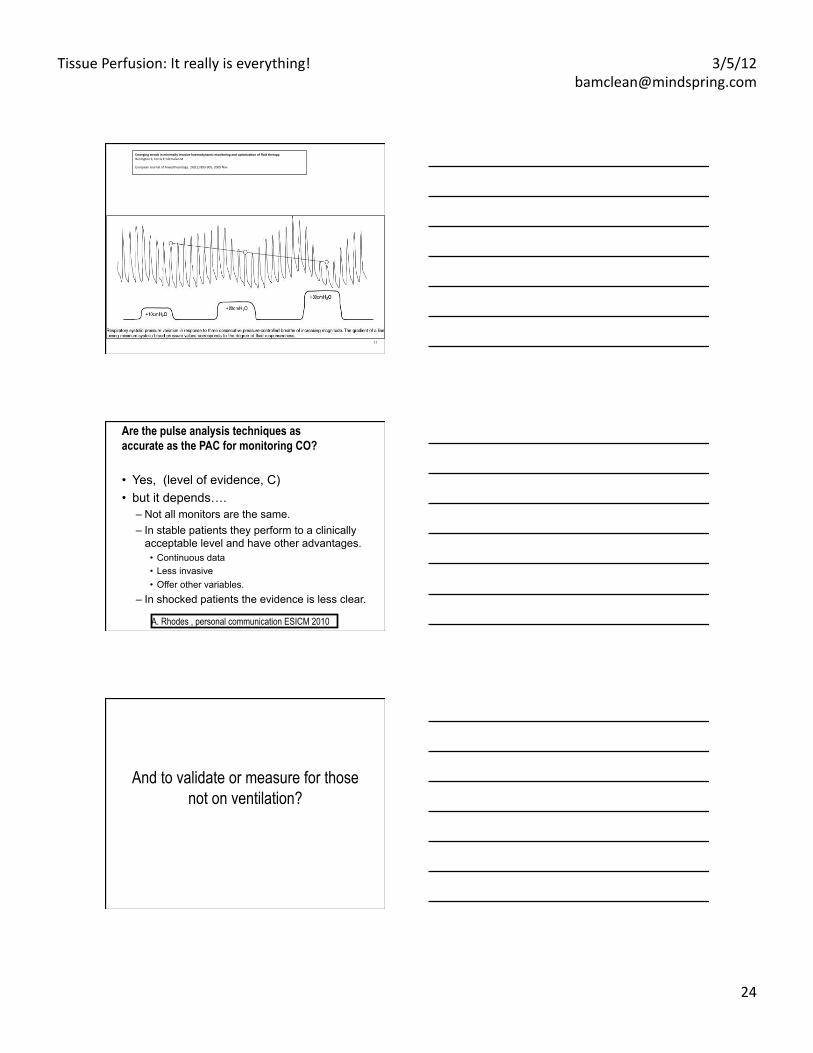
• Emerging data show that the choice, timing and amount of fluid therapy may affect clinical outcomes
• Early administration of fluid therapy in sepsis may improve survival
• Later fluid therapy in acute lung injury patients will increase the duration of ventilator dependence without achieving better survival
Now what?
Main circumstances in ICU • Positive pressure ventilation • Severe pulmonary embolism • ARDS • Sepsis induced RV dysfunction • Exacerbation of medical conditions leading to
chronic pulmonary hypertension • Right ventricle infarction • Pericardial diseases • RV failure after cardiac surgery • After cardiac transplant
Tissue Perfusion: It really is everything! 3/5/12 [email protected]
12
Physiology of the normal pulmonary circulation • Low pressure system: PRV (syst) = 25 mmHg
versus PLV (syst) = 120 mmHg • The pressure in the pulmonary system
depends on cardiac output, resistance and compliance – Normally very compliant pulmonary vessels with
large diameter and thin wall – Normal RV afterload very low
• alveolar hypoxia leads to pulmonary arterial vasoconstriction and pulmonary vascular resistance
4
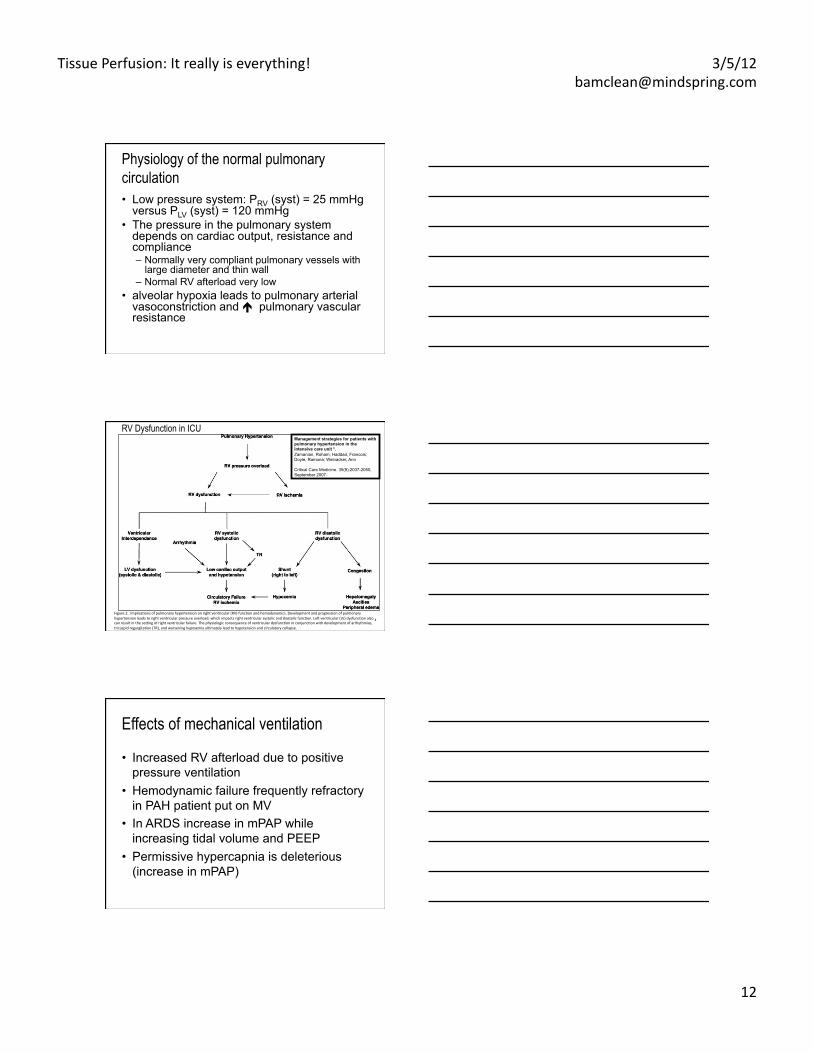
Management strategies for patients with pulmonary hypertension in the intensive care unit *. Zamanian, Roham; Haddad, Francois; Doyle, Ramona; Weinacker, Ann
Critical Care Medicine. 35(9):2037-2050, September 2007.
RV Dysfunction in ICU
Figure 2. ImplicaEons of pulmonary hypertension on right ventricular (RV) funcEon and hemodynamics. Development and progression of pulmonary hypertension leads to right ventricular pressure overload, which impacts right ventricular systolic and diastolic funcEon. Lee ventricular (LV) dysfuncEon also can result in the sefng of right ventricular failure. The physiologic consequence of ventricular dysfuncEon in conjuncEon with development of arrhythmias, tricuspid regurgitaEon (TR), and worsening hypoxemia ulEmately lead to hypotension and circulatory collapse.
Effects of mechanical ventilation
• Increased RV afterload due to positive pressure ventilation
• Hemodynamic failure frequently refractory in PAH patient put on MV
• In ARDS increase in mPAP while increasing tidal volume and PEEP
• Permissive hypercapnia is deleterious (increase in mPAP)
Tissue Perfusion: It really is everything! 3/5/12 [email protected]
13
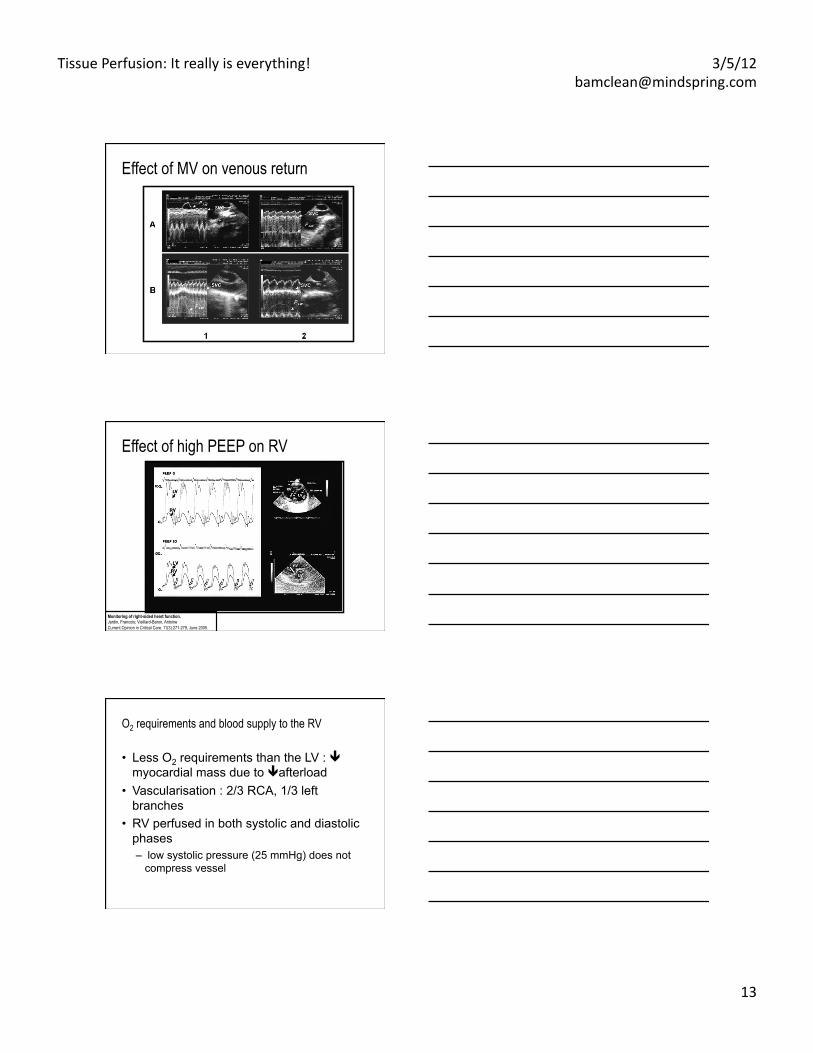
Effect of MV on venous return
Effect of high PEEP on RV
Monitoring of right-sided heart function. Jardin, Francois; Vieillard-Baron, Antoine Current Opinion in Critical Care. 11(3):271-279, June 2005.
O2 requirements and blood supply to the RV
• Less O2 requirements than the LV : myocardial mass due to afterload
• Vascularisation : 2/3 RCA, 1/3 left branches
• RV perfused in both systolic and diastolic phases – low systolic pressure (25 mmHg) does not
compress vessel
Tissue Perfusion: It really is everything! 3/5/12 [email protected]
14
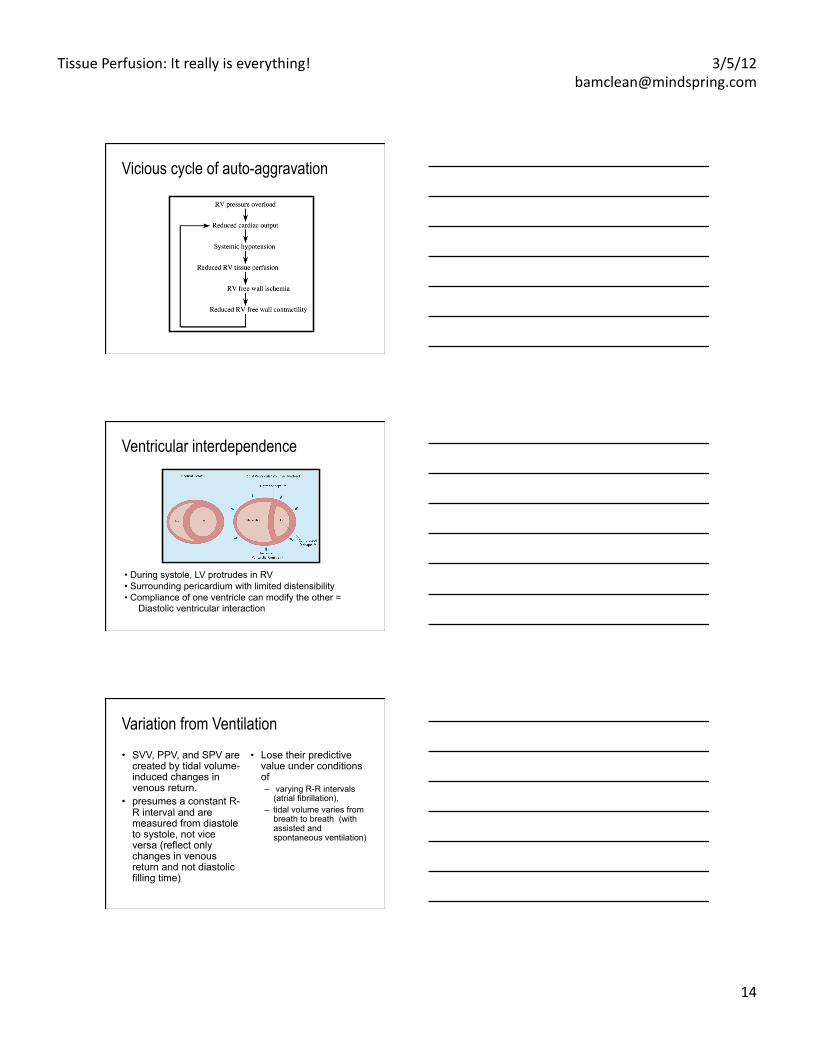
Vicious cycle of auto-aggravation
Ventricular interdependence
• During systole, LV protrudes in RV • Surrounding pericardium with limited distensibility • Compliance of one ventricle can modify the other =
Diastolic ventricular interaction
Variation from Ventilation • SVV, PPV, and SPV are
created by tidal volume-induced changes in venous return.
• presumes a constant R-R interval and are measured from diastole to systole, not vice versa (reflect only changes in venous return and not diastolic filling time)
• Lose their predictive value under conditions of – varying R-R intervals
(atrial fibrillation), – tidal volume varies from
breath to breath (with assisted and spontaneous ventilation)
Tissue Perfusion: It really is everything! 3/5/12 [email protected]
15
© 2005 Lippincoj Williams & Wilkins, Inc.
2
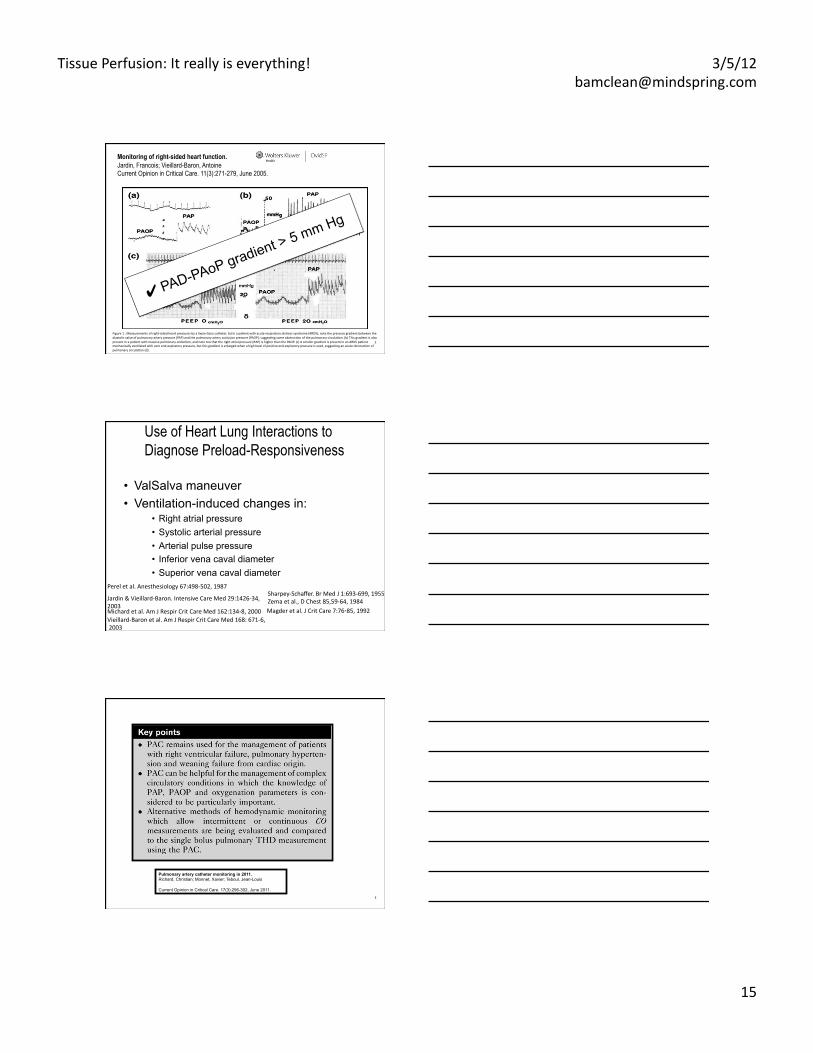
Monitoring of right-sided heart function. Jardin, Francois; Vieillard-Baron, Antoine Current Opinion in Critical Care. 11(3):271-279, June 2005.
Figure 1 . Measurements of right-‐sided heart pressures by a Swan-‐Ganz catheter. (a) In a paEent with acute respiratory distress syndrome (ARDS), note the pressure gradient between the diastolic value of pulmonary artery pressure (PAP) and the pulmonary artery occlusion pressure (PAOP), suggesEng some obstrucEon of the pulmonary circulaEon. (b) This gradient is also present in a paEent with massive pulmonary embolism, and note too that the right atrial pressure (RAP) is higher than the PAOP. (c) A smaller gradient is present in an ARDS paEent mechanically venElated with zero end-‐expiratory pressure, but this gradient is enlarged when a high level of posiEve end-‐expiratory pressure is used, suggesEng an acute obstrucEon of pulmonary circulaEon (d).
✔ PAD-PAoP gradient > 5 mm Hg
Use of Heart Lung Interactions to Diagnose Preload-Responsiveness
• ValSalva maneuver • Ventilation-induced changes in:
• Right atrial pressure • Systolic arterial pressure • Arterial pulse pressure • Inferior vena caval diameter • Superior vena caval diameter
Sharpey-‐Schaffer. Br Med J 1:693-‐699, 1955 Zema et al., D Chest 85,59-‐64, 1984 Magder et al. J Crit Care 7:76‑85, 1992
Perel et al. Anesthesiology 67:498-‐502, 1987
Michard et al. Am J Respir Crit Care Med 162:134-‐8, 2000
Jardin & Vieillard-‐Baron. Intensive Care Med 29:1426-‐34, 2003
Vieillard-‐Baron et al. Am J Respir Crit Care Med 168: 671-‐6, 2003
3
Pulmonary artery catheter monitoring in 2011. Richard, Christian; Monnet, Xavier; Teboul, Jean-Louis
Current Opinion in Critical Care. 17(3):296-302, June 2011.
Tissue Perfusion: It really is everything! 3/5/12 [email protected]
16
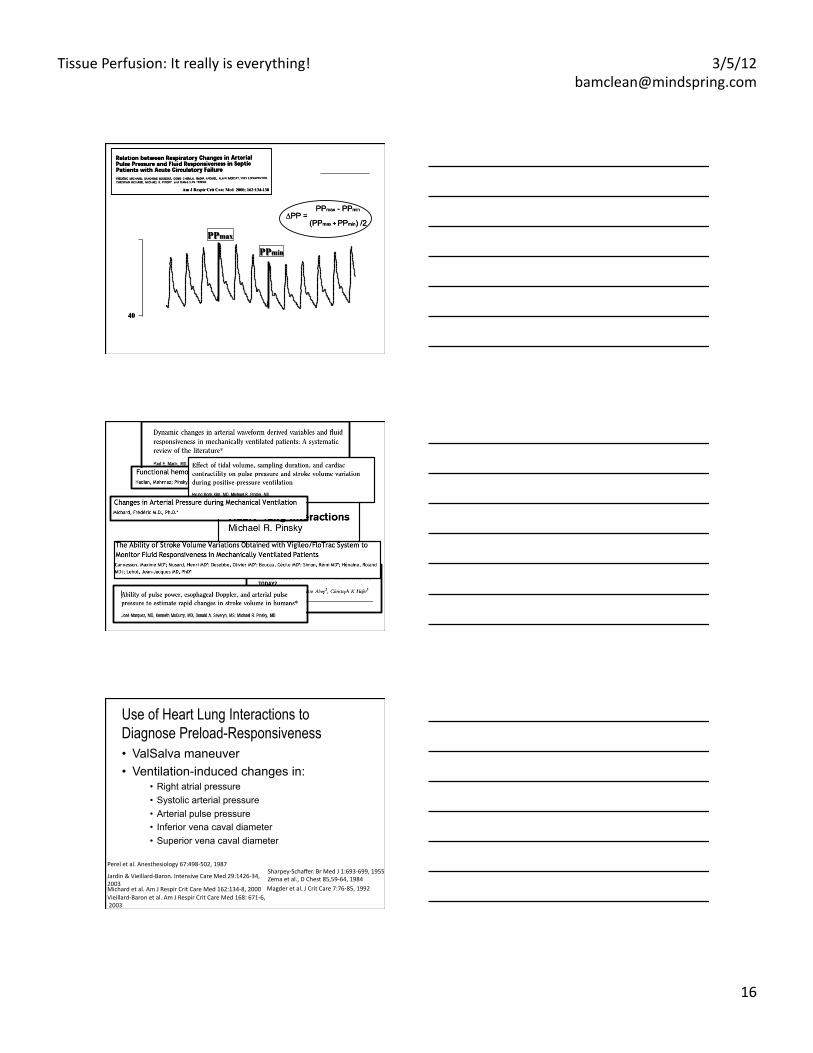
Use of Heart Lung Interactions to Diagnose Preload-Responsiveness • ValSalva maneuver • Ventilation-induced changes in:
• Right atrial pressure • Systolic arterial pressure • Arterial pulse pressure • Inferior vena caval diameter • Superior vena caval diameter
Sharpey-‐Schaffer. Br Med J 1:693-‐699, 1955 Zema et al., D Chest 85,59-‐64, 1984 Magder et al. J Crit Care 7:76‑85, 1992
Perel et al. Anesthesiology 67:498-‐502, 1987
Michard et al. Am J Respir Crit Care Med 162:134-‐8, 2000
Jardin & Vieillard-‐Baron. Intensive Care Med 29:1426-‐34, 2003
Vieillard-‐Baron et al. Am J Respir Crit Care Med 168: 671-‐6, 2003
Tissue Perfusion: It really is everything! 3/5/12 [email protected]
17
Preload
Stroke Volume
0
0
Normal
Heart Failure
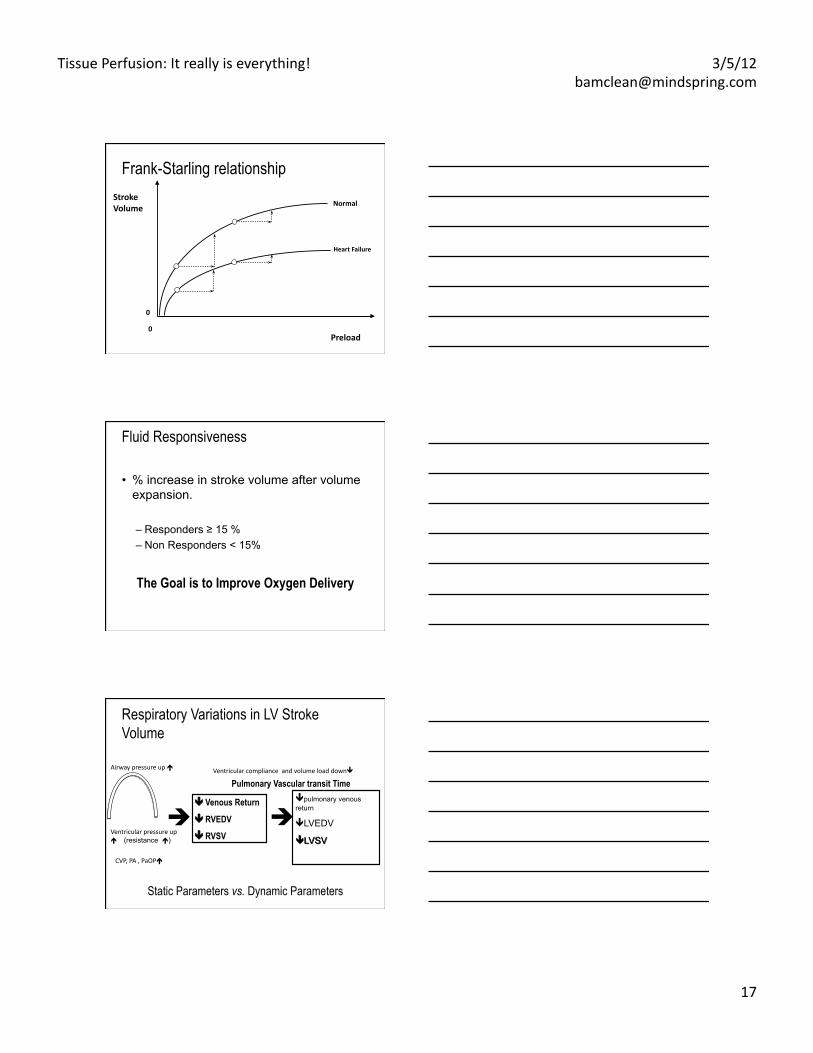
Frank-Starling relationship
Fluid Responsiveness
• % increase in stroke volume after volume expansion.
– Responders ≥ 15 % – Non Responders < 15%
The Goal is to Improve Oxygen Delivery
Respiratory Variations in LV Stroke Volume
Venous Return
RVEDV
RVSV
Pulmonary Vascular transit Time
Static Parameters vs. Dynamic Parameters
Airway pressure up Ventricular compliance and volume load down
Ventricular pressure up (resistance )
CVP, PA , PaOP
Tissue Perfusion: It really is everything! 3/5/12 [email protected]
18
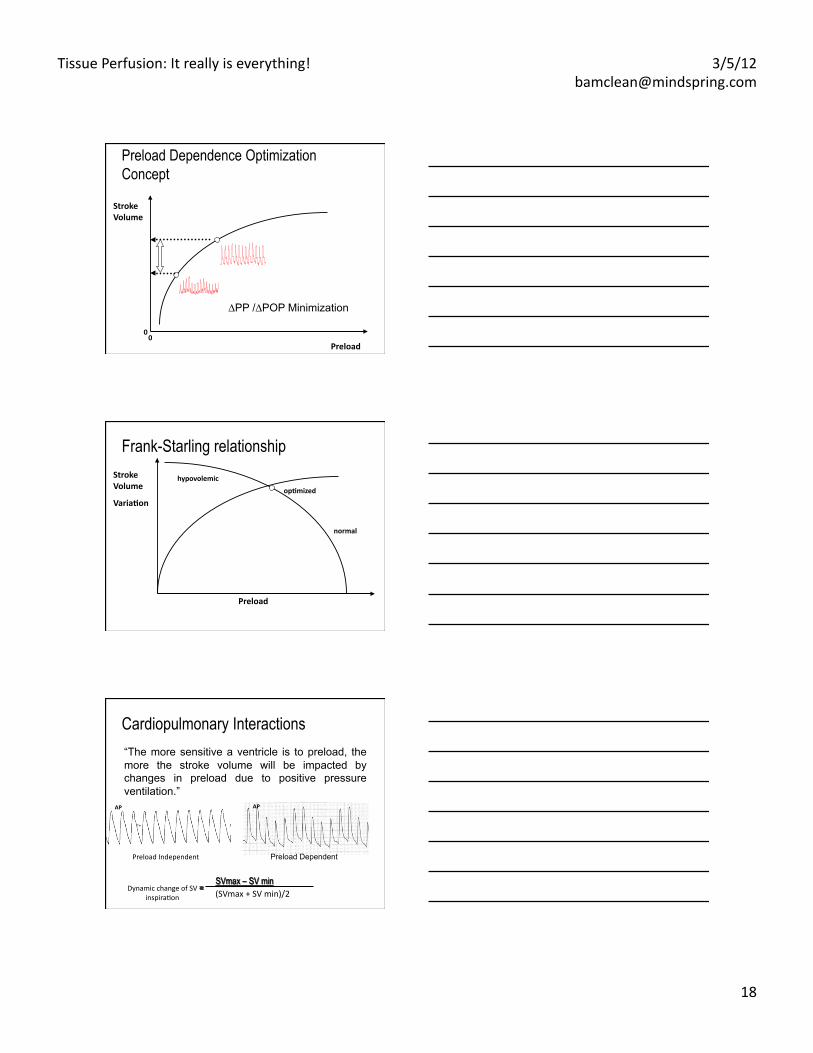
Preload
Stroke Volume
0 0
∆PP /∆POP Minimization
Preload Dependence Optimization Concept
Preload
Stroke Volume
Varia4on op4mized
Frank-Starling relationship
normal
hypovolemic
Cardiopulmonary Interactions “The more sensitive a ventricle is to preload, the more the stroke volume will be impacted by changes in preload due to positive pressure ventilation.”
Preload Independent Preload Dependent
AP AP
(SVmax + SV min)/2 Dynamic change of SV
inspiraEon
Tissue Perfusion: It really is everything! 3/5/12 [email protected]
19
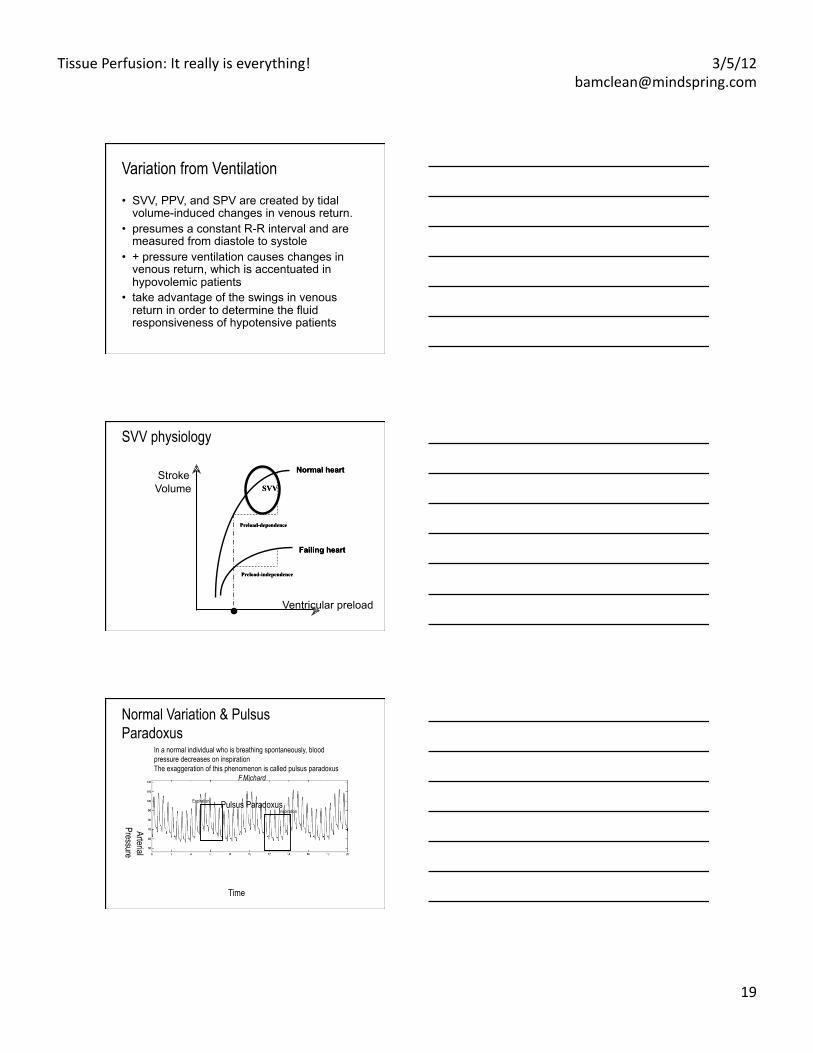
Variation from Ventilation
• SVV, PPV, and SPV are created by tidal volume-induced changes in venous return.
• presumes a constant R-R interval and are measured from diastole to systole
• + pressure ventilation causes changes in venous return, which is accentuated in hypovolemic patients
• take advantage of the swings in venous return in order to determine the fluid responsiveness of hypotensive patients
.
Stroke Volume
Ventricular preload
SVV physiology
Normal Variation & Pulsus Paradoxus
Arterial Pressure
Time
In a normal individual who is breathing spontaneously, blood pressure decreases on inspiration The exaggeration of this phenomenon is called pulsus paradoxus
F.Michard
Pulsus Paradoxus Expiration
Inspiration
Tissue Perfusion: It really is everything! 3/5/12 [email protected]
20
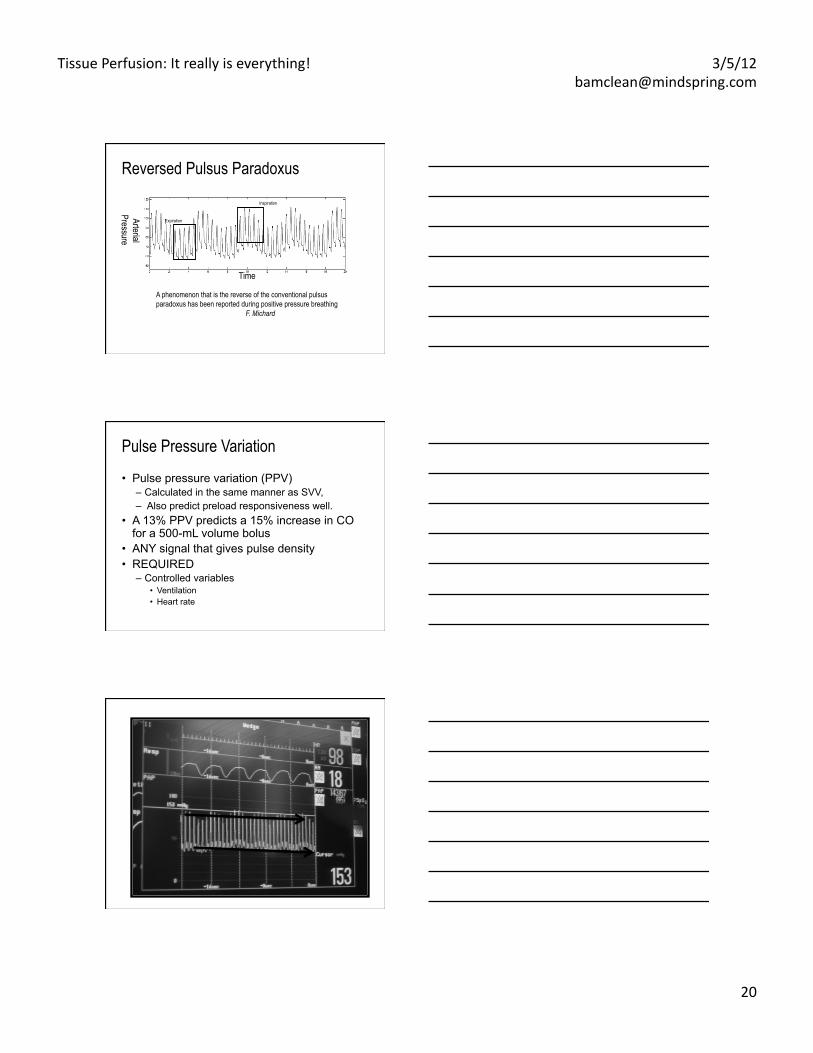
Reversed Pulsus Paradoxus
Arterial Pressure
Time
A phenomenon that is the reverse of the conventional pulsus paradoxus has been reported during positive pressure breathing
F. Michard
Expiration
Inspiration
Pulse Pressure Variation
• Pulse pressure variation (PPV) – Calculated in the same manner as SVV, – Also predict preload responsiveness well.
• A 13% PPV predicts a 15% increase in CO for a 500-mL volume bolus
• ANY signal that gives pulse density • REQUIRED
– Controlled variables • Ventilation • Heart rate

Tissue Perfusion: It really is everything! 3/5/12 [email protected]
21
Stroke volume
Cardiac Output
ml/ beat
Compensatory Mechanisms
Heart Rate
BPM L/min
What are the Limitations of SVV?
• Mechanical Ventilation – Currently, literature supports the use of SVV on
patients who are 100% mechanically (control mode) ventilated with tidal volumes of more than 8cc/kg and fixed respiratory rates.
• Spontaneous Ventilation – Currently, literature does not support the use of SVV
with patients who are spontaneously breathing. • Arrhythmias
– Arrhythmias can dramatically affect SVV. Thus, SVV’s utility as a guide for volume resuscitation is greatest in absence of arrhythmias.
What are the Limitations of SVV?
• Arrhythmias – Arrhythmias can dramatically affect SVV. SVV
utility as a guide for volume resuscitation is greatest in absence of arrhythmias.
• varying R-R intervals (atrial fibrillation), • aortic insufficiency • Peripheral vascular disease • intra-aortic counterpulsation
Tissue Perfusion: It really is everything! 3/5/12 [email protected]
22
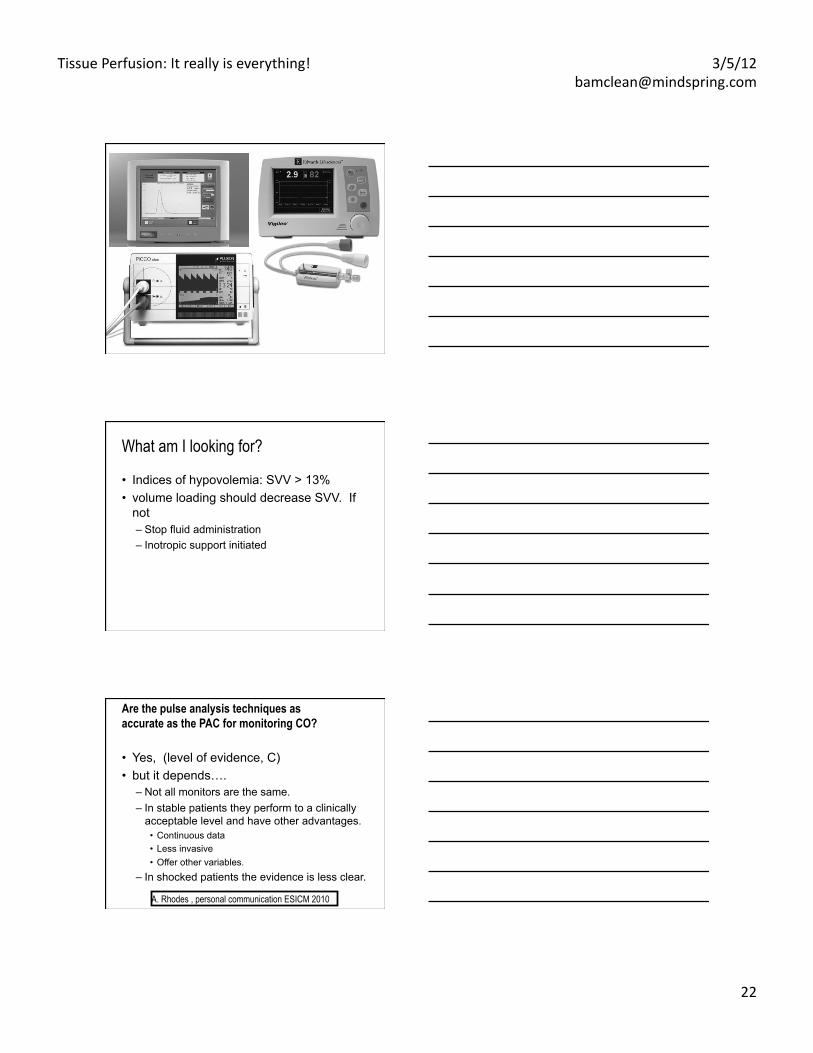
What am I looking for?
• Indices of hypovolemia: SVV > 13% • volume loading should decrease SVV. If
not – Stop fluid administration – Inotropic support initiated
Are the pulse analysis techniques as accurate as the PAC for monitoring CO?
• Yes, (level of evidence, C) • but it depends….
– Not all monitors are the same. – In stable patients they perform to a clinically
acceptable level and have other advantages. • Continuous data • Less invasive • Offer other variables.
– In shocked patients the evidence is less clear.
A. Rhodes , personal communication ESICM 2010

Tissue Perfusion: It really is everything! 3/5/12 [email protected]
23
What is the arterial tone? Hypotension • Relationship between PPV/SVV • Better relationship of elastance /vascular
tone than SVR • No assumption regarding volume
distribution • Physics calculation
– PP reflects variance – SV more regarding EF
• PP/SV normal 1.2-2
What is the arterial tone? Hypotension, volume responsiveness
• PP/SV normal 1.2- 1.5 – < 0.9 indicates vasoconstriction, SVV > 13%
• Volume – < 0.9 indicates vasoconstriction, SVV<13%
• Inotrope /vasodilator • Volume
– > 1.5 indicates vasodilation, SVV>13% • Volume • vasopressor
Pinsky, personal communication ESICM 2011
Physiological Truth
• There is no such thing as a “Normal Cardiac Output”
• Cardiac output is either – Adequate to meet the metabolic
demands – Inadequate to meet metabolic demands
• Absolute values can only be used as minimal levels below which some tissue beds are under perfused
Tissue Perfusion: It really is everything! 3/5/12 [email protected]
24
11
Emerging trends in minimally invasive haemodynamic monitoring and op4miza4on of fluid therapy. Benington S; Ferris P; Nirmalan M
European Journal of Anaesthesiology. 26(11):893-‐905, 2009 Nov.
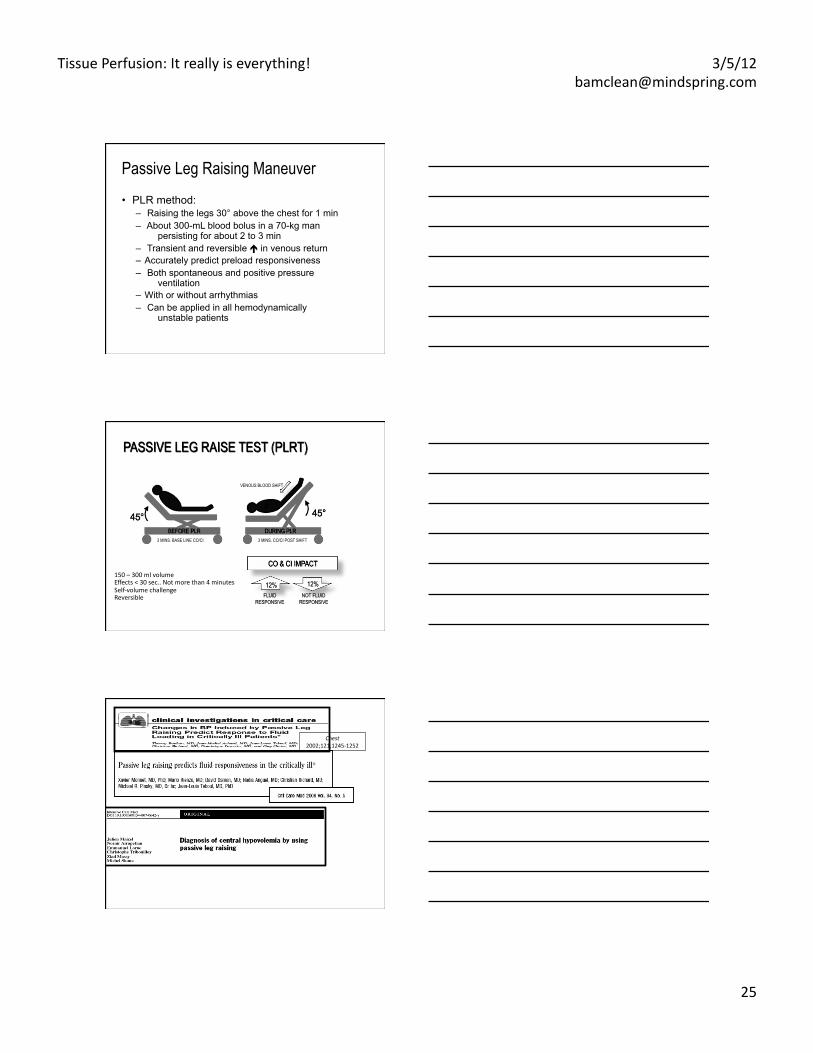
Are the pulse analysis techniques as accurate as the PAC for monitoring CO?
• Yes, (level of evidence, C) • but it depends….
– Not all monitors are the same. – In stable patients they perform to a clinically
acceptable level and have other advantages. • Continuous data • Less invasive • Offer other variables.
– In shocked patients the evidence is less clear.
A. Rhodes , personal communication ESICM 2010
And to validate or measure for those not on ventilation?
Tissue Perfusion: It really is everything! 3/5/12 [email protected]
25
Passive Leg Raising Maneuver • PLR method:
– Raising the legs 30° above the chest for 1 min – About 300-mL blood bolus in a 70-kg man
persisting for about 2 to 3 min – Transient and reversible in venous return – Accurately predict preload responsiveness – Both spontaneous and positive pressure
ventilation – With or without arrhythmias – Can be applied in all hemodynamically
unstable patients
3 MINS. BASE LINE CO/CI
VENOUS BLOOD SHIFT
3 MINS. CO/CI POST SHIFT
150 – 300 ml volume Effects < 30 sec.. Not more than 4 minutes Self-‐volume challenge Reversible
Chest 2002;121;1245-‐1252
Tissue Perfusion: It really is everything! 3/5/12 [email protected]
26
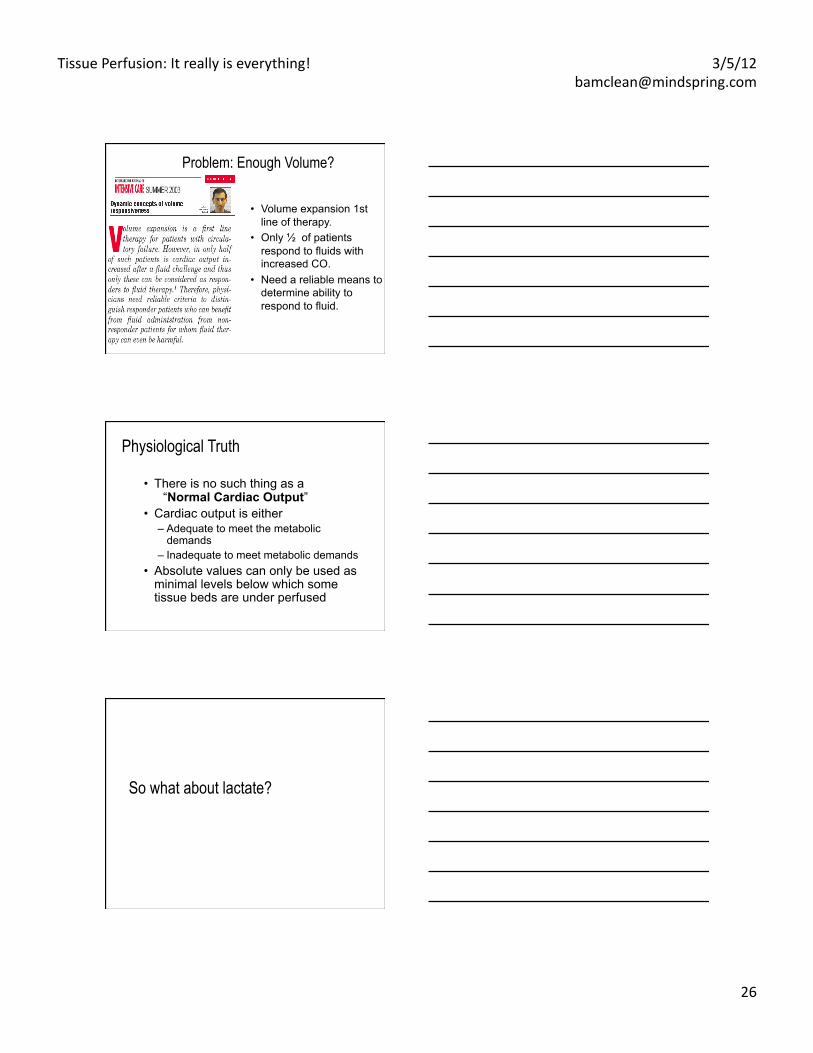
• Volume expansion 1st line of therapy.
• Only ½ of patients respond to fluids with increased CO.
• Need a reliable means to determine ability to respond to fluid.
Problem: Enough Volume?
Physiological Truth
• There is no such thing as a “Normal Cardiac Output”
• Cardiac output is either – Adequate to meet the metabolic
demands – Inadequate to meet metabolic demands
• Absolute values can only be used as minimal levels below which some tissue beds are under perfused
So what about lactate?

Tissue Perfusion: It really is everything! 3/5/12 [email protected]
27
Lactate Levels • The other acid: Lactate Levels • Lactic acid is a product of carbohydrate metabolism.
– It is normal to produce 15 to 20 mmol/kg of lactic acid per day.
– The normal plasma level is 0.5 to 1.5 meq/L • Hyperlactatemia is considered to be present if the level exceeds
4 to 5 meq/L. • Lactic acidosis is considered to be present if the elevated
lactate level is in conjunction with a gap >20 in the absence of elevated glucose /ketosis.
– Lactic acid is rapidly buffered by extracellular bicarbonate resulting in lactate.
– The liver and kidneys convert lactate back to pyruvate which is then converted to CO2 & H2O or glucose.
Lactate Levels • Is serum Lactate a good marker of adequacy of
perfusion? – Type A lactic acidosis primarily results from an imbalance
between tissue oxygen demand, delivery and use. – The blood lactate level in type A lactic acidosis is related to
the total oxygen debt and the magnitude of tissue hypoperfusion.
• Elevated blood lactate levels associated with metabolic acidosis are common among critically ill patients with systemic hypoperfusion, tissue hypoxia and metabolic dysfunction.
• Blood lactate levels also increase with clearance failure , i.e., kidney or liver dysfunction
Lactate Levels
• Utility of a single high initial lactate have been debated"– poor sensitivity and specificity"
• Lactate clearance is a better predictor of mortality"– Lac-time: time it takes to clear 10% of lactate"– Time to clear < 24 hours , improves survival in Severe sepsis"– Lac-time also directly correlated with number of organ failures"
• One lactate (lactic acid ) level is not as predictive or evaluative as a series over 24 hours ( i.e., Q6H) " "" ""
1. Bakker, J., Coffernils, M., Leon, M., Vincent, J.L. (1991). Blood lactate levels are superior to oxygen-‐derived variables in predicEng outcomes in human paEent shock. Chest, 99, 956-‐962.
2. Bakker, J., Gris, P., Coffernils, M., Kahn R.J., Vincent, J.L. (1996). Serial blood lactate levels can predict the development of mulEple organ failure following sepEc shock. Am J Surg, 171(2), 221-‐226.
3. Nguyen, H.B., Rivers, E.P., Knoblich, B.P., et al. (2004). Early lactate clearance is associated with improved outcome in severe sepsis and sepEc shock. Crit Care Med, 32(8), 1637-‐1642.
Tissue Perfusion: It really is everything! 3/5/12 [email protected]
28
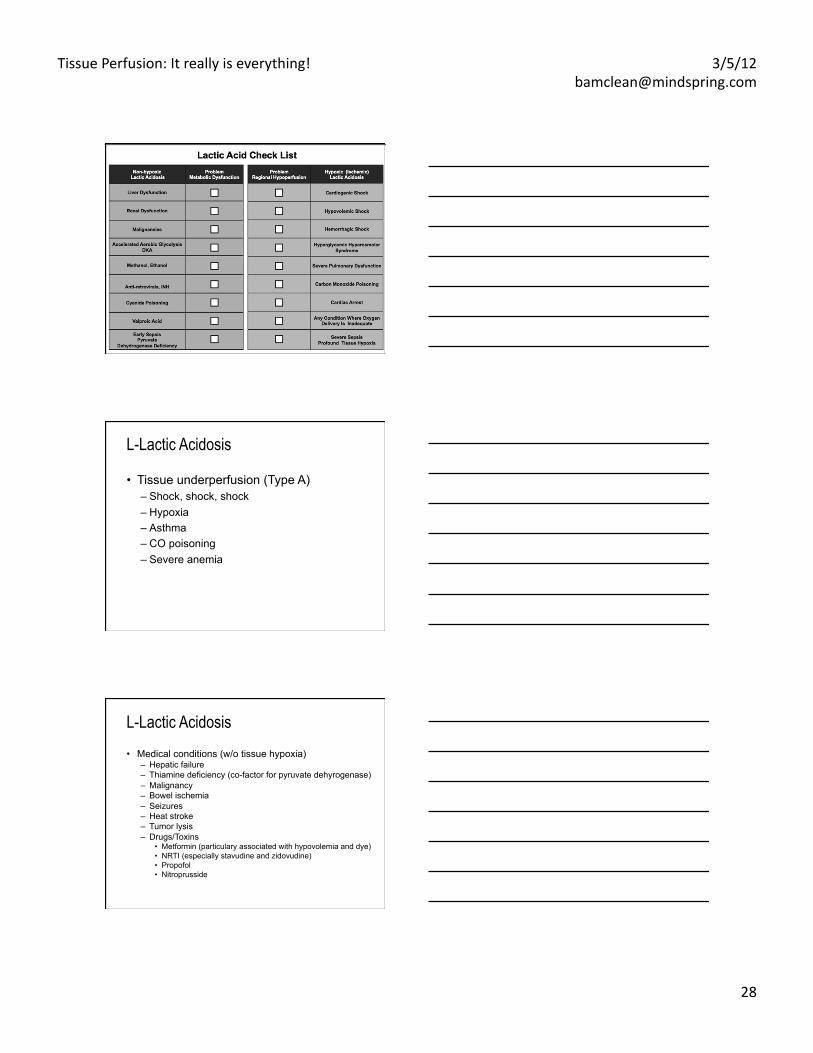
LACTIC ACID TABLE
L-Lactic Acidosis
• Tissue underperfusion (Type A) – Shock, shock, shock – Hypoxia – Asthma – CO poisoning – Severe anemia
L-Lactic Acidosis • Medical conditions (w/o tissue hypoxia)
– Hepatic failure – Thiamine deficiency (co-factor for pyruvate dehyrogenase) – Malignancy – Bowel ischemia – Seizures – Heat stroke – Tumor lysis – Drugs/Toxins
• Metformin (particulary associated with hypovolemia and dye) • NRTI (especially stavudine and zidovudine) • Propofol • Nitroprusside
Tissue Perfusion: It really is everything! 3/5/12 [email protected]
29
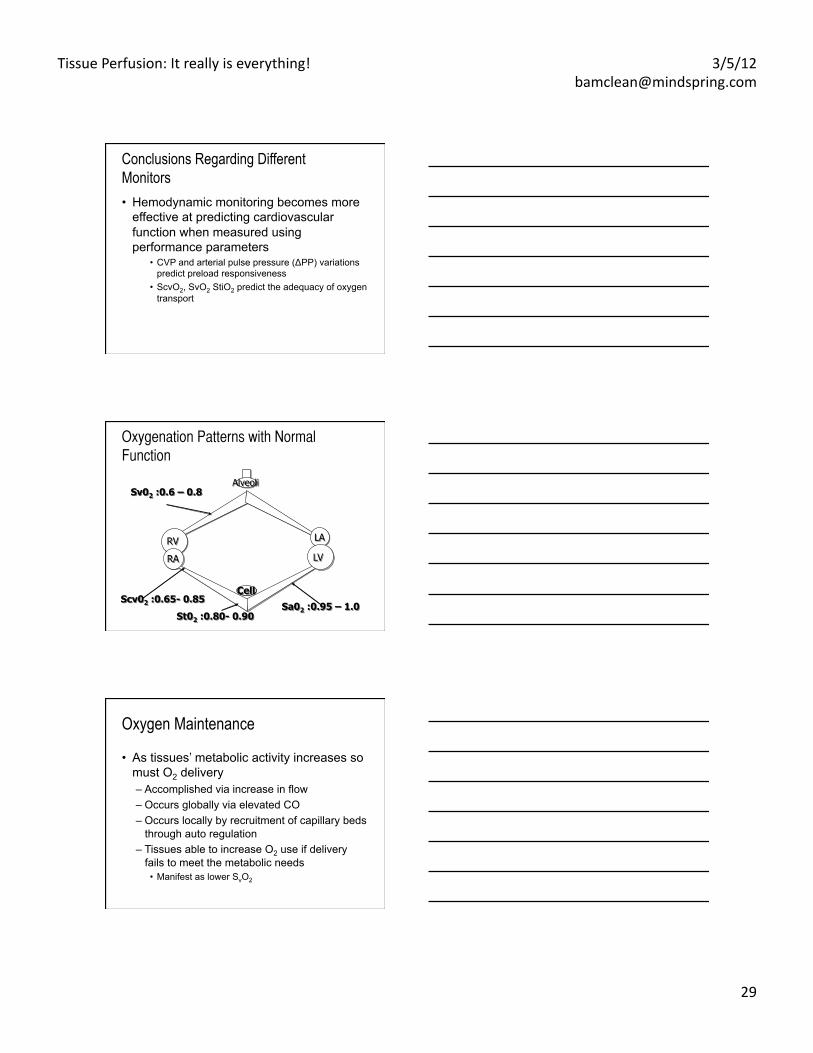
Conclusions Regarding Different Monitors • Hemodynamic monitoring becomes more
effective at predicting cardiovascular function when measured using performance parameters
• CVP and arterial pulse pressure (ΔPP) variations predict preload responsiveness
• ScvO2, SvO2 StiO2 predict the adequacy of oxygen transport
RA
LA
LV
Alveoli Sv02 :0.6 – 0.8
Sa02 :0.95 – 1.0 Scv02 :0.65- 0.85
Oxygenation Patterns with Normal ���
Function
RV
St02 :0.80- 0.90
Oxygen Maintenance
• As tissues’ metabolic activity increases so must O2 delivery – Accomplished via increase in flow – Occurs globally via elevated CO – Occurs locally by recruitment of capillary beds
through auto regulation – Tissues able to increase O2 use if delivery
fails to meet the metabolic needs • Manifest as lower SvO2

Tissue Perfusion: It really is everything! 3/5/12 [email protected]
30
Assessing DO2:Mixed Venous Saturation
site of measurement of SatmvO2 • superior vena cava vs pulmonary artery
Adults with sepsis: – Satsvc mean of 7% higher than Satpa – Satsvc changes in parallel to Satpa
• inferior vena cava vs superior vena cava – ↑ VO2 in hepatosplanchnic region in sepsis – ↑ oxygen extraction ratio and ↓ IVC O2
saturation Reinhart et al Int Care Med 2004
Targeting Mixed Venous Saturation
• normally 70-75% • may be elevated in sepsis
– maldistribution of blood flow – Increasing LA
• reduced venous saturation with normal arterial saturation→ increase in O2 extraction – imbalance between VO2 and DO2 – improve supply
Targeting Mixed Venous Saturation
• few studies have specifically targeted resuscitation to a mixed venous saturation of >70%
• prospective, randomized trial in adults: treatment to a mixed venous saturation >70% did not reduce mortality compared with therapy targeting a normal CI (Gattinoni et al NEJM 1995)
Tissue Perfusion: It really is everything! 3/5/12 [email protected]
31
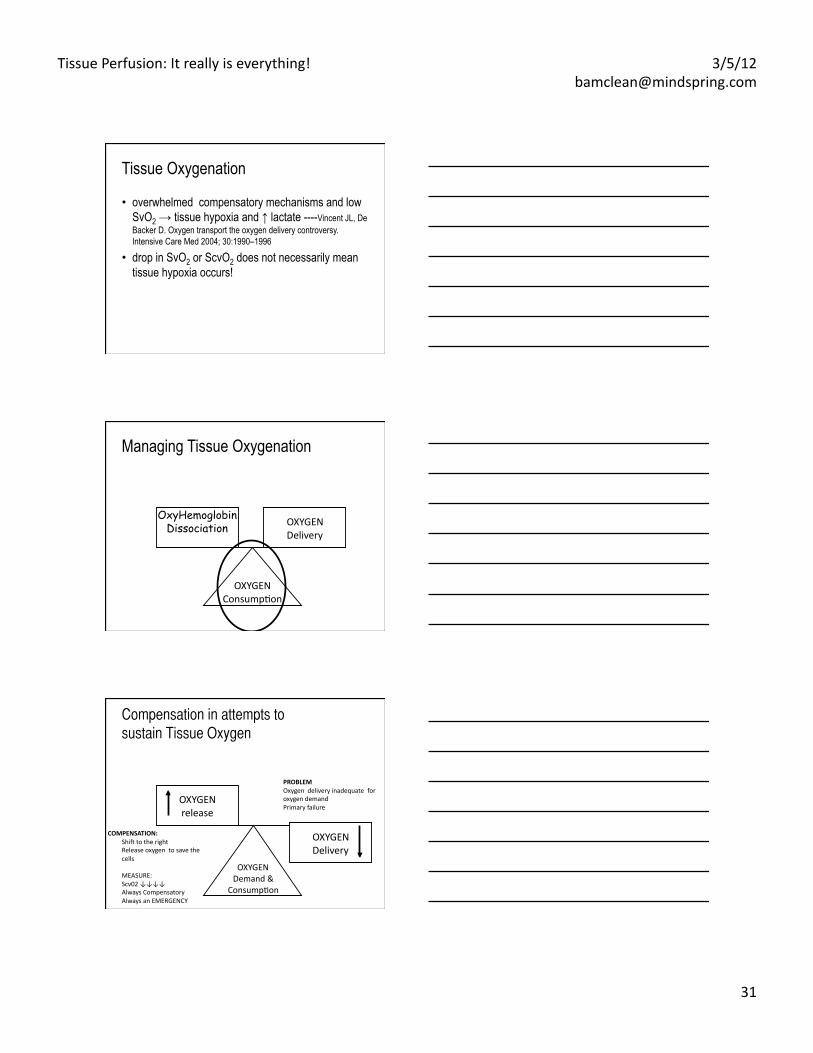
Tissue Oxygenation
• overwhelmed compensatory mechanisms and low SvO2 → tissue hypoxia and ↑ lactate ----Vincent JL, De Backer D. Oxygen transport the oxygen delivery controversy. Intensive Care Med 2004; 30:1990–1996
• drop in SvO2 or ScvO2 does not necessarily mean tissue hypoxia occurs!
Managing Tissue Oxygenation
OxyHemoglobin Dissociation OXYGEN
Delivery
OXYGEN ConsumpEon
OXYGEN release
OXYGEN Demand &
ConsumpEon
OXYGEN Delivery
Compensation in attempts to
sustain Tissue Oxygen
COMPENSATION: Shie to the right Release oxygen to save the cells
MEASURE: Scv02 ↓↓↓↓ Always Compensatory Always an EMERGENCY
PROBLEM Oxygen delivery inadequate for oxygen demand Primary failure
Tissue Perfusion: It really is everything! 3/5/12 [email protected]
32
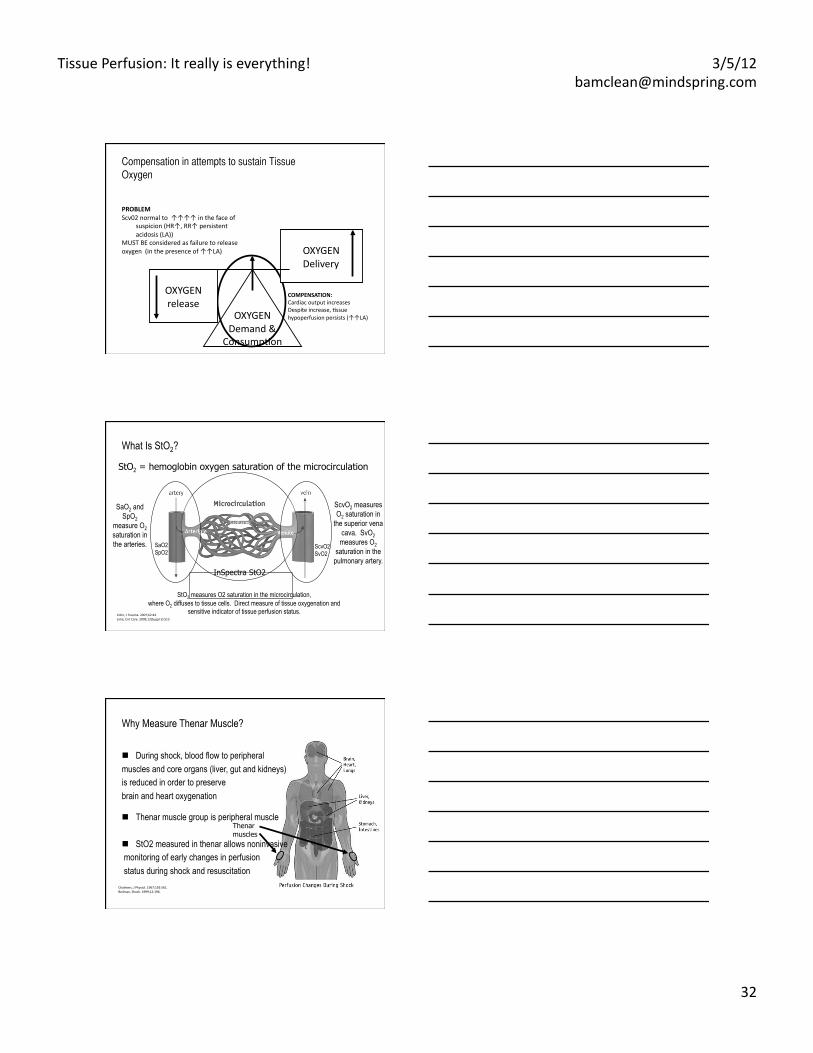
Compensation in attempts to sustain Tissue
Oxygen
OXYGEN Demand &
ConsumpEon
OXYGEN Delivery
OXYGEN release
COMPENSATION: Cardiac output increases Despite increase, Essue hypoperfusion persists (↑↑LA)
PROBLEM Scv02 normal to ↑↑↑↑ in the face of
suspicion (HR↑, RR↑ persistent acidosis (LA))
MUST BE considered as failure to release oxygen (in the presence of ↑↑LA)
What Is StO2?
SaO2 and SpO2
measure O2 saturation in the arteries.
ScvO2 measures O2 saturation in
the superior vena cava. SvO2 measures O2
saturation in the pulmonary artery.
StO2 measures O2 saturation in the microcirculation, where O2 diffuses to tissue cells. Direct measure of tissue oxygenation and
sensitive indicator of tissue perfusion status.
InSpectra StO2
StO2 = hemoglobin oxygen saturation of the microcirculation
SaO2 SpO2
ScvO2 SvO2
Cohn, J Trauma. 2007;62:44 Lima, Crit Care. 2009;13(Suppl 5):S13
Why Measure Thenar Muscle?
Thenar muscles
Chalmers, J Physiol. 1967;192:561. Beilman, Shock. 1999;12:196.
During shock, blood flow to peripheral muscles and core organs (liver, gut and kidneys) is reduced in order to preserve brain and heart oxygenation
Thenar muscle group is peripheral muscle
StO2 measured in thenar allows noninvasive monitoring of early changes in perfusion status during shock and resuscitation
Tissue Perfusion: It really is everything! 3/5/12 [email protected]
33
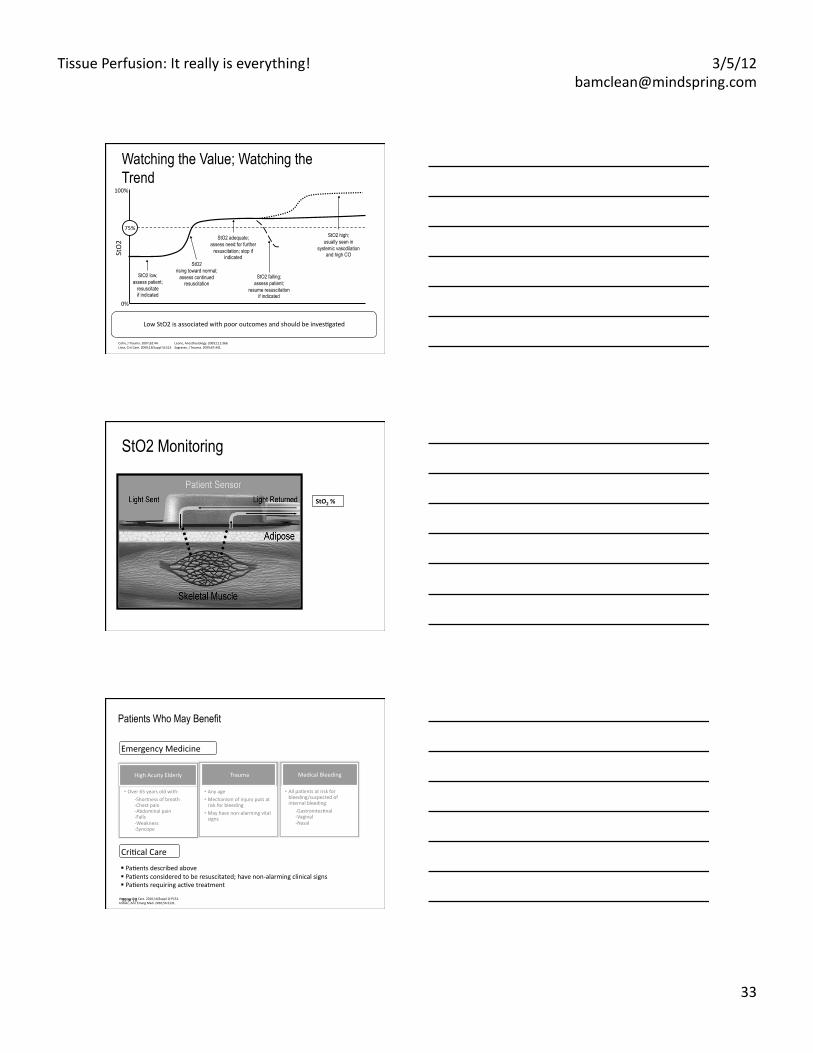
Watching the Value; Watching the Trend
Low StO2 is associated with poor outcomes and should be invesEgated
75%
100%
0%
StO2 low; assess patient;
resuscitate if indicated
StO2 rising toward normal;
assess continued resuscitation
StO2 falling; assess patient;
resume resuscitation if indicated
StO2 high; usually seen in
systemic vasodilation and high CO
StO2 adequate; assess need for further
resuscitation; stop if indicated St
O2
Cohn, J Trauma. 2007;62:44. Leone, Anesthesiology. 2009;111:366. Lima, Crit Care. 2009;13(Suppl 5):S13. Sagraves, J Trauma. 2009;67:441.
StO2 Monitoring
StO2 %
99 of 10
Emergency Medicine
Patients Who May Benefit
High Acuity Elderly Trauma
• Any age • Mechanism of injury puts at risk for bleeding
• May have non-‐alarming vital signs
Medical Bleeding
• All paEents at risk for bleeding/suspected of internal bleeding:
-‐GastrointesEnal -‐Vaginal -‐Nasal
• Over 65 years old with: -‐Shortness of breath -‐Chest pain -‐Abdominal pain -‐Falls -‐Weakness -‐Syncope
CriEcal Care
PaEents described above PaEents considered to be resuscitated; have non-‐alarming clinical signs PaEents requiring acEve treatment
Veening, Crit Care. 2010;14(Suppl 1):P151. Ardolic, Ann Emerg Med. 2010;56:S131.
Tissue Perfusion: It really is everything! 3/5/12 [email protected]
34
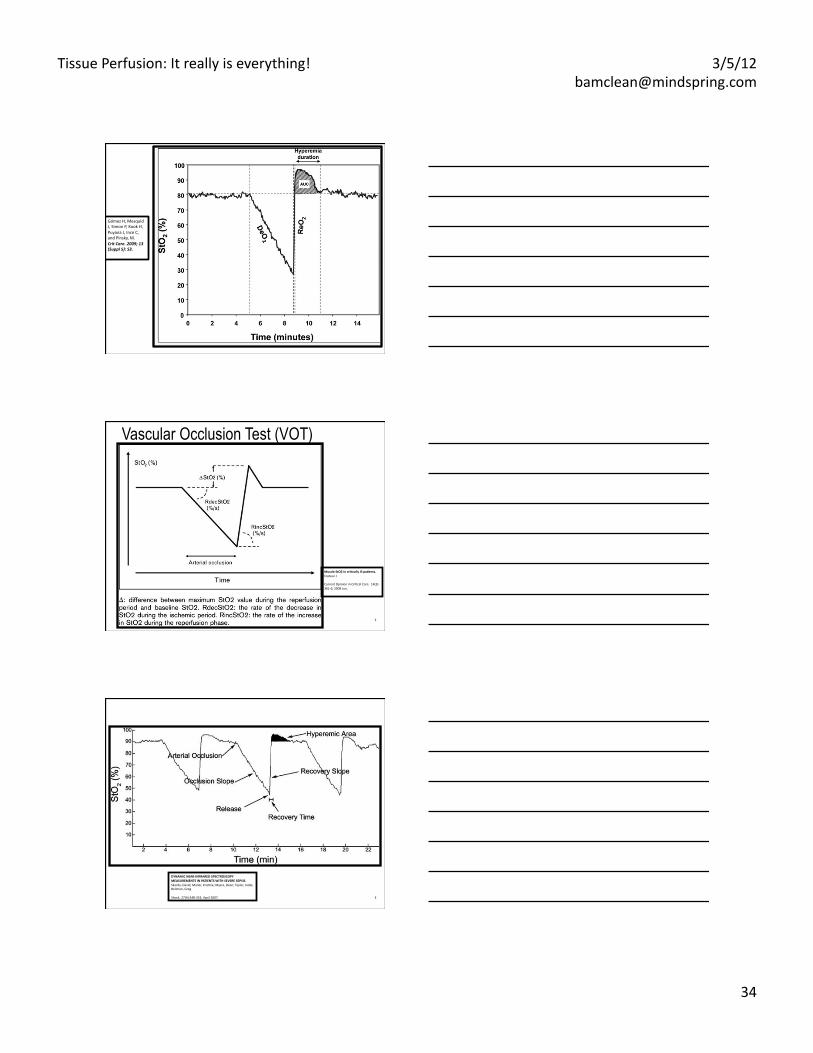
Gómez H, Mesquid J, Simon P, Kook H, Puyana J, Ince C, and Pinsky, M. Crit Care. 2009; 13(Suppl 5): S3.
2
Muscle StO2 in cri4cally ill pa4ents. Creteur J
Current Opinion in CriEcal Care. 14(3):361-‐6, 2008 Jun.
Vascular Occlusion Test (VOT)
3
DYNAMIC NEAR-‐INFRARED SPECTROSCOPY MEASUREMENTS IN PATIENTS WITH SEVERE SEPSIS. Skarda, David; Mulier, KrisEne; Myers, Dean; Taylor, Jodie; Beilman, Greg
Shock. 27(4):348-‐353, April 2007.
Tissue Perfusion: It really is everything! 3/5/12 [email protected]
35
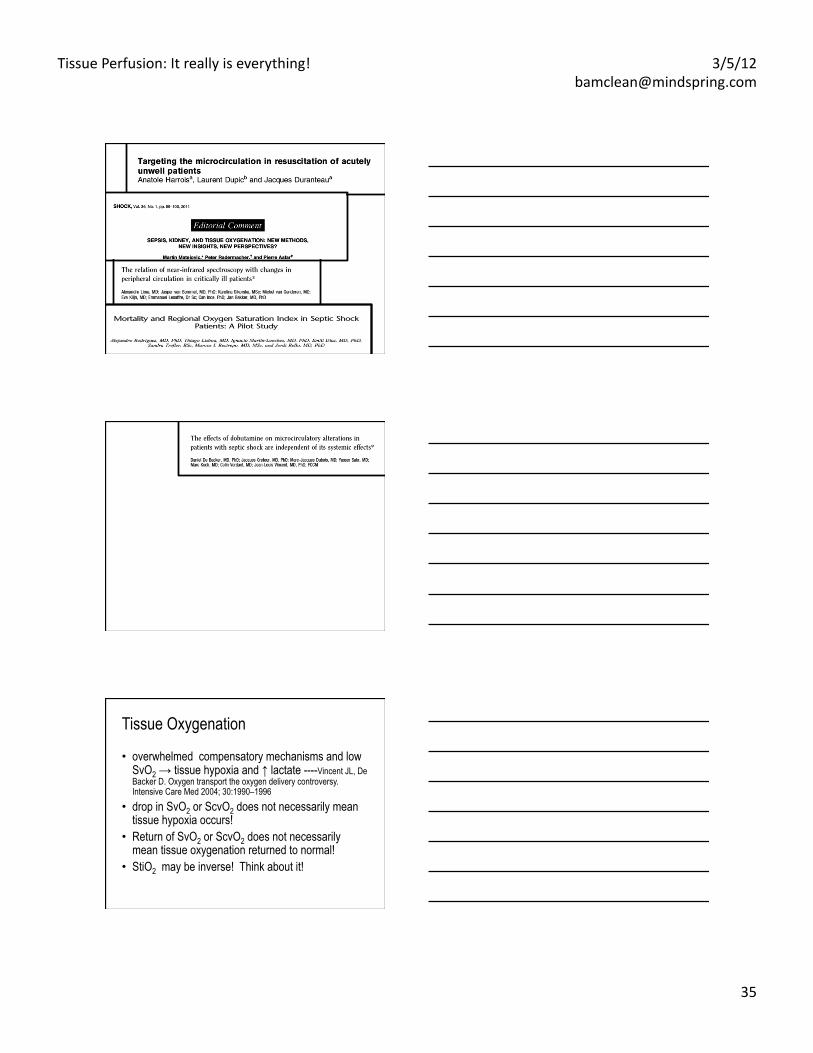
Tissue Oxygenation
• overwhelmed compensatory mechanisms and low SvO2 → tissue hypoxia and ↑ lactate ----Vincent JL, De Backer D. Oxygen transport the oxygen delivery controversy. Intensive Care Med 2004; 30:1990–1996
• drop in SvO2 or ScvO2 does not necessarily mean tissue hypoxia occurs!
• Return of SvO2 or ScvO2 does not necessarily mean tissue oxygenation returned to normal!
• StiO2 may be inverse! Think about it!

Tissue Perfusion: It really is everything! 3/5/12 [email protected]
36
A-V PCO2 Gradient (ΔPCO2)
• Can the PCO2 gradient between arterial and venous blood gas samples (ΔPCO2) represent adequacy of perfusion?
A-V PCO2 Gradient (ΔPCO2)
• ΔPCO2 = PvCO2 – PaCO2 • The ΔPCO2 is an index to identify the critical oxygen
delivery point (VO2/DO2). • The critical oxygen delivery point is when
consumption (VO2) is dependent on delivery (DO2) ●
●
A-V PCO2 Gradient (ΔPCO2)
• critical oxygen delivery point is associated with an abrupt increase of blood lactate levels and a significant widening in ΔPCO2
• Since CO2 is 20x more soluble in aqueous solutions than O2, it is logical that ΔPCO2 may serve as an excellent measurement of adequacy of perfusion.
Tissue Perfusion: It really is everything! 3/5/12 [email protected]
37
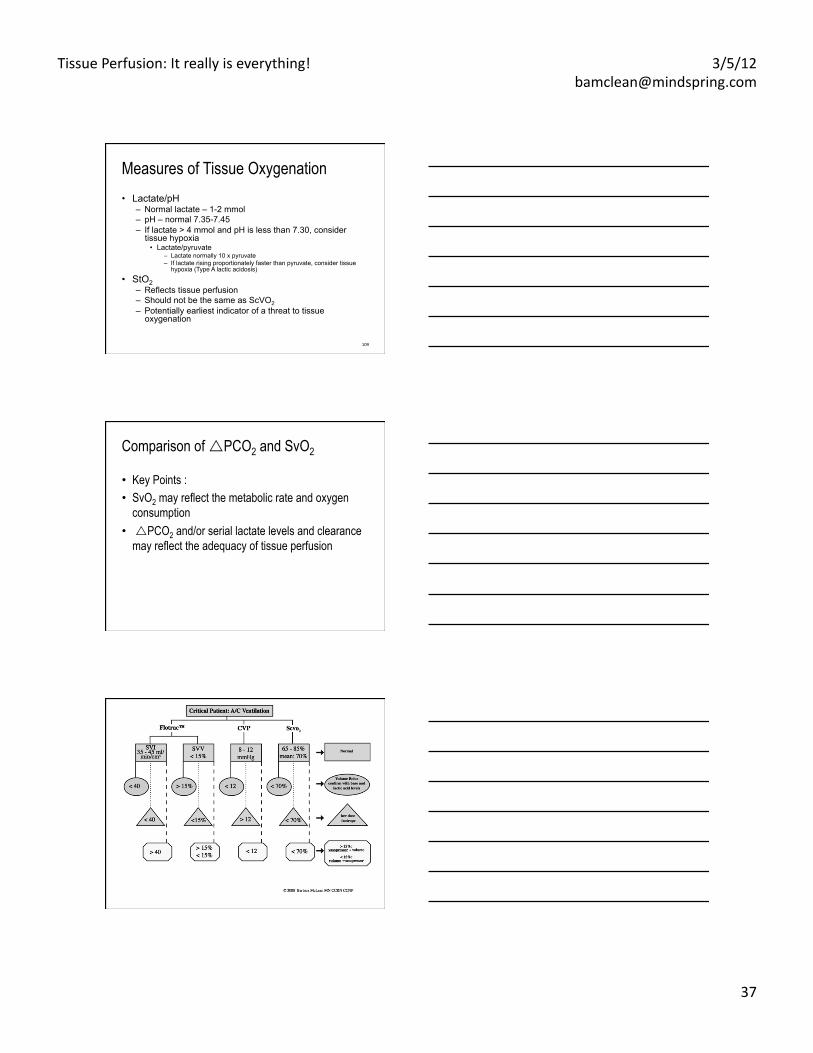
Measures of Tissue Oxygenation • Lactate/pH
– Normal lactate – 1-2 mmol – pH – normal 7.35-7.45 – If lactate > 4 mmol and pH is less than 7.30, consider
tissue hypoxia • Lactate/pyruvate
– Lactate normally 10 x pyruvate – If lactate rising proportionately faster than pyruvate, consider tissue
hypoxia (Type A lactic acidosis)
• StO2 – Reflects tissue perfusion – Should not be the same as ScVO2 – Potentially earliest indicator of a threat to tissue
oxygenation
109
Comparison of PCO2 and SvO2
• Key Points : • SvO2 may reflect the metabolic rate and oxygen
consumption • PCO2 and/or serial lactate levels and clearance
may reflect the adequacy of tissue perfusion
Tissue Perfusion: It really is everything! 3/5/12 [email protected]
38
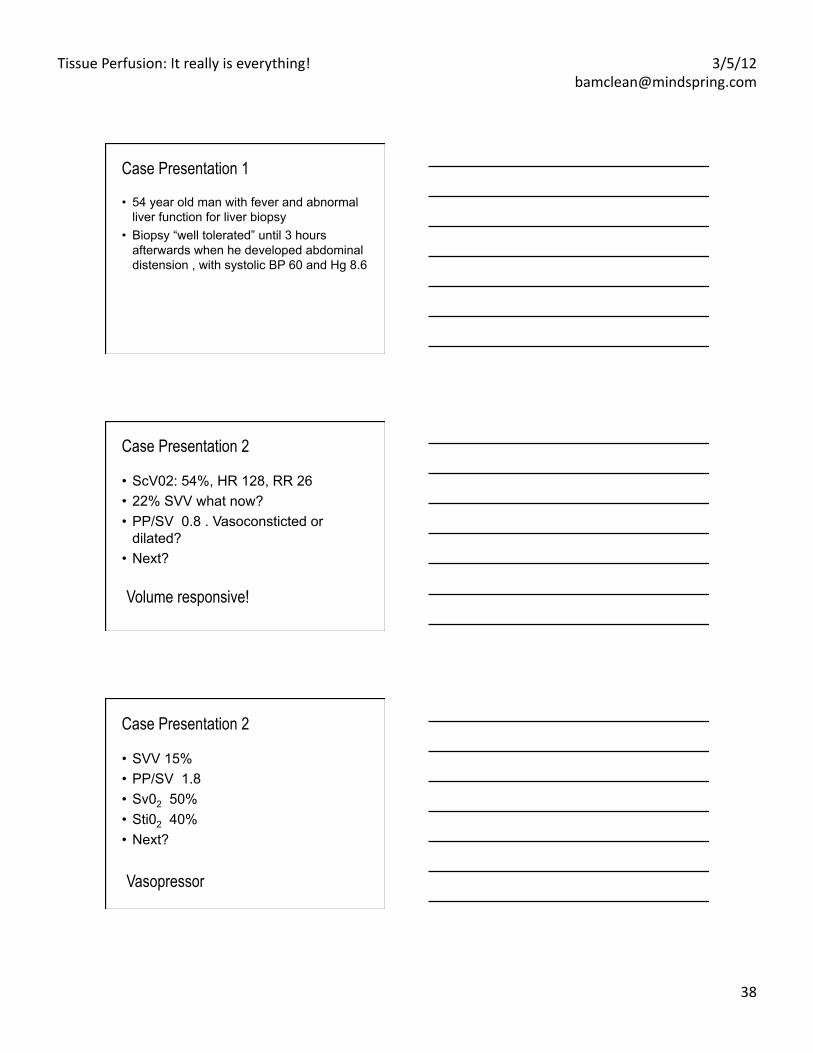
Case Presentation 1
• 54 year old man with fever and abnormal liver function for liver biopsy
• Biopsy “well tolerated” until 3 hours afterwards when he developed abdominal distension , with systolic BP 60 and Hg 8.6
Case Presentation 2
• ScV02: 54%, HR 128, RR 26 • 22% SVV what now? • PP/SV 0.8 . Vasoconsticted or
dilated? • Next?
Volume responsive!
Case Presentation 2
• SVV 15% • PP/SV 1.8 • Sv02 50% • Sti02 40% • Next?
Vasopressor

Tissue Perfusion: It really is everything! 3/5/12 [email protected]
39
Case Presentation 2
• SVV 20% • PP/SV 0.8 • Sv02 80% • Sti02 40% • Next?
Volume inotrope dilator
Remember……
A searchlight cannot be used effectively without a fairly thorough knowledge of the
territory to be searched. Fergus Macartney, FRCP
Before I came here I was confused about this subject. Having listened to your lecture I am still confused. But on a higher level.
-Enrico Fermi