Embed Size (px)
Citation preview

MONITORING OF SOLID WASTE IN
HONG KONG
Waste Statistics for 2013
Environmental Protection Department
Monitoring of Solid Waste in Hong Kong Waste Statistics for 2013
Date of issue: February 2015
Work done by: Statistics Unit,
Environmental Protection Department
Security classification: Unrestricted
Cover photos
Top left: Waste composition survey in progress
Bottom left: Operation in Landfill
Top right: Waste composition survey in progress
Bottom right: Locally collected recyclables
Information contained in this publication, which is the best available at the time of preparation, may be freely used. Reproduction of materials is permitted with notification to the Director of Environmental Protection. Acknowledgment must be made by indicating the title of this publication.
Monitoring of Solid Waste in Hong Kong - Waste Statistics for 2013
ii

Monitoring of Solid Waste in Hong Kong - Waste Statistics for 2013
Content
Page
Abbreviations iv
1. Introduction 1
2. Waste Quantities and Characteristics
Plate 2.1 Disposal of solid waste at landfills in 2013 2
Plate 2.2 Disposal of solid waste at landfills in 2012 and 2013 3
Plate 2.3 Disposal of solid waste at landfills from 2009 to 2013 3
Plate 2.4 Waste management facilities in Hong Kong 4
Plate 2.5 Solid waste delivered to RTS and landfills in 2013 5
Plate 2.6 Arisings of solid waste by district in 2013 6
Plate 2.7 Per capita disposal rates of municipal solid waste and domestic waste from 2004 to 2013
7
Plate 2.8 Composition of municipal solid waste in 2013 8
Plate 2.9 Composition of municipal solid waste in 2013 – Breakdown of major components
9
Plate 2.10 Composition of municipal solid waste in 2012 and 2013 – Major waste types
10
Plate 2.11 Disposal of construction waste by destination in 2012 and 2013 10
Plate 2.12 Disposal of special waste in 2013 11
3. Resource Recovery and Recycling
Plate 3.1 Recovery of municipal solid waste (MSW) in 2012 and 2013 12
Plate 3.2 MSW recovery rates from 2004 to 2013 12
Plate 3.3 Recyclable materials recovered from MSW by type in 2013 13
Plate 3.4 Recyclable materials recovered from MSW by type in 2012 and 2013
13
Plate 3.5 Total quantities and export values of recyclable materials recovered from MSW from 2009 to 2013
14
Plate 3.6 Values of exported recyclable materials recovered from MSW in 2012 and 2013
14
Plate 3.7 Quantities and values of exported recyclable materials recovered from MSW by type
15
Appendix 1 Classification of Solid Waste and Monitoring Methodology 16-17
iii

Monitoring of Solid Waste in Hong Kong - Waste Statistics for 2013
Abbreviations
AWCP Animal Waste Composting Plant
C&I Commercial and Industrial
C&SD Census and Statistics Department
CEDD Civil Engineering and Development Department
CWTC Chemical Waste Treatment Centre
EPD Environmental Protection Department
FEHD Food and Environmental Hygiene Department
IETS Island East Transfer Station
IWTS Island West Transfer Station
KBTS Kowloon Bay Transfer Station
MSW Municipal Solid Waste
NENT North East New Territories Landfill
NLTS North Lantau Transfer Station
NT New Territories
NWNTRTS North West New Territories Refuse Transfer Station
OITF Outlying Islands Transfer Facilities
PET Polyethylene Terephthalate
RTS Refuse Transfer Station(s)
SENT South East New Territories Landfill
STTS Sha Tin Transfer Station
tpd tonnes per day
WENT West New Territories Landfill
WKTS West Kowloon Transfer Station
iv

Monitoring of Solid Waste in Hong Kong - Waste Statistics for 2013
1. Introduction
This report presents the statistics on disposal and recovery / recycling of solid waste
generated in Hong Kong in the year 2013. It aims to provide readers with the latest
information available on solid waste.
The information contained in this report is compiled from the data collected from
various sources throughout the year, including the ongoing solid waste monitoring work
at waste facilities undertaken by the Environmental Protection Department.
The statistics on waste disposal and resource recovery and recycling are presented in
Chapters 2 and 3 respectively, and the classification of solid waste and the
methodology adopted in data collection are explained in Appendix 1.
In this report, figures of various plates may not add up to total and percentages may not
add up to 100 due to rounding off.
Abbreviations used in the report are listed on page iv for ease of reference.
1
Monitoring of Solid Waste in Hong Kong - Waste Statistics for 2013
2. Waste Quantities and Characteristics
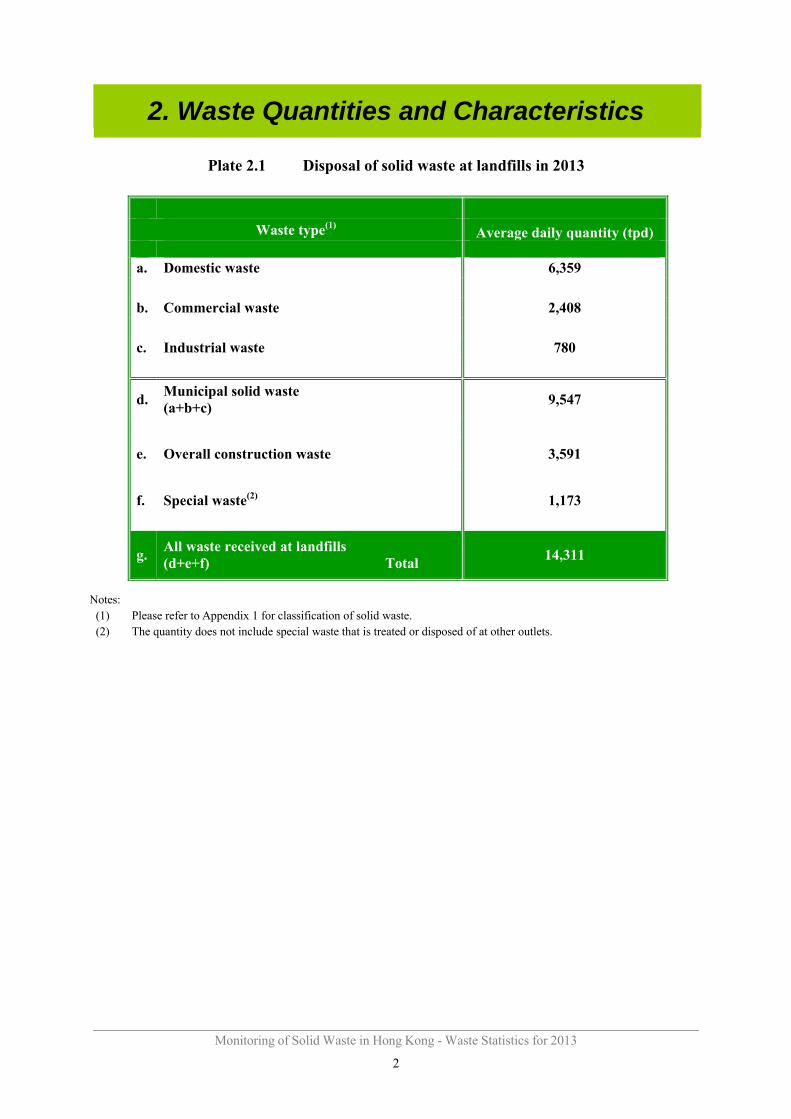
Plate 2.1 Disposal of solid waste at landfills in 2013
Waste type(1) Average daily quantity (tpd)
a. Domestic waste 6,359
b. Commercial waste 2,408
c. Industrial waste 780
Municipal solid wasted.
(a+b+c)9,547
e. Overall construction waste 3,591
f. Special waste(2) 1,173
All waste received at landfillsg.
(d+e+f) Total 14,311
Notes: (1) Please refer to Appendix 1 for classification of solid waste. (2) The quantity does not include special waste that is treated or disposed of at other outlets.
2

Monitoring of Solid Waste in Hong Kong - Waste Statistics for 2013
Plate 2.2 Disposal of solid waste at landfills in 2012 and 2013
Municipal solid waste 9,278 tpd
(67%)
Overall construction
waste 3,440 tpd
(25%)
Special waste 1,127 tpd
(8%)
Total quantity: 13,844 tpd
2012
Municipalsolid waste9,547 tpd
(67%)
Overall construction
waste 3,591 tpd
(25%)
Special waste 1,173 tpd
(8%)
Total quantity: 14,311 tpd
2013
Plate 2.3 Disposal of solid waste at landfills from 2009 to 2013
3,121 3,584 3,331 3,440 3,591
6,015 6,135
5,973 6,286 6,359
2,948 2,979
3,0232,992
3,188
1,243 1,119
1,131 1,127
1,173
0
2,000
4,000
6,000
8,000
10,000
12,000
14,000
16,000
2009 2010 2011 2012 2013
Ton
nes
per
day
Year
Special waste Commercial & industrial waste Domestic waste Overall construction waste
Total 13,326 13,817 13,458 13,844 14,311
Remark: Figures may not add up to total due to rounding off.
Note: (1) Waste concrete delivered to landfills as industrial waste since 2007 was re-grouped under overall construction waste. Its
corresponding quantity has been deducted from commercial and industrial waste.
3

Monitoring of Solid Waste in Hong Kong - Waste Statistics for 2013
Plate 2.4 Waste management facilities in Hong Kong
WENT
SENT
NENT
CWTC
WKTS
KBTSNLTS
STTS
OITF
NWNTRTS
IETS
IWTS
♦EcoPark
▲
SLCP▲
AWCP
Guangdong Sheng
Landfill ●
▪
WENT - West New Territories Landfill
SENT - South East New Territories Landfill
NENT - North East New Territories Landfill
RTS IETS - Island East Transfer Station(1)
IWTS - Island West Transfer Station(1)
WKTS - West Kowloon Transfer Station(1)
OITF - Outlying Islands Transfer Facilities(1)
NLTS - North Lantau Transfer Station(1)
STTS - Sha Tin Transfer Station(2)
NWNTRTS - North West New Territories Refuse Transfer Station(3)
KBTS - Kowloon Bay Transfer Station(4)
CWTC CWTC - Chemical Waste Treatment Centre
CompostingPlant
AWCP - Animal Waste Composting Plant
SLCP - Shaling Composting Plant(5)
EcoPark ♦
▲
EcoPark
Notes:
(1) Waste from IETS, IWTS, WKTS, OITF and NLTS was transferred to WENT by sea.
(2) Waste from STTS was transferred to NENT by road.
(3) Waste from NWNTRTS was transferred to WENT by road.
(4) KBTS was temporarily closed in April 2005 and converted to a waste recycling centre.
(5) SLCP has stopped operation since October 2010.
4

Monitoring of Solid Waste in Hong Kong - Waste Statistics for 2013
Plate 2.5 Solid waste delivered to RTS and landfills in 2013
(1)
Disposal facility
Average daily quantity (tpd)
MSW Overall
construction waste
Special waste
Total
IETS - Island East Transfer Station 798 - - 798
STTS - Sha Tin Transfer Station 1,118 - - 1,118
IWTS - Island West Transfer Station 556 - - 556
WKTS - West Kowloon Transfer Station 2,385 - 461 2,847
OITF - Outlying Islands Transfer Facilities 81 25 4 110
NLTS - North Lantau Transfer Station 189 - 1 190
NWNTRTS - North West New Territories Refuse Transfer Station
1,045 - - 1,045
WENT - West New Territories Landfill 5,424(2) 700(2) 527 6,651(2)
SENT - South East New Territories Landfill 1,981 2,303 391 4,674
NENT - North East New Territories Landfill 2,142(2) 588 255 2,985(2)
Total 9,547 3,591 1,173 14,311
Notes: (1) Please refer to Plate 2.12 for solid waste delivered to other waste management facilities and outlets. (2) The quantity includes the waste transferred from RTS.
5

Monitoring of Solid Waste in Hong Kong - Waste Statistics for 2013
Plate 2.6 Arisings of solid waste by district in 2013
District
Average daily quantity(1) (2) (tpd)
Domestic waste
(a)
C&I waste
(b)
Municipal solid waste
(c) =(a)+(b)
Overall construction
waste
(d)
Central & Western 282 94
376 134Wanchai 248 147 395 79Eastern 453 140 593 71Southern 221 88 309 127 Hong Kong Island Sub-total 1,204 468 1,672 411 Yau Tsim Mong 519 217 736 167Sham Shui Po 352 159 512 91Kowloon City 310 173 482 407
39Wong Tai Sin 292 148 440Kwun Tong 533 235 768 410
Kowloon Sub-total 2,006 931 2,937 1,114 Kwai Tsing 326 158 483 168Tsuen Wan 253 159 413 100Tuen Mun 393 288 681 449Yuen Long 602 379 981 167North 357 189 546 93Tai Po 293 98 392 124Sha Tin 428 153 581 134
773Sai Kung 336 237 573 NT- Mainland Sub-total 2,989 1,662 4,651 2,008
Cheung Chau 27 - - -Mui Wo 24 - - -Peng Chau 7 - - -Ma Wan 11 - - -Lamma Island 9 - - -Hei Ling Chau 3 - - -North Lantau 79 - - -NT-Outlying Islands Sub-total 160 127(3) 287(3) 58(3)
Total 6,359 3,188 9,547 3,591
Notes: (1) The geographical distribution of solid waste arisings is estimated from waste intake records taken at waste management
facilities and should be regarded as indicative reference only. (2) Special waste is not included. (3) Breakdown into individual islands / areas is not available.
6
Monitoring of Solid Waste in Hong Kong - Waste Statistics for 2013
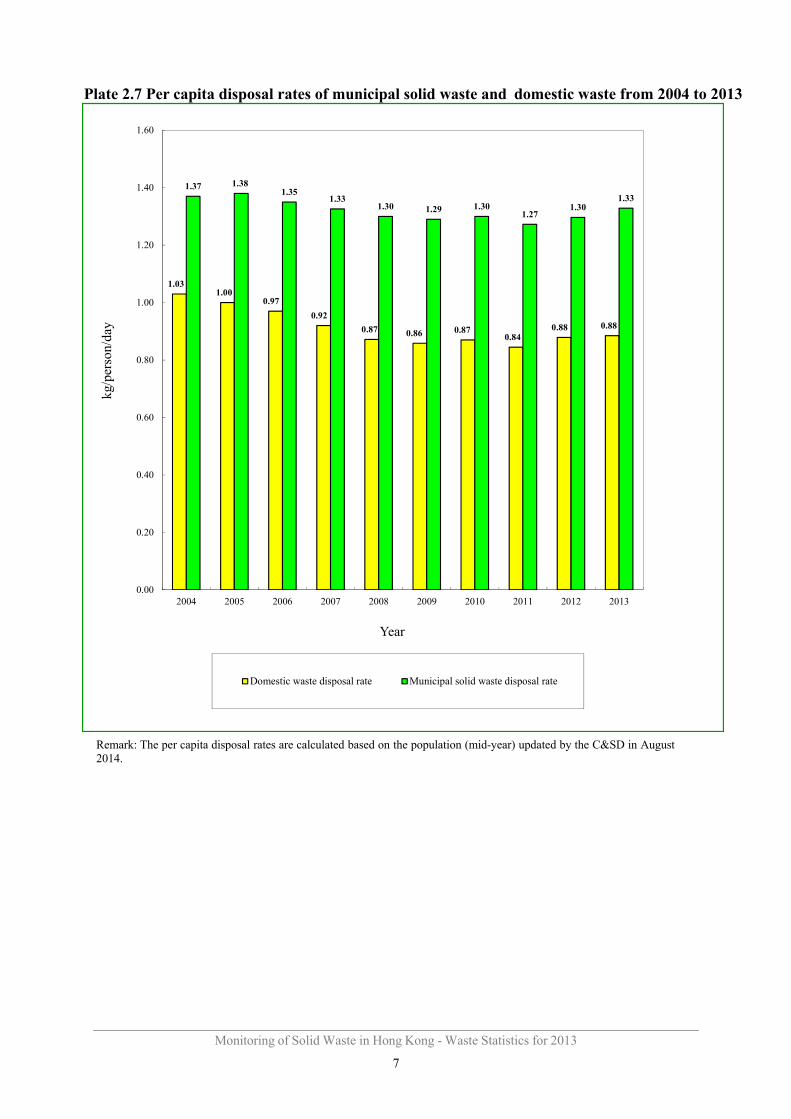
Plate 2.7 Per capita disposal rates of municipal solid waste and domestic waste from 2004 to 2013
1.03 1.00
0.97
0.92
0.87 0.86 0.87 0.84
0.88 0.88
1.37 1.381.35
1.331.30 1.29 1.30
1.271.30
1.33
0.00
0.20
0.40
0.60
0.80
1.00
1.20
1.40
1.60
2004 2005 2006 2007 2008 2009 2010 2011 2012 2013
kg/p
erso
n/da
y
Year
Domestic waste disposal rate Municipal solid waste disposal rate
Remark: The per capita disposal rates are calculated based on the population (mid-year) updated by the C&SD in August 2014.
7

Monitoring of Solid Waste in Hong Kong - Waste Statistics for 2013
Plate 2.8 Composition of municipal solid waste in 2013
Composition
Average daily quantity (tpd) and percentage by weight
Domestic waste
(a)
Commercial waste
(b)
Industrial waste
(c)
Commercial & industrial waste
(d)=(b)+(c)
Municipal solid waste
(e)=(a)+(d)
Glass 248 85 21 106 353
(3.9%) (3.5%) (2.7%) (3.3%) (3.7%)
Metals 102 56 19 75 177
(1.6%) (2.3%) (2.5%) (2.4%) (1.9%)
Paper 1,195 534 93 628 1,823
(18.8%) (22.2%) (12.0%) (19.7%) (19.1%)
Plastics 1,212 504 150 654 1,866 (19.1%) (20.9%) (19.2%) (20.5%) (19.5%)
Putrescibles 3,100 1,014 75 1,089 4,189
(48.7%) (42.1%) (9.6%) (34.2%) (43.9%)
Textiles 176 52 43 95 270
(2.8%) (2.1%) (5.5%) (3.0%) (2.8%)
Wood/Rattan 97 42 255 297 394
(1.5%) (1.7%) (32.7%) (9.3%) (4.1%)Household hazardous wastes
82 20 17 37 118
(HHWs)(1) (1.3%) (0.8%) (2.2%) (1.2%) (1.2%)
(2)Others 148 101 107 208 355
(2.3%) (4.2%) (13.7%) (6.5%) (3.7%) Sub-total 6,359
(100%)
2,408
(100%)
780
(100%)
3,188
(100%)
9,547
(100%)
Remark: Figures denote quantities and percentages by wet weight.
Notes: (1) Household hazardous wastes (HHWs) include paints, pesticides, fuels, cylinders, batteries, electrical appliances,
computer products, mercury-containing fluorescent lamps and medicines, etc. (2) Other waste includes bulky items and other miscellaneous materials.
8
Monitoring of Solid Waste in Hong Kong - Waste Statistics for 2013
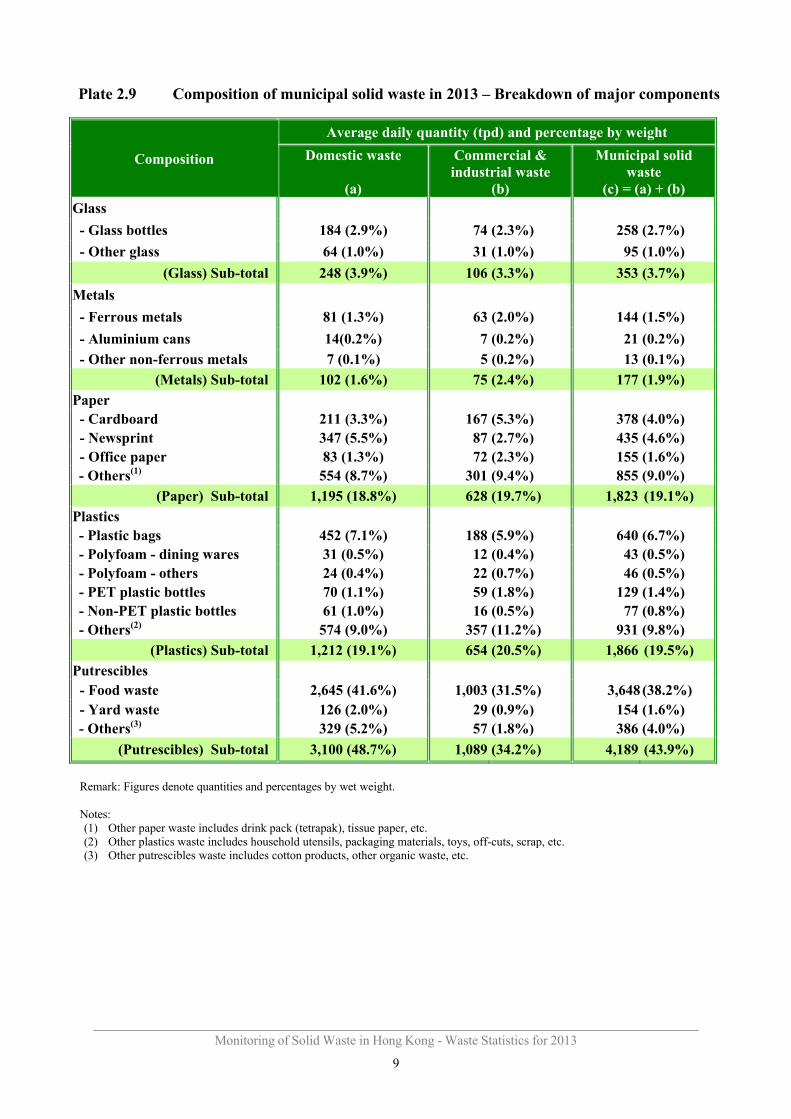
Plate 2.9 Composition of municipal solid waste in 2013 – Breakdown of major components
Composition
Average daily quantity (tpd) and percentage by weight
Domestic waste
(a)
Commercial & industrial waste
(b)
Municipal solid waste
(c) = (a) + (b) Glass
- Glass bottles 184 (2.9%) 74 (2.3%) 258 (2.7%)
- Other glass 64 (1.0%) 31 (1.0%) 95 (1.0%)
(Glass) Sub-total 248 (3.9%) 106 (3.3%) 353 (3.7%)
Metals
- Ferrous metals 81 (1.3%) 63 (2.0%) 144 (1.5%)
- Aluminium cans 14(0.2%) 7 (0.2%) 21 (0.2%)
- Other non-ferrous metals 7 (0.1%) 5 (0.2%) 13 (0.1%)
(Metals) Sub-total 102 (1.6%) 75 (2.4%) 177 (1.9%)
Paper- Cardboard 211 (3.3%) 167 (5.3%) 378 (4.0%) - Newsprint 347 (5.5%) 87 (2.7%) 435 (4.6%) - Office paper 83 (1.3%) 72 (2.3%) 155 (1.6%) - Others(1) 554 (8.7%) 301 (9.4%) 855 (9.0%)
(Paper) Sub-total 1,195 (18.8%) 628 (19.7%) 1,823 (19.1%)
Plastics- Plastic bags 452 (7.1%) 188 (5.9%) 640 (6.7%) - Polyfoam - dining wares 31 (0.5%) 12 (0.4%) 43 (0.5%) - Polyfoam - others 24 (0.4%) 22 (0.7%) 46 (0.5%) - PET plastic bottles 70 (1.1%) 59 (1.8%) 129 (1.4%) - Non-PET plastic bottles 61 (1.0%) 16 (0.5%) 77 (0.8%) - Others(2) 574 (9.0%) 357 (11.2%) 931 (9.8%)
(Plastics) Sub-total 1,212 (19.1%) 654 (20.5%) 1,866 (19.5%)
Putrescibles- Food waste 2,645 (41.6%) 1,003 (31.5%) 3,648 (38.2%) - Yard waste 126 (2.0%) 29 (0.9%) 154 (1.6%) - Others(3) 329 (5.2%) 57 (1.8%) 386 (4.0%)
(Putrescibles) Sub-total 3,100 (48.7%) 1,089 (34.2%) 4,189 (43.9%)
Remark: Figures denote quantities and percentages by wet weight.
Notes: (1) Other paper waste includes drink pack (tetrapak), tissue paper, etc. (2) Other plastics waste includes household utensils, packaging materials, toys, off-cuts, scrap, etc. (3) Other putrescibles waste includes cotton products, other organic waste, etc.
9

Monitoring of Solid Waste in Hong Kong - Waste Statistics for 2013
Plate 2.10 Composition of municipal solid waste in 2012 and 2013 – Major waste types
Paper21%
Metals3%
Glass3%
Plastics20%
Putrescibles42%
Others (1)
11%
2012
Paper19%
Metals2%
Glass4%
Plastics20%
Putrescibles44%
Others (1)
11%
2013
Note: (1) Others include textile, wood/rattan, household hazardous wastes and miscellaneous waste.
Plate 2.11 Disposal of construction waste by destination in 2012 and 2013
2012
Landfills 3,440 tpd
(5%)
Public fill reception facilities (1)
63,538 tpd(95%)
Total quantity: 66,978 tpd
Landfills3,591 tpd
(5%)
2013
Public fill reception facilities (1)
62,392 tpd(95%)
Total quantity: 65,983 tpd
Note: (1) Public fill reception facilities are managed by CEDD for receiving inert fill materials for reuse. In 2013, two major
public fill reception facilities are in operation at Tseung Kwan O and Tuen Mun.
10

Monitoring of Solid Waste in Hong Kong - Waste Statistics for 2013
Plate 2.12 Disposal of special waste in 2013
Waste type Disposal method Average daily
quantity(1) (tpd)
Abattoir waste Landfill 8
Animal carcasses and kennel waste Landfill 9
Asbestos waste Landfill 3
Chemical waste other than asbestos waste Landfill 7
Clinical waste (with packaging material) Landfill 1
Condemned goods Landfill 25
CWTC stabilised residue and incineration ash Landfill 11
Dewatered dredged materials Landfill 10
Dewatered sewage sludge Landfill 900
Dewatered waterworks sludge Landfill 50
Livestock waste Landfill 59
Sewage works screenings Landfill 65
Waste tyres (2)
Landfill 26
Landfill sub-total 1,173
Chemical waste other than asbestos waste CWTC 26
Clinical waste CWTC 5
Grease trap waste WKTS (3)
461
Horse stable waste AWCP 22
Livestock waste Other environmentally
(4)acceptable means
163
Dredged mud and excavated materials Marine dumping (5)
81,918
Furnace bottom ash Concrete manufacturing, stored in
lagoon(6) 122
Pulverised fuel ash Concrete manufacturing, stored in
lagoon(6) 1,308
Notes: (1) Some types of special waste may not arise daily throughout the whole year. The average daily quantity is the total
amount of waste generated in the year divided by the number of days in that year. (2) Waste Tyres are shredded or cut prior to disposal. (3) The figure is the quantity of grease trap waste treated by the Grease Trap Waste Treatment Facility at WKTS. (4) Examples of environmentally acceptable means include on-site composing, aerobic treatment, dry muck-out, etc. (5) The figure is calculated by assuming the density of the dredged mud and excavated materials to be one tonne per cubic
metre. (6) The figures are calculated by making reference to the information provided by the power companies.
11
Monitoring of Solid Waste in Hong Kong - Waste Statistics for 2013
3. Resource Recovery and Recycling
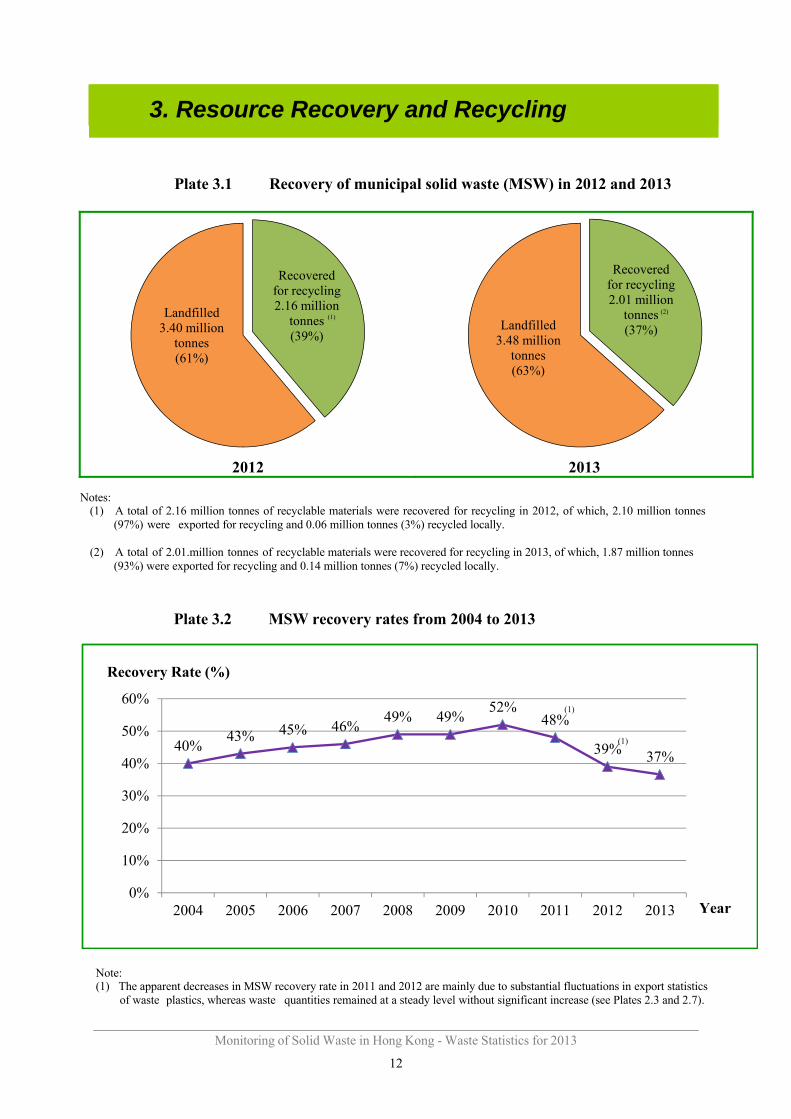
Plate 3.1 Recovery of municipal solid waste (MSW) in 2012 and 2013
Recovered for recycling 2.16 million
tonnes (39%)
Landfilled 3.40 million
tonnes(61%)
2012
(1)
Recovered for recycling 2.01 million
tonnes (37%)Landfilled
3.48 million tonnes(63%)
2013
(2)
Notes: (1) A total of 2.16 million tonnes of recyclable materials were recovered for recycling in 2012, of which, 2.10 million tonnes
(97%) were exported for recycling and 0.06 million tonnes (3%) recycled locally.
(2) A total of 2.01.million tonnes of recyclable materials were recovered for recycling in 2013, of which, 1.87 million tonnes (93%) were exported for recycling and 0.14 million tonnes (7%) recycled locally.
Plate 3.2 MSW recovery rates from 2004 to 2013
40%43% 45% 46%
49% 49%52%
48%
39% 37%
0%
10%
20%
30%
40%
50%
60%
2004 2005 2006 2007 2008 2009 2010 2011 2012 2013
Recovery Rate (%)
Year
(1)
(1)
Note: (1) The apparent decreases in MSW recovery rate in 2011 and 2012 are mainly due to substantial fluctuations in export statistics
of waste plastics, whereas waste quantities remained at a steady level without significant increase (see Plates 2.3 and 2.7).
12
Monitoring of Solid Waste in Hong Kong - Waste Statistics for 2013
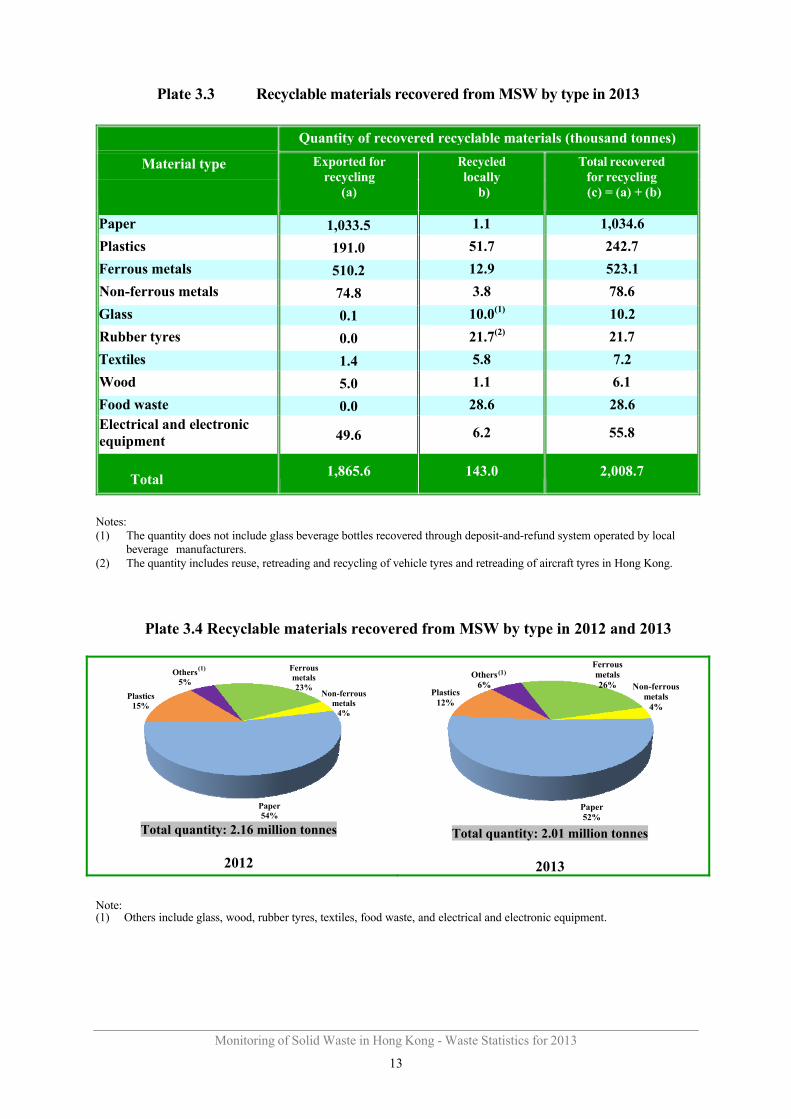
Plate 3.3 Recyclable materials recovered from MSW by type in 2013
Material type
Quantity of recovered recyclable materials (thousand tonnes)
Exported for recycling
(a)
Recycled locally
(b)
Total recovered for recycling
(c) = (a) + (b)
Paper 1,033.5 1.1 1,034.6
Plastics 191.0 51.7 242.7
Ferrous metals 510.2 12.9 523.1
Non-ferrous metals 74.8 3.8 78.6
Glass 0.1 10.0(1) 10.2
Rubber tyres 0.0 21.7(2) 21.7
Textiles 1.4 5.8 7.2
Wood 5.0 1.1 6.1
Food waste 0.0 28.6 28.6 Electrical and electronic equipment 49.6 6.2 55.8
Total 1,865.6 143.0 2,008.7
Notes:(1) The quantity does not include glass beverage bottles recovered through deposit-and-refund system operated by local
beverage manufacturers. (2) The quantity includes reuse, retreading and recycling of vehicle tyres and retreading of aircraft tyres in Hong Kong.
Plate 3.4 Recyclable materials recovered from MSW by type in 2012 and 2013
Ferrous metals23%
Non-ferrous metals
4%
Paper54%
Plastics15%
Others5%
(1)
Total quantity: 2.16 million tonnes
2012
Ferrous metals26% Non-ferrous
metals4%
Paper52%
Plastics12%
Others6%
(1)
Total quantity: 2.01 million tonnes
2013
Note: (1) Others include glass, wood, rubber tyres, textiles, food waste, and electrical and electronic equipment.
13
Monitoring of Solid Waste in Hong Kong - Waste Statistics for 2013
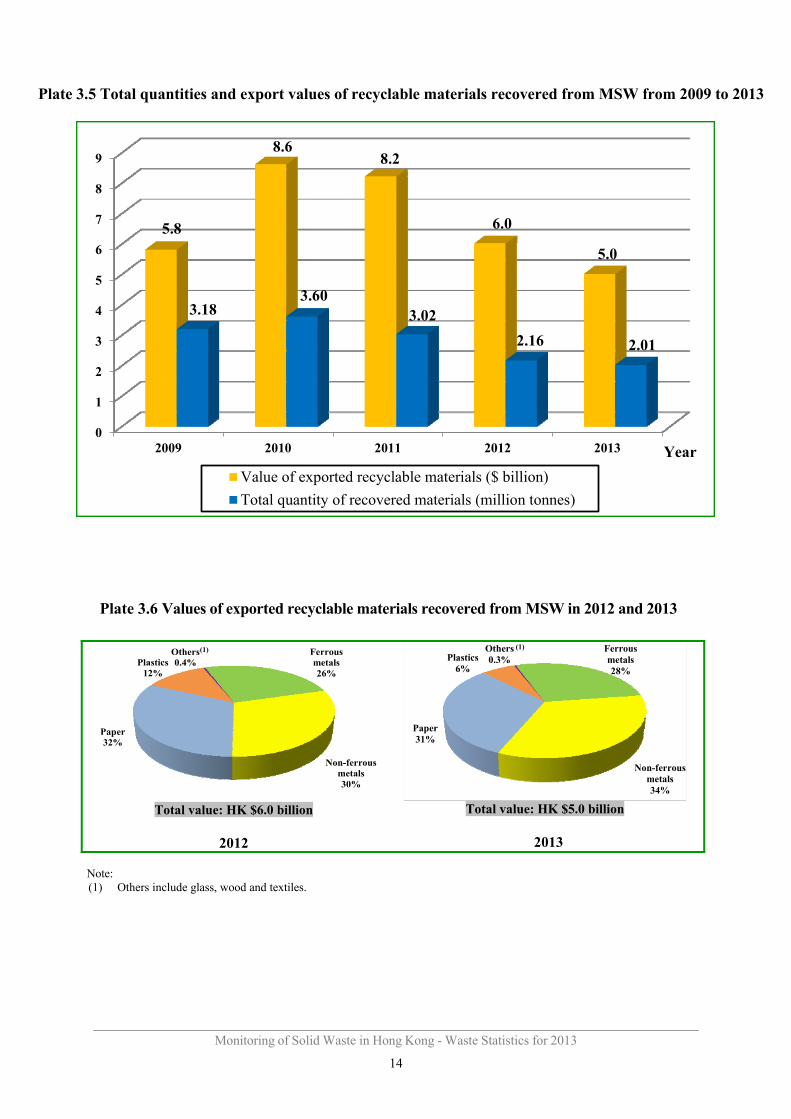
Plate 3.5 Total quantities and export values of recyclable materials recovered from MSW from 2009 to 2013
0
1
2
3
4
5
6
7
8
9
2009 2010 2011 2012 2013
5.8
8.68.2
6.0
5.0
3.183.60
3.02
2.16 2.01
Value of exported recyclable materials ($ billion)
Total quantity of recovered materials (million tonnes)
Year
Plate 3.6 Values of exported recyclable materials recovered from MSW in 2012 and 2013
Ferrous metals26%
Non-ferrous metals30%
Paper32%
Plastics12%
Others0.4%
(1)
Total value: HK $6.0 billion
2012
Ferrous metals28%
Non-ferrous metals34%
Paper31%
Plastics6%
Others0.3%
(1)
Total value: HK $5.0 billion
2013
Note: (1) Others include glass, wood and textiles.
14

Monitoring of Solid Waste in Hong Kong - Waste Statistics for 2013
Plate 3.7 Quantities and values of exported recyclable materials recovered from MSW by type
Category of recyclable materials Quantity
(tonnes)
Value
($ thousand)
Value per unit weight
($ / tonne)
a. Ferrous metals
~ Alloy steel scrap 11,919 136,334 11,438
~ Pig or cast iron 0 0 0
~ Tinplate 0 0 0
~ Other scraps 498,271 1,276,954 2,563
(Ferrous metals) Sub-total 510,190 1,413, 288 2,770
b. Non-ferrous metals
~ Aluminium 43,625 253,791 5,818
~ Copper & alloys 30,528 1,108,988 36,326
~ Lead 59 466 7,866
~ Metal ash & residues 399 4,687 11,754
~ Nickel 103 2,158 20,970
~ Precious metal (without scrap gold) 60 314,963 5,223,098
~ Tin 0 0 0
~ Zinc 20 93 4,706
(Non-ferrous metals) Sub-total 74,794 1,685,146 22,530
c. Plastics
~ Polyethylene 15,018 36,653 2,441
~ Polystyrene & copolymers 12,864 24,121 1,875
~ Polyvinyl chloride 8,776 22,421 2,555
~ Others 154,342 234,951 1,522 (Plastics) Sub-total 191,000 318,146 1,666
d. Textiles
~ Cotton 276 1,537 5,580
~ Man-made fibres 25 171 6,738 ~ Old clothing & other textile articles, rags,
etc. 1,068 9,119 8,538
(Textiles) Sub-total 1,369 10,828 7,909
e. Wood & paper
~ Paper 1,033,500 1,579,283 1,528
~ Wood (include sawdust) 5,020 5,020 1,000
(Wood & paper) Sub-total 1,038,520 1,584,303 1,526
f. Glass
~ Glass 144 118 823
(Glass) Sub-total
g. Electrical and electronic equipment 49,618 N/A N/A
15

Monitoring of Solid Waste in Hong Kong - Waste Statistics for 2013
Appendix 1: Classification of Solid Waste and Monitoring Methodology
Waste Classification and Terminology
Solid waste is classified into three main categories by making reference to the sources of waste and the institutional arrangements for waste collection and disposal. These three categories of solid waste are municipal solid waste, overall construction waste and special waste. The detailed interpretations of some commonly used terms are described below.
Municipal solid waste includes domestic waste, commercial waste and industrial waste.
Domestic waste refers to household waste, waste generated from daily activities ininstitutional premises and refuse collected from public cleansing services. Publiccleansing waste includes dirt and litter collected by the Food and Environmental HygieneDepartment, marine refuse collected by the Marine Department and waste from countryparks collected by the Agriculture, Fisheries and Conservation Department.
Commercial waste is waste arising from commercial activities taking place in shops,restaurants, hotels, offices, markets in private housing estates, etc. It is collected mainlyby private waste collectors.
Industrial waste is waste arising from industrial activities and does not includeconstruction waste and chemical waste. It is usually collected by private waste collectors.However, some industries may deliver their industrial waste directly to landfills fordisposal.
Municipal solid waste contains a small portion of bulky items like furniture and domesticappliances which cannot be handled by conventional compactor type refuse collectionvehicles. These items are regarded as bulky waste and are usually collected separately.
Overall construction waste is a mixture of waste or surplus materials arising from construction activities such as site clearance, excavation, refurbishment, renovation, demolition and road works. It also includes waste concrete that is generated from concrete batching plants and cement plaster/mortar manufacturing plants not set up inside construction sites. Overall construction waste may comprise a fraction of inert materials such as debris, rubble, earth and concrete, which, after proper sorting, can be recycled for use in site formation, land reclamation and construction.
Special waste is waste that requires special disposal arrangement. It includes abattoir waste, animal carcasses, asbestos, chemical waste, clinical waste, condemned goods, CWTC stabilized residue, dredged mud and excavated materials, sewage treatment and waterworks treatment sludge, grease trap waste, livestock waste, sewage works screenings, waste tyres, furnace bottom ash, pulverised fuel ash, etc.
Chemical waste is defined in the Waste Disposal (Chemical Waste) (General) Regulation under the Waste Disposal Ordinance (Cap. 354). Chemical waste can be any substance
16

Monitoring of Solid Waste in Hong Kong - Waste Statistics for 2013
arising from any process or trade activity which contains chemical in such form, quantity or concentration that can cause pollution to the environment or become a risk to health.
Current classification of solid waste
Solid Waste
Municipal Solid Waste
Domestic waste
- Household- Institutional
(schools, government offices, FEHD public markets, etc.)
- Public cleansing
Commercial waste
- Shops, restaurants, offices, hotels, non-FEHD markets, etc.
Industrialwaste
- Industrial activities
Overall Construction
Waste
- Construction activities such as demolition, excavation, renovation works, road works, site clearance, etc.
- Concrete batching plants, etc.
Special Waste
- Abattoir waste- Animal carcasses- Asbestos- Chemical waste- Clinical waste- Condemned goods- CWTC stabilized
residue- Dredged mud and
excavated materials- Sewage treatment and
waterworks treatment sludge
- Grease trap waste- Livestock waste- Sewage works
screenings- Waste tyres- Furnace bottom ash- Pulverised fuel ash, etc.
Methodology
Solid waste data are mainly collected from the following sources: Waste intake records taken at waste management facilities;
Results of annual survey on waste composition conducted from February to March 2013and from October to December 2013 at landfills and RTS;
Results of waste recovery survey conducted from May to October 2014 by URS HongKong Limited;Statistics provided by relevant groups of EPD; and
Statistics provided by other departments including FEHD, CEDD and C&SD.
17