Embed Size (px)
Citation preview

MONITORING OF SOLID WASTE IN HONG KONG Waste Statistics for 2002
Environmental Protection Department

ii
Monitoring of Solid Waste in Hong Kong
Waste Statistics for 2002
Date April 2003 (Last updated in June 2003)
Author Mr. Terence L.C. Tsoi, Mr. Sam Choi
Work Done By Mr. K.B. Yuen, Mr. K.F. Wong Mr. W.M. Kwong, Miss M.Y. Lee
Approved By Dr. Lawrence T.K. Wong
Published By Facilities Planning Group, Environmental Protection Department
Security Classification Unrestricted
Information contained in this publication may be freely used. Reproduction of materials is permitted with notification to the Director of Environmental Protection. Acknowledgment must be made by indicating the title of this publication.
Front page : The Ma Wan Transfer Facility comes into operation in 2003

Content
page Abbreviations iv
1. Introduction 1
2. Waste Quantities and Characteristics
Plate 2.1 Solid waste disposal by category in 2002 2
Plate 2.2 Solid waste disposal by category in 2001 & 2002 3
Plate 2.3 Solid waste disposal in 1998 – 2002 3
Plate 2.4 Solid waste disposal by destination in 2002 4
Plate 2.5 Solid waste delivered to RTS and landfills in 2002 5
Plate 2.6 Origin of solid waste by district in 2002 6
Plate 2.7 Per capita disposal rates of municipal solid waste and domestic waste in 1998 - 2002
7
Plate 2.8 Composition of municipal solid waste in 2002 8
Plate 2.9 Domestic waste and C&I waste by major waste type in 2002 9
Plate 2.10 Municipal solid waste by waste type in 2001 & 2002 10
Plate 2.11 Disposal of C&D Materials by destination in 2001 & 2002 10
Plate 2.12 Disposal of special and other waste by type in 2002 11
3. Waste Recovery and Recycling
Plate 3.1 Recovery of municipal solid waste in 2001 & 2002 12
Plate 3.2 Municipal solid waste recovery rates in 1998 - 2002 13
Plate 3.3 Recovered recyclable materials by type in 2002 13
Plate 3.4 Recovered recyclable materials by type in 2001 & 2002 14
Plate 3.5 Total quantities and export values of recovered recyclable materials in 1998 - 2002
14
Plate 3.6 Values of exported recyclable materials in 2001 & 2002 15
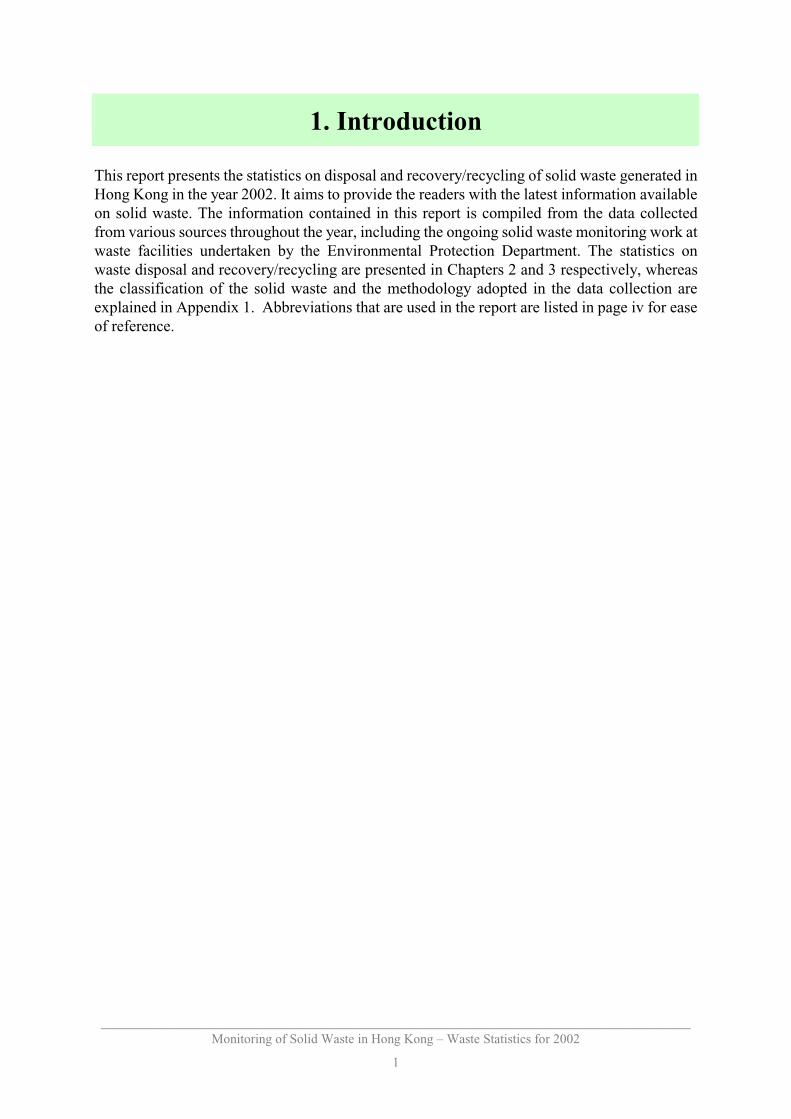
Plate 3.7 Quantities and values of exported recyclable materials by type 16
Appendix 1 Classification of Solid Waste and Monitoring Methodology 17-18
iii

Abbreviations
C&D Construction and Demolition
C&I Commercial and Industrial
CED Civil Engineering Department
CWTC Chemical Waste Treatment Centre
EPD Environmental Protection Department
EPS Expanded Polystyrene
FEHD Food and Environmental Hygiene Department
IETS Island East Refuse Transfer Station
IWTS Island West Refuse Transfer Station
KBTS Kowloon Bay Refuse Transfer Station
MSW Municipal Solid Waste
NENT North East New Territories Landfill
NLTS North Lantau Refuse Transfer Station
NT New Territories
NWNTRTS North West New Territories Refuse Transfer Station
OITF Outlying Islands Refuse Transfer Facilities
RTS Refuse Transfer Station(s)
SENT South East New Territories Landfill
STTS Sha Tin Refuse Transfer Station
tpd tonnes per day
WENT West New Territories Landfill
WKTS West Kowloon Refuse Transfer Station
iv
________________________________________________________________________________________
1. Introduction
This report presents the statistics on disposal and recovery/recycling of solid waste generated in Hong Kong in the year 2002. It aims to provide the readers with the latest information available on solid waste. The information contained in this report is compiled from the data collected from various sources throughout the year, including the ongoing solid waste monitoring work at waste facilities undertaken by the Environmental Protection Department. The statistics on waste disposal and recovery/recycling are presented in Chapters 2 and 3 respectively, whereas the classification of the solid waste and the methodology adopted in the data collection are explained in Appendix 1. Abbreviations that are used in the report are listed in page iv for ease of reference.
Monitoring of Solid Waste in Hong Kong – Waste Statistics for 2002
1

_____________________________________________________________________________ Monitoring of Solid Waste in Hong Kong - Waste Statistics for 2002
2
2. Waste Quantities and Characteristics
Plate 2.1 Solid waste disposal by category in 2002
Waste type (1)
Quantity (tpd) Change from 2001
Public(2) Private (3) Total Quantity(tpd)
Percentage
a. Domestic waste- waste from household, public cleansing 5,961 1,480 7,441 - bulky waste (4) 28 50 78
Sub-total 5,989 1,530 7,519 -32 -0.4%
b. Commercial waste- mixed waste from commercial activities - 1,278 1,278- bulky waste (4) - 64 64
Sub-total 1,342 1,342 +155 +13.1%
c. Industrial waste- mixed waste from industrial activities - 536 536
(4)- bulky waste - 25 25 Sub-total 561 561 -1 -0.2%
d. Municipal solid wastereceived at disposal facilities(a+b+c)
5,989 3,433 9,422 +122 +1.3%
e. Construction & demolition waste - 10,202 10,202 +3,794 +59.2%
f. Special waste 883 651 1,534 +426 +38.4%
g. All waste received at landfills
(d+e+f) 6,872 14,286 21,158 +4,341 +25.8%
Remark: Figures may not add up to total due to rounding off.
Notes: (1) Please refer to Appendix 1 for classification of solid waste. (2) Waste collected by the FEHD, FEHD contractors and other government vehicles. (3) Waste collected by private waste collectors. (4) These are bulky items like furniture and domestic appliances which cannot be handled by conventional compactor
type refuse collection vehicles and are usually collected separately.

_____________________________________________________________________________________
Plate 2.2 Solid waste disposal by category in 2001 & 2002
Special waste Special waste 1,109 tpd 1,534 tpd
(7%) (7%)
C&D waste 6,408 tpd
(38%)
Municipal solid waste 9,300 tpd
(55%)
Total quantity : 16,817 tpd
2001 Total quantity : 21,158 tpd
2002
C&D waste 10,202 tpd
(48%)
Municipal solid waste 9,422 tpd
(45%)
Solid waste disposal in 1998 – 2002
Ton
nes
per
day
Plate 2.3
24,000
20,000
16,000
12,000
8,000
4,000
0
7,033 7,895 7,475 6,408
10,202
6,822 7,426 7,540
7,551
7,519 1,910
1,843 1,795 1,749
1,903 880 1,094
1,109
1,534
794
1998 1999 2000 2001 2002 Year
C&D Domestic waste C&I Special waste
Monitoring of Solid Waste in Hong Kong - Waste Statistics for 2002
3

_____________________________________________________________________________________
Plate 2.4 Solid waste disposal by destination in 2002
GGuuangdonangdong Shg Shengeng NENENTNT
NWNWNTNTRTRTSS
WEWENNTT
STSTTTSS
WKWKTTSS
NNLTSLTS KKBTSBTS
CWCWTTCC
SESENNTT
IWIWTTSS
IIETSETS
OIOITTFF
Landfill WENT
6,363 tpd
(+8.5%)
SENT 11,116 tpd
(+51.1%)
NENT 3,679 tpd
(+2.3%)
RTS
IETS (1)
916 tpd (+3.7%)
IWTS (1)
499 tpd (+2.7%)
WKTS (1)
1,635 tpd (+6.7%)
OITF (1)
94 tpd (2)
(+6.8%)
NLTS (1)
129 tpd (+2.4%)
KBTS (3)
1,026 tpd
(-4.3%)
STTS (3)
771 tpd
(-13.4%)
NWNTRTS (4)
716 tpd
(+28.8%)(5)
CWTC 144 tpd
(-15.8%)
Remarks :
Percentage increase/decrease of waste quantity over previous year is shown in brackets.
Notes : (1) Waste from IETS, IWTS, WKTS, OITF and NLTS was transferred to WENT by sea. (2) The quantity shown here does not include inert C&D material received by OITF (3) Waste from KBTS and STTS was transferred to NENT by road. (4) Waste from NWNTRTS was transferred to WENT by road. (5) The NWNTRTS was commissioned in September 2001 and the average daily intake for the period of
September to December 2001 was 556 tpd.
Monitoring of Solid Waste in Hong Kong - Waste Statistics for 2002
4

_____________________________________________________________________________ Monitoring of Solid Waste in Hong Kong - Waste Statistics for 2002
5
Plate 2.5 Solid waste delivered to RTS and landfills in 2002
Disposal facilities
Average daily waste intake by waste type in 2002(tpd)
MSW Construction
& demolition
Special Total Public(1) Private(2)
KBTS - Kowloon Bay Refuse Transfer Station (3) 1,019 - - 7 1,026
IETS - Island East Refuse Transfer Station (4) 871 45 - - 916
STTS - Sha Tin Refuse Transfer Station (3) 771 - - - 771
IWTS - Island West Refuse Transfer Station (4) 460 39 - - 499
WKTS - West Kowloon Refuse Transfer Station (4) 1,527 108 - - 1,635
OITF - Outlying Islands Refuse Transfer Facilities (4) 91 - - 3 94(5)
NLTS - North Lantau Refuse Transfer Station (4) 45 83 - 1 129
NWNTRTS-North West New Territories Refuse Transfer Station (6) 699 17 - 716
WENT - West New Territories Landfill 3,810(7) 730(7) 909 914(7) 6,363(7)
SENT - South East New Territories Landfill 219 2,094 8,333 471 11,116
NENT - North East New Territories Landfill 1,961(7) 609 960 149 3,679(7)
Sub-total 5,989 3,433
Total 9,422 10,202 1,534 21,158
Remark: Figures may not add up to total due to rounding off.
Notes : (1) Waste collected by the FEHD, FEHD contractors and other government vehicles. (2) Waste collected by private waste collectors. (3) Waste from KBTS, and STTS (except special waste) was transferred to NENT by road. (4) Waste from IETS, IWTS, WKTS, OITF and NLTS was transferred to WENT by sea. (5) The quantity shown here does not include inert C&D material received by OITF (42 tpd). (6) Waste from NWNTRTS was transferred to WENT by road. (7) The quantity shown here includes the waste transferred from the RTS/OITF.

_________________________________________________________________________________ Monitoring of Solid Waste in Hong Kong - Waste Statistics for 2002
6
Plate 2.6 Origin of solid waste by district in 2002
Districts
Quantity(1) (tpd)
Domestic waste
Publiclycollected(2)
Privatelycollected
C&I waste
Municipal solid waste
C&D waste Total(3)
(a) (b) (c) (d) =(a)+(b)+(c) (e) (f) =(d)+(e)
Central & Western 352 92 77 521 678 1,199 Wanchai 276 70 69 415 221 636 Eastern 413 122 97 632 317 949 Southern 291 8 35 334 67 402
Hong Kong Island Sub-total 1,331 293 279 1,903 1,283 3,186
Yau Tsim Mong 502 80 109 691 579 1,270 Sham Shui Po 346 145 233 725 701 1,426 Kowloon City 271 124 72 467 438 905 Wong Tai Sin 347 52 43 441 373 815 Kwun Tong 446 110 177 733 1,546 2,279
Kowloon Sub-total 1,913 510 634 3,057 3,638 6,695
Kwai Tsing 333 30 106 469 270 739 Tsuen Wan 245 74 162 481 395 876 Tuen Mun 367 77 121 565 414 979 Yuen Long 502 68 175 744 376 1,120 North 188 240 83 512 507 1,019 Tai Po 272 48 34 354 232 586 Sha Tin 482 64 142 687 271 958 Sai Kung 219 124 83 426 2,659 3,085
New Territories Sub-total 2,607 726 906 4,239 5,125 9,363
Cheung Chau(4) 39
- - 39 - - Mui Wo(4) 30 - - 30 - - Peng Chau(4) 8 - - 8 - - Lamma Island(4) 12 - - 12 - - Hei Ling Chau(4) 4 - - 4 - - North Lantau(4) 45 - 85 130 - -
Outlying Islands Sub-total 138 1 85 223 157(5) 379
Total 5,989 1,530 1,903 9,422 10,202 19,624
Remark: Figures may not add up to total due to rounding off.
Notes : (1) The geographical distribution of solid waste origin is based on weighbridge records at waste facilities and
should be regarded as indicative reference only. (2) Publicly collected domestic waste also included public cleansing waste as well as some mixed non-domestic waste. (3) Special waste is not included in this Plate. (4) These islands/areas are aggregated to form the waste arising district "Outlying Islands". (5) Breakdown into individual islands/areas is not available.

____
Plate 2.7 Per capita disposal rates of municipal solid waste and domestic waste in 1998 - 2002
1.13 1.12 1.11 1.12
1.04
1.4 1.4 1.38 1.39
1.33
0.8
1
1.2
1.4
1.6
1998 1999 2000 2001 2002 Year
kg/p
erso
n/da
y
Domestic waste Municipal solid waste
_________________________ _______________________________ Monitoring of So Statistics for 2002
_________________________lid Waste in Hong Kong - Waste
7

_____________________________________________________________________________________ Monitoring of Solid Waste in Hong Kong - Waste Statistics for 2002
8
Plate 2.8 Composition of municipal solid waste in 2002
Quantity (tpd) and percentage by weight
Domestic
Waste
(a)
Commercial
Waste
(b)
Industrial
Waste
(c)
Commercial &
Industrial Waste
(d)=(b)+(c)
Municipal Solid
Waste
(e)=(a)+(d)
Bulky waste 77(1.0%)
64(4.7%)
25(4.4%)
89(4.7%)
166(1.8%)
Glass 256(3.4%)
33(2.4%)
6(1.0%)
39(2.1%)
295(3.1%)
Metals 262(3.5%)
44(3.3%)
15(2.7%)
59(3.1%)
321(3.4%)
Paper 1,902(25.3%)
415(30.9%)
59(10.6%)
474(24.9%)
2,376(25.2%)
Plastics 1,394(18.5%)
309(23.0%)
100(17.8%)
409(21.5%)
1,803(19.1%)
Putrescibles 3,129(41.6%)
387(28.9%)
17(3.0%)
404(21.3%)
3,533(37.5%)
Textiles 191(2.5%)
37(2.7%)
36(6.4%)
73(3.8%)
264(2.8%)
Wood/rattan 67(0.9%)
23(1.7%)
184(32.7%)
207(10.9%)
274(2.9%)
HouseholdHazardous Wastes
(HHWs) (1)
111(1.5%)
9(0.7%)
17(3.0%)
26(1.4%)
137(1.5%)
Others 130(1.7%)
21(1.6%)
103(18.3%)
124(6.5%)
254(2.7%)
Total 7,519
(100%)
1,342
(100%)
562
(100%)
1,902
(100%)
9,422
(100%)
Remark: Figures indicate the quantities and percentages by wet weight, and may not add up to total due to rounding-off.
Note : (1) Household Hazardous Wastes (HHWs) include paints, detergents, pesticides, fuels, cylinders, batteries, electrical
appliances, computer products, mercury-containing fluorescent lamps and medicines, etc.

_____________________________________________________________________ Monitoring of Solid Waste in Hong Kong - Waste Statistics for 2002
9
Plate 2.9 Domestic waste and C&I waste by major waste type in 2002
Waste TypeDomestic Waste C&I Waste
Quantity (tpd) % by weight Quantity (tpd) % by weight
Glass- Clear Glass Bottles 118 (1.6%) 17 (0.9%)- Brown Glass Bottles 29 (0.4%) 3 (0.2%)- Green Glass Bottles 28 (0.4%) 6 (0.3%)- Other Glass 80 (1.1%) 12 (0.7%)
(Glass) Sub-total 256 (3.4%) 39 (2.0%)
Metals- Ferrous Metals 227 (3.0%) 45 (2.4%)- Aluminium Cans 23 (0.3%) 3 (0.1%)- Other Non-ferrous Metals 12 (0.2%) 11 (0.6%)
(Metals) Sub-total 262 (3.5%) 59 (3.1%)
Paper- Cardboard 297 (4.0%) 81 (4.3%)- Newsprint 847 (11.3%) 72 (3.8%)- Office Paper 148 (2.0%) 73 (3.8%)
- Others (1) 609 (8.1%) 248 (13.0%)(Paper) Sub-total 1,902 (25.3%) 474 (24.9%)
Plastics- Clear Plastic Bags 224 (3.0%) 82 (4.3%)- Colour Bags (white, red, yellow, etc) 649 (8.6%) 109 (5.7%)- Polyfoam-Dining Wares 54 (0.7%) 23 (1.2%)- Polyfoam-Other 15 (0.2%) 12 (0.6%)- PET Bottles 50 (0.7%) 17 (0.9%)- Other Plastic Bottles 65 (0.9%) 7 (0.4%)- Off-cuts & Scrap 0 (0.0%) 24 (1.3%)- Others (2) 337 (4.5%) 135 (7.1%)
(Plastics) Sub-total 1,394 (18.5%) 409 (21.5%)
Putrescibles- Food Waste 2,782 (37.0%) 373 (19.6%)- Yard Waste 104 (1.4%) 1 (0.1%)- Others (3) 243 (3.2%) 29 (1.5%)
(Putrescibles) Sub-total 3,129 (41.6%) 404 (21.2%)
Remark: Figures indicate the quantities and percentages by wet weight, and may not add up to total due to rounding-off.
Notes : (1) Other paper sub-components are drink pack (tetrapak), tissue paper, etc. (2) Other plastics sub-components are household utensils, packaging materials, toys, etc. (3) Other putrescible waste include nappies and other organic waste.

______ ______ _________________________________________________________________________Monitoring of Solid Waste in Hong Kong - Waste Statistics for 2002
10
Plate 2.10 Municipal solid waste by waste type in 2001 & 2002
Others(1)
14%
Metals 3%
Glass 4%
Paper 25%
Plastics 15%
Putrescibles 39%
Total quantity : 9,300 tonnes per day
Paper 25%
Others(1)
12%
Metals 3%
Putrescibles 38%
Glass 3%
Plastics 19%
Total quantity : 9,422 tonnes per day
2001 2002
Note: (1) Others include bulky waste, textile, wood / rattan, household hazardous wastes and other unclassified waste.
Plate 2.11 Disposal of C&D Materials by destination in 2001 & 2002
Landfills 6,408 tpd
(17%)
Public filling areas 32,430 tpd
(83%)
Landfills 10,202 tpd
(22%)
Public filling areas 35,183 tpd
(78%)
Total quantity : 38,840 tpd Total quantity : 45,385 tpd
2001 2002

_____________________________________________________________________________________ Monitoring of Solid Waste in Hong Kong - Waste Statistics for 2002
11
Plate 2.12 Disposal of special and other waste by type in 2002
Waste type Disposal method Quantity disposed of (tpd)
Special Waste
Abattoir waste Landfilling 34
Animal carcasses Landfilling 20
Asbestos waste Co-disposal at landfills (1) 13
Chemical waste other than asbestos waste Co-disposal at landfills (1) 7
Clinical waste Co-disposal at landfills (1) 4
Condemned goods Landfilling 21
CWTC stabilised residue Landfilling 34
Dewatered dredged materials Landfilling 40
Dewatered sewage sludge Landfilling 779
Dewatered waterworks sludge Landfilling 8
Grease trap waste Co-disposal at landfill (2) 352(3)
Livestock waste Landfilling (4) 130
Sewage works screenings Landfilling 60
Waste tyres (5) Landfilling 33
Other Waste
Chemical waste other than asbestos waste CW TC 144
Dredged mud (6) Marine dumping 183,288
Excavated materials (6) Marine dumping 1,370
Furnace bottom ash Concrete manufacturing,stored in lagoon(7)
204
Livestock waste Composting and other environmentally acceptable means (8)
670
Pulverised fuel ash Concrete manufacturing,stored in lagoon(7)
1,375
Notes : (1) Co-disposal at SENT and WENT Landfills. (2) Co-disposal at WENT Landfill after treatment. (3) The figure is the quantity of grease trap waste received at WENT Landfill before processing
in the Interim Grease Trap Waste Treatment Facility. (4) At the WENT Landfill. (5) Waste tyres were shredded or cut prior to disposal. (6) Assuming the density of the dredged mud and excavated materials to be one tonne per cubic metre. (7) Information provided by CLP Power Hong Kong Limited and the Hongkong Electric Company, Limited. (8) Examples of environmentally acceptable means include on-site composting, aerobic treatment, dry muck-out, etc.

_____ ____ ____________________________________________________________________________Monitoring of Solid Waste in Hong Kong - Waste Statistics for 2002
12
3. Waste Recovery and Recycling
Plate 3.1 Recovery of municipal solid waste in 2001 & 2002
Recycled locally Landfilled
(0.21 million tonnes) (3.44 million tonnes)
(11%)
64% 36% Recovered for
recycling
(1.96 million tonnes)
2002
Exported for recycling
(1.75 million tonnes)
(89%)
Landfilled
(3.39 million tonnes)
Recycled locally
(0.17 million tonnes)
(9%)
64% 36% Recovered for
recycling
(1.94 million tonnes)
Exported for recycling
(1.77 million tonnes)
(91%)
2001

_____________________________________________________________________________________ Monitoring of Solid Waste in Hong Kong - Waste Statistics for 2002
13
Plate 3.2 Municipal solid waste recovery rates in 1998 – 2002
36%36%
34%
31%
33%
20%
25%
30%
35%
40%
1998 1999 2000 2001 2002
Y ear
Rec
over
y R
ate
(%)
Plate 3.3 Recovered recyclable materials by type in 2002
Waste Type
Quantity of recovered recyclable materials (thousand tonnes)
Exported for
Recycling(1)
(a)
Recycled
Locally(2)
(b)
Total recovered
for recycling(c) = (a) + (b)
Ferrous metals 859 0 859
Glass 0 1.5 (3) 1.5
Non-ferrous metals 47 6 53
Paper 593 170 763
Plastics 156 10 166
Rubber tyres 0 12.5 (4) 12.5
Textiles 18 0 18
Wood 16 2 18 Electrical and Electronic
equipment 60 (2) 8 68
Total 1,749 210 1,959
Notes : (1) Except information on Electrical and Electronic equipment, all figures are based on records of the Census and
Statistics Department. (2) Waste Recovery Survey conducted in Feb – Mar 2003. (3) Excluding glass beverage bottles recovered through deposit-and-refund system operated by local beverage
manufacturers. According to a survey performed by Hong Kong Beverage Association, about 5,000 tonnes of glass beverage bottles are reused / recycled every year.
(4) Quantity includes reuse, retreading and recycling of vehicle tyres (8,100 tonnes) and retreading of aircraft tyres in Hong Kong (4,400 tonnes).

_____________________________________________________________________________________
Plate 3.4 Recovered recyclable materials by type in 2001 & 2002
Nonferrous metals
4%
Paper 41%
Ferrous metals 41%
Plastics 11%
Others(1)
3%
Plastics 9%
Ferrous metals 43%
Others(1)
5%
Paper 40% Non
ferrous metals
3%
Total quantity : 1.94 million tonnes Total quantity : 1.96 million tonnes
2001 2002
Notes : (1) Others include glass, wood, rubber tyres, textiles and electrical & electronic equipment.
Plate 3.5 Total quantities and export values of recovered recyclable materials in 1998 – 2002
2.5
1.56 1.54
1.76 1.94
1.96
1.8 2.1
2.1
1.8 1.9
1998 1999 2000 2001 2002
Year
Total quantity of recovered materials
Values of exported recyclable materials
6
5 2
Qua
ntit
y (m
illio
n to
nnes
)
4 E
xpor
t va
lue
($ b
illio
n)
1.5
3
1
2
0.5 1
0 0
Monitoring of Solid Waste in Hong Kong - Waste Statistics for 2002
14

_________ _________
Plate 3.6 Values of exported recyclable materials in 2001 & 2002
Others Others 3%
Total Value : HK$ 2.1 billion
2001 2002
Ferrous metals 35%
Paper 23%
Non-ferrous metals 26%
Plastics 14%
2%
Non-ferrous metals 17%
Paper 23%
Ferrous metals 44%
Plastics 13%
Total Value : HK$ 1.9 billion
___________________________________________________________________Monitoring of Solid Waste in Hong Kong - Waste Statistics for 2002
15
________ __ ___________________________________________________________________________Monitoring of Solid Waste in Hong Kong - Waste Statistics for 2002
16
Plate 3.7 Quantities and values of exported recyclable materials by type
Category of recyclable materials Quantity (1)
(tonnes)
Value (1)
($ thousand)
Value per UnitWeight
($ / tonne)
a. Ferrous metals~ alloy steel scrap 11,025 47,947 4,349~ pig or cast iron 38,139 47,747 1,252~ tinplate 397 726 1,827~ other scraps 809,619 759,929 939
b. Non-ferrous metals~ aluminium 11,860 41,445 3,495~ copper & alloys 33,318 231,897 6,960~ lead 920 1,634 1,777~ metal ash & residues 79 347 4,397~ nickel 170 3,462 20,396~ precious metal 58 39,306 679,823~ tin 0 0 0~ zinc 912 8,947 9,809
c. Plastics~ polyethylene 90,556 113,860 1,257~ polystyrene & copolymers 18,799 44,553 2,370~ polyvinyl chloride 2,903 6,372 2,195~ others 43,833 86,009 1,962
d. Textiles~ cotton 11,102 17,623 1,587~ man-made fibres 0.15 2 13,333~ old clothing & other textile articles, rags, etc. 6,420 24,231 3,774
e. Wood & paper~ paper 592,830 437,096 737~ wood (include sawdust) 16,088 11,802 734
f. Electrical & Electronic equipment (2) 60,036 N/A N/A
Notes : (1) Figures provided by the Census & Statistics Department. (2) Waste Recovery Survey conducted in Feb – Mar 2003.

_____________________________________________________________________________________
y
y
y
y
Appendix 1 Classification of Solid Waste and Monitoring Methodology
Waste Classification and Terminology
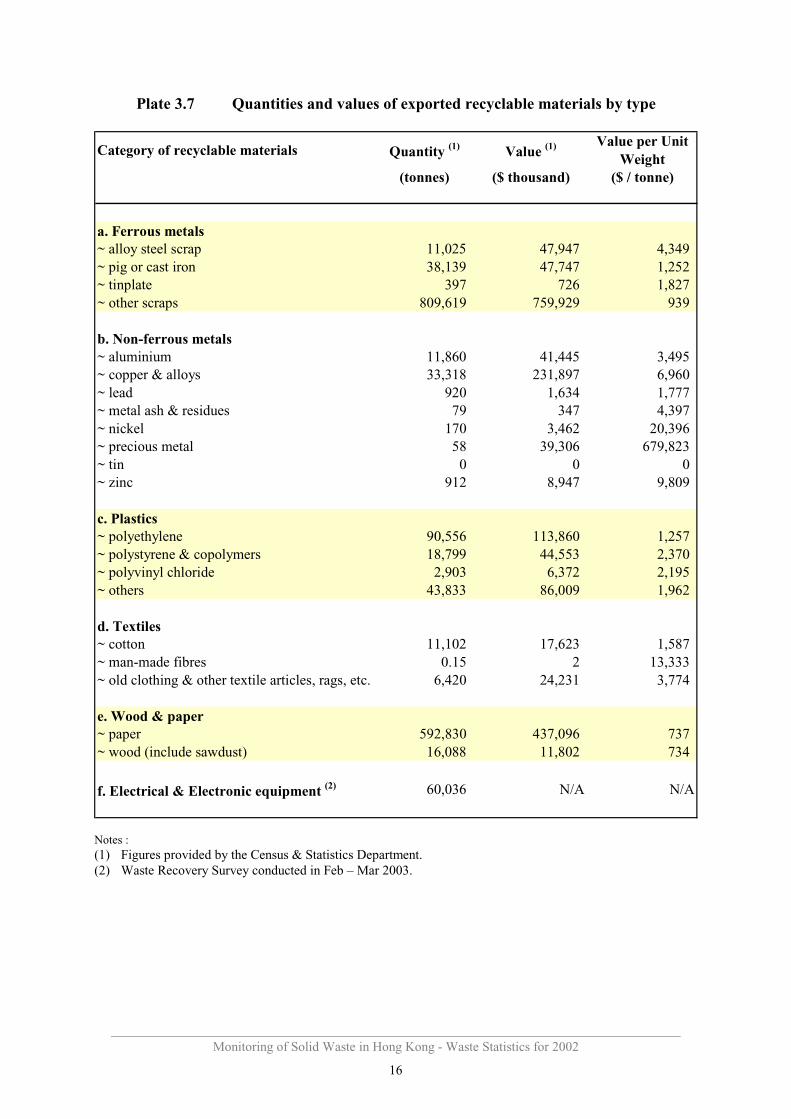
Solid waste is classified into five main types by making reference to the sources of waste and the institutional arrangements for waste collection and disposal. These five types of solid waste are municipal solid waste, construction & demolition (C&D) waste, chemical waste, special waste and other solid waste. The detailed interpretations of some commonly used terms are described below.
Municipal solid waste includes domestic waste, commercial waste and industrial waste.
Domestic waste refers to household waste, waste generated from daily activities in institutional premises and refuse collected from public cleansing services. Public cleansing waste includes dirt and litter collected by the Food and Environmental Hygiene Department (FEHD), marine refuse collected by the Marine Department and waste from country parks collected by the Agriculture, Fisheries and Conservation Department.
Commercial waste is waste arising from commercial activities taking place in shops, restaurants, hotels, offices, markets in private housing estates, etc. It is collected mainly by private waste collectors. However, some commercial waste is mixed with domestic waste and collected by the FEHD.
Industrial waste is waste arising from industrial activities and does not include C&D waste and chemical waste. It is usually collected by private waste collectors. However, some industries may deliver their industrial waste directly to landfills for disposal.
It should be noted that there are bulky items like furniture and domestic appliances which cannot be handled by conventional compactor type refuse collection vehicles. These items are regarded as bulky waste and are usually collected separately. They may come from residential premises, commercial and industrial activities.
Construction and Demolition (C&D) Material is a mixture of surplus materials arising from site clearance, excavation, construction, refurbishment, renovation, demolition and road works. Over 80% of C&D material are inert and are known as public fill. Public fill includes debris, rubble, earth and concrete which is suitable for land reclamation and site formation. When properly sorted, materials such as concrete and asphalt can be recycled for use in construction. The remaining non-inert substances in C&D material are called C&D waste which includes bamboo, timber, vegetation, packaging waste and other organic materials. In contrast to public fill, C&D waste is not suitable for land reclamation and is disposed of at landfills.
Chemical waste is defined in the Waste Disposal (Chemical Waste) (General) Regulation under the Waste Disposal Ordinance (Cap. 354). Chemical waste can be any substance arising from any process or trade activity which contains chemical in such form, quantity or concentration that can cause pollution to the environment or become a risk to health.
Monitoring of Solid Waste in Hong Kong - Waste Statistics for 2002
17
_____________________________________________________________________________________
Municipal Solid Waste
Construction & Demolition
Waste
Chemical
WasteSpecialWaste
Other Solid Waste
Bulky wasteHouseholdInstitutional(1)
(schools, government offices, government markets, etc.)Public cleansing
DemolitionExcavationRenovation worksRoad worksSite clearance etc.
Bulky wasteShops, offices, hotels, non-government markets, etc.
Bulky wasteIndustrial activities
Industrialwaste
Commercialwaste
Domesticwaste
Abattoir wasteAnimal carcassesAsbestosClinical wasteCondemned goodsLivestock wasteSludgeStabilized residues from CWTC
Dredged mudExcavated materialsFurnace bottom ashPulverized fuel ash
-
-
---
-
--
Special waste includes abattoir waste, animal carcasses, asbestos, clinical waste, condemned goods, livestock waste, sewage treatment and waterworks treatment sludge, sewage works screenings and stabilized residues from Chemical Waste Treatment Centre.
Other solid waste refers to solid waste types not covered by the above descriptions. These include coal ash, dredged mud and excavated materials disposed of at marine dumping sites.
Current classification of solid waste
--
-
-
---
-
---
--
--
--
Solid Waste Solid Waste
Municipal Solid Waste
Domestic waste
- Bulky waste - Household - Institutional(1)
(schools, government offices, government markets, etc.)
- Public cleansing
Commercial waste
- Bulky waste - Shops,
offices, hotels, non-government markets, etc.
Industrial waste
- Bulky waste - Industrial
activities
Construction & Demolition
Waste
- Demolition - Excavation - Renovation
works - Road works - Site clearance
etc.
Chemical Waste
Special Waste
- Abattoir waste
- Animal carcasses
- Asbestos - Clinical waste - Condemned
goods - Livestock
waste - Sludge - Stabilized
residues from CWTC
Other Solid Waste
- Dredged mud - Excavated
materials - Furnace
bottom ash - Pulverized
fuel ash
Notes : (1) Part of the waste generated from schools, government offices, government markets, etc. was mixed with
household waste and/or public cleansing refuse during the process of collection carried out by the FEHD.
Methodology
Solid waste data are mainly collected by the following sources:
y
y
y
y
y
Waste intake records taken at weighbridges of landfills and refuse transfer stations (RTS); Results of annual survey on waste composition conducted in November - December 2002 at landfills and RTS; Results of waste recovery survey conducted in February – March 2003 by ACNielsen (China) Ltd.; Monthly statistics provided by other departments including FEHD, Civil Engineering Department and Census and Statistics Department; and Statistics on special and other wastes (Plate 2.12 of the main text) provided by relevant specialist groups of EPD and concerned government departments.
Monitoring of Solid Waste in Hong Kong - Waste Statistics for 2002
18