Embed Size (px)
Citation preview
MONITORING OF SOLID WASTE IN
HONG KONG
Waste Statistics for 2014
Environmental Protection Department
Monitoring of Solid Waste in Hong Kong Waste Statistics for 2014
Date of issue: October 2015
Work done by: Statistics Unit,
Environmental Protection Department
Security classification: Unrestricted
Cover photos
Top left: Berth at Island West Transfer Station
Bottom left: Sorting of plastic waste in progress at EcoPark
Top right: Bird’s eye view of North East New Territories Landfill
Bottom right: Waste composition survey in progress
Information contained in this publication, which is the best available at the time of preparation, may be freely used. Reproduction of materials is permitted with notification to the Director of Environmental Protection.
Acknowledgment must be made by indicating the title of this publication.
Monitoring of Solid Waste in Hong Kong - Waste Statistics for 2014
ii
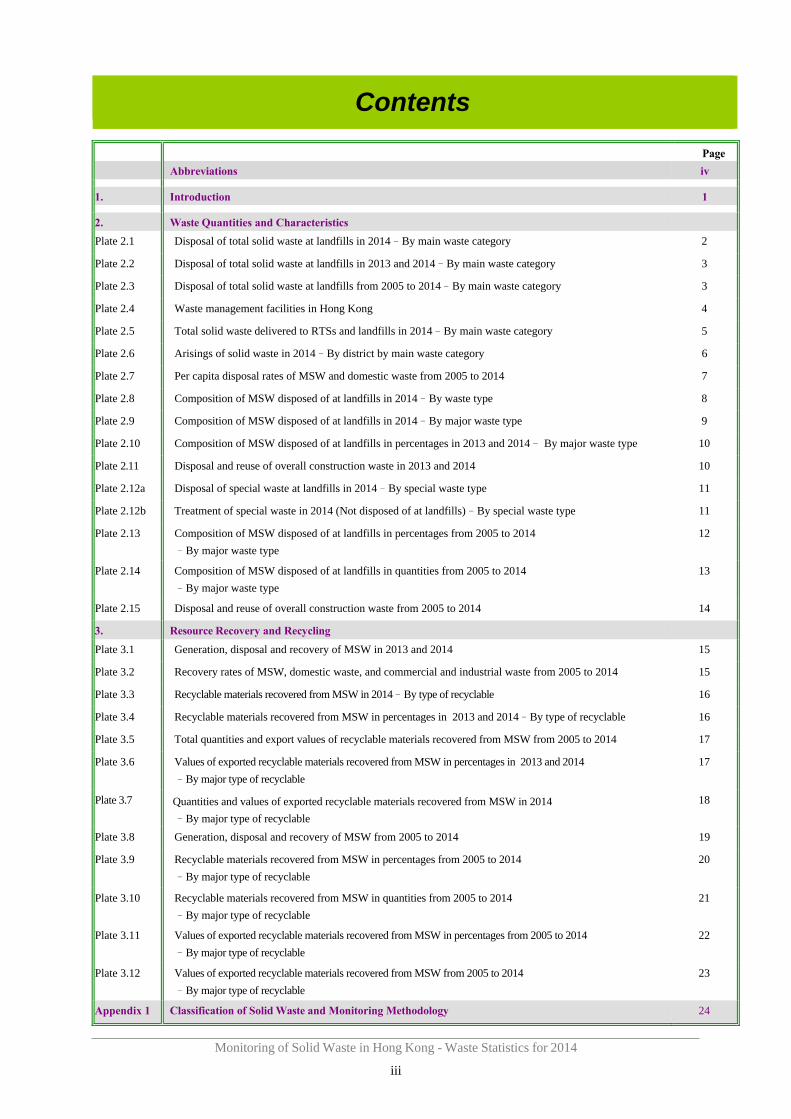
Contents
Monitoring of Solid Waste in Hong Kong - Waste Statistics for 2014
iii
Page
Abbreviations iv
1. Introduction 1
2. Waste Quantities and Characteristics
Plate 2.1 Disposal of total solid waste at landfills in 2014–By main waste category 2
Plate 2.2 Disposal of total solid waste at landfills in 2013 and 2014–By main waste category 3
Plate 2.3 Disposal of total solid waste at landfills from 2005 to 2014–By main waste category 3
Plate 2.4 Waste management facilities in Hong Kong 4
Plate 2.5 Total solid waste delivered to RTSs and landfills in 2014–By main waste category 5
Plate 2.6 Arisings of solid waste in 2014–By district by main waste category 6
Plate 2.7 Per capita disposal rates of MSW and domestic waste from 2005 to 2014 7
Plate 2.8 Composition of MSW disposed of at landfills in 2014–By waste type 8
Plate 2.9 Composition of MSW disposed of at landfills in 2014–By major waste type 9
Plate 2.10 Composition of MSW disposed of at landfills in percentages in 2013 and 2014– By major waste type 10
Plate 2.11 Disposal and reuse of overall construction waste in 2013 and 2014 10
Plate 2.12a Disposal of special waste at landfills in 2014–By special waste type 11
Plate 2.12b Treatment of special waste in 2014 (Not disposed of at landfills)–By special waste type 11
Plate 2.13 Composition of MSW disposed of at landfills in percentages from 2005 to 2014
–By major waste type
12
Plate 2.14 Composition of MSW disposed of at landfills in quantities from 2005 to 2014
–By major waste type
13
Plate 2.15 Disposal and reuse of overall construction waste from 2005 to 2014 14
3. Resource Recovery and Recycling
Plate 3.1 Generation, disposal and recovery of MSW in 2013 and 2014 15
Plate 3.2 Recovery rates of MSW, domestic waste, and commercial and industrial waste from 2005 to 2014 15
Plate 3.3 Recyclable materials recovered from MSW in 2014–By type of recyclable 16
Plate 3.4 Recyclable materials recovered from MSW in percentages in 2013 and 2014–By type of recyclable 16
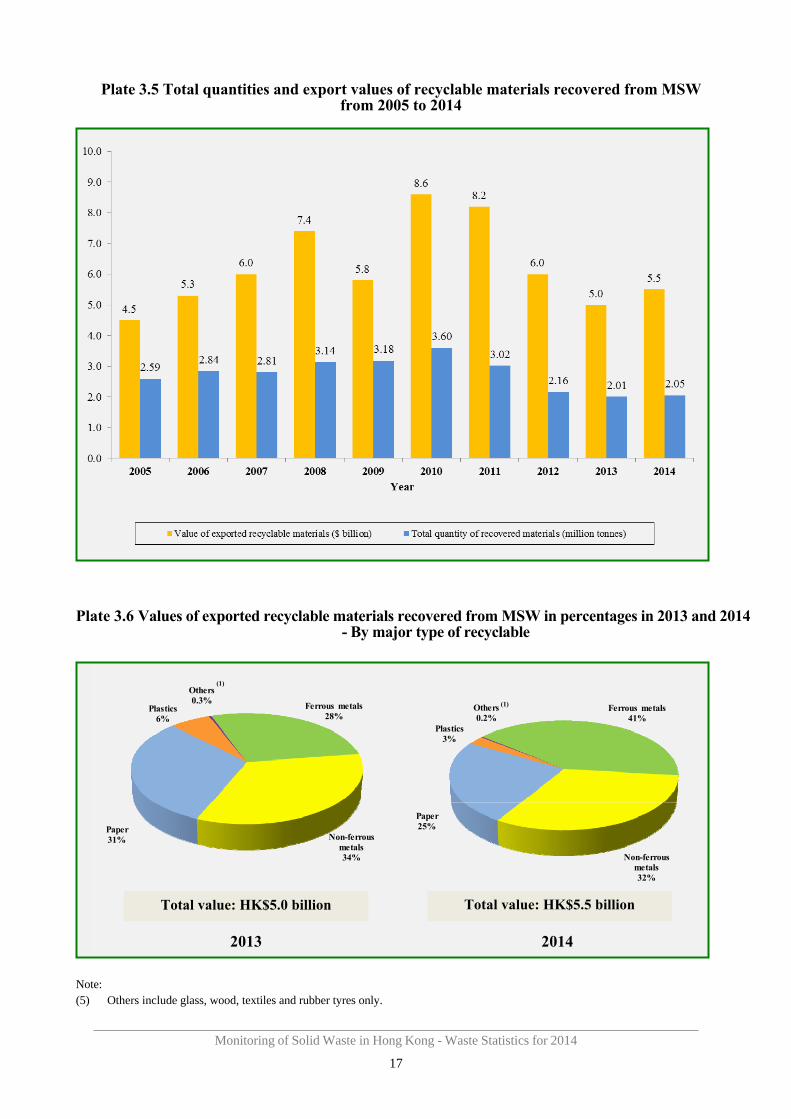
Plate 3.5 Total quantities and export values of recyclable materials recovered from MSW from 2005 to 2014 17
Plate 3.6 Values of exported recyclable materials recovered from MSW in percentages in 2013 and 2014
–By major type of recyclable
17
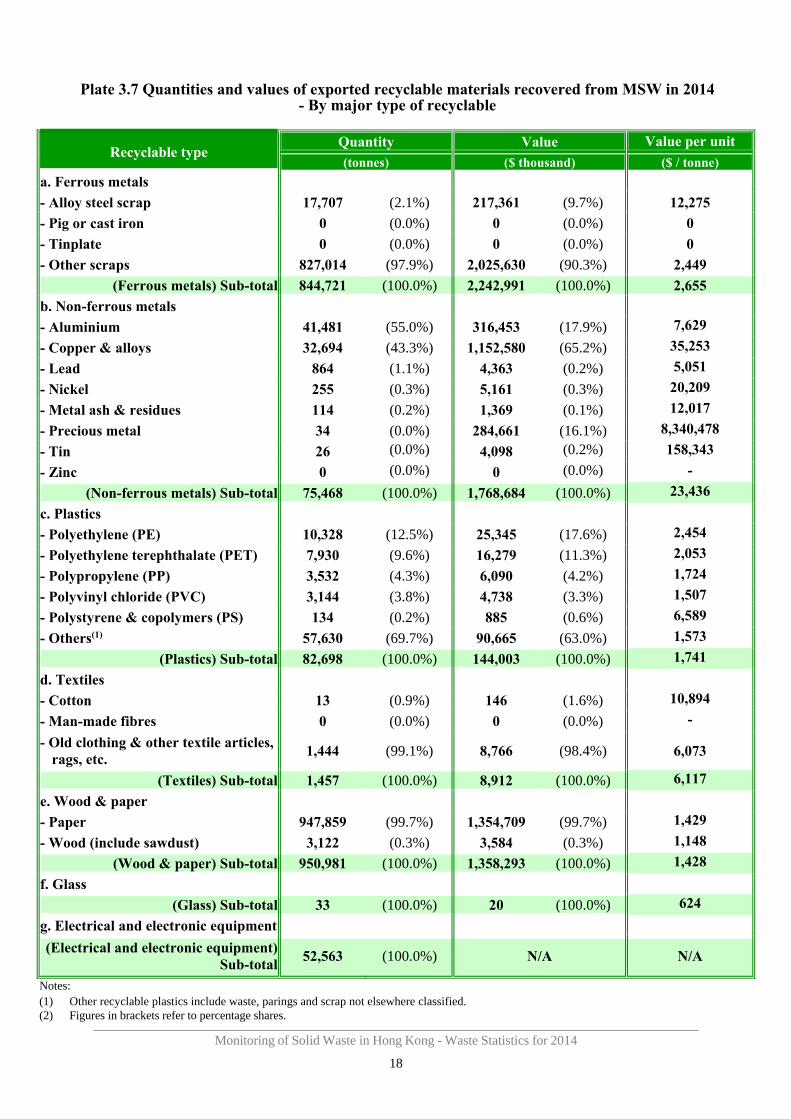
Plate 3.7 Quantities and values of exported recyclable materials recovered from MSW in 2014
–By major type of recyclable
18
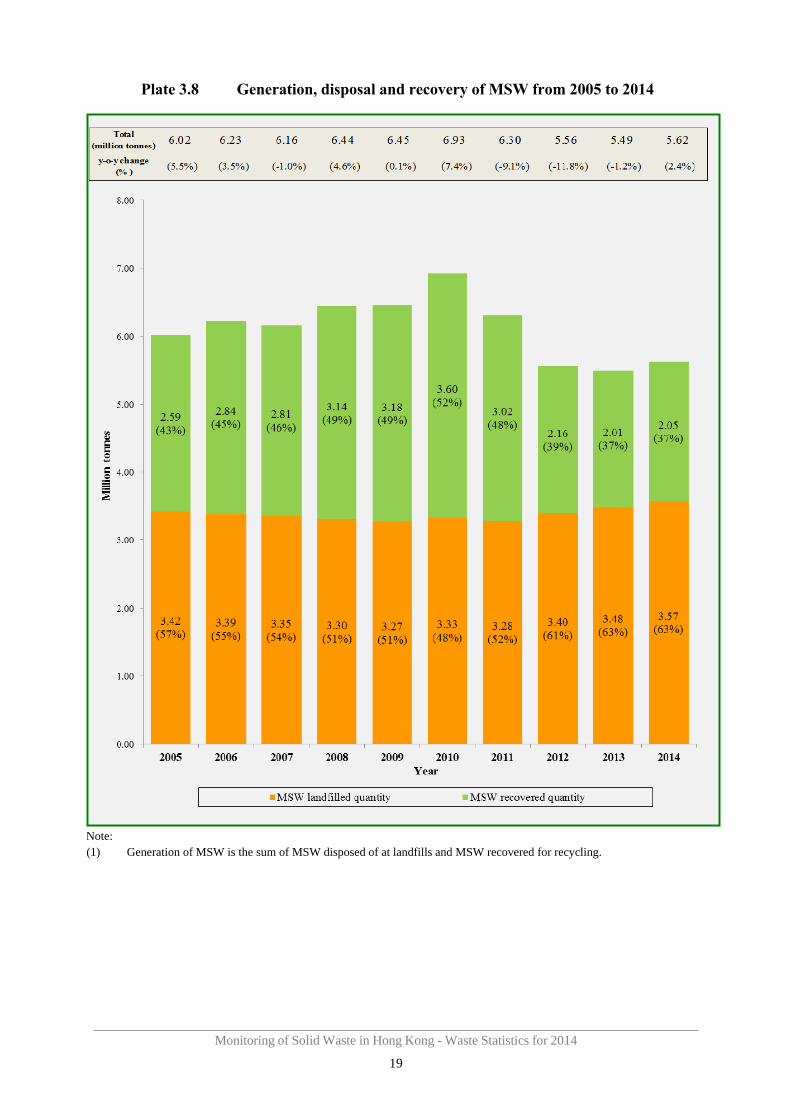
Plate 3.8 Generation, disposal and recovery of MSW from 2005 to 2014 19
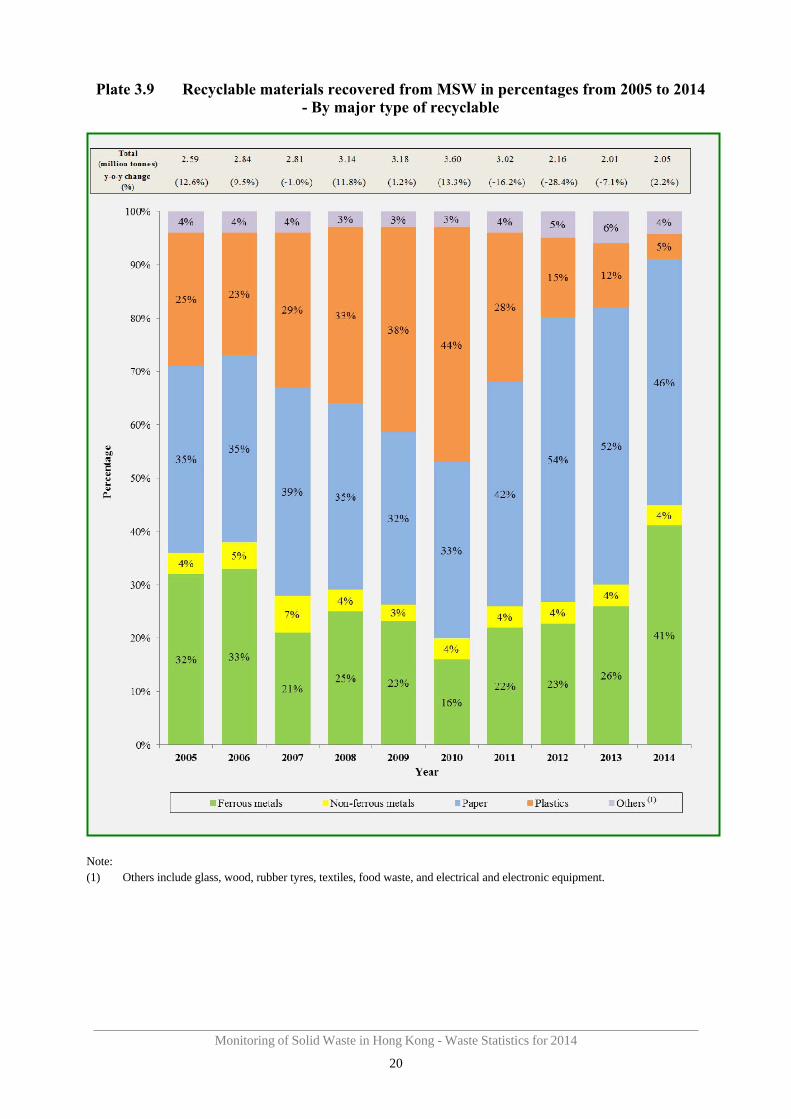
Plate 3.9 Recyclable materials recovered from MSW in percentages from 2005 to 2014
–By major type of recyclable
20
Plate 3.10 Recyclable materials recovered from MSW in quantities from 2005 to 2014
–By major type of recyclable
21
Plate 3.11 Values of exported recyclable materials recovered from MSW in percentages from 2005 to 2014
–By major type of recyclable
22
Plate 3.12 Values of exported recyclable materials recovered from MSW from 2005 to 2014
–By major type of recyclable
23
Appendix 1 Classification of Solid Waste and Monitoring Methodology 24
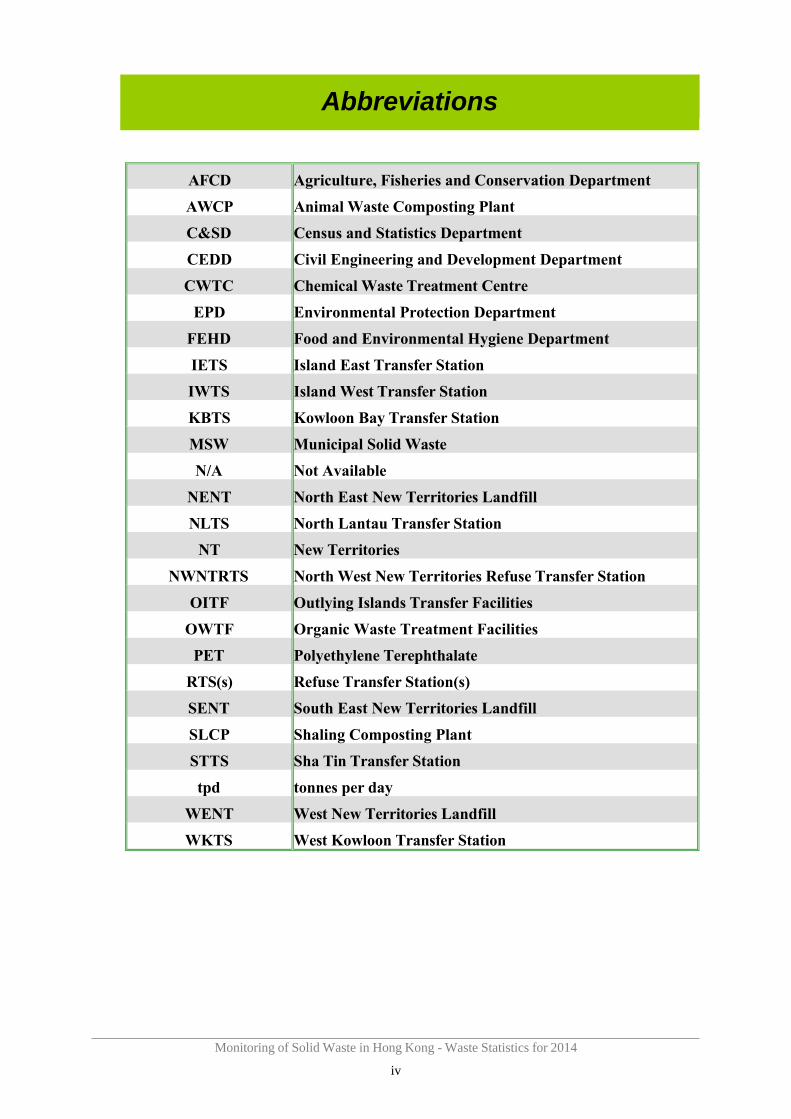
Abbreviations
AFCD Agriculture, Fisheries and Conservation Department
AWCP Animal Waste Composting Plant
C&SD Census and Statistics Department
CEDD Civil Engineering and Development Department
CWTC Chemical Waste Treatment Centre
EPD Environmental Protection Department
FEHD Food and Environmental Hygiene Department
IETS Island East Transfer Station
IWTS Island West Transfer Station
KBTS Kowloon Bay Transfer Station
MSW Municipal Solid Waste
N/A Not Available
NENT North East New Territories Landfill
NLTS North Lantau Transfer Station
NT New Territories
NWNTRTS North West New Territories Refuse Transfer Station
OITF Outlying Islands Transfer Facilities
OWTF Organic Waste Treatment Facilities
PET Polyethylene Terephthalate
RTS(s) Refuse Transfer Station(s)
SENT South East New Territories Landfill
SLCP Shaling Composting Plant
STTS Sha Tin Transfer Station
tpd tonnes per day
WENT West New Territories Landfill
WKTS West Kowloon Transfer Station
Monitoring of Solid Waste in Hong Kong - Waste Statistics for 2014
iv
Monitoring of Solid Waste in Hong Kong - Waste Statistics for 2014
1
1. Introduction
This report presents the statistics on disposal and recovery / recycling of solid waste
generated in Hong Kong in the year 2014. It aims to provide readers with the latest
information available on solid waste.
The information contained in this report is compiled from the data collected from
various sources throughout the year, including the ongoing solid waste monitoring work
at waste facilities undertaken by the Environmental Protection Department.
The statistics on waste disposal and resource recovery and recycling are presented in
Chapters 2 and 3 respectively, and the classification of solid waste and the
methodology adopted in data collection are explained in Appendix 1.
In this report, figures of various plates may not add up to total and percentages may not
add up to 100 due to rounding off.
Abbreviations used in the report are listed on page iv for ease of reference.
Monitoring of Solid Waste in Hong Kong - Waste Statistics for 2014
2
2. Waste Quantities and Characteristics
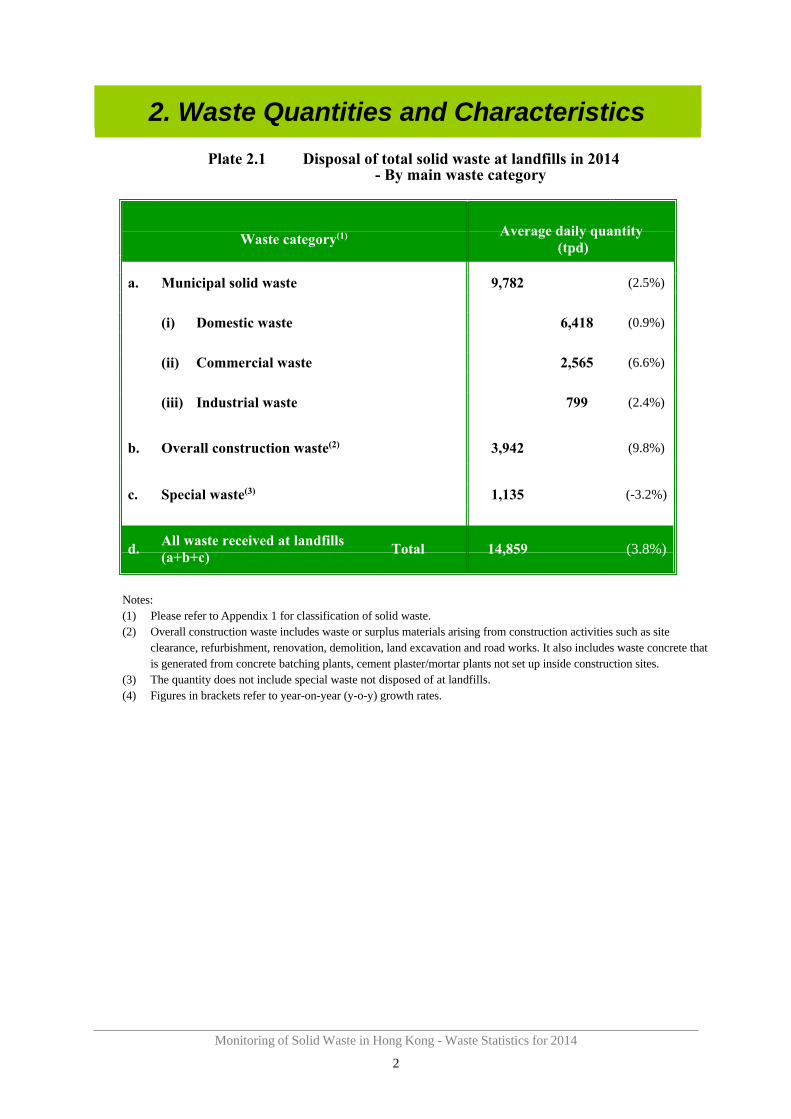
Plate 2.1 Disposal of total solid waste at landfills in 2014 - By main waste category
Waste category(1) Average daily quantity (tpd)
a. Municipal solid waste 9,782 (2.5%)
(i) Domestic waste 6,418 (0.9%)
(ii) Commercial waste 2,565 (6.6%)
(iii) Industrial waste 799 (2.4%)
b. Overall construction waste(2) 3,942 (9.8%)
c. Special waste(3) 1,135 (-3.2%)
All waste received at landfillsd.
(a+b+c) Total 14,859 (3.8%)
Notes: (1) Please refer to Appendix 1 for classification of solid waste. (2) Overall construction waste includes waste or surplus materials arising from construction activities such as site
clearance, refurbishment, renovation, demolition, land excavation and road works. It also includes waste concrete that is generated from concrete batching plants, cement plaster/mortar plants not set up inside construction sites.
(3) The quantity does not include special waste not disposed of at landfills. (4) Figures in brackets refer to year-on-year (y-o-y) growth rates.
Monitoring of Solid Waste in Hong Kong - Waste Statistics for 2014
3
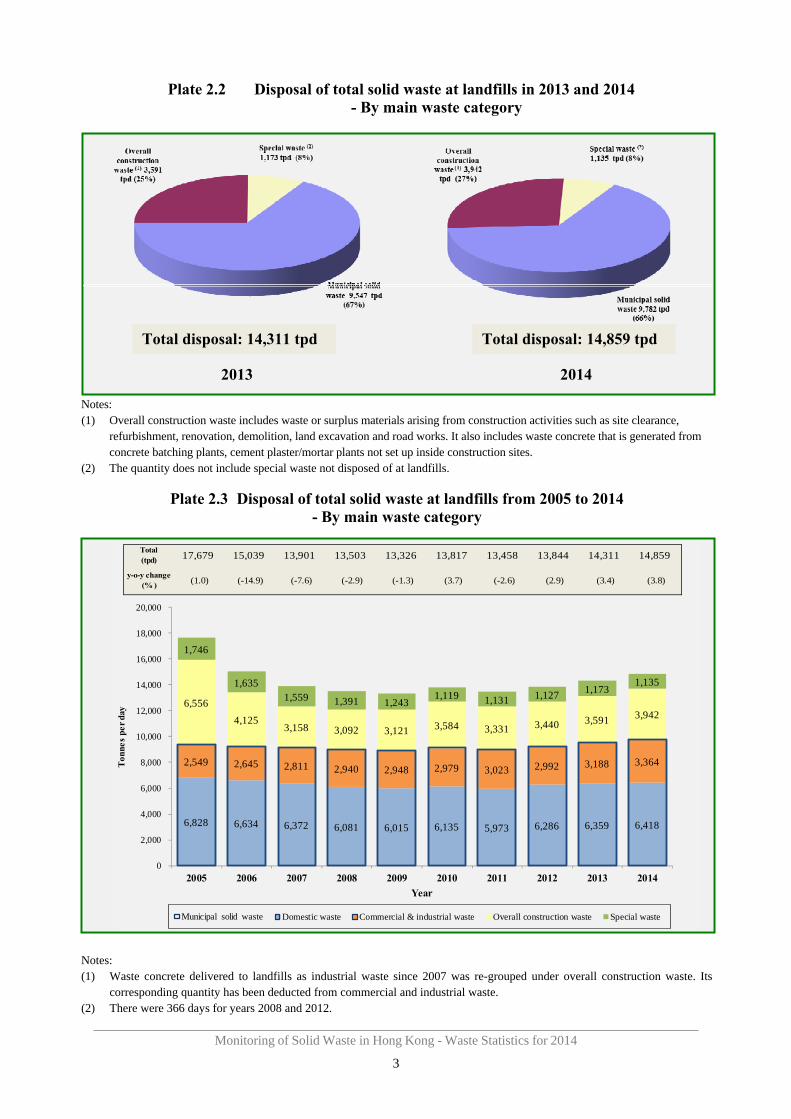
Plate 2.2 Disposal of total solid waste at landfills in 2013 and 2014 - By main waste category
Total disposal: 14,311 tpd Total disposal: 14,859 tpd
2013 2014
Notes: (1) Overall construction waste includes waste or surplus materials arising from construction activities such as site clearance,
refurbishment, renovation, demolition, land excavation and road works. It also includes waste concrete that is generated from concrete batching plants, cement plaster/mortar plants not set up inside construction sites.
(2) The quantity does not include special waste not disposed of at landfills.
Plate 2.3 Disposal of total solid waste at landfills from 2005 to 2014 - By main waste category
Total 17,679 15,039 13,901 13,503 13,326 13,817 13,458 13,844 14,311 14,859 (tpd)
y-o-y change (% )
(1.0) (-14.9) (-7.6) (-2.9) (-1.3) (3.7) (-2.6) (2.9) (3.4) (3.8)
Ton
nes
per
day
20,000
18,000
16,000
14,000
12,000
10,000
8,000
6,000
4,000
2,000
0
6,828 6,634 6,372 6,081 6,015 6,135 5,973 6,286 6,359 6,418
2,549 2,645 2,811 2,940 2,948 2,979 3,023 2,992 3,188 3,364
6,556
4,125 3,158 3,092 3,121 3,584 3,331 3,440 3,591 3,942
1,746
1,635 1,559 1,391 1,243
1,119 1,131 1,127 1,173 1,135
2005 2006 2007 2008 2009 2010 2011 2012 2013 2014
Year
Domestic waste Commercial & industrial waste Overall construction waste Special waste Municipal solid waste
Notes: (1) Waste concrete delivered to landfills as industrial waste since 2007 was re-grouped under overall construction waste. Its
corresponding quantity has b een deducted from commercial and industrial waste. (2) There were 366 days for years 2008 and 2012.
Guangdong Sheng
NENT
▲ AWCP
▼ OWTF
▲ SLCP
STF
WENT
NLTS
♦ EcoPark
▼ OWTF (2017)
NWNTRTS
CWTC
WKTS
IWTS
KBTS
S TTS
IETS
SENT
OITF
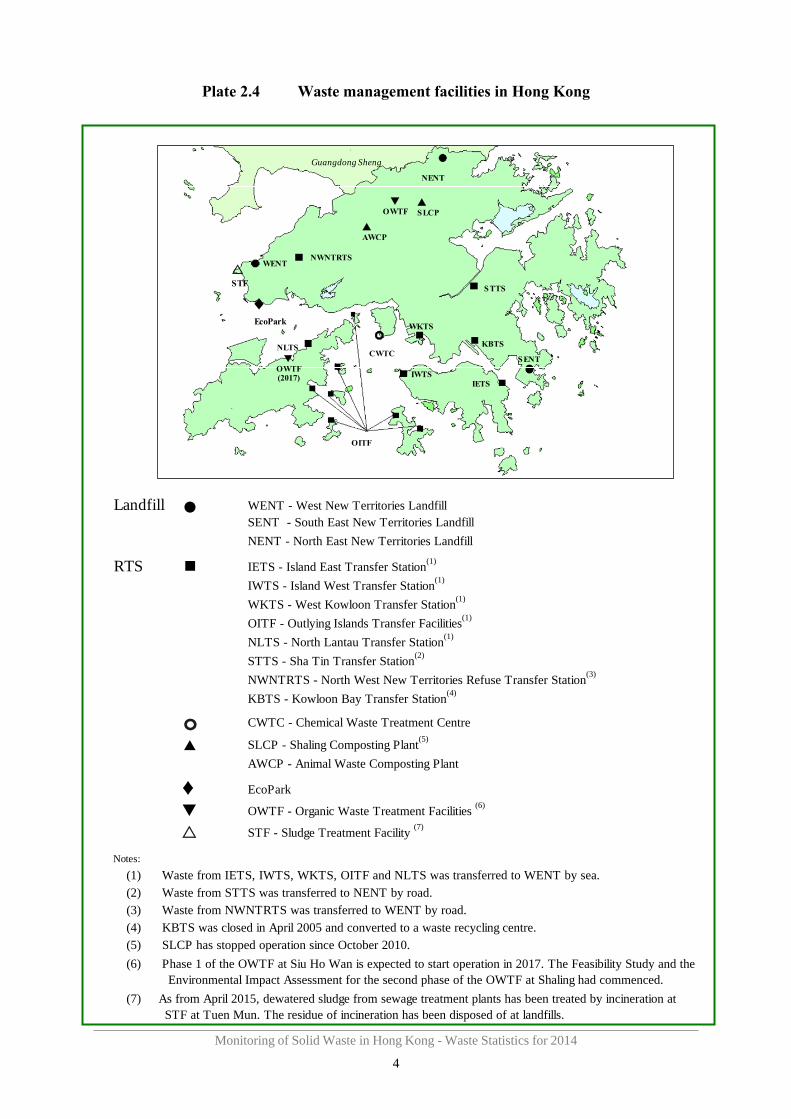
Plate 2.4 Waste management facilities in Hong Kong
Landfill ● WENT - West New Territories Landfill SENT - South East New Territories Landfill
NENT - North East New Territories Landfill
RTS IETS - Island East Transfer Station(1)
IWTS - Island West Transfer Station(1)
WKTS - West Kowloon Transfer Station(1)
OITF - Outlying Islands Transfer Facilities(1)
NLTS - North Lantau Transfer Station(1)
STTS - Sha Tin Transfer Station(2)
NWNTRTS - North West New Territories Refuse Transfer Station(3)
KBTS - Kowloon Bay Transfer Station(4)
CWTC - Chemical Waste Treatment Centre
▲
♦
SLCP - Shaling Composting Plant(5)
AWCP - Animal Waste Composting Plant
EcoPark
OWTF - Organic Waste Treatment Facilities (6)
STF - Sludge Treatment Facility (7)
▪
Notes:
(1) Waste from IETS, IWTS, WKTS, OITF and NLTS was transferred to WENT by sea.
(2) Waste from STTS was transferred to NENT by road.
(3) Waste from NWNTRTS was transferred to WENT by road.
(4) KBTS was closed in April 2005 and converted to a waste recycling centre.
(5) SLCP has stopped operation since October 2010.
(6) Phase 1 of the OWTF at Siu Ho Wan is expected to start operation in 2017. The Feasibility Study and the Environmental Impact Assessment for the second phase of the OWTF at Shaling had commenced.
(7) As from April 2015, dewatered sludge from sewage treatment plants has been treated by incineration at STF at Tuen Mun. The residue of incineration has been disposed of at landfills.
Monitoring of Solid Waste in Hong Kong - Waste Statistics for 2014
4
Monitoring of Solid Waste in Hong Kong - Waste Statistics for 2014
5
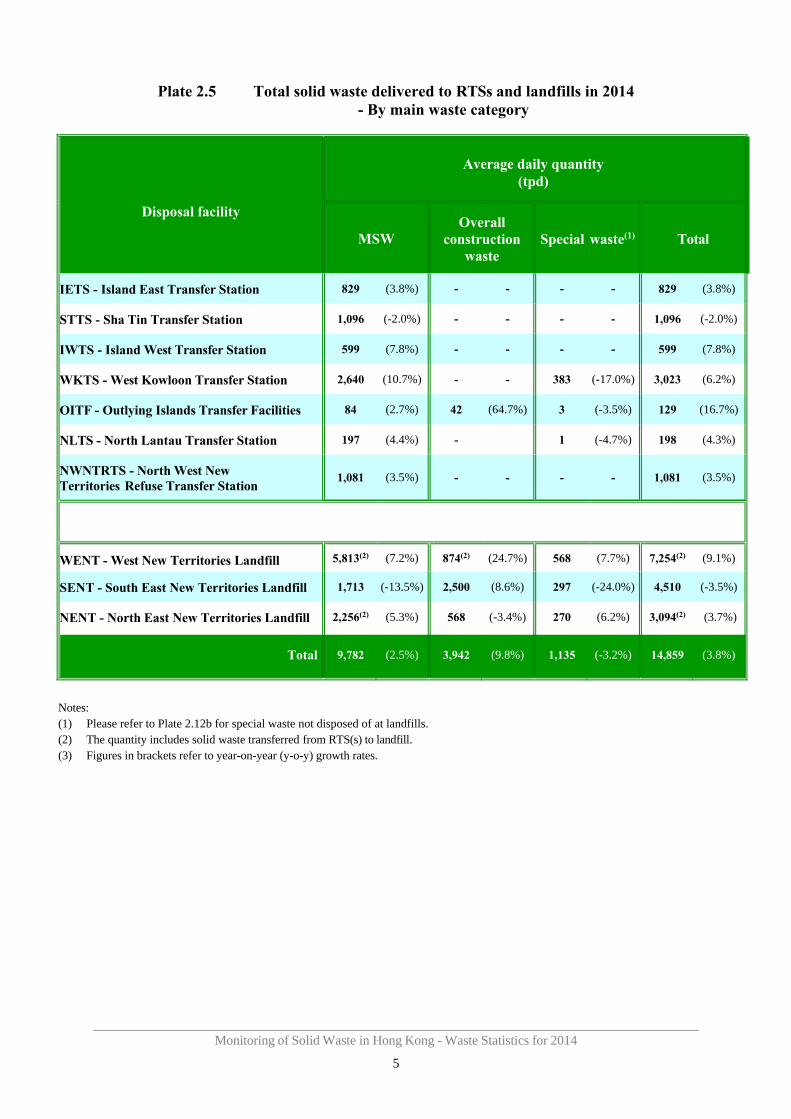
Plate 2.5 Total solid waste delivered to RTSs and landfills in 2014 - By main waste category
Disposal facility
Average daily quantity
(tpd)
MSW Overall
construction waste
Special waste(1) Total
IETS - Island East Transfer Station 829 (3.8%) - - - - 829 (3.8%)
STTS - Sha Tin Transfer Station 1,096 (-2.0%) - - - - 1,096 (-2.0%)
IWTS - Island West Transfer Station 599 (7.8%) - - - - 599 (7.8%)
WKTS - West Kowloon Transfer Station 2,640 (10.7%) - - 383 (-17.0%) 3,023 (6.2%)
OITF - Outlying Islands Transfer Facilities 84 (2.7%) 42 (64.7%) 3 (-3.5%) 129 (16.7%)
NLTS - North Lantau Transfer Station 197 (4.4%) - 1 (-4.7%) 198 (4.3%)
NWNTRTS - North West New Territories Refuse Transfer Station
1,081 (3.5%) - - - - 1,081 (3.5%)
WENT - West New Territories Landfill 5,813(2) (7.2%) 874(2) (24.7%) 568 (7.7%) 7,254(2) (9.1%)
SENT - South East New Territories Landfill 1,713 (-13.5%) 2,500 (8.6%) 297 (-24.0%) 4,510 (-3.5%)
NENT - North East New Territories Landfill 2,256(2) (5.3%) 568 (-3.4%) 270 (6.2%) 3,094(2) (3.7%)
Total 9,782 (2.5%) 3,942 (9.8%) 1,135 (-3.2%) 14,859 (3.8%)
Notes: (1) Please refer to Plate 2.12b for special waste not disposed of at landfills. (2) The quantity includes solid waste transferred from RTS(s) to landfill. (3) Figures in brackets refer to year-on-year (y-o-y) growth rates.
Monitoring of Solid Waste in Hong Kong - Waste Statistics for 2014
6
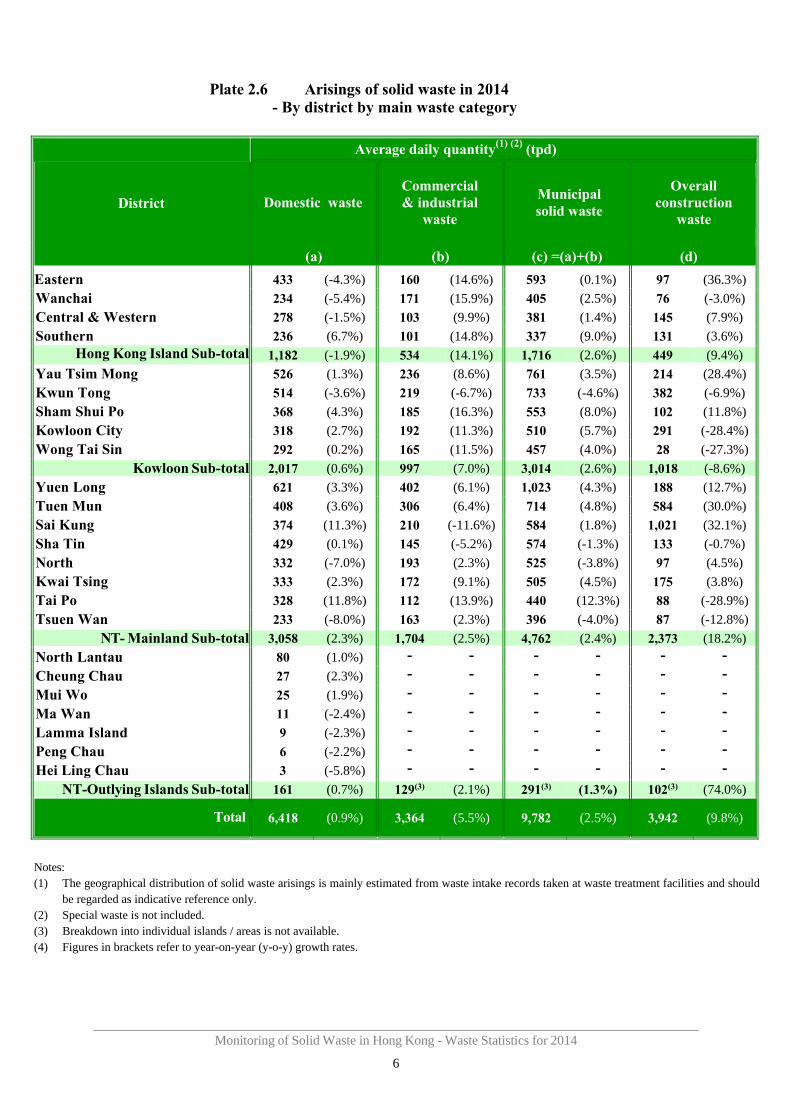
Plate 2.6 Arisings of solid waste in 2014 - By district by main waste category
District
Average daily quantity(1) (2) (tpd)
Domestic waste
(a)
Commercial & industrial
waste
(b)
Municipal solid waste
(c) =(a)+(b)
Overall construction
waste
(d)
Eastern 433 (-4.3%) 160 (14.6%) 593 (0.1%) 97 (36.3%)
Wanchai 234 (-5.4%) 171 (15.9%) 405 (2.5%) 76 (-3.0%)
Central & Western 278 (-1.5%) 103 (9.9%) 381 (1.4%) 145 (7.9%)
Southern 236 (6.7%) 101 (14.8%) 337 (9.0%) 131 (3.6%) Hong Kong Island Sub-total 1,182 (-1.9%) 534 (14.1%) 1,716 (2.6%) 449 (9.4%)
Yau Tsim Mong 526 (1.3%) 236 (8.6%) 761 (3.5%) 214 (28.4%)
Kwun Tong 514 (-3.6%) 219 (-6.7%) 733 (-4.6%) 382 (-6.9%)
Sham Shui Po 368 (4.3%) 185 (16.3%) 553 (8.0%) 102 (11.8%)
Kowloon City 318 (2.7%) 192 (11.3%) 510 (5.7%) 291 (-28.4%)
Wong Tai Sin 292 (0.2%) 165 (11.5%) 457 (4.0%) 28 (-27.3%)
Kowloon Sub-total 2,017 (0.6%) 997 (7.0%) 3,014 (2.6%) 1,018 (-8.6%)
Yuen Long 621 (3.3%) 402 (6.1%) 1,023 (4.3%) 188 (12.7%)
Tuen Mun 408 (3.6%) 306 (6.4%) 714 (4.8%) 584 (30.0%)
Sai Kung 374 (11.3%) 210 (-11.6%) 584 (1.8%) 1,021 (32.1%)
Sha Tin 429 (0.1%) 145 (-5.2%) 574 (-1.3%) 133 (-0.7%)
North 332 (-7.0%) 193 (2.3%) 525 (-3.8%) 97 (4.5%)
Kwai Tsing 333 (2.3%) 172 (9.1%) 505 (4.5%) 175 (3.8%)
Tai Po 328 (11.8%) 112 (13.9%) 440 (12.3%) 88 (-28.9%)
Tsuen Wan 233 (-8.0%) 163 (2.3%) 396 (-4.0%) 87 (-12.8%)
NT- Mainland Sub-total 3,058 (2.3%) 1,704 (2.5%) 4,762 (2.4%) 2,373 (18.2%)
North Lantau 80 (1.0%) - - - - - -
Cheung Chau 27 (2.3%) - - - - - -
Mui Wo 25 (1.9%) - - - - - -
Ma Wan 11 (-2.4%) - - - - - -
Lamma Island 9 (-2.3%) - - - - - -
Peng Chau 6 (-2.2%) - - - - - -
Hei Ling Chau 3 (-5.8%) - - - - - -
NT-Outlying Islands Sub-total 161 (0.7%) 129(3) (2.1%) 291(3) (1.3%) 102(3) (74.0%)
Total 6,418 (0.9%) 3,364 (5.5%) 9,782 (2.5%) 3,942 (9.8%)
Notes: (1) The geographical distribution of solid waste arisings is mainly estimated from waste intake records taken at waste treatment facilities and should
be regarded as indicative reference only. (2) Special waste is not included. (3) Breakdown into individual islands / areas is not available. (4) Figures in brackets refer to year-on-year (y-o-y) growth rates.
Monitoring of Solid Waste in Hong Kong - Waste Statistics for 2014
7
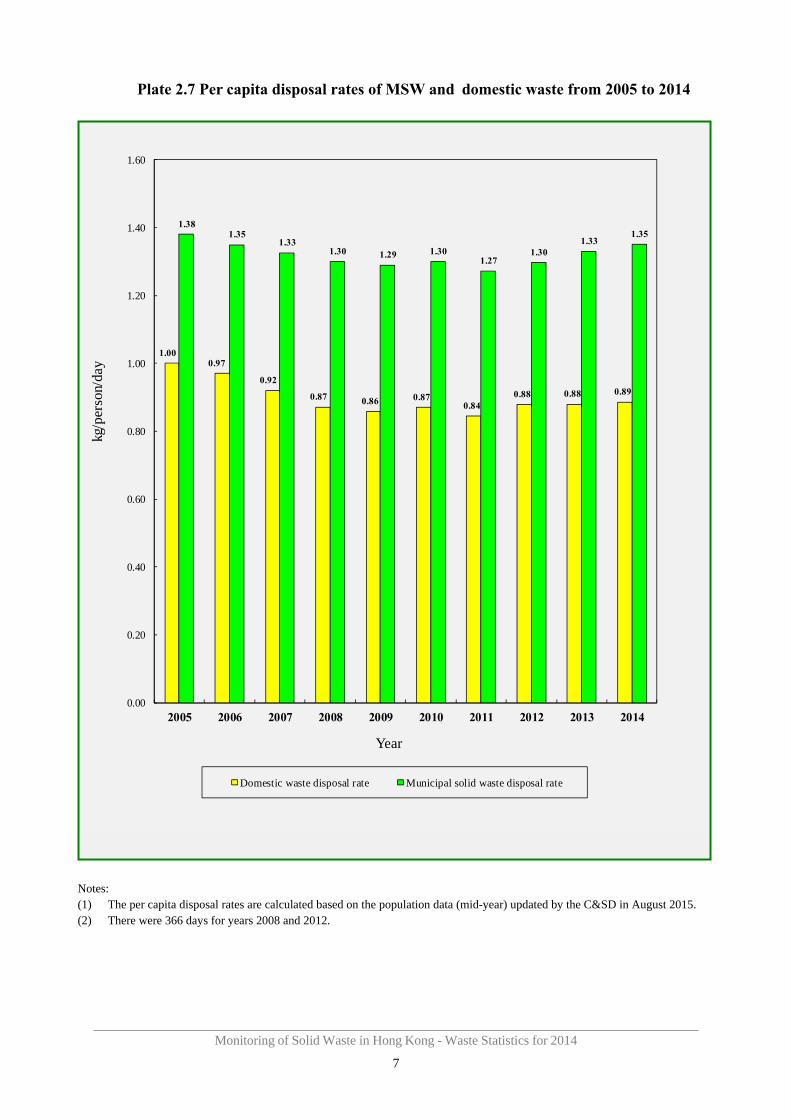
Plate 2.7 Per capita disposal rates of MSW and domestic waste from 2005 to 2014
1.00 0.97
0.92
0.87 0.86 0.87 0.84
0.88 0.88 0.89
1.38 1.35
1.33 1.30 1.29 1.30
1.27 1.30
1.33 1.35
0.00
0.20
0.40
0.60
0.80
1.00
1.20
1.40
1.60
2005 2006 2007 2008 2009 2010 2011 2012 2013 2014
kg/p
erso
n/da
y
Year
Domestic waste disposal rate Municipal solid waste disposal rate
Notes: (1) The per capita disposal rates are calculated based on the population data (mid-year) updated by the C&SD in August 2015. (2) There were 366 days for years 2008 and 2012.
Monitoring of Solid Waste in Hong Kong - Waste Statistics for 2014
8
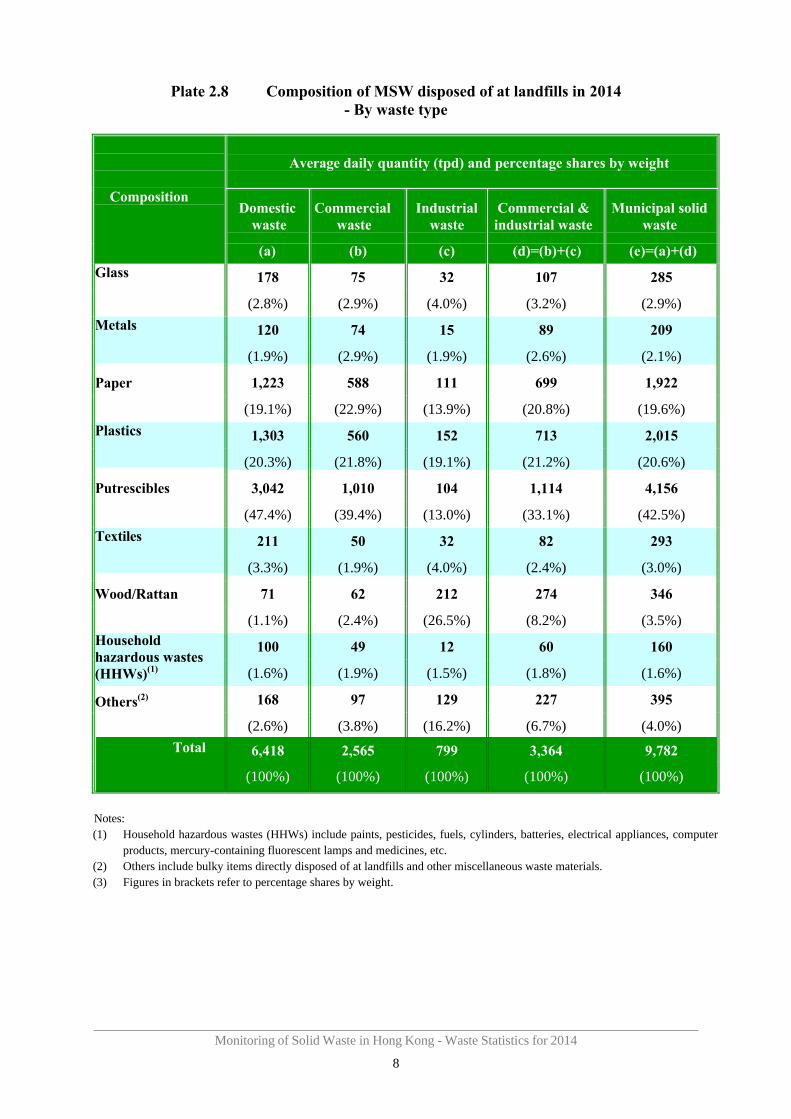
Plate 2.8 Composition of MSW disposed of at landfills in 2014 - By waste type
Composition
Average daily quantity (tpd) and percentage shares b y weight
Domestic waste
(a)
Commercial waste
(b)
Industrial waste
(c)
Commercial & industrial waste
(d)=(b)+(c)
Municipal solid waste
(e)=(a)+(d)
Glass 178
(2.8%)
75
(2.9%)
32
(4.0%)
107
(3.2%)
285
(2.9%)
Metals 120
(1.9%)
74
(2.9%)
15
(1.9%)
89
(2.6%)
209
(2.1%)
Paper 1,223
(19.1%)
588
(22.9%)
111
(13.9%)
699
(20.8%)
1,922
(19.6%)
Plastics 1,303
(20.3%)
560
(21.8%)
152
(19.1%)
713
(21.2%)
2,015
(20.6%)
Putrescibles 3,042
(47.4%)
1,010
(39.4%)
104
(13.0%)
1,114
(33.1%)
4,156
(42.5%)
Textiles 211
(3.3%)
50
(1.9%)
32
(4.0%)
82
(2.4%)
293
(3.0%)
Wood/Rattan 71
(1.1%)
62
(2.4%)
212
(26.5%)
274
(8.2%)
346
(3.5%) Household hazardous wastes (HHWs)(1)
100
(1.6%)
49
(1.9%)
12
(1.5%)
60
(1.8%)
160
(1.6%)
Others(2) 168
(2.6%)
97
(3.8%)
129
(16.2%)
227
(6.7%)
395
(4.0%)
Total 6,418
(100%)
2,565
(100%)
799
(100%)
3,364
(100%)
9,782
(100%)
Notes: (1) Household hazardous wastes (HHWs) include paints, pesticides, fuels, cylinders, batteries, electrical appliances, computer
products, mercury-containing fluorescent lamps and medicines, etc. (2) Others include bulky items directly disposed of at landfills and other miscellaneous waste materials. (3) Figures in brackets refer to percentage shares by weight.
Monitoring of Solid Waste in Hong Kong - Waste Statistics for 2014
9
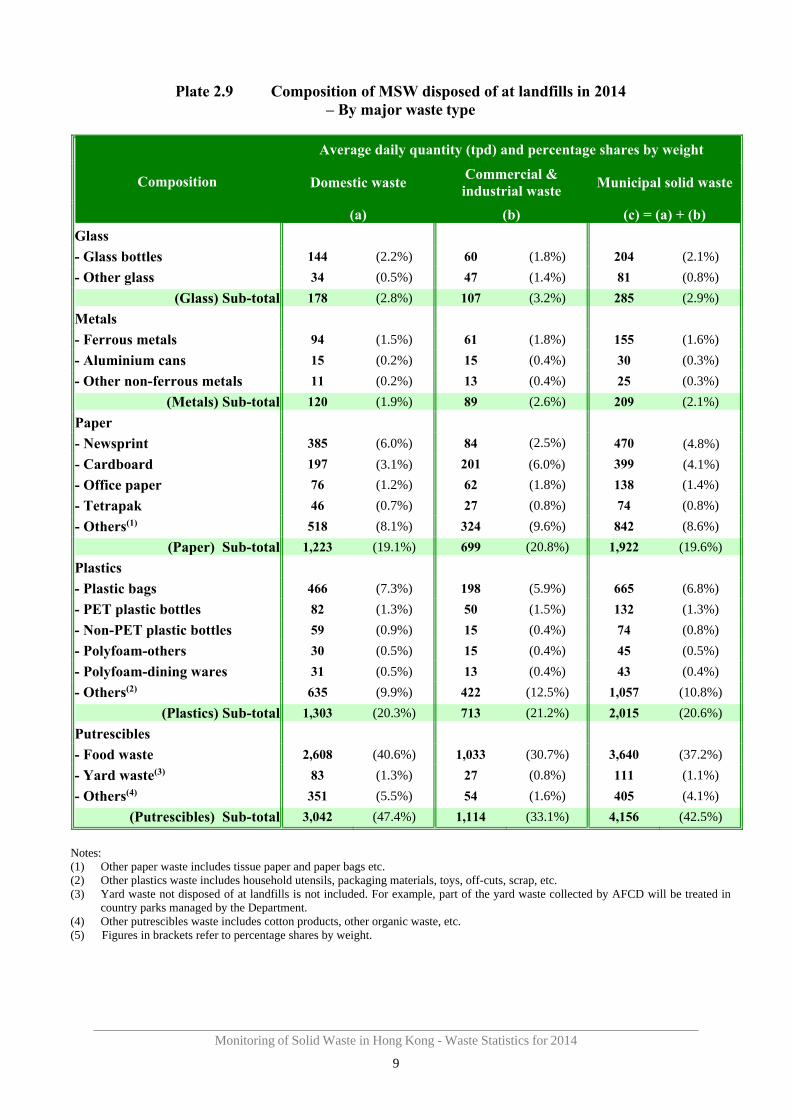
Plate 2.9 Composition of MSW disposed of at landfills in 2014 – By major waste type
Composition
Average daily quantity (tpd) and percentage shares by weight
Domestic waste
(a)
Commercial & industrial waste
(b)
Municipal solid waste
(c) = (a) + (b)
Glass
- Glass bottles 144 (2.2%) 60 (1.8%) 204 (2.1%)
- Other glass 34 (0.5%) 47 (1.4%) 81 (0.8%)
(Glass) Sub-total 178 (2.8%) 107 (3.2%) 285 (2.9%)
Metals
- Ferrous metals 94 (1.5%) 61 (1.8%) 155 (1.6%)
- Aluminium cans 15 (0.2%) 15 (0.4%) 30 (0.3%)
- Other non-ferrous metals 11 (0.2%) 13 (0.4%) 25 (0.3%)
(Metals) Sub-total 120 (1.9%) 89 (2.6%) 209 (2.1%)
385
(3.1%)
84
(6.0%)
470
(4.1%) 197
(6.0%)
201
(2.5%)
399
(4.8%)
76 (1.2%) 62 (1.8%) 138 (1.4%)
46 (0.7%) 27 (0.8%) 74 (0.8%)
Paper
- Newsprint - Cardboard
- Office paper
- Tetrapak
- Others(1) 518 (8.1%) 324 (9.6%) 842 (8.6%)
(Paper) Sub-total 1,223 (19.1%) 699 (20.8%) 1,922 (19.6%)
Plastics
- Plastic bags 466 (7.3%) 198 (5.9%) 665 (6.8%)
- PET plastic bottles 82 (1.3%) 50 (1.5%) 132 (1.3%)
- Non-PET plastic bottles 59 (0.9%) 15 (0.4%) 74 (0.8%)
- Polyfoam-others 30 (0.5%) 15 (0.4%) 45 (0.5%)
- Polyfoam-dining wares 31 (0.5%) 13 (0.4%) 43 (0.4%)
- Others(2) 635 (9.9%) 422 (12.5%) 1,057 (10.8%)
(Plastics) Sub-total 1,303 (20.3%) 713 (21.2%) 2,015 (20.6%)
Putrescibles
- Food waste 2,608 (40.6%) 1,033 (30.7%) 3,640 (37.2%)
- Yard waste(3) 83 (1.3%) 27 (0.8%) 111 (1.1%)
- Others(4) 351 (5.5%) 54 (1.6%) 405 (4.1%)
(Putrescibles) Sub-total 3,042 (47.4%) 1,114 (33.1%) 4,156 (42.5%)
Notes: (1) Other paper waste includes tissue paper and paper bags etc. (2) Other plastics waste includes household utensils, packaging materials, toys, off-cuts, scrap, etc. (3) Yard waste not disposed of at landfills is not included. For example, part of the yard waste collected by AFCD will be treated in
country parks managed by the Department. (4) Other putrescibles waste includes cotton products, other organ ic waste, etc. (5) Figures in brackets refer to percentage shares by weight.
Monitoring of Solid Waste in Hong Kong - Waste Statistics for 2014
10
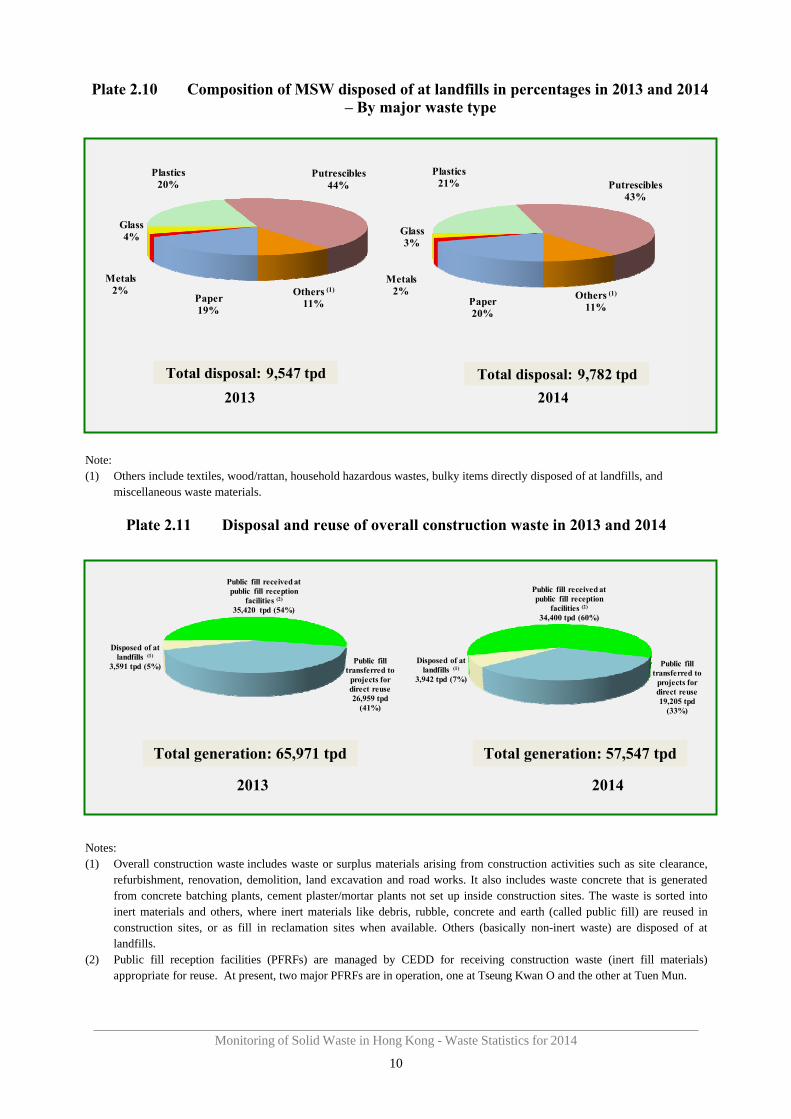
Plate 2.10 Composition of MSW disposed of at landfills in percentages in 2013 and 2014 – By major waste type
Plastics Putrescibles Plastics 20% 44% 21% Putrescibles
43%
Glass Glass 4% 3%
Metals Metals 2% 2%
Paper Paper 19% 20%
Others (1)
11% Others (1)
11%
Total disposal: 9,547 tpd Total disposal: 9,782 tpd
2013 2014
Note: (1) Others include textiles, wood/rattan, household hazardous wastes, bulky items directly disposed of at landfills, and
miscellaneous waste materials.
Public fill received at public fill reception Public fill received at
facilities (2) public fill reception 35,420 tpd (54%) facilities (2)
34,400 tpd (60%)
Disposed of at landfills (1)
Public fill Disposed of at Public fill 3,591 tpd (5%) transferred to landfills (1) transferred to
projects for 3,942 tpd (7%) projects for direct reuse direct reuse 26,959 tpd 19,205 tpd
(41%) (33%)
Total generation: 65,971 tpd Total generation: 57,547 tpd
2013 2014
Plate 2.11 Disposal and reuse of overall construction waste in 2013 and 2014
Notes: (1) Overall construction waste includes waste or surplus materials arising from construction activities such as site clearance,
refurbishment, renovation, demolition, land excavation and road works. It also includes waste concrete that is generated from concrete batching plants, cement plaster/mortar plants not set up inside construction sites. The waste is sorted into inert materials and others, where inert materials like debris, rubble, concrete and earth (called public fill) are reused in construction sites, or as fill in reclamation sites when available. Others (basically non-inert waste) are disposed of at landfills.
(2) Public fill reception facilities (PFRFs) are managed by CEDD for receiving construction waste (inert fill materials) appropriate for reuse. At present, two major PFRFs are in operation, one at Tseung Kwan O and the other at Tuen Mun.
Monitoring of Solid Waste in Hong Kong - Waste Statistics for 2014
11
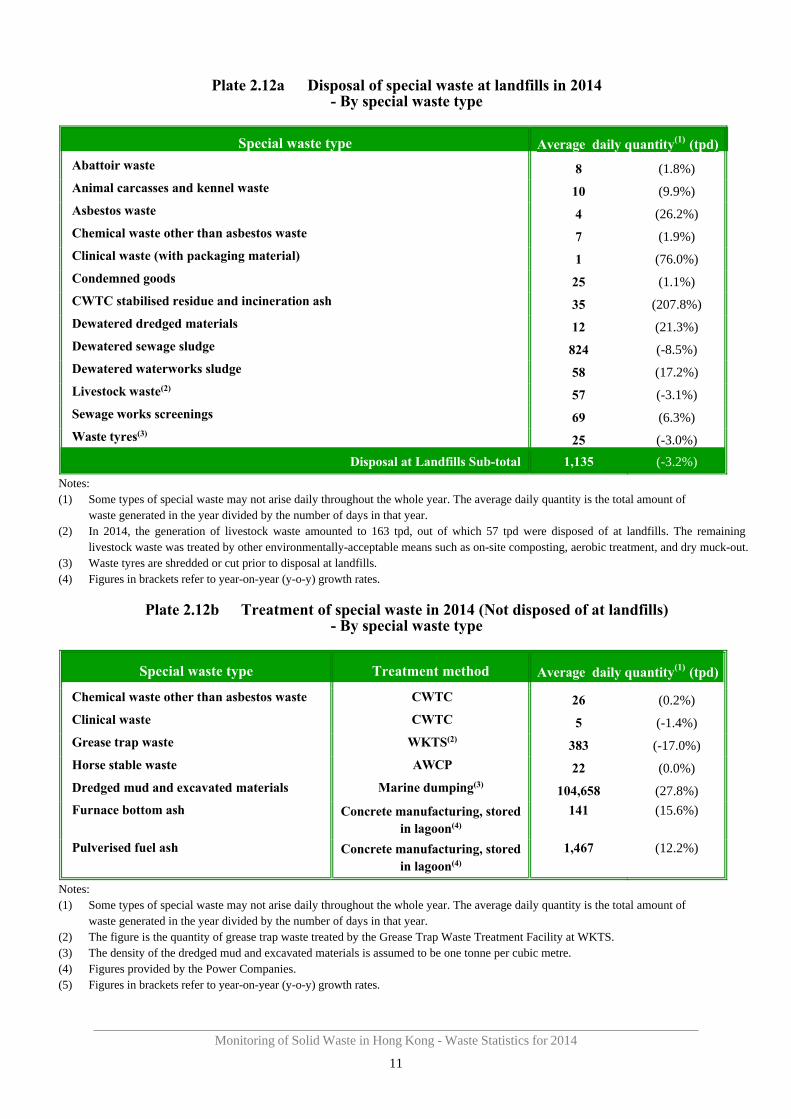
Plate 2.12a Disposal of special waste at landfills in 2014 - By special waste type
Special waste type Average daily quantity(1) (tpd)
Abattoir waste 8 (1.8%)
Animal carcasses and kennel waste 10 (9.9%)
Asbestos waste 4 (26.2%)
Chemical waste other than asbestos waste 7 (1.9%)
Clinical waste (with packaging material) 1 (76.0%)
Condemned goods 25 (1.1%)
CWTC stabilised residue and incineration ash 35 (207.8%)
Dewatered dredged materials 12 (21.3%)
Dewatered sewage sludge 824 (-8.5%)
Dewatered waterworks sludge 58 (17.2%)
Livestock waste(2) 57 (-3.1%)
Sewage works screenings 69 (6.3%)
Waste tyres(3) 25 (-3.0%)
Disposal at Landfills Sub-total 1,135 (-3.2%)
Notes: (1) Some types of special waste may not arise daily throughout th e whole year. The average daily quantity is the total amount of
waste generated in the year divided by the number of d ays in that year. (2) In 2014, the generation of livestock waste amounted to 163 tpd, out of which 57 tpd were disposed of at landfills. The remaining
livestock waste was treated by other environmentally-acceptable means such as on-site composting, aerobic treatment, and dry muck-out. (3) Waste tyres are shredded or cut prior to disposal at landfills. (4) Figures in brackets refer to year-on-year (y-o-y) growth rates.
Plate 2.12b Treatment of special waste in 2014 (Not disposed of at landfills) - By special waste type
Special waste type Treatment method Average daily quantity(1) (tpd)
Chemical waste other than asbestos waste CWTC 26 (0.2%)
Clinical waste CWTC 5 (-1.4%)
Grease trap waste WKTS(2) 383 (-17.0%)
Horse stable waste AWCP 22 (0.0%)
Dredged mud and excavated materials Marine dumping(3) 104,658 (27.8%)
Furnace bottom ash Concrete manufacturing, stored in lagoon(4)
141 (15.6%)
Pulverised fuel ash Concrete manufacturing, stored in lagoon(4)
1,467 (12.2%)
Notes: (1) Some types of special waste may not arise daily throughout th e whole year. The average daily quantity is the total amount of
waste generated in the year divided by the number of d ays in that year. (2) The figure is the quantity of grease trap waste treated by the Grease Trap Waste Treatment Facility at WKTS. (3) The density of the dredged mud and excavated materials is assumed to be one tonne per cubic metre. (4) Figures provided by the Power Companies. (5) Figures in brackets refer to year-on-year (y-o-y) growth rates.
Monitoring of Solid Waste in Hong Kong - Waste Statistics for 2014
12
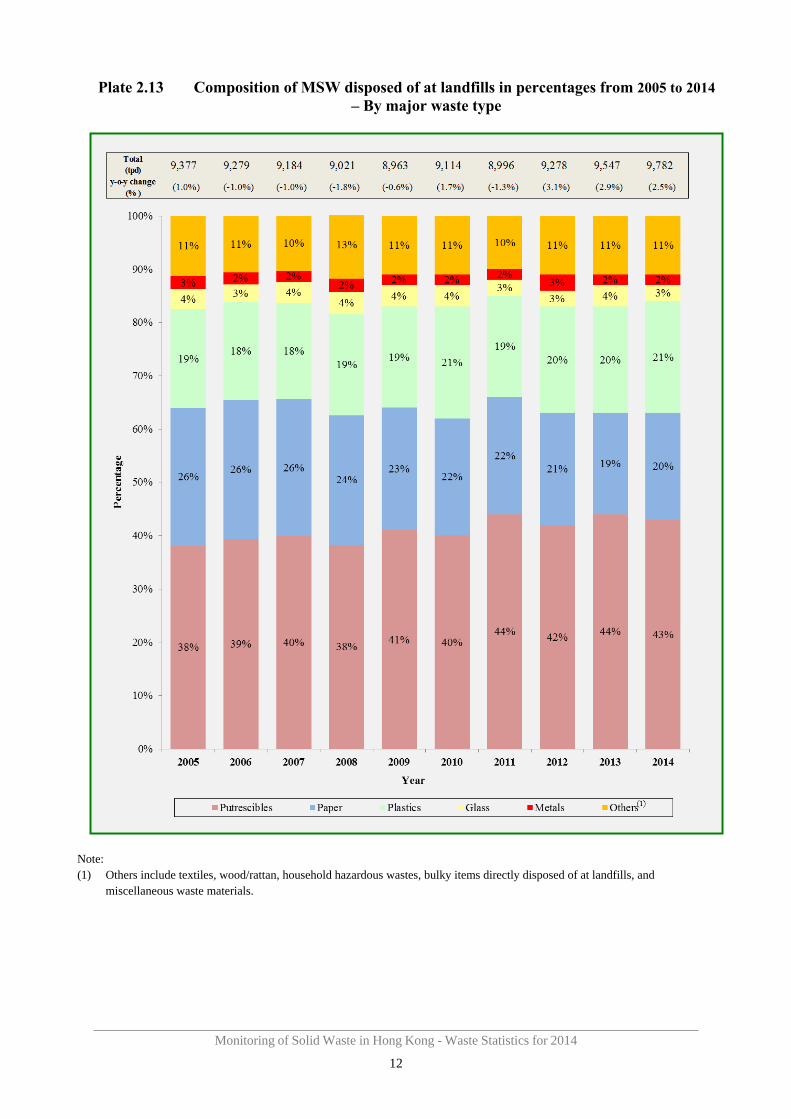
Plate 2.13 Composition of MSW disposed of at landfills in percentages from 2005 to 2014 – By major waste type
Note: (1) Others include textiles, wood/rattan, household hazardous wastes, bulky items directly disposed of at landfills, and
miscellaneous waste materials.
Monitoring of Solid Waste in Hong Kong - Waste Statistics for 2014
13
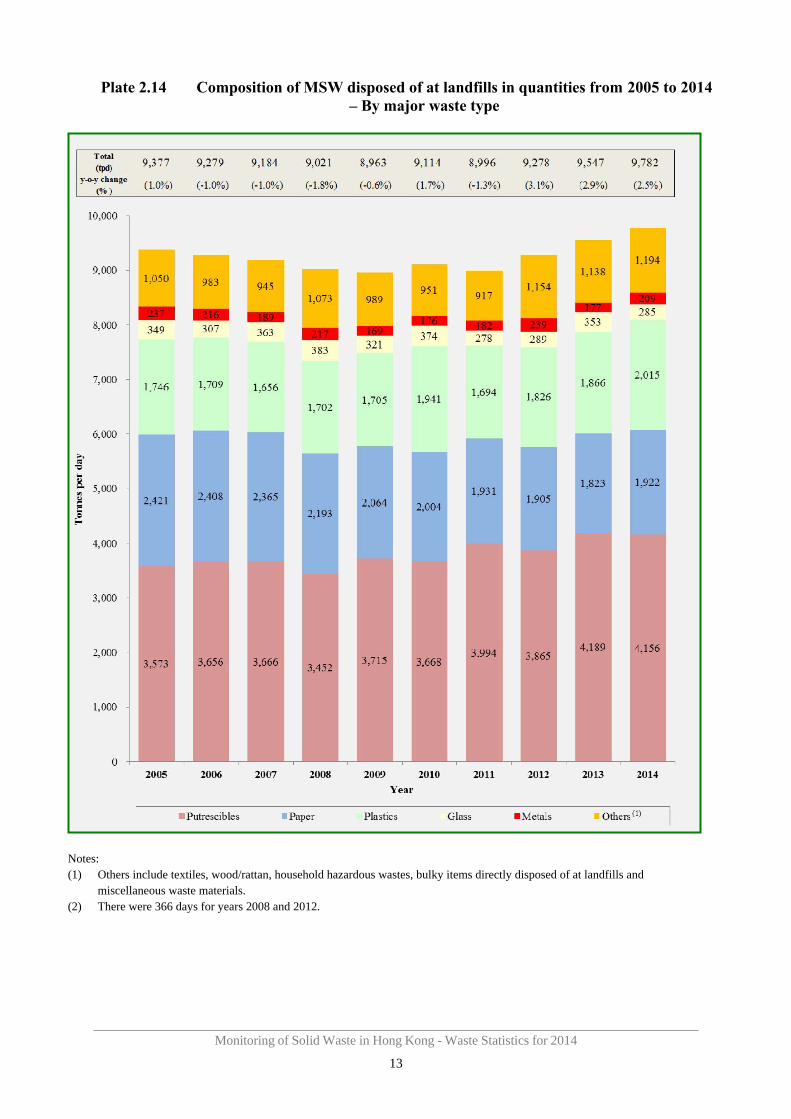
Plate 2.14 Composition of MSW disposed of at landfills in quantities from 2005 to 2014 – By major waste type
Notes: (1) Others include textiles, wood/rattan, household hazardous wastes, bulky items directly disposed of at landfills and
miscellaneous waste materials. (2) There were 366 days for years 2008 and 2012.
Monitoring of Solid Waste in Hong Kong - Waste Statistics for 2014
14
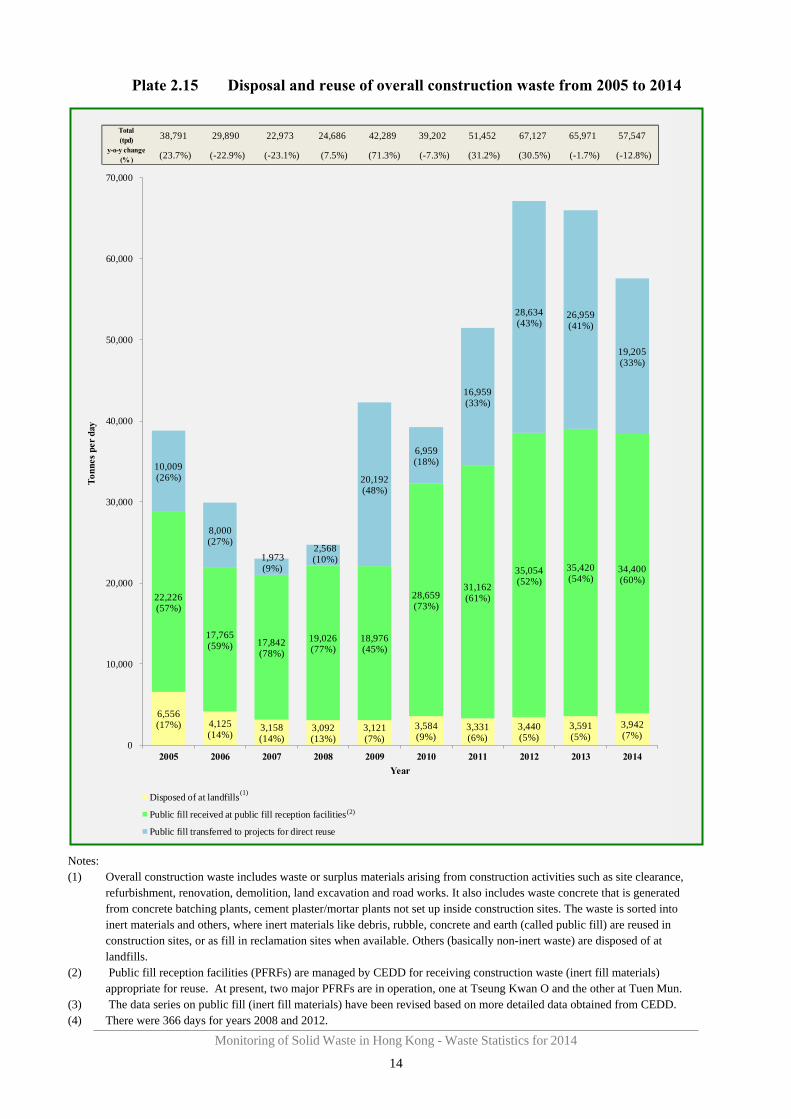
Plate 2.15 Disposal and reuse of overall construction waste from 2005 to 2014
Total 38,791 29,890 22,973 24,686 42,289 39,202 51,452 67,127 65,971 57,547 (tpd)
y-o-y change (% ) (23.7%) (-22.9%) (-23.1%) (7.5%) (71.3%) (-7.3%) (31.2%) (30.5%) (-1.7%) (-12.8%)
70,000
60,000
28,634 26,959 (43%) (41%)
50,000 19,205 (33%)
16,959 (33%)
40,000
Ton
nes
per
day
6,959
10,009 (18%)
(26%) 20,192 (48%)
30,000
8,000 (27%)
1,973 (9%)
2,568 (10%)
35,054 35,420 34,400
20,000
22,226 (57%)
28,659 (73%)
31,162 (61%)
(52%) (54%) (60%)
17,765 (59%) 17,842
(78%)
19,026 (77%)
18,976 (45%)
10,000
6,556
0
(17%) 4,125 (14%)
3,158 (14%)
3,092 (13%)
3,121 (7%)
3,584 (9%)
3,331 (6%)
3,440 (5%)
3,591 (5%)
3,942 (7%)
2005 2006 2007 2008 2009 2010 2011 2012 2013 2014
Year
(1) Disposed of at landfills
(2) Public fill received at public fill reception facilities
Public fill transferred to projects for direct reuse
Notes: (1) Overall construction waste includes waste or surplus materials arising from construction activities such as site clearance,
refurbishment, renovation, demolition, land excavation and road works. It also includes waste concrete that is generated from concrete batching plants, cement plaster/mortar plants not set up inside construction sites. The waste is sorted into inert materials and others, where inert materials like debris, rubble, concrete and earth (called public fill) are reused in construction sites, or as fill in reclamation sites when available. Others (basically non-inert waste) are disposed of at landfills.
(2) Public fill reception facilities (PFRFs) are managed by CEDD for receiving construction waste (inert fill materials) appropriate for reuse. At present, two major PFRFs are in operation, one at Tseung Kwan O and the other at Tuen Mun.
(3) The data series on public fill (inert fill materials) have been revised based on more detailed data obtained from CEDD. (4) There were 366 days for years 2008 and 2012.
Monitoring of Solid Waste in Hong Kong - Waste Statistics for 2014
15
3. Resource Recovery and Recycling
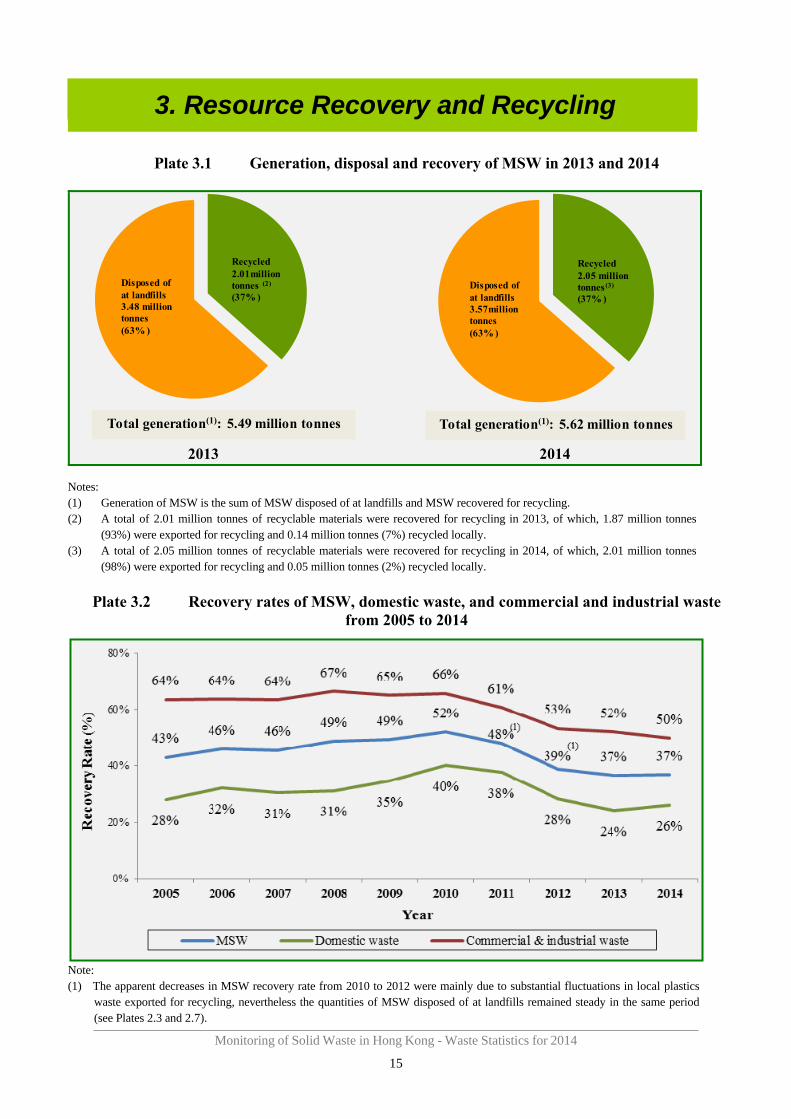
Plate 3.1 Generation, disposal and recovery of MSW in 2013 and 2014
Recycled 2.01million tonnes (2)
(37% )
Disposed of at landfills 3.48 million tonnes (63% )
Recycled 2.05 million tonnes(3)
(37% ) Disposed of at landfills 3.57million tonnes (63% )
Total generation(1): 5.49 million tonnes Total generation(1): 5.62 million tonnes
2013 2014
Notes: (1) Generation of MSW is the sum of MSW disposed of at landfills and MSW recovered for recycling. (2) A total of 2.01 million tonnes of recyclable materials were recovered for recycling in 2013, of which, 1.87 million tonnes
(93%) were exported for recycling and 0.14 million tonnes (7%) recycled locally. (3) A total of 2.05 million tonnes of recyclable materials were recovered for recycling in 2014, of which, 2.01 million tonnes
(98%) were exported for recycling and 0.05 million tonnes (2%) recycled locally.
Plate 3.2 Recovery rates of MSW, domestic waste, and commercial and industrial waste from 2005 to 2014
Note: (1) The apparent decreases in MSW recovery rate from 2010 to 2012 were mainly due to substantial fluctuations in local plastics
waste exported for recycling, nevertheless the quantities of MSW disposed of at landfills remained steady in the same period (see Plates 2.3 and 2.7).
Monitoring of Solid Waste in Hong Kong - Waste Statistics for 2014
16
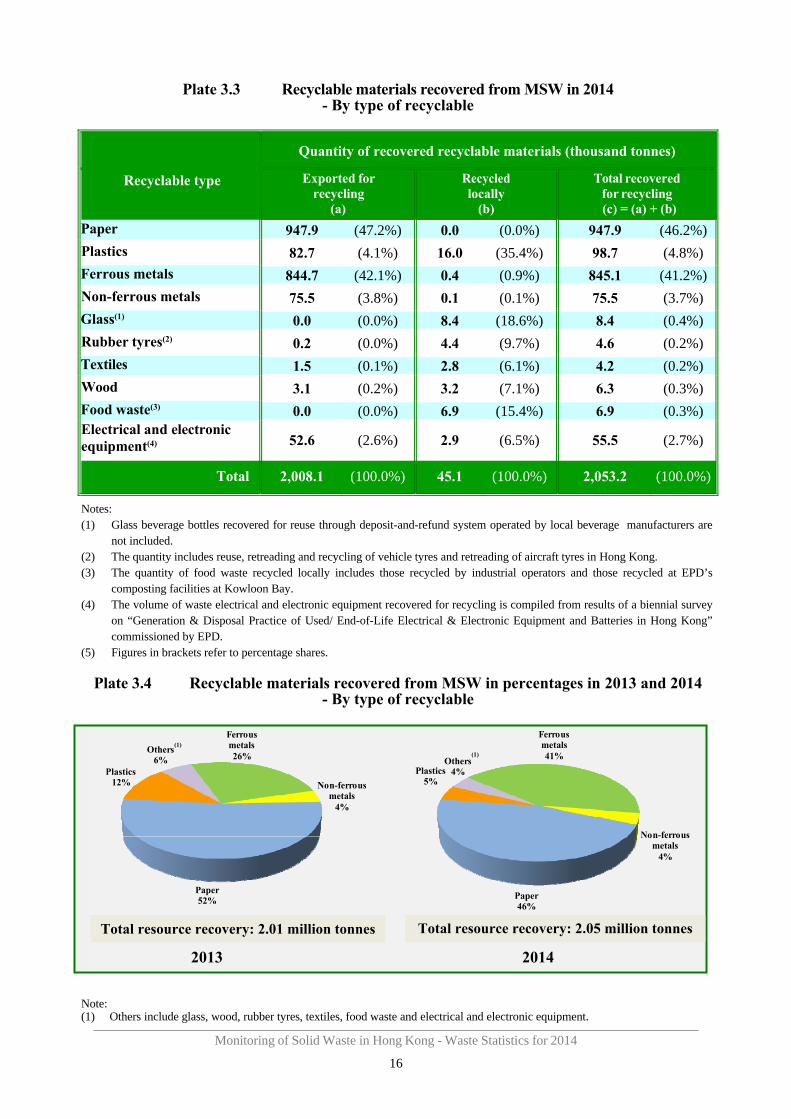
Plate 3.3 Recyclable materials recovered from MSW in 2014 - By type of recyclable
Recyclable type
Quantity of recovered recyclable materials (thousand tonnes)
Exported for recycling
(a)
Recycled locally
(b)
Total recovered for recycling
(c) = (a) + (b)
Paper 947.9 (47.2%) 0.0 (0.0%) 947.9 (46.2%)
Plastics 82.7 (4.1%) 16.0 (35.4%) 98.7 (4.8%)
Ferrous metals 844.7 (42.1%) 0.4 (0.9%) 845.1 (41.2%)
Non-ferrous metals 75.5 (3.8%) 0.1 (0.1%) 75.5 (3.7%)
Glass(1) 0.0 (0.0%) 8.4 (18.6%) 8.4 (0.4%)
Rubber tyres(2) 0.2 (0.0%) 4.4 (9.7%) 4.6 (0.2%)
Textiles 1.5 (0.1%) 2.8 (6.1%) 4.2 (0.2%)
Wood 3.1 (0.2%) 3.2 (7.1%) 6.3 (0.3%)
Food waste(3) 0.0 (0.0%) 6.9 (15.4%) 6.9 (0.3%) Electrical and electronic equipment(4) 52.6 (2.6%) 2.9 (6.5%) 55.5 (2.7%)
Total 2,008.1 (100.0%) 45.1 (100.0%) 2,053.2 (100.0%)
Notes: (1) Glass beverage bottles recovered for reuse through deposit-and-refund system operated by local beverage manufacturers are
not included. (2) The quantity includes reuse, retreading and recycling of vehicle tyres and retreading of aircraft tyres in Hong Kong. (3) The quantity of food waste recycled locally includes those recycled by industrial operators and those recycled at EPD’s
composting facilities at Kowloon Bay. (4) The volume of waste electrical and electronic equipment recovered for recycling is compiled from results of a biennial survey
on “Generation & Disposal Practice of Used/ End-of-Life Electrical & Electronic Equipment and Batteries in Hong Kong” commissioned by EPD.
(5) Figures in brackets refer to percentage shares.
Plate 3.4 Recyclable materials recovered from MSW in percentages in 2013 and 2014 - By type of recyclable
Plastics 12%
6% Plastics
Others 4%
Ferrous Ferrous (1) metals metals Others
26% (1) 41%
5%Non-ferrous metals
4%
Non-ferrous metals
4%
Paper Paper52% 46%
Total resource recovery: 2.01 million tonnes Total resource recovery: 2.05 million tonnes
2013 2014
Note: (1) Others include glass, wood, rubber tyres, textiles, food waste and electrical and electronic equipment.
Monitoring of Solid Waste in Hong Kong - Waste Statistics for 2014
17
Plate 3.5 Total quantities and export values of recyclable materials recovered from MSW from 2005 to 2014
Plate 3.6 Values of exported recyclable materials recovered from MSW in percentages in 2013 and 2014 - By major type of recyclable
(1) Others 0.3% (1) Ferrous metals Plastics Others Ferrous metals
Paper 25% Paper
31%
34% metals 32%
Total value: HK$5.0 billion Total value: HK$5.5 billion
2013 2014
28% 6% 41% Plastics
3%
0.2%
Non-ferrous metals
Non-ferrous
Note: (5) Others include glass, wood, textiles and rubber tyres only.
Monitoring of Solid Waste in Hong Kong - Waste Statistics for 2014
18
Plate 3.7 Quantities and values of exported recyclable materials recovered from MSW in 2014 - By major type of recyclable
Recyclable type Quantity
(tonnes)
Value
($ thousand)
Value per unit
($ / tonne)
a. Ferrous metals
- Alloy steel scrap 17,707 (2.1%) 217,361 (9.7%) 12,275
- Pig or cast iron 0 (0.0%) 0 (0.0%) 0
- Tinplate 0 (0.0%) 0 (0.0%) 0
- Other scraps 827,014 (97.9%) 2,025,630 (90.3%) 2,449
(Ferrous metals) Sub-total 844,721 (100.0%) 2,242,991 (100.0%) 2,655
b. Non-ferrous metals
- Aluminium 41,481 (55.0%) 316,453 (17.9%) 7,629
- Copper & alloys 32,694 (43.3%) 1,152,580 (65.2%) 35,253
- Lead 864 (1.1%) 4,363 (0.2%) 5,051
- Nickel 255 (0.3%) 5,161 (0.3%) 20,209
- Metal ash & residues 114 (0.2%) 1,369 (0.1%) 12,017
- Precious metal 34 (0.0%) 284,661 (16.1%) 8,340,478
- Tin 26 (0.0%) 4,098 (0.2%) 158,343
- Zinc 0 (0.0%) 0 (0.0%) -
(Non-ferrous metals) Sub-total 75,468 (100.0%) 1,768,684 (100.0%) 23,436
c. Plastics
- Polyethylene (PE) 10,328 (12.5%) 25,345 (17.6%) 2,454
- Polyethylene terephthalate (PET) 7,930 (9.6%) 16,279 (11.3%) 2,053
- Polypropylene (PP) 3,532 (4.3%) 6,090 (4.2%) 1,724
- Polyvinyl chloride (PVC) 3,144 (3.8%) 4,738 (3.3%) 1,507
- Polystyrene & copolymers (PS) 134 (0.2%) 885 (0.6%) 6,589
- Others(1) 57,630 (69.7%) 90,665 (63.0%) 1,573
(Plastics) Sub-total 82,698 (100.0%) 144,003 (100.0%) 1,741
d. Textiles
- Cotton 13 (0.9%) 146 (1.6%) 10,894
- Man-made fibres 0 (0.0%) 0 (0.0%) -
- Old clothing & other textile articles, rags, etc.
1,444 (99.1%) 8,766 (98.4%) 6,073
(Textiles) Sub-total 1,457 (100.0%) 8,912 (100.0%) 6,117
e. Wood & paper
- Paper 947,859 (99.7%) 1,354,709 (99.7%) 1,429
- Wood (include sawdust) 3,122 (0.3%) 3,584 (0.3%) 1,148
(Wood & paper) Sub-total 950,981 (100.0%) 1,358,293 (100.0%) 1,428
f. Glass
(Glass) Sub-total 33 (100.0%) 20 (100.0%) 624
g. Electrical and electronic equipment
(Electrical and electronic equipment) Sub-total
52,563 (100.0%) N/A N/A
Notes: (1) Other recyclable plastics include waste, parings and scrap not elsewhere classified. (2) Figures in brackets refer to percentage shares.
Monitoring of Solid Waste in Hong Kong - Waste Statistics for 2014
19
Plate 3.8 Generation, disposal and recovery of MSW from 2005 to 2014
Note: (1) Generation of MSW is the sum of MSW disposed of at landfills and MSW recovered for recycling.
Monitoring of Solid Waste in Hong Kong - Waste Statistics for 2014
20
Plate 3.9 Recyclable materials recovered from MSW in percentages from 2005 to 2014 - By major type of recyclable
Note: (1) Others include glass, wood, rubber tyres, textiles, food waste, and electrical and electronic equipment.
Monitoring of Solid Waste in Hong Kong - Waste Statistics for 2014
21
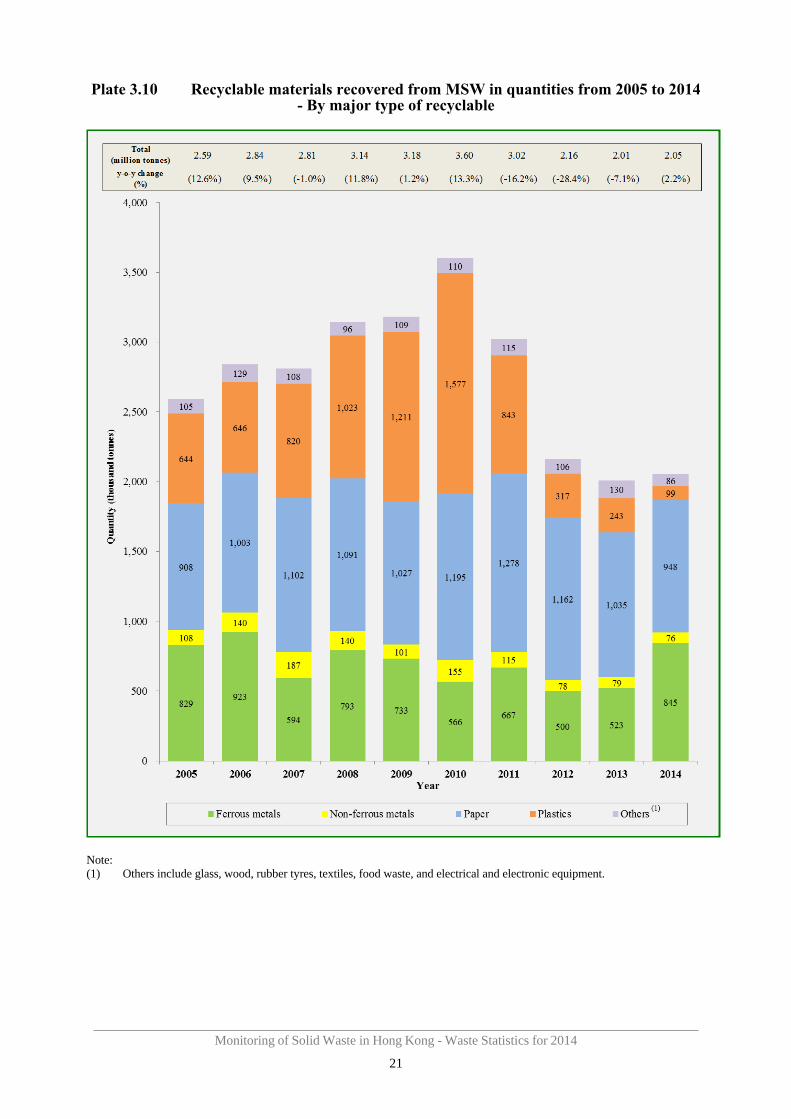
Plate 3.10 Recyclable materials recovered from MSW in quantities from 2005 to 2014 - By major type of recyclable
Note: (1) Others include glass, wood, rubber tyres, textiles, food waste, and electrical and electronic equipment.
Monitoring of Solid Waste in Hong Kong - Waste Statistics for 2014
22
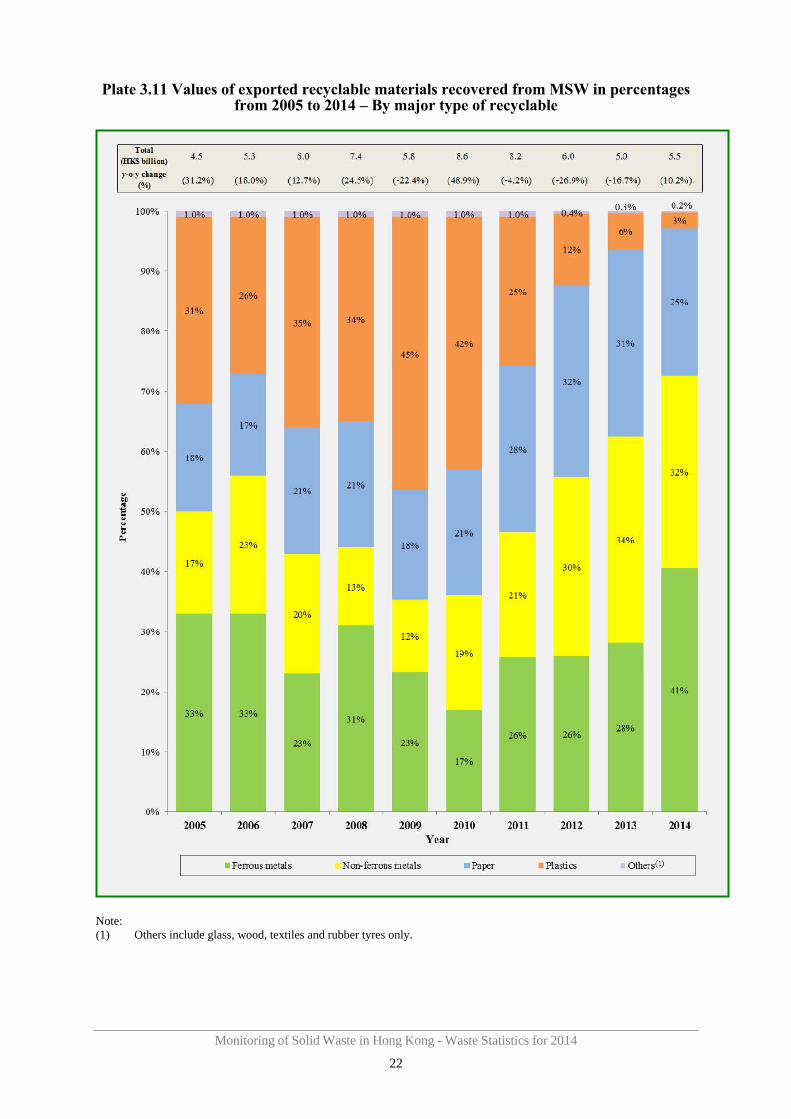
Plate 3.11 Values of exported recyclable materials recovered from MSW in percentages from 2005 to 2014 – By major type of recyclable
Note: (1) Others include glass, wood, textiles and rubber tyres only.
Monitoring of Solid Waste in Hong Kong - Waste Statistics for 2014
23
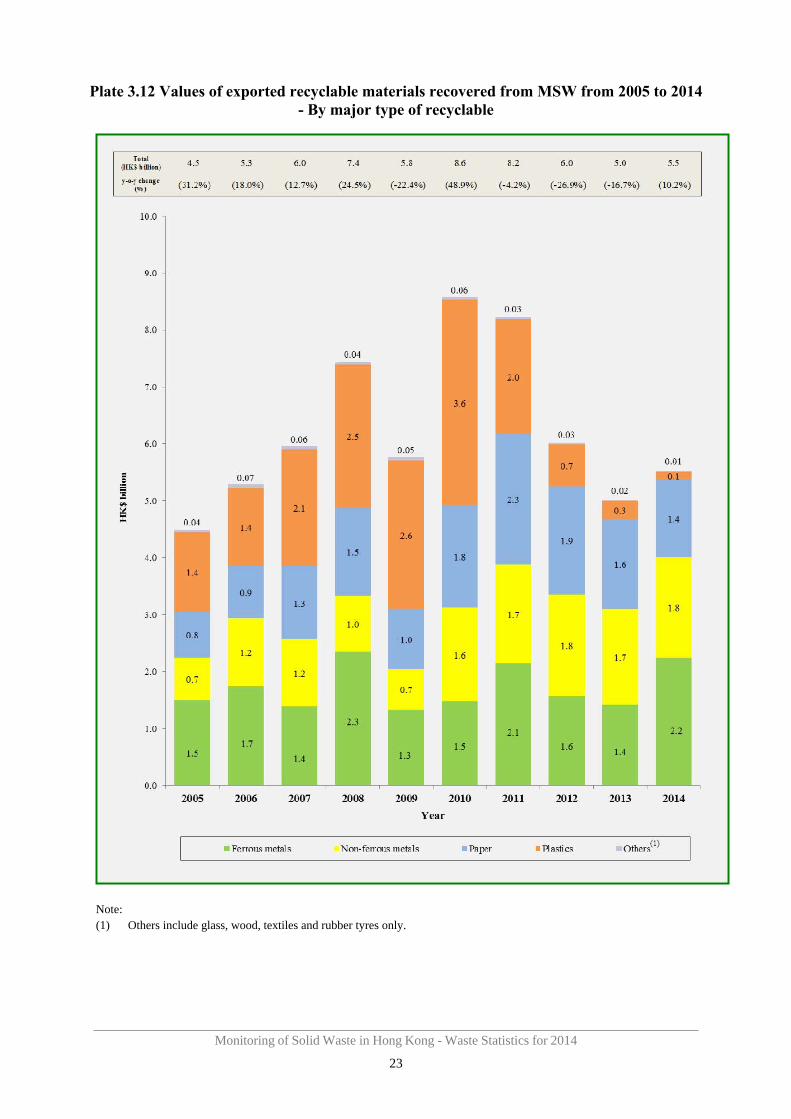
Plate 3.12 Values of exported recyclable materials recovered from MSW from 2005 to 2014 - By major type of recyclable
Note: (1) Others include glass, wood, textiles and rubber tyres only.
Appendix 1 : Classification of Solid Waste and Monitoring Methodology
Monitoring of Solid Waste in Hong Kong - Waste Statistics for 2014
24
Waste Classification and Terminology
Solid waste is classified into three main categories by making reference to the sources of waste and the institutional arrangements for waste collection and disposal. These three main categories of solid waste are municipal solid waste, overall construction waste and special waste. The detailed interpretations of some commonly used terms are described below.
Municipal solid waste includes three categories: domestic waste, commercial waste and industrial waste.
Domestic waste refers to household waste, waste generated from daily activities ininstitutional premises (e.g. schools, government offices) and refuse collected from publiccleansing services. Public cleansing waste includes dirt and litter collected by the Foodand Environmental Hygiene Department, marine refuse collected by the MarineDepartment and waste from country parks collected by the Agriculture, Fisheries andConservation Department.
Commercial waste is waste arising from commercial activities taking place in shops,restaurants, hotels, offices, markets in private housing estates, etc. It is collected mainlyby private waste collectors.
Industrial waste is waste arising from industrial activities and does not includeconstruction waste and chemical waste. It is usually collected by private waste collectors.However, some industries may deliver their industrial waste directly to landfills fordisposal.
Municipal solid waste contains a small portion of bulky items like furniture and domesticappliances which cannot be handled by conventional compactor type refuse collectionvehicles. These items are regarded as bulky waste and are usually collected separately.
Overall construction waste is a mixture of waste or surplus materials arising from construction activities such as site clearance, excavation, refurbishment, renovation, demolition and road works. It also includes waste concrete that is generated from concrete batching plants and cement plaster/mortar manufacturing plants not set up inside construction sites. Overall construction waste may comprise a fraction of inert materials such as debris, rubble, earth and concrete, which, after proper sorting, can be recycled for use in site formation, land reclamation and construction.
Special waste is waste that requires special disposal arrangement. It includes abattoir waste, animal carcasses, asbestos, chemical waste, clinical waste, condemned goods, CWTC stabilized residue, dredged mud and excavated materials, sewage treatment and waterworks treatment sludge, grease trap waste, livestock waste, sewage works screenings, waste tyres, furnace bottom ash, pulverised fuel ash, etc.
Chemical waste is defined in the Waste Disposal (Chemical Waste) (General) Regulation
Monitoring of Solid Waste in Hong Kong - Waste Statistics for 2014
25
under the Waste Disposal Ordinance (Cap. 354). Chemical waste can be any substance arising from any process or trade activity which contains chemical in such form, quantity or concentration that can cause pollution to the environment or become a risk to health.
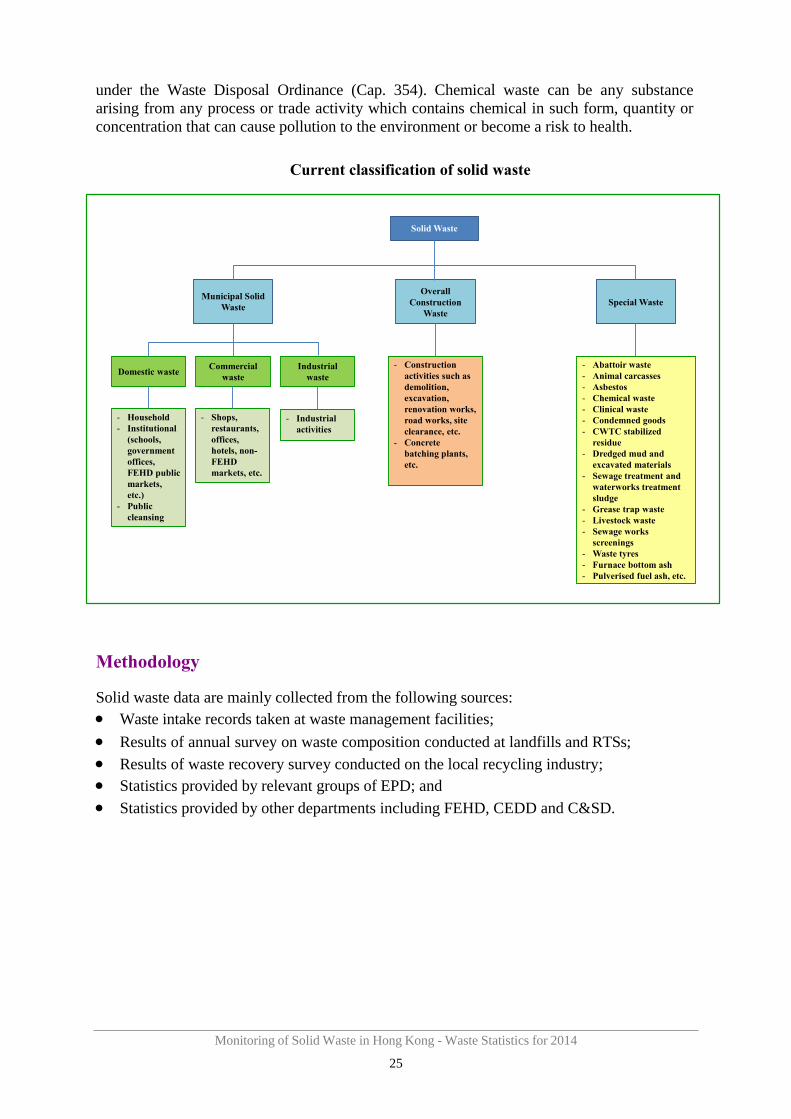
Current classification of solid waste
Solid Waste
-
-
-------
-
-
---
---
Municipal Solid Waste
Domestic waste
- Household Institutional (schools, government offices, FEHD publicmarkets, etc.) Public cleansing
-
-
Commercial waste
- Shops, restaurants, offices, hotels, non-FEHD markets, etc.
-
Industrial waste
Industrial activities
Overall Construction
Waste
Construction activities such as demolition, excavation, renovation works, road works, site clearance, etc. Concrete batching plants, etc.
Special Waste
Abattoir waste Animal carcasses Asbestos Chemical waste Clinical waste Condemned goods CWTC stabilized residue Dredged mud and excavated materials Sewage treatment and waterworks treatment sludge Grease trap waste Livestock waste Sewage works screenings Waste tyres Furnace bottom ash Pulverised fuel ash, etc.
Methodology
Solid waste data are mainly collected from the following sources: Waste intake records taken at waste management facilities;
Results of annual survey on waste composition conducted at landfills and RTSs; Results of waste recovery survey conducted on the local recycling industry; Statistics provided by relevant groups of EPD; and
Statistics provided by other departments including FEHD, CEDD and C&SD.