Embed Size (px)
Citation preview
W O R K I N G P A P E R
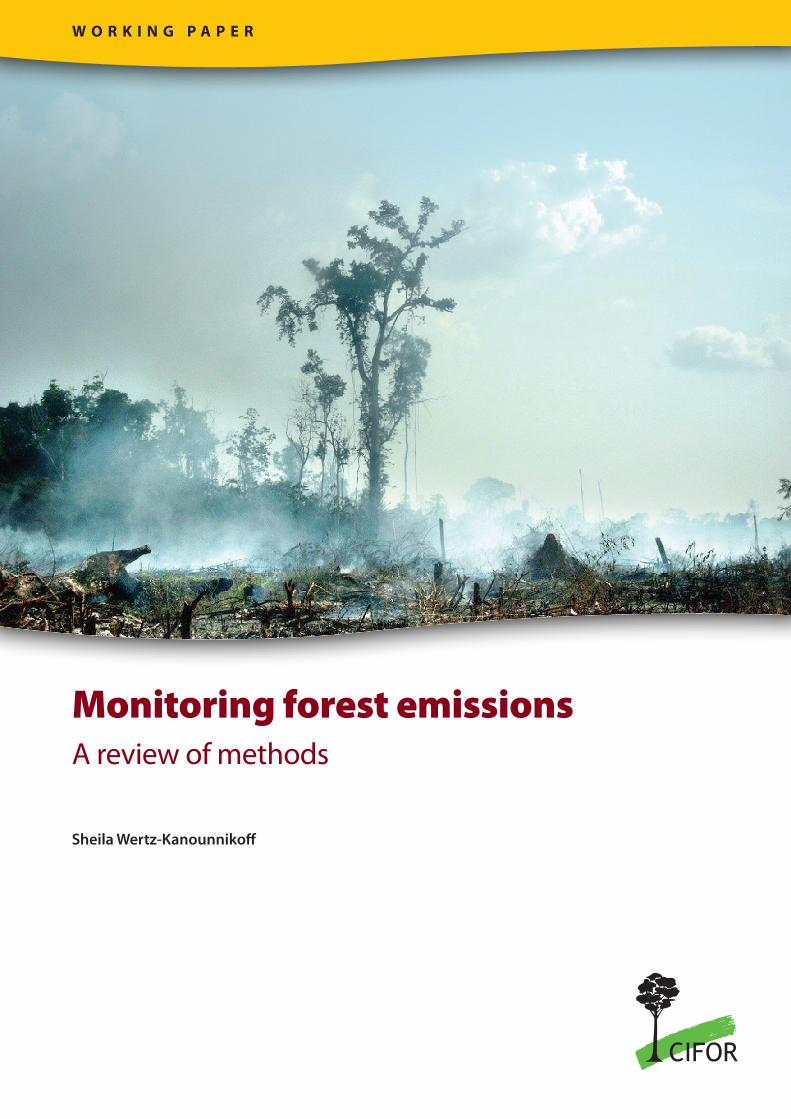
Monitoring forest emissionsA review of methods
Sheila Wertz-Kanounniko�
CIFOR
Center for International Forestry Research (CIFOR)
CIFOR advances human wellbeing, environmental conservation, and equity by conducting
research to inform policies and practices that a�ect forests in developing countries.
CIFOR is one of 15 centres within the Consultative Group on International Agricultural
Research (CGIAR). CIFOR’s headquarters are in Bogor, Indonesia. It also has o�ces in Asia,
Africa and South America. CIFOR works in over 30 countries worldwide and has links with
researchers in 50 international, regional and national organisations.
To request a copy of this publication, please contact [email protected]
www.cifor.cgiar.org
CIFORInternationalInstitute for
Environment andDevelopment

Working Paper No. 39
Monitoring forest emissionsA review of methods
Sheila Wertz-Kanounnikoff
November 2008
2 m o n i t o r i n g f o r e s t e m i s s i o n s
ContactSheila Wertz-Kanounnikoff Center for International Forestry Research (CIFOR)P.O. Box 0113 BOCBDBogor 16000Indonesia Tel: +62 251 8622 622 Fax: +62 251 8622 100 Email: [email protected]
AcknowledgementsThis paper was prepared as one of the background papers for the project “Compensation and incentives for the maintenance of ecosystem services: A review of current knowledge and the implications for the Norwegian ClimateForest Initiative,” funded by the Royal Norwegian Ministry of Foreign Affairs and conducted jointly by the International Institute for Environment and Development (IIED), the World Resources Institute (WRI) and the Center for International Forestry Research (CIFOR).
We thank DFID for covering printing and dissemination costs through its funding of CIFOR’s Forests and Climate Initiative.
The author thanks Erik Næsset, Ross Nelson, Arild Angelsen and Sven Wunder for valuable comments on an earlier draft, and Mel Kelly, Alana George and Jeff Walker for thoroughly editing this paper.
Disclaimers
The views expressed in this publication are those of the author(s) and do not necessarily represent the official position or policy of CIFOR, IIED, WRI or the Royal Norwegian Ministry of Foreign Affairs. The maps in this publication are for illustrative purposes and do not imply the expression of any opinion on the part of the authors, CIFOR, or their sponsors concerning the legal status of any country or territory or concerning the delimitation of frontiers or boundaries.
w o r k i n g p a p e r 3
table of contents
Acronyms and abbreviations . . . . . . . . . . . . . . . . . . . . . . . . . . . . . . . . . . . . . . . . . . . . . . . . . . . . . . . . . . . . . . . . . . . 4
Executive summary . . . . . . . . . . . . . . . . . . . . . . . . . . . . . . . . . . . . . . . . . . . . . . . . . . . . . . . . . . . . . . . . . . . . . . . . 5
1 Introduction . . . . . . . . . . . . . . . . . . . . . . . . . . . . . . . . . . . . . . . . . . . . . . . . . . . . . . . . . . . . . . . . . . . . . . . . 6
2 Monitoring the areal extent of deforestation and forest degradation . . . . . . . . . . . . . . . . . . . . . . . . . . . . . . . . . 7
2.1 Monitoring of gross deforestation . . . . . . . . . . . . . . . . . . . . . . . . . . . . . . . . . . . . . . . . . . . . . . . . . . . . . . . 7 2.1.1 Methods for deforestation monitoring . . . . . . . . . . . . . . . . . . . . . . . . . . . . . . . . . . . . . . . . . . . . . 7 2.1.2 Data availability . . . . . . . . . . . . . . . . . . . . . . . . . . . . . . . . . . . . . . . . . . . . . . . . . . . . . . . . . . . 8
2.2 Monitoring of forest degradation . . . . . . . . . . . . . . . . . . . . . . . . . . . . . . . . . . . . . . . . . . . . . . . . . . . . . . 10 2.2.1 Remote sensing techniques for monitoring degradation . . . . . . . . . . . . . . . . . . . . . . . . . . . . . . . 10 2.2.2 Ground-based degradation monitoring . . . . . . . . . . . . . . . . . . . . . . . . . . . . . . . . . . . . . . . . . . 11
3 Estimating tropical forest carbon stocks . . . . . . . . . . . . . . . . . . . . . . . . . . . . . . . . . . . . . . . . . . . . . . . . . . . . . 12 3.1 Global estimates of forest carbon stocks: the biome-average approach . . . . . . . . . . . . . . . . . . . . . . . . . . . . 12 3.2 Ground-based forest inventory data . . . . . . . . . . . . . . . . . . . . . . . . . . . . . . . . . . . . . . . . . . . . . . . . . . . . 12 3.3 Remote sensing techniques for measuring aboveground biomass . . . . . . . . . . . . . . . . . . . . . . . . . . . . . . . . 13
4 Estimating emissions from deforestation and forest degradation . . . . . . . . . . . . . . . . . . . . . . . . . . . . . . . . . . . 15
5 Concluding remarks . . . . . . . . . . . . . . . . . . . . . . . . . . . . . . . . . . . . . . . . . . . . . . . . . . . . . . . . . . . . . . . . . . . . 16
5.1 Ground-based measurements will remain indispensable . . . . . . . . . . . . . . . . . . . . . . . . . . . . . . . . . . . . . 16 5.2 Build monitoring capacity at national and international level . . . . . . . . . . . . . . . . . . . . . . . . . . . . . . . . . 16 5.3 Invest in data and methods for carbon stock measurements, especially LiDAR . . . . . . . . . . . . . . . . . . . . . . 16
References . . . . . . . . . . . . . . . . . . . . . . . . . . . . . . . . . . . . . . . . . . . . . . . . . . . . . . . . . . . . . . . . . . . . . . . 18
4 M o n i t o r i n g f o r e s t e M i s s i o n s
ALS Airborne laser scanning
CIFOR Center for International Forestry Research (Indonesia)
GIS Geographic information system
GL-AFOLU IPCC Guidelines for National Greenhouse Gas Inventories – Agriculture, Forestry and Other Land Use
GOFC-GOLD Global Observation of Forest and Land Cover Dynamics
GPG-LULUCF IPCC Good Practice Guidance for Land Use, Land-Use Change and Forestry
IIED International Institute for Environment and Development (UK)
IPCC Intergovernmental Panel on Climate Change
IPCC-GPG IPCC Good Practice Guidelines
LiDAR Light detection and ranging
MODIS Moderate Resolution Imaging Spectroradiometer
NASA National Aeronautics and Space Administration
PES Payments for environmental services
REDD Reducing emissions from deforestation and forest degradation
UNFCCC United Nations Framework Convention on Climate Change
WRI World Resources Institute
acronyms and abbreviations
w o r k i n g p a p e r 5
executive summary
Measuring and monitoring emissions from deforestation and forest degradation are central elements in a REDD scheme. Emissions from deforestation and degradation can be estimated from two important variables: (i) areal extent of deforestation and degradation, and (ii) carbon stock densities per area.
Current remote sensing technology can adequately measure tropical deforestation; currently it is less useful for assessing forest degradation and forest carbon densities which thus rely mainly on ground measurements. To increase cost-effectiveness, sampling and stratification techniques have been developed for both remote sensing and ground-based monitoring. The two most common approaches in remote sensing are wall-to-wall mapping, and sampling. Data resolution is a decisive factor, and a trade-off exists between data resolution (and thus accuracy) and costs. Monitoring forest degradation is more challenging than mapping deforestation, requiring ground-based measurements in addition to remote sensing. Current approaches to estimating forest carbon stocks in tropical countries include biome averages, forest inventories, and remote sensing measurements.
There are two fundamentally different, but equally valid, approaches to estimating emissions from deforestation or forest degradation: the stock-difference approach and the gain-loss approach. The second is likely to become the long-term objective, but the first is more applicable in the short-term.
The following messages arise from this paper:
Ground-based measurements are indispensableCurrent remote sensing methods are useful, especially for deforestation monitoring, and there is potential
for future satellite-based carbon stock monitoring. Still, ground-based measurements are important, principally to monitor carbon stocks, but also to verify results obtained from image interpretation for deforestation and degradation mapping.
Build monitoring capacity at national and international levelKey constraints to monitoring in many developing countries remain access to data, and the capacity for data
analysis and management. Avenues to address these challenges include access to free or low-cost satellite imagery, supporting countries to set up national monitoring infrastructures, regional partnerships for acquiring and developing appropriate methods, and sharing experiences from Annex I countries. To secure reliable monitoring, independent third party monitoring and certification, for example in the form of an international forest carbon monitoring institution, could be another avenue. Centralising this task at global level can further benefit from economies of scales and render monitoring far more cost-effective than ensuring coherent monitoring by each country, and provide more coherent time-series of deforestation data for baseline purposes.
Invest in data and methods for carbon stock measurements, especially LiDARCurrently knowledge of forest carbon stocks is limited and substantial further effort in overcoming this
shortcoming is needed. Particularly promising are LiDAR sensors, but satellite imagery will only become available after 2015. There is thus a need to make maximum use of currently available alternatives (ground-based measurements, GIS models to extrapolate sample data, etc.) including the establishment of allometric relationships for alternative forest types and uses. At the same time, further investments in LiDAR technology, notably launching satellite-borne sensors, are needed.
6 M o n i t o r i n g f o r e s t e M i s s i o n s
1. introduction
T he implementation of policies to reduce emissions from deforestation and forest degradation (REDD) in developing countries
requires cost-effectively obtained accurate and precise estimates of abated emissions at the national scale. Data accuracy and precision is relevant to secure investor confidence, especially if they are connected to international carbon markets. National-level monitoring is often preferred to that at project-level in order to reduce the risk of leakage or displacement of emissions. Cost-effectiveness is relevant for the suppliers of REDD credits (derived from abated emissions from deforestation and degradation) to maximise their gains.
As described in the 2008 GOFC-GOLD sourcebook for REDD1 (GOFC-GOLD 2008), emissions from deforestation and degradation can be estimated from two important variables:
Areal extent of deforestation and degradation1. Carbon stock densities per area2.
1 The sourcebook provides a consensus perspective from the global earth observation community and carbon experts on methodological issues relating to national-level REDD activities. It is an outcome of the ad hoc REDD working group, Global Observation of Forest and Land Cover Dynamics (GOFC-GOLD), and is intended to complement the 2003 IPCC Good Practice Guidance for Land Use, Land-Use Change and Forestry (GPG-LULUCF) and the 2006 IPCC Guidelines for National Greenhouse Gas Inventories Volume 4 Agriculture, Forestry and Other Land Use (GL-AFOLU).
Remote sensing technologies combined with ground measurements play a key role in monitoring these variables.
This paper reviews current methodologies available to monitor forest cover changes and associated emissions for the purpose of REDD schemes. Because these activities will likely imply national-level monitoring (even if sub-national approaches are allowed), this paper focuses on national-level assessments.2 It is organised as follows: Section 2 describes methods for monitoring the areal extent of deforestation and forest degradation; Section 3 focuses on carbon stock monitoring; Section 4 introduces methods to estimate emissions from deforestation and degradation; while Section 5 comprises concluding remarks.
2 REDD methodologies for project-level activities are also being developed. See for example the guidelines developed by the BioCarbon Fund (2008) or the Voluntary Carbon Standard for AFOLU (agriculture, forestry and other land use) projects (VCS 2007). One difference between national- and project level monitoring for REDD is the definition of monitoring boundaries. In national-level approaches, this corresponds to the country boundaries or the national forest area. In project-level approaches, due to the risk of leakage, an area greater than the project needs to be monitored, notably 5-7 times larger than the project area for projects above 100,000 ha or 20-40 times larger than the project area for projects below 100,000 ha (Brown et al. 2007, cited in BioCarbon Fund 2008).
w o r k i n g p a p e r 7
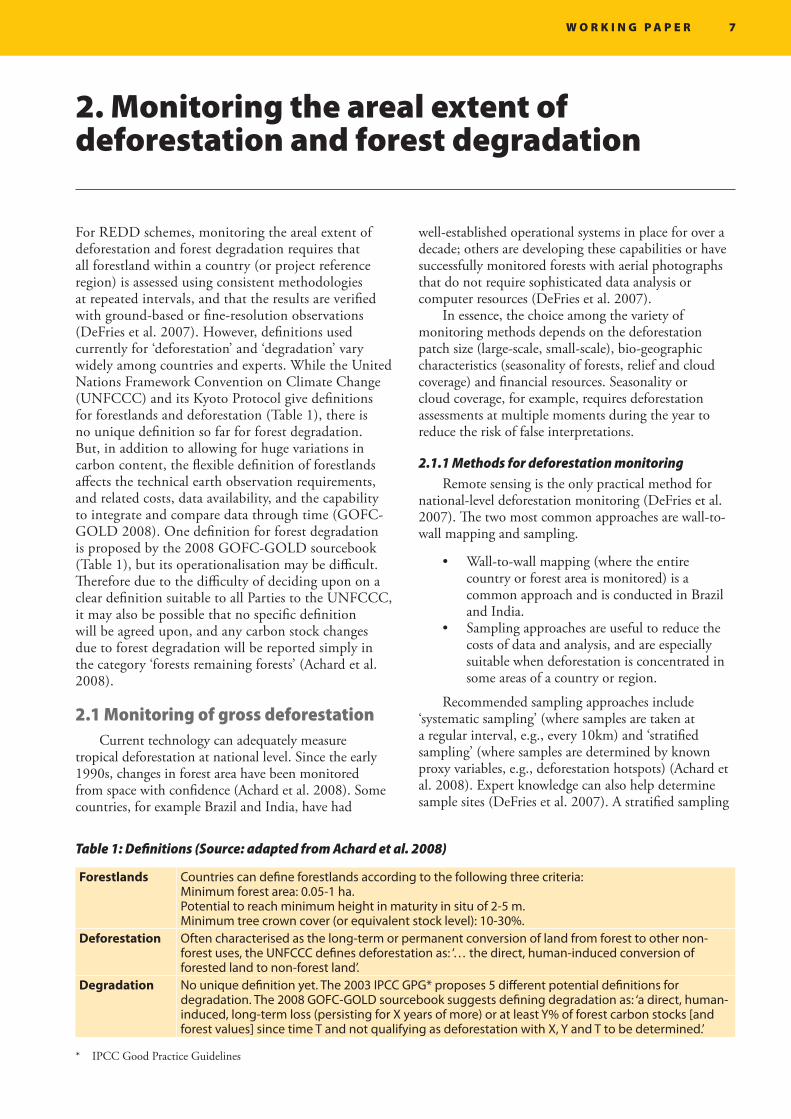
For REDD schemes, monitoring the areal extent of deforestation and forest degradation requires that all forestland within a country (or project reference region) is assessed using consistent methodologies at repeated intervals, and that the results are verified with ground-based or fine-resolution observations (DeFries et al. 2007). However, definitions used currently for ‘deforestation’ and ‘degradation’ vary widely among countries and experts. While the United Nations Framework Convention on Climate Change (UNFCCC) and its Kyoto Protocol give definitions for forestlands and deforestation (Table 1), there is no unique definition so far for forest degradation. But, in addition to allowing for huge variations in carbon content, the flexible definition of forestlands affects the technical earth observation requirements, and related costs, data availability, and the capability to integrate and compare data through time (GOFC-GOLD 2008). One definition for forest degradation is proposed by the 2008 GOFC-GOLD sourcebook (Table 1), but its operationalisation may be difficult. Therefore due to the difficulty of deciding upon on a clear definition suitable to all Parties to the UNFCCC, it may also be possible that no specific definition will be agreed upon, and any carbon stock changes due to forest degradation will be reported simply in the category ‘forests remaining forests’ (Achard et al. 2008).
2.1 Monitoring of gross deforestationCurrent technology can adequately measure
tropical deforestation at national level. Since the early 1990s, changes in forest area have been monitored from space with confidence (Achard et al. 2008). Some countries, for example Brazil and India, have had
2. Monitoring the areal extent of deforestation and forest degradation
Forestlands Countries can define forestlands according to the following three criteria: Minimum forest area: 0.05-1 ha.Potential to reach minimum height in maturity in situ of 2-5 m.Minimum tree crown cover (or equivalent stock level): 10-30%.
Deforestation Often characterised as the long-term or permanent conversion of land from forest to other non-forest uses, the UNFCCC defines deforestation as: ‘… the direct, human-induced conversion of forested land to non-forest land’.
Degradation No unique definition yet. The 2003 IPCC GPG* proposes 5 different potential definitions for degradation. The 2008 GOFC-GOLD sourcebook suggests defining degradation as: ‘a direct, human-induced, long-term loss (persisting for X years of more) or at least Y% of forest carbon stocks [and forest values] since time T and not qualifying as deforestation with X, Y and T to be determined.’
* IPCC Good Practice Guidelines
Table 1: Definitions (Source: adapted from Achard et al. 2008)
well-established operational systems in place for over a decade; others are developing these capabilities or have successfully monitored forests with aerial photographs that do not require sophisticated data analysis or computer resources (DeFries et al. 2007).
In essence, the choice among the variety of monitoring methods depends on the deforestation patch size (large-scale, small-scale), bio-geographic characteristics (seasonality of forests, relief and cloud coverage) and financial resources. Seasonality or cloud coverage, for example, requires deforestation assessments at multiple moments during the year to reduce the risk of false interpretations.
2.1.1 Methods for deforestation monitoringRemote sensing is the only practical method for
national-level deforestation monitoring (DeFries et al. 2007). The two most common approaches are wall-to-wall mapping and sampling.
Wall-to-wall mapping (where the entire •country or forest area is monitored) is a common approach and is conducted in Brazil and India. Sampling approaches are useful to reduce the •costs of data and analysis, and are especially suitable when deforestation is concentrated in some areas of a country or region.
Recommended sampling approaches include ‘systematic sampling’ (where samples are taken at a regular interval, e.g., every 10km) and ‘stratified sampling’ (where samples are determined by known proxy variables, e.g., deforestation hotspots) (Achard et al. 2008). Expert knowledge can also help determine sample sites (DeFries et al. 2007). A stratified sampling
8 M o n i t o r i n g f o r e s t e M i s s i o n s
approach, for example, used by the Brazilian monitoring system PRODES, identifies ‘critical areas’, using the previous year’s monitoring to prioritise analysis for the following year (INPE 2004).
But one approach does not exclude the other: a sampling approach in one reporting period can be extended to wall-to-wall coverage in the subsequent period; similarly, wall-to-wall mapping in one reporting period can be followed up by hotspot analysis (stratified sampling) in the subsequent period.
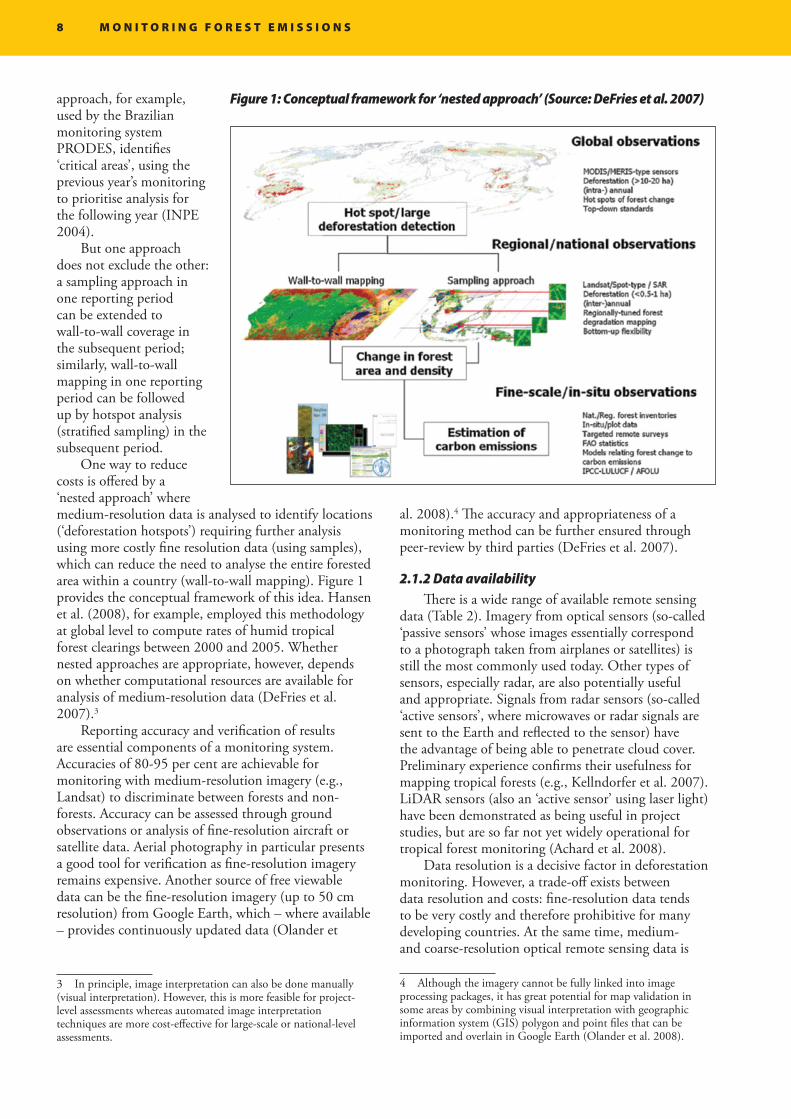
One way to reduce costs is offered by a ‘nested approach’ where medium-resolution data is analysed to identify locations (‘deforestation hotspots’) requiring further analysis using more costly fine resolution data (using samples), which can reduce the need to analyse the entire forested area within a country (wall-to-wall mapping). Figure 1 provides the conceptual framework of this idea. Hansen et al. (2008), for example, employed this methodology at global level to compute rates of humid tropical forest clearings between 2000 and 2005. Whether nested approaches are appropriate, however, depends on whether computational resources are available for analysis of medium-resolution data (DeFries et al. 2007).3
Reporting accuracy and verification of results are essential components of a monitoring system. Accuracies of 80-95 per cent are achievable for monitoring with medium-resolution imagery (e.g., Landsat) to discriminate between forests and non-forests. Accuracy can be assessed through ground observations or analysis of fine-resolution aircraft or satellite data. Aerial photography in particular presents a good tool for verification as fine-resolution imagery remains expensive. Another source of free viewable data can be the fine-resolution imagery (up to 50 cm resolution) from Google Earth, which – where available – provides continuously updated data (Olander et
3 In principle, image interpretation can also be done manually (visual interpretation). However, this is more feasible for project-level assessments whereas automated image interpretation techniques are more cost-effective for large-scale or national-level assessments.
Figure 1: Conceptual framework for ‘nested approach’ (Source: DeFries et al. 2007)
al. 2008).4 The accuracy and appropriateness of a monitoring method can be further ensured through peer-review by third parties (DeFries et al. 2007).
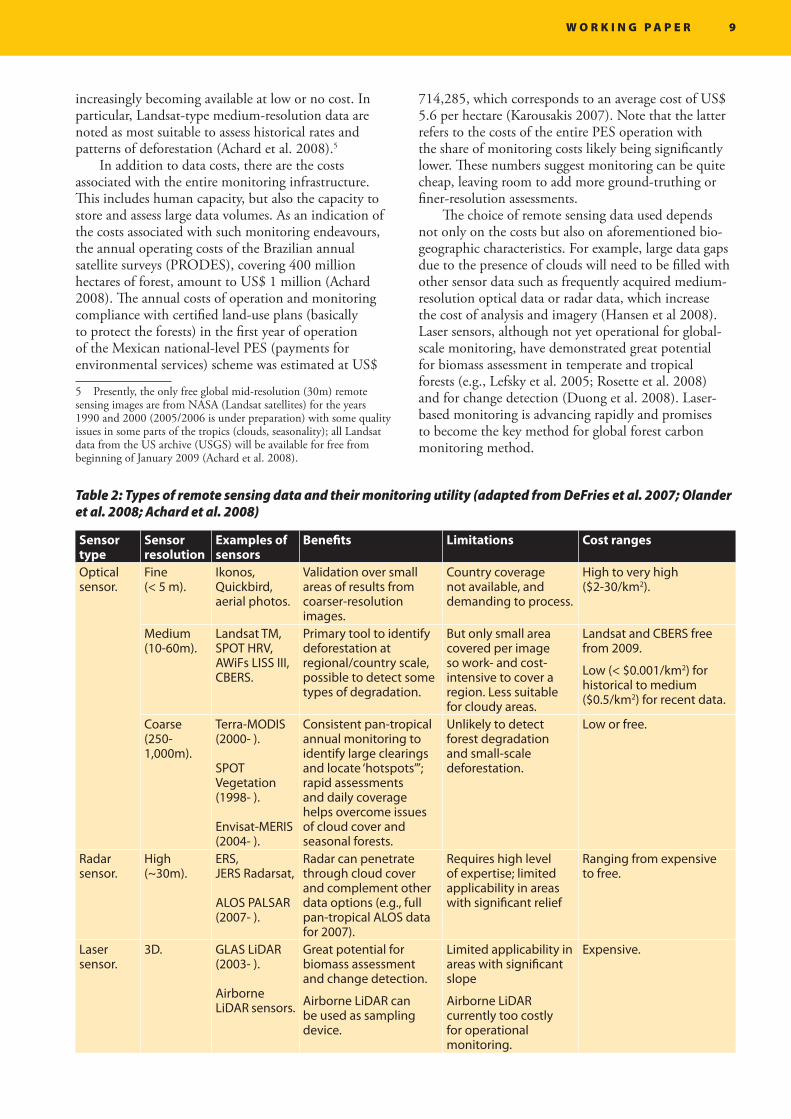
2.1.2 Data availabilityThere is a wide range of available remote sensing
data (Table 2). Imagery from optical sensors (so-called ‘passive sensors’ whose images essentially correspond to a photograph taken from airplanes or satellites) is still the most commonly used today. Other types of sensors, especially radar, are also potentially useful and appropriate. Signals from radar sensors (so-called ‘active sensors’, where microwaves or radar signals are sent to the Earth and reflected to the sensor) have the advantage of being able to penetrate cloud cover. Preliminary experience confirms their usefulness for mapping tropical forests (e.g., Kellndorfer et al. 2007). LiDAR sensors (also an ‘active sensor’ using laser light) have been demonstrated as being useful in project studies, but are so far not yet widely operational for tropical forest monitoring (Achard et al. 2008).
Data resolution is a decisive factor in deforestation monitoring. However, a trade-off exists between data resolution and costs: fine-resolution data tends to be very costly and therefore prohibitive for many developing countries. At the same time, medium- and coarse-resolution optical remote sensing data is
4 Although the imagery cannot be fully linked into image processing packages, it has great potential for map validation in some areas by combining visual interpretation with geographic information system (GIS) polygon and point files that can be imported and overlain in Google Earth (Olander et al. 2008).
w o r k i n g p a p e r 9
increasingly becoming available at low or no cost. In particular, Landsat-type medium-resolution data are noted as most suitable to assess historical rates and patterns of deforestation (Achard et al. 2008).5
In addition to data costs, there are the costs associated with the entire monitoring infrastructure. This includes human capacity, but also the capacity to store and assess large data volumes. As an indication of the costs associated with such monitoring endeavours, the annual operating costs of the Brazilian annual satellite surveys (PRODES), covering 400 million hectares of forest, amount to US$ 1 million (Achard 2008). The annual costs of operation and monitoring compliance with certified land-use plans (basically to protect the forests) in the first year of operation of the Mexican national-level PES (payments for environmental services) scheme was estimated at US$
5 Presently, the only free global mid-resolution (30m) remote sensing images are from NASA (Landsat satellites) for the years 1990 and 2000 (2005/2006 is under preparation) with some quality issues in some parts of the tropics (clouds, seasonality); all Landsat data from the US archive (USGS) will be available for free from beginning of January 2009 (Achard et al. 2008).
Sensor type
Sensor resolution
Examples of sensors
Benefits Limitations Cost ranges
Optical sensor.
Fine (< 5 m).
Ikonos, Quickbird, aerial photos.
Validation over small areas of results from coarser-resolution images.
Country coverage not available, and demanding to process.
High to very high ($2-30/km2).
Medium (10-60m).
Landsat TM, SPOT HRV, AWiFs LISS III, CBERS.
Primary tool to identify deforestation at regional/country scale, possible to detect some types of degradation.
But only small area covered per image so work- and cost-intensive to cover a region. Less suitable for cloudy areas.
Landsat and CBERS free from 2009.
Low (< $0.001/km2) for historical to medium ($0.5/km2) for recent data.
Coarse (250-1,000m).
Terra-MODIS (2000- ).
SPOT Vegetation (1998- ).
Envisat-MERIS (2004- ).
Consistent pan-tropical annual monitoring to identify large clearings and locate ‘hotspots”’; rapid assessments and daily coverage helps overcome issues of cloud cover and seasonal forests.
Unlikely to detect forest degradation and small-scale deforestation.
Low or free.
Radar sensor.
High (~30m).
ERS, JERS Radarsat,
ALOS PALSAR(2007- ).
Radar can penetrate through cloud cover and complement other data options (e.g., full pan-tropical ALOS data for 2007).
Requires high level of expertise; limited applicability in areas with significant relief
Ranging from expensive to free.
Laser sensor.
3D. GLAS LiDAR (2003- ).
Airborne LiDAR sensors.
Great potential for biomass assessment and change detection.
Airborne LiDAR can be used as sampling device.
Limited applicability in areas with significant slope
Airborne LiDAR currently too costly for operational monitoring.
Expensive.
Table 2: Types of remote sensing data and their monitoring utility (adapted from DeFries et al. 2007; Olander et al. 2008; Achard et al. 2008)
714,285, which corresponds to an average cost of US$ 5.6 per hectare (Karousakis 2007). Note that the latter refers to the costs of the entire PES operation with the share of monitoring costs likely being significantly lower. These numbers suggest monitoring can be quite cheap, leaving room to add more ground-truthing or finer-resolution assessments.
The choice of remote sensing data used depends not only on the costs but also on aforementioned bio-geographic characteristics. For example, large data gaps due to the presence of clouds will need to be filled with other sensor data such as frequently acquired medium-resolution optical data or radar data, which increase the cost of analysis and imagery (Hansen et al 2008). Laser sensors, although not yet operational for global-scale monitoring, have demonstrated great potential for biomass assessment in temperate and tropical forests (e.g., Lefsky et al. 2005; Rosette et al. 2008) and for change detection (Duong et al. 2008). Laser-based monitoring is advancing rapidly and promises to become the key method for global forest carbon monitoring method.
10 M o n i t o r i n g f o r e s t e M i s s i o n s
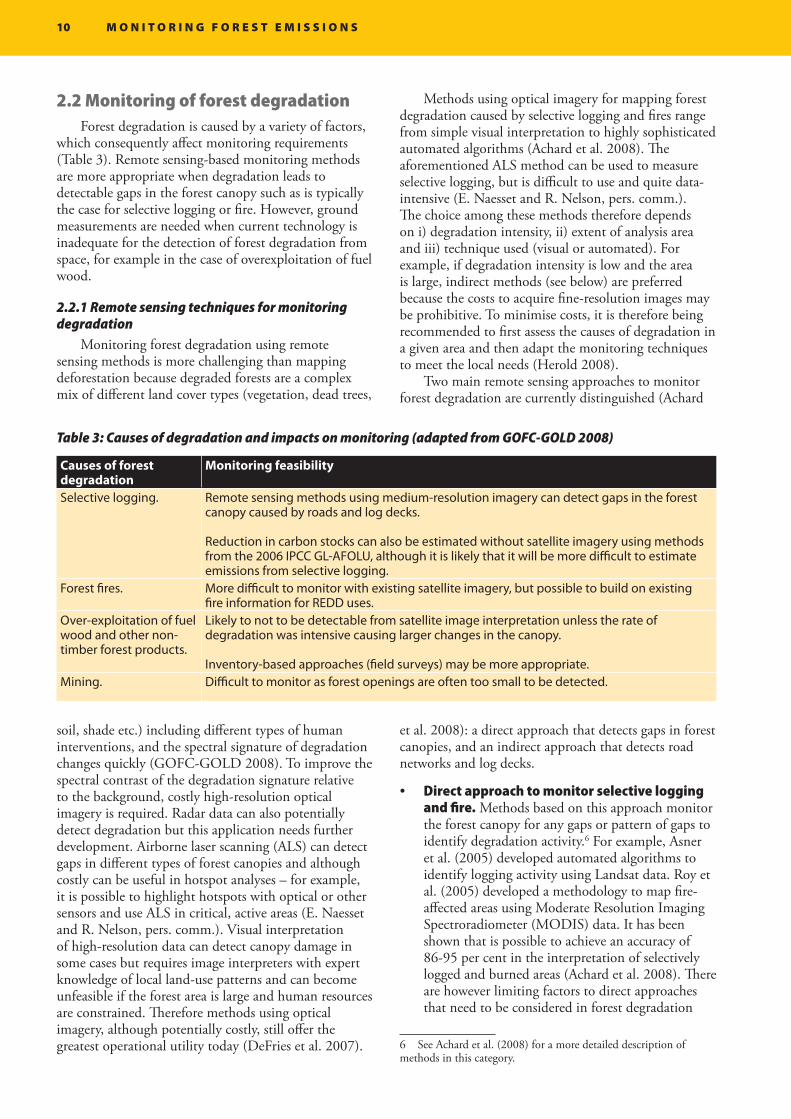
2.2 Monitoring of forest degradation Forest degradation is caused by a variety of factors,
which consequently affect monitoring requirements (Table 3). Remote sensing-based monitoring methods are more appropriate when degradation leads to detectable gaps in the forest canopy such as is typically the case for selective logging or fire. However, ground measurements are needed when current technology is inadequate for the detection of forest degradation from space, for example in the case of overexploitation of fuel wood.
2.2.1 Remote sensing techniques for monitoring degradation
Monitoring forest degradation using remote sensing methods is more challenging than mapping deforestation because degraded forests are a complex mix of different land cover types (vegetation, dead trees,
Causes of forest degradation
Monitoring feasibility
Selective logging. Remote sensing methods using medium-resolution imagery can detect gaps in the forest canopy caused by roads and log decks.
Reduction in carbon stocks can also be estimated without satellite imagery using methods from the 2006 IPCC GL-AFOLU, although it is likely that it will be more difficult to estimate emissions from selective logging.
Forest fires. More difficult to monitor with existing satellite imagery, but possible to build on existing fire information for REDD uses.
Over-exploitation of fuel wood and other non-timber forest products.
Likely to not to be detectable from satellite image interpretation unless the rate of degradation was intensive causing larger changes in the canopy.
Inventory-based approaches (field surveys) may be more appropriate. Mining. Difficult to monitor as forest openings are often too small to be detected.
Table 3: Causes of degradation and impacts on monitoring (adapted from GOFC-GOLD 2008)
Methods using optical imagery for mapping forest degradation caused by selective logging and fires range from simple visual interpretation to highly sophisticated automated algorithms (Achard et al. 2008). The aforementioned ALS method can be used to measure selective logging, but is difficult to use and quite data-intensive (E. Naesset and R. Nelson, pers. comm.). The choice among these methods therefore depends on i) degradation intensity, ii) extent of analysis area and iii) technique used (visual or automated). For example, if degradation intensity is low and the area is large, indirect methods (see below) are preferred because the costs to acquire fine-resolution images may be prohibitive. To minimise costs, it is therefore being recommended to first assess the causes of degradation in a given area and then adapt the monitoring techniques to meet the local needs (Herold 2008).
Two main remote sensing approaches to monitor forest degradation are currently distinguished (Achard
soil, shade etc.) including different types of human interventions, and the spectral signature of degradation changes quickly (GOFC-GOLD 2008). To improve the spectral contrast of the degradation signature relative to the background, costly high-resolution optical imagery is required. Radar data can also potentially detect degradation but this application needs further development. Airborne laser scanning (ALS) can detect gaps in different types of forest canopies and although costly can be useful in hotspot analyses – for example, it is possible to highlight hotspots with optical or other sensors and use ALS in critical, active areas (E. Naesset and R. Nelson, pers. comm.). Visual interpretation of high-resolution data can detect canopy damage in some cases but requires image interpreters with expert knowledge of local land-use patterns and can become unfeasible if the forest area is large and human resources are constrained. Therefore methods using optical imagery, although potentially costly, still offer the greatest operational utility today (DeFries et al. 2007).
et al. 2008): a direct approach that detects gaps in forest canopies, and an indirect approach that detects road networks and log decks.
Direct approach to monitor selective logging •and fire. Methods based on this approach monitor the forest canopy for any gaps or pattern of gaps to identify degradation activity.6 For example, Asner et al. (2005) developed automated algorithms to identify logging activity using Landsat data. Roy et al. (2005) developed a methodology to map fire-affected areas using Moderate Resolution Imaging Spectroradiometer (MODIS) data. It has been shown that is possible to achieve an accuracy of 86-95 per cent in the interpretation of selectively logged and burned areas (Achard et al. 2008). There are however limiting factors to direct approaches that need to be considered in forest degradation
6 See Achard et al. (2008) for a more detailed description of methods in this category.
w o r k i n g p a p e r 11
monitoring: first, because degradation signatures of logging and forest fires change quickly in high-resolution images, frequent or at least annual mapping is required. Second, the human-caused forest degradation signal can be confused with natural forest changes. Third, cloud coverage limits the applicability of optical sensors. Finally, the higher level of expertise necessary to use the most robust automated techniques requiring specialised software necessitate investments in capacity building (Achard et al. 2008).
Indirect approach to monitor forest •degradation. This approach classifies forestland into ‘intact forest’ (fully-stocked, undisturbed forest) and ‘non-intact forest’ (not fully-stocked, disturbed forests due to timber exploitation or canopy degradation) based on a combination of canopy cover and human impact criteria that can be defined depending on national circumstances (Achard et al. 2008; Mollicone et al. 2007).7 Forest degradation is defined as conversion of intact to
7 Achard et al. (2008) suggest that ‘intact forest’ be defined based on six criteria: i) situated within the forestland (according to current UNFCCC definitions) and with a 1km buffer zone inside the forest area, ii) larger than 1,000 ha, with a smallest width of 1 km, iii) containing a contiguous mosaic of natural ecosystems, iv) not fragmented by infrastructure, v) without signs of significant human transformation and vi) without burnt lands and young tree sites adjacent to infrastructure projects.
non-intact forest. Carbon emissions from forest degradation are estimated from two factors: the difference in carbon content between intact and non-intact forests, and the area loss of intact forest area during the accounting period. One weakness of this approach may consist in the accuracy of monitoring carbon stock changes since, for example, carbon differences between an intact to a slightly disturbed forests may be lower than going from a slightly to severely disturbed forest.
2.2.2 Ground-based degradation monitoringInventory-based approaches (field surveys) and
forest statistics (i.e., logging concessions and harvest estimates) also exist, but are more likely to be adapted to project-level assessments. This is because large-scale monitoring using ground measurements can be very costly. Ground measurements can also be useful complements to verify results obtained from remote sensing approaches and have the advantage that they can collect additional data relevant to carbon stock measurements (see next section). Skutsch (2007), for example, describes how local stakeholders (communities) can be involved effectively in conducting ground-level surveys. Thus although ground-based monitoring of degradation is hardly feasible for large-scale assessments, they can be particularly useful at project-level.
12 M o n i t o r i n g f o r e s t e M i s s i o n s
Estimating aboveground forest biomass is the most critical step in quantifying carbon stocks and fluxes from tropical forests (Gibbs et al. 2007). This is because the carbon stored in the aboveground living biomass of trees is typically the largest pool and the most directly impacted by deforestation and degradation. However, it is also critical to consider soil carbon stock estimation for some regions, such as Southeast Asia’s peat-swamp forests, where soils are a massive source of carbon emissions following deforestation (Hooijer et al. 2006; Page et al. 2002).
No methodology can yet directly measure forest carbon stocks across a landscape (Gibbs et al. 2007). The IPCC guidelines present three general approaches for estimating emissions/removals of greenhouse gases; these are known as ‘tiers’ and range from 1 to 3 representing increasing levels of data requirements and analytical complexity. Despite differences among the tiers, all have in common their adherence to IPCC good practice concepts of transparency, completeness, consistency, comparability and accuracy.
In the context of REDD, ‘good’ estimates of carbon stocks means that they have low uncertainty and do not overestimate the true value (Pearson et al. 2008). In practice, however, current REDD measurements tend to combine high quality remotely sensed areal estimates for deforestation and degradation with generalised carbon numbers obtained from look-up tables and the literature (Gibbs et al. 2007). Such a combination of data with unequal certainties would jeopardise all the effort required to put in place precise and accurate monitoring of gross deforestation, as the certainty of the final estimate will only be as good as the ‘least best’ uncertainty value. Thus substantial effort will need to be invested in the production of consistent carbon estimates for alternative forests types and forest uses.
Current approaches to estimate forest carbon stocks in tropical countries can be categorised into three groups (Gibbs et al. 2007): biome averages, forest inventories, and remote sensing measurements. Table 4 summarises the benefits and limitations for each method.
3.1 Global estimates of forest carbon stocks: the biome-average approach
Biome averages basically refer to look-up tables of reference carbon stock values for specific biomes or regions. They base on two main sources of information, i.e., tree harvest measurement data and forest inventory data. They have the advantage of being freely and immediately available, and currently provide the only
source of globally consistent forest carbon information.8 For these reasons, and despite the uncertainties, biome averages continue to be the most routinely used source of forest carbon stock data (and also as a starting point for calculating emissions from deforestation and degradation following IPCC Tier 1 method). Disadvantages of biome averages include their limited representativeness due to sample selection shortcomings (analysed plots do not adequately represent biome or region; measurements are limited to mature stands only) and the difficulty in assessing the uncertainty and accuracy of the source data (Gibbs et al. 2007).
3.2 Ground-based forest inventory dataGround-based measurements are based on field
surveys (particularly of ‘diameter at breast height’ or DBH), which along with, or in combination with, tree height can be converted to estimates of forest carbon stocks using allometric relationships (statistical procedures to relate forest attributes to harvest measurements) that exist for most forests (Gibbs et al. 2007). However, ground-measurements can be costly and therefore are more cost-effective for project-level or sample site assessments.
Data for developing allometric relationships can originate from sample sites or forest inventories (Gibbs et al. 2007):
Using data from sample sites. • Sampling approaches typically consist of country- or region-specific sampling designed for broad forest categories (sampling strata). Gibbs et al. (2007) recommend the development of a ‘stratification matrix’ for each country or region using broad forest types and forest conditions (e.g., drainage, slope, age, and level of degradation). Such stratification can increase accuracy and precision and reduce costs (Pearson et al. 2008). Focusing first on using stratification to estimate carbon stocks for forests most likely to be deforested or degraded can further reduce uncertainty and cost (Brown 2008).Using data from forest inventories.• This is often tempting because many countries have already conducted at least one inventory. However, very few developing countries have comprehensive national inventories, and very often the data refers to commercial trees only (DeFries et al. 2007). Existing forest inventory data can also be used
8 Gibbs et al. (2007) provide a compilation of biome-average carbon stock estimates from prominent data sources, which present the only estimates of country-level forest carbon stocks to date.
3. estimating tropical forest carbon stocks
w o r k i n g p a p e r 13
to extrapolate across a country or region using empirical-statistical methods to compensate for imperfect sampling design (Gibbs et al. 2007). So derived maps of forest carbon stocks exist for example for Africa and Southeast Asia (Gibbs and Brown 2007a, 2007b) and the Amazon basin (Saatchi et al. 2007).
3.3 Remote sensing techniques for measuring aboveground biomass
Currently available remote sensing technology cannot provide a level of data coverage and precision matching the accuracy requirements of REDD for carbon stock monitoring (E. Naesset and R. Nelson, pers. comm.). Although forest carbon stocks can be
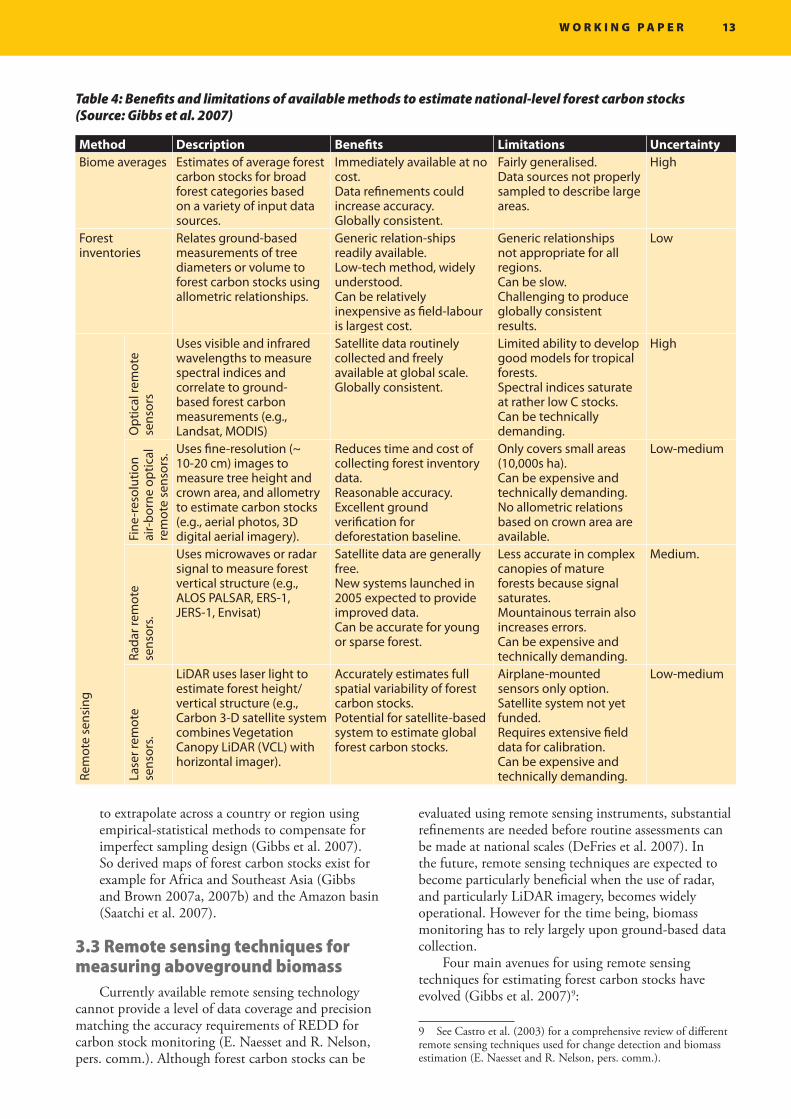
Method Description Benefits Limitations UncertaintyBiome averages Estimates of average forest
carbon stocks for broad forest categories based on a variety of input data sources.
Immediately available at no cost.Data refinements could increase accuracy.Globally consistent.
Fairly generalised.Data sources not properly sampled to describe large areas.
High
Forest inventories
Relates ground-based measurements of tree diameters or volume to forest carbon stocks using allometric relationships.
Generic relation-ships readily available.Low-tech method, widely understood.Can be relatively inexpensive as field-labour is largest cost.
Generic relationships not appropriate for all regions.Can be slow.Challenging to produce globally consistent results.
Low
Rem
ote
sens
ing
Opt
ical
rem
ote
sens
ors
Uses visible and infrared wavelengths to measure spectral indices and correlate to ground-based forest carbon measurements (e.g., Landsat, MODIS)
Satellite data routinely collected and freely available at global scale.Globally consistent.
Limited ability to develop good models for tropical forests.Spectral indices saturate at rather low C stocks.Can be technically demanding.
High
Fine
-res
olut
ion
air-
born
e op
tical
re
mot
e se
nsor
s.
Uses fine-resolution (~ 10-20 cm) images to measure tree height and crown area, and allometry to estimate carbon stocks (e.g., aerial photos, 3D digital aerial imagery).
Reduces time and cost of collecting forest inventory data.Reasonable accuracy.Excellent ground verification for deforestation baseline.
Only covers small areas (10,000s ha).Can be expensive and technically demanding.No allometric relations based on crown area are available.
Low-medium
Rada
r rem
ote
sens
ors.
Uses microwaves or radar signal to measure forest vertical structure (e.g., ALOS PALSAR, ERS-1, JERS-1, Envisat)
Satellite data are generally free.New systems launched in 2005 expected to provide improved data.Can be accurate for young or sparse forest.
Less accurate in complex canopies of mature forests because signal saturates.Mountainous terrain also increases errors.Can be expensive and technically demanding.
Medium.
Lase
r rem
ote
sens
ors.
LiDAR uses laser light to estimate forest height/vertical structure (e.g., Carbon 3-D satellite system combines Vegetation Canopy LiDAR (VCL) with horizontal imager).
Accurately estimates full spatial variability of forest carbon stocks.Potential for satellite-based system to estimate global forest carbon stocks.
Airplane-mounted sensors only option.Satellite system not yet funded.Requires extensive field data for calibration.Can be expensive and technically demanding.
Low-medium
Table 4: Benefits and limitations of available methods to estimate national-level forest carbon stocks (Source: Gibbs et al. 2007)
evaluated using remote sensing instruments, substantial refinements are needed before routine assessments can be made at national scales (DeFries et al. 2007). In the future, remote sensing techniques are expected to become particularly beneficial when the use of radar, and particularly LiDAR imagery, becomes widely operational. However for the time being, biomass monitoring has to rely largely upon ground-based data collection.
Four main avenues for using remote sensing techniques for estimating forest carbon stocks have evolved (Gibbs et al. 2007)9:
9 See Castro et al. (2003) for a comprehensive review of different remote sensing techniques used for change detection and biomass estimation (E. Naesset and R. Nelson, pers. comm.).
14 M o n i t o r i n g f o r e s t e M i s s i o n s
Optical remote sensing data.• Present optical satellite sensors cannot yet be used to estimate carbon stocks of tropical forests with certainty. Attempts to estimate carbon stocks indirectly by developing statistical relationships between ground-based measurements and satellite-observed vegetation indices have had limited success.Fine-resolution aerial imagery.• The spatial details of these data can be used to directly collect measurements of tree height and crown area or diameter. Allometric relationships can be applied to estimate forest carbon stocks with a high degree of certainty. Although the data are collected over relatively small areas, they could be used for inaccessible areas, in a sampling scheme or at project-level. Microwave or radar data. • Radar sensors can penetrate ground and cloud and thus detect the underlying terrain as well as the top of the canopy. The radar signals (both from ground and tree tops) are used to estimate tree height, which is then converted to forest carbon stock estimates using allometry. However, mountainous or hilly conditions increase errors, as do young and low biomass (degraded) forests. This is related to rapid saturation which renders radar less suitable for REDD monitoring.
LiDAR (light detection and ranging).• Based on laser light, these sensors can directly estimate the height and density structure of forests, which enables forest carbon stock estimation using allometric height-carbon relationships. LiDAR monitoring will allow for more accurate biomass measurements as optical and radar techniques tend to underestimate the biomass (E. Naesset and R. Nelson, pers. comm.). Although forest density is easily derived from LiDAR instruments, height measurements are more problematic in the tropics because tropical forests reach their maximum height quickly but continue to accumulate carbon for many decades. Still, large-footprint LiDAR remote sensing is considered to exceed the capabilities of radar and optical sensors for estimating carbon stocks for all forest types. To date, however, the application of the satellite-mounted LiDAR sensors in operation is limited and airplane-mounted instruments are too costly to be used for more than a small area. Carbon stock measurements from space could be improved substantially when satellite missions that include LiDAR instruments become a reality, e.g., NASA’s DESDynI launch planned for 2014, or the proposed – but not yet funded – ‘Carbon 3D’ mission (Hese et al. 2005).
w o r k i n g p a p e r 15
Combining measurements of changes in forest area with estimates of carbon stock densities enables estimation of emissions from deforestation or forest degradation over large regions, and with the updated version of the IPCC GPG-LULUCF, methods are available for estimating carbon emissions from deforestation at national and project scales (DeFries et al. 2007).
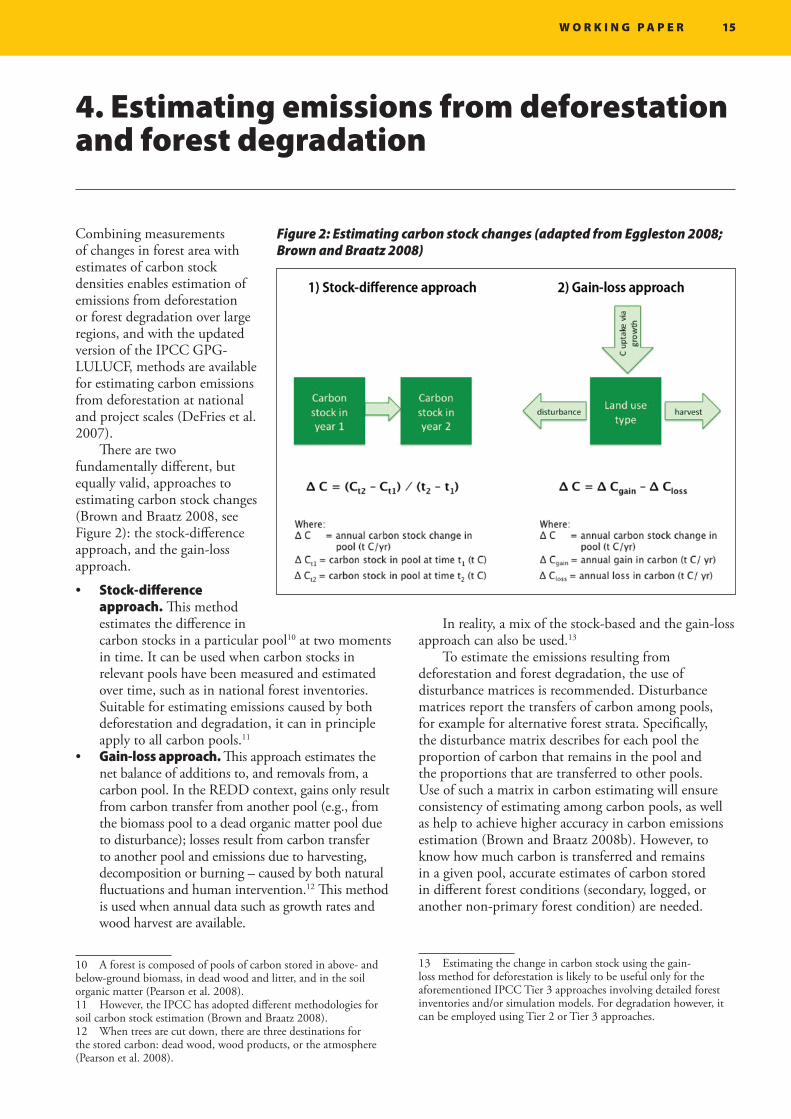
There are two fundamentally different, but equally valid, approaches to estimating carbon stock changes (Brown and Braatz 2008, see Figure 2): the stock-difference approach, and the gain-loss approach.
Stock-difference •approach. This method estimates the difference in carbon stocks in a particular pool10 at two moments in time. It can be used when carbon stocks in relevant pools have been measured and estimated over time, such as in national forest inventories. Suitable for estimating emissions caused by both deforestation and degradation, it can in principle apply to all carbon pools.11
Gain-loss approach. • This approach estimates the net balance of additions to, and removals from, a carbon pool. In the REDD context, gains only result from carbon transfer from another pool (e.g., from the biomass pool to a dead organic matter pool due to disturbance); losses result from carbon transfer to another pool and emissions due to harvesting, decomposition or burning – caused by both natural fluctuations and human intervention.12 This method is used when annual data such as growth rates and wood harvest are available.
10 A forest is composed of pools of carbon stored in above- and below-ground biomass, in dead wood and litter, and in the soil organic matter (Pearson et al. 2008).11 However, the IPCC has adopted different methodologies for soil carbon stock estimation (Brown and Braatz 2008).12 When trees are cut down, there are three destinations for the stored carbon: dead wood, wood products, or the atmosphere (Pearson et al. 2008).
In reality, a mix of the stock-based and the gain-loss approach can also be used.13
To estimate the emissions resulting from deforestation and forest degradation, the use of disturbance matrices is recommended. Disturbance matrices report the transfers of carbon among pools, for example for alternative forest strata. Specifically, the disturbance matrix describes for each pool the proportion of carbon that remains in the pool and the proportions that are transferred to other pools. Use of such a matrix in carbon estimating will ensure consistency of estimating among carbon pools, as well as help to achieve higher accuracy in carbon emissions estimation (Brown and Braatz 2008b). However, to know how much carbon is transferred and remains in a given pool, accurate estimates of carbon stored in different forest conditions (secondary, logged, or another non-primary forest condition) are needed.
13 Estimating the change in carbon stock using the gain-loss method for deforestation is likely to be useful only for the aforementioned IPCC Tier 3 approaches involving detailed forest inventories and/or simulation models. For degradation however, it can be employed using Tier 2 or Tier 3 approaches.
4. estimating emissions from deforestation and forest degradation
Figure 2: Estimating carbon stock changes (adapted from Eggleston 2008; Brown and Braatz 2008)
16 M o n i t o r i n g f o r e s t e M i s s i o n s
Monitoring is a central element in an international REDD scheme, not only to detect and credit future emission reductions, but also to establish credible baselines founded on historical trends. Today, multiple options exist to monitor deforestation, degradation and changes in forest carbon stocks. To increase cost-effectiveness, sampling and stratification techniques have been developed for both remote sensing and ground-based monitoring of deforestation, degradation and carbon stock assessments.
5.1 Ground-based measurements are indispensable
Remote sensing technology is especially appropriate for large-scale monitoring, particularly deforestation. Satellite-based estimates of forest carbon stocks are likely to become more accessible over the next decades as new technologies emerge and technical capacities are strengthened. Still, ground-based measurements are important, principally to monitor carbon stocks until the emergence of satellite-based estimates, but also to verify results obtained from image interpretation for deforestation and degradation mapping.
5.2 Build monitoring capacity at national and international level
Key constraints to monitoring in many developing countries – especially for the purpose of REDD – are access to data at a reasonable cost, and the technical infrastructure and capacity for consistent, transparent data analysis and management. Providing access to free or low-cost fine-resolution imagery is key, as is support to countries to set up national REDD monitoring infrastructures, including training of technicians. Regional partnerships for acquiring and developing appropriate methods, as proposed by DeFries et al. (2007), can also help address some of the needs. Sharing experiences from Annex I countries on their approaches to monitoring validating, and reporting changes in forest carbon stocks could be a further avenue to provide additional insights and assistance to developing countries. French Guiana, for example, is located in the tropics but is technically an Annex I country (as an overseas department of France, or DOM) and therefore subject to Annex I GHG inventories – other tropical countries could learn from the methods applied in French Guiana.
The establishment of an independent international forest carbon monitoring institution for REDD purposes could be another avenue to overcoming
remaining capacity shortcomings. Monitoring for carbon crediting purposes needs to be objective and reliable. Leaving this task to each REDD supplier country may create the incentive to biased monitoring (e.g., exaggerated emission reductions) to reap carbon benefits. Independent third party monitoring and certification, for example in the form of an international forest carbon monitoring institution, may therefore be a more suitable proposal. Centralising this task at global level can further benefit from economies of scales and render monitoring far more cost-effective than ensuring coherent monitoring by each country, and provide more coherent time-series of deforestation data for baseline purposes.
Capacity consists not only in the availability of technical equipment or costly satellite imagery, but also – and often more importantly - in knowhow. This refers to the expertise in data cleaning, data processing, data analysis and, ultimately, the use of resulting data in the political process. The latter implies that capacity-building needs to occur not only at the technical level (i.e., in the forest monitoring agency – whether national or international), but also at the political and institutional level. For example, policymakers need to have a minimum understanding how alternative changes in forest carbon affects the national REDD arrangements and how it interrelates with other sectoral policies.
5.3 Invest in data and methods for carbon stock measurements, especially LiDAR
Another constraint to monitoring emissions from deforestation and degradation is the currently limited knowledge of carbon stocks contained in alternative forest types and forest uses. Although default data and IPCC guidelines exist to ensure at least ‘conservative’ estimates, further effort is needed in spatially explicit forest carbon stock inventories.
Particularly promising for future forest carbon stock measurements are LiDAR sensors. However, due to the limited availability of large-scale LiDAR satellite imagery until at least 2015-1714, efforts need to be dedicated to making maximum use of currently available alternatives (ground-based measurements, GIS models to extrapolate sample data etc.) including the establishment of allometric relationships for alternative forest types and uses. This means that approximately
14 The NASA DESDynI mission is scheduled for 2014, but it is not expected to take its first measurements until the 2015-2017 timeframe (E. Naesset and R. Nelson, pers. comm.).
5. Concluding remarks
w o r k i n g p a p e r 17
10 years may pass before space LiDARs specifically designed for vegetation assessment are operational (E. Naesset and R. Nelson, pers. comm.).
The monitoring and verification requirements of REDD in terms of forest carbon change in tropical countries may induce further efforts and investments in LiDAR technology. The rising monitoring needs for REDD and the huge potential of LiDAR sensors call for greater incorporation of these considerations into their activities and investment portfolio. New investments could focus on promoting operational research for future LiDAR-based biomass monitoring at global level.
Sophisticated interim methods to monitor carbon stock changes for REDD crediting are also needed. These include the aforementioned optical sensors for wall-to-wall mapping and airborne laser scanners for hotspot analysis, but also ground-based measurements and the development of extensive forest carbon density look-up tables, with conservative values for alternative forest cover and forest uses. Thus, while remote sensing methods can be useful to a large extent, it seems evident that ground-based measurements will continue to play a major part in REDD monitoring.
18 M o n i t o r i n g f o r e s t e M i s s i o n s
Achard, F. (2008) ‘Deforestation in tropical countries: use of satellite remote sensing in detecting and monitoring forest area change’. Presentation at the UNFCCC Workshop on Methodological Issues relating to Reducing emissions from Deforestation and Forest Degradation in Developing Countries, Tokyo 25-27 June.
Achard, F., R. DeFries, M. Herold, D. Mollicone, D. Pandey and C. de Souza Jr. (2008) ‘Guidance on monitoring of gross changes in forest area’. Chapter 3 in GOFC-GOLD Reducing greenhouse gas emissions from deforestation and degradation in developing countries: a sourcebook of methods and procedures for monitoring, measuring and reporting. GOFC-GOLD Report version COP13-2. GOFC-GOLD Project Office, Natural Resources Canada, Alberta, Canada.
Asner, G.P., D.E. Knapp, E. Broadbent, P. Oliveira, M. Keller and J. Silva (2005) ‘Selective logging in the Brazilian Amazon’ in Science 310: 480-482.
BioCarbon Fund (2008) Methodology for estimating reductions of GHG emissions from mosaic deforestation (draft document). RED-NM-001/Version 01. 04 July 2008. Available online at: www.carbonfinance.org/biocarbon.
Brown, S. (2008) Assessment of the advantages and limitations of ground-based surveys and inventories. Presentation at the UNFCCC Workshop on Methodological Issues relating to Reducing emissions from Deforestation and Forest Degradation in Developing Countries, Tokyo 25-27 June.
Brown, S. B. and B. Braatz (2008) ‘Methods for estimating CO2 emissions from deforestation and forest degradation’. Chapter 5 in GOFC-GOLD Reducing greenhouse gas emissions from deforestation and degradation in developing countries: a sourcebook of methods and procedures for monitoring, measuring and reporting. GOFC-GOLD Report version COP13-2. GOFC-GOLD Project Office, Natural Resources Canada, Alberta, Canada.
Castro, K.L., G.A. Sánchez-Azofeifa and B. Rivard (2003) ‘Monitoring secondary tropical forests using space-borne data: implications for Central America’ IN International Journal of Remote Sensing 24: 1-27.
DeFries, R., F. Achard, S. Brown, M. Herold, D. Murdiyarso, B. Schlamadinger and C. de Souza Jr. (2007) Earth observations for estimating greenhouse gas emissions from deforestation in developing countries. Environmental Science & Policy 10:385-394.
Duong, V.H., R. Lindenbergh, N. Pfeifer and G. Vosselman (2008) ‘Single and two epoch analysis of ICESat full waveform data over forested areas’ in International Journal of Remote Sensing 29: 1453-1473.
Eggleston, S. (2008) ‘Overview of relevant methodologies in IPCC Guidelines and Good Practice Guidance’. Presentation at the UNFCCC Workshop on Methodological Issues relating to Reducing Emissions from Deforestation and Forest Degradation in Developing Countries. Tokyo, 24-27 June. Available Online at: http://unfccc.int/methods_and_science/lulucf/items/4289.php.
Gibbs, H.K., S. Brown, J.O. Niles and J.A. Foley (2007) Monitoring and estimating forest carbon stocks: making REDD a reality. Environmental Resource Letters 2. IOP Publishing Ltd., UK. Available online at: http://www.iop.org/EJ/article/1748-9326/2/4/045023/erl7_4_045023.html
Gibbs, H.K. and S. Brown (2007a) Geographical distribution of biomass carbon in tropical southeast Asian forests: an updated database for 2000. NDP-068. The Carbon Dioxide Information Center, Oak Ridge National Laboratory, Oak Ridge, TN, USA.
Gibbs, H.K. and S. Brown (2007b) Geographical distribution of woody biomass carbon stocks in tropical Africa: an updated database for 2000. NDP-055b. The Carbon Dioxide Information Center, Oak Ridge National Laboratory, Oak Ridge, TN, USA.
GOFC-GOLD (2008) Reducing greenhouse gas emissions from deforestation and degradation in developing countries: a sourcebook of methods and procedures for monitoring, measuring and reporting. GOFC-GOLD Report version COP13-2. GOFC-GOLD Project Office, Natural Resources Canada, Alberta, Canada.
Hansen, M.C., S.V. Stehman, P.V. Potapov, T.R. Loveland, J.R.G. Townshend, R.S. DeFries, K.W. Pittman, B. Arunarwati, F. Stolle, M.K. Steininger, M. Carroll and C. DiMiceli (2008) ‘Humid tropical forest clearing from 2000 to 2005 quantified by using multitemporal and multiresolution remotely sensed data’ in PNAS 105(27): 9439-9444. Available online at: http://www.pnas.org/content/105/27/9439.full
Herold, M. (2008) ‘Building national forest carbon monitoring capabilities for REDD’. Presentation at the UNFCCC workshop on Methodological Issues Relating to Reducing Emissions from Deforestation and Forest Degradation in Developing Countries. Tokyo 24-27 June. Available online at: http://unfccc.int/methods_and_science/lulucf/items/4289.php.
Hese, S, W. Lucht, C. Schmullius, M. Bransley, R. Dubayah, D. Knorr, K. Neumann, T. Riedel and K. Schröter. (2005) ‘Global biomass mapping for an improved understanding of the CO2 balance—the Earth observation mission carbon-3D’ in Remote Sensing of Environment. 94: 94–104.
references
w o r k i n g p a p e r 19
Hooijer, A., M. Silvius, H. Wösten and S. Page (2006) PEAT-CO2, Assessment of CO2 emissions from drained peatlands in SE Asia. Delft Hydraulics report Q3943 (2006).
INPE (National Institute for Space Research) (2004) Monitoramento ambiental da Amazonia por satelite. Brazilian Institute for Space Research. Available online at: http://www.obt.inpe.br/prodes/.
IPCC (2003) Good Practice Guidance for Land Use, Land-Use Change and Forestry (GPG-LULUCF). Available online at: http://www.ipcc-nggip.iges.or.jp/public/gpglulucf/gpglulucf.html
IPPC (2006) Guidelines for National Greenhouse Gas Inventories. Volume 4 Agriculture, Forestry and Other Land Use (GL-AFOLU). Available online at: http://www.ipcc-nggip.iges.or.jp/public/2006gl/vol4.html
Karousakis, K. (2007) Incentives to reduce GHG emissions from deforestation: Lessons learned from Costa Rica and Mexico. Unclassified paper (COM/ENV/EPOC/IEA/SLT (2007)1. OECD. Paris.
Kellndorfer, J., M. Shimada, A. Rosenqvist, W. Walker, K. Kirsch, D. Nepstad, N. Laporte, C. Stickler and P. Lefebvre (2007) New eyes in the sky: cloud-free tropical forest monitoring for REDD with the Japanese Advanced Land Observing Satellite (ALOS). The Woods Hole Research Center. Falmouth, MA, USA.
Lefsky, M.A., D.J. Harding, M. Keller, W.B. Cohen, C.C. Carabajal, F. Del Bom Espirito-Santo, M.O. Hunter and R. de Oliveira Jr. (2005) ‘Estimates of forest canopy height and aboveground biomass using ICESat’ in Geophysical Research Letters 32.L22S02, doi: 10.1029/2005GL023971.
Mollicone, D., F. Achard, S. Federici, H.D. Eva, G. Grassi, A. Belward, F. Raes, G. Seufert, H.J. Stibig, G. Matteucci and E.D. Schulze (2007) ‘An incentive mechanism for reducing emissions from conversion of intact to non-intact forests’ in Climate Change 83:477-493.
Olander, L.P., H.K. Gibbs, M. Steininger, J.J. Swenson and B.C. Murray (2008) Reference scenarios for deforestation and forest degradation in support of REDD: a review of data and methods. Environmental Resource Letters 3. IOP Publishing Ltd., UK. Available online at: http://www.iop.org/EJ/article/1748-9326/3/2/025011/erl8_2_025011.html
Page, S.E., F. Siegert, J. O. Rieley, H.D.V. Boehm, A. Jaya and S. Limin (2002) ‘The amount of carbon
released from peat and forest fires in Indonesia during 1997’ in Nature 420: 61-65.
Pearson, T., N. Harris, D. Shoch, D. Pandey and S. Brown (2008) ‘Estimation of carbon stocks’. Chapter 4 in GOFC-GOLD. Reducing greenhouse gas emissions from deforestation and degradation in developing countries: a sourcebook of methods and procedures for monitoring, measuring and reporting. GOFC-GOLD Report version COP13-2. GOFC-GOLD Project Office, Natural Resources Canada, Alberta, Canada.
Rogner, H-H., D. Zhou, R. Bradley. P. Crabbé, O. Edenhofer, B. Hare (Australia), L. Kuijpers and M. Yamaguchi (2007) ‘Introduction’ in Metz, B., O.R. Davidson, P.R. Bosch, R. Dave and L.A. Meyer (eds) Climate Change 2007: Mitigation. Contribution of Working Group III to the Fourth Assessment Report of the Intergovernmental Panel on Climate Change. Cambridge University Press, Cambridge, United Kingdom and New York, NY, USA.
Rosette, J.A.B., P.R.J. North and J.C. Suarez (2008) ‘Vegetation height estimates for a mixed temperate forest using satellite laser altimetry’ in Int. Journal of Remote Sensing 29: 1475-1493.
Roy, D.P., Y. Jin, P.E. Lewis and C.O. Justice (2005) ‘Prototyping a global algorithm for systematic fire-affected area mapping using MODIS time-series data’ in Remote Sensing of Environment 97: 137-162.
Saatchi, S., R.A. Houghton, R.C. dos Santos, F. Avala, J. Soares and Y. Yu (2007) ‘Distribution of aboveground biomass in the Amazon Basin’ in Global Change Biology 13:816-837.
Skutsch, M. (2007) In REDD, the second D is for degradation. Policy note from the Kyoto: Think Global, Act Local (K:TGAL) programme. Available to download from: http://www.communitycarbonforestry.org/
Stern, N. (2006) The Stern Review: The Economics of Climate Change. Cambridge University Press. Cambridge, UK.
UNFCCC (2001) COP-7: The Marrakech Accords. UNFCCC Secretariat, Bonn, Germany. Available to download at: http://unfccc.int/cop7/documents/accords_draft.pdf
VCS (2007) Voluntary Carbon Standard – Guidance for Agriculture, Forestry and Other Land Uses. Available to download at: http://www.v-c-s.org/docs/AFOLU%20Guidance%20Document.pdf


W O R K I N G P A P E R
Monitoring forest emissionsA review of methods
Sheila Wertz-Kanounniko�
CIFOR
Center for International Forestry Research (CIFOR)
CIFOR advances human wellbeing, environmental conservation, and equity by conducting
research to inform policies and practices that a�ect forests in developing countries.
CIFOR is one of 15 centres within the Consultative Group on International Agricultural
Research (CGIAR). CIFOR’s headquarters are in Bogor, Indonesia. It also has o�ces in Asia,
Africa and South America. CIFOR works in over 30 countries worldwide and has links with
researchers in 50 international, regional and national organisations.
To request a copy of this publication, please contact [email protected]
www.cifor.cgiar.org
CIFORInternationalInstitute for
Environment andDevelopment