Embed Size (px)
Citation preview

Biogeosciences, 10, 4577–4589, 2013www.biogeosciences.net/10/4577/2013/doi:10.5194/bg-10-4577-2013© Author(s) 2013. CC Attribution 3.0 License.
EGU Journal Logos (RGB)
Advances in Geosciences
Open A
ccess
Natural Hazards and Earth System
Sciences
Open A
ccess
Annales Geophysicae
Open A
ccess
Nonlinear Processes in Geophysics
Open A
ccess
Atmospheric Chemistry
and Physics
Open A
ccess
Atmospheric Chemistry
and Physics
Open A
ccess
Discussions
Atmospheric Measurement
Techniques
Open A
ccess
Atmospheric Measurement
Techniques
Open A
ccess
Discussions
Biogeosciences
Open A
ccess
Open A
ccess
BiogeosciencesDiscussions
Climate of the Past
Open A
ccess
Open A
ccess
Climate of the Past
Discussions
Earth System Dynamics
Open A
ccess
Open A
ccess
Earth System Dynamics
Discussions
GeoscientificInstrumentation
Methods andData Systems
Open A
ccess
GeoscientificInstrumentation
Methods andData Systems
Open A
ccess
Discussions
GeoscientificModel Development
Open A
ccess
Open A
ccess
GeoscientificModel Development
Discussions
Hydrology and Earth System
Sciences
Open A
ccess
Hydrology and Earth System
Sciences
Open A
ccess
Discussions
Ocean Science
Open A
ccess
Open A
ccess
Ocean ScienceDiscussions
Solid Earth
Open A
ccess
Open A
ccess
Solid EarthDiscussions
The Cryosphere
Open A
ccess
Open A
ccess
The CryosphereDiscussions
Natural Hazards and Earth System
SciencesO
pen Access
Discussions
Ammonia emissions from deciduous forest after leaf fall
K. Hansen1, L. L. Sørensen2, O. Hertel1,2, C. Geels2, C. A. Skjøth3,4,*, B. Jensen2, and E. Boegh1
1Department of Environmental, Social and Spatial Change, Roskilde University, Roskilde, Denmark2Department of Environmental Science, Aarhus University, Roskilde, Denmark3Department of Physical Geography and Ecosystems Science, Lund University, Lund, Sweden4National Pollen and Aerobiology Research Unit, Charles Darwin Building, University of Worcester, Henwick Grove,Worcester, WR2 6AJ, UK* formerly at: Department of Environmental Science, Aarhus University, Roskilde, Denmark
Correspondence to:K. Hansen ([email protected])
Received: 9 July 2012 – Published in Biogeosciences Discuss.: 7 November 2012Revised: 21 May 2013 – Accepted: 7 June 2013 – Published: 9 July 2013
Abstract. The understanding of biochemical feedback mech-anisms in the climate system is lacking knowledge in re-lation to bi-directional ammonia (NH3) exchange betweennatural ecosystems and the atmosphere. We therefore studythe atmospheric NH3 fluxes during a 25-day period duringautumn 2010 (21 October to 15 November) for the Dan-ish beech forest Lille Bøgeskov to address the hypothesisthat NH3 emissions occur from deciduous forests in rela-tion to leaf fall. This is accomplished by using observa-tions of vegetation status, NH3 fluxes and model calcula-tions. Vegetation status was observed using plant area index(PAI) and leaf area index (LAI). NH3 fluxes were measuredusing the relaxed eddy accumulation (REA) method. TheREA-based NH3 concentrations were compared to NH3 de-nuder measurements. Model calculations of the atmosphericNH3 concentration were obtained with the Danish Ammo-nia MOdelling System (DAMOS). The relative contribu-tion from the forest components to the atmospheric NH3flux was assessed using a simple two-layer bi-directionalcanopy compensation point model. A total of 57.7 % of thefluxes measured showed emission and 19.5 % showed de-position. A clear tendency of the flux going from deposi-tion of −0.25± 0.30 µg NH3-N m−2 s−1 to emission of upto 0.67± 0.28 µg NH3-N m−2 s−1 throughout the measure-ment period was found. In the leaf fall period (23 October to8 November), an increase in the atmospheric NH3 concentra-tions was related to the increasing forest NH3 flux. Followingleaf fall, the magnitude and temporal structure of the mea-sured NH3 emission fluxes could be adequately reproducedwith the bi-directional resistance model; it suggested the for-
est ground layer (soil and litter) to be the main contributingcomponent to the NH3 emissions. The modelled concentra-tion from DAMOS fits well the measured concentrations be-fore leaf fall, but during and after leaf fall, the modelled con-centrations are too low. The results indicate that the missingcontribution to atmospheric NH3 concentration from vegeta-tive surfaces related to leaf fall are of a relatively large mag-nitude. We therefore conclude that emissions from deciduousforests are important to include in model calculations of at-mospheric NH3 for forest ecosystems. Finally, diurnal vari-ations in the measured NH3 concentrations were related tometeorological conditions, forest phenology and the spatialdistribution of local anthropogenic NH3 sources. This sug-gests that an accurate description of ammonia fluxes overforest ecosystems requires a dynamic description of atmo-spheric and vegetation processes.
1 Introduction
Atmospheric ammonia (NH3) plays an important role in airquality and critical load studies of natural and semi-naturalecosystems. NH3 is a reactive nitrogen compound (Nr),which contributes to the formation of ammonium aerosols(NH+
4 ) through atmospheric chemical reactions (Hertel et al.,2012) and is leading to deposition to terrestrial and marineecosystems (de Leeuw et al., 2003; Duce et al., 2008; Mas-sad et al., 2010; Zhang et al., 2010). An enhanced load of Nrin terrestrial ecosystems can increase the rate of acidificationand eutrophication processes and thereby reduce biodiversity
Published by Copernicus Publications on behalf of the European Geosciences Union.

4578 K. Hansen et al.: Ammonia emissions from deciduous forest after leaf fall
and increase ecosystem vulnerability to extreme weather andinsect attacks (Bobbink et al., 2010; Erisman et al., 2007;Stevens et al., 2004; Sutton et al., 2011; Xiankai et al., 2008).In nutrient-limited ecosystems, nitrogen deposition can alsowork to increase the C-sequestration and growth of vegeta-tion (de Vries et al., 2009).
Budgets of atmospheric NH3 for water and land areas arebeing carried out using atmospheric models (e.g. Bartnickiet al., 2011; de Leeuw et al., 2003; Geels et al., 2012a; Her-tel et al., 2003; Langner et al., 2009). Model calculations in-dicate that particular forest ecosystems are exposed to criti-cal load exceedances of nitrogen (Geels et al., 2012b; Her-tel et al., 2013). Generally the understanding of major bio-chemical feedback mechanisms in the terrestrial climate sys-tem suffers from large uncertainties (Arneth et al., 2010) andlacking knowledge of the bi-directional (two-way) NH3 ex-change between the land/water surface and the atmosphere(Massad et al., 2010). Because natural NH3 emissions havebeen assessed to a rather limited extent (Massad et al., 2010;Nemitz et al., 2001), they are not yet included in operationalair pollution models (Menut and Bessagnet, 2010).
Limited field studies have shown that the deposition ve-locity of NH3 for forests is relatively high and variable (An-dersen et al., 1999; Duyzer et al., 1994; Wyers et al., 1992)and thereby complicates the understanding of forest NH3 ex-change processes and makes model validation difficult. Highdeposition velocities for forests were simulated by four in-ferential models used across European sites, but large dif-ferences (up to factor 3) were found between model results(Flechard et al., 2011).
Sources of atmospheric NH3 are conceptually consideredto be anthropogenic (e.g. Gyldenkærne et al., 2005; Hertelet al., 2012) and primarily related to agricultural activities(e.g. Bouwman et al., 1997; Reis et al., 2009). In Europe,agricultural emissions arise from farm buildings (34–43 %),manure (22–26 %), fertilisers (17–26 %) and grazing ani-mals (6–10 %) (Skjøth and Geels, 2013). Open water areas(e.g. Barrett, 1998; Sorensen et al., 2003) and natural landareas (e.g. Duyzer et al., 1994) have also been shown to emitNH3. NH3 emissions from forests are generally not includedin official emission inventories (Reis et al., 2009) or themore detailed national inventories (Gyldenkærne et al., 2005;Velthof et al., 2012). However, NH3 flux studies of forests in-dicate bi-directional flux patterns for NH3 (Andersen et al.,1999; Erisman and Wyers, 1993; Sutton et al., 1997; Wyersand Erisman, 1998). Emissions of NH3 from ecosystems arefound to take place when the atmospheric NH3 concentrationis lower than the stomatal NH3 compensation point (WichinkKruit et al., 2007; Mattsson et al., 2009; Schjoerring et al.,1998), from decomposing leaf litter (David et al., 2009; Ne-mitz et al., 2000a), and by cuticular desorption (Pryor et al.,2001). Furthermore, Wang et al. (2011) discovered a seasonaldependence of the NH3 compensation points of beech leavesand found largest emission potential in relation to the latesenescent leaves. The effects of leaf NH3 emissions in rela-
Fig. 1. Plant area index (PAI) and leaf area index (LAI) of LilleBøgeskov for autumn 2010. Open circles show the LAI-2000 mea-surements of PAI with the standard deviations indicated by the er-ror bars. Daily values of PAI (solid line) and of LAI (dotted line) arefound from linear interpolation. The grey rectangular area shows theammonia (NH3) measurement period (21 October to 15 November).
tion to leaf fall still remain to be quantified, particularly atcanopy scale.
The main objective of this paper was to assess the NH3flux FNH3 for a Danish deciduous forest in the leaf senes-cence period using high-resolution atmospheric measure-ments and local-scale concentration-deposition modelling.We investigate the hypothesis that NH3 emissions occur fromdeciduous forests in relation to leaf fall by correlating thiswith NH3 emissions and explore the importance of includ-ing such emissions in models. To do this, half-hourly mea-surements of the NH3 concentration and flux were conductedusing therelaxed eddy accumulation(REA) technique for aDanish beech forest site in the leaf fall period 21 Octoberto 15 November 2010 (Fig. 1). The measured concentrationswere compared to model calculations using the Danish Am-monia MOdelling System (DAMOS), and a simple two-layerbi-directional canopy compensation point model was used tointerpret the measured fluxes.
2 Methods
2.1 Field site
The field station (Lille Bøgeskov) is located in the centralpart of Zealand (55◦29′13′′ N, 11◦38′45′′ E) with a surround-ing landscape characterised primarily by agricultural activi-ties. Lille Bøgeskov covers approximately 2.5 km2 with thefield station located in the centre of the forest. The field sta-tion includes a flux tower (57 m) and a scaffolding tower(24 m) (Fig. 2).
Biogeosciences, 10, 4577–4589, 2013 www.biogeosciences.net/10/4577/2013/

K. Hansen et al.: Ammonia emissions from deciduous forest after leaf fall 4579
The forest consists predominantly of 82 yr-old beech trees(Fagus sylvatica)with an average canopy height of 26 m.Scattered stands of conifers constitute about 20 % of the for-est area. The mean summer peak of LAI has been measuredto be 4.6 since year 2000 with maximum LAI just above 5(Pilegaard et al., 2011). In 2010, defoliation was observed tobegin on 23 October and leaf fall to end on 8 November.
The soils are brown and consist of Alfisols and Mollisols.Dead plant material consisting mainly of leaves and twigsfrom the beech trees constitutes the top 0–3 cm. Below is a10–40 cm deep organic layer. In the upper organic soil layers,the C / N ratio is about 20 and the pH is low (4–5) (Østergard,2000).
2.2 Leaf area index
In order to relate the atmospheric data to forest canopy de-velopment, the plant area index (PAI) was measured duringthe growing season (May–November) every 14–30 days us-ing the LAI-2000 Plant Canopy Analyzer with a 270◦ viewcap (LAI-2000 PCA). PAI was estimated using one above-canopy reading and 10 below-canopy readings conductedalong an 18 m transect. The above-canopy readings were per-formed outside the forest edge. Measurements were madeduring uniformly overcast sky conditions, as recommendedby the manufacturer. In order to assess the leaf area index(LAI), observations of leaf defoliation were used to adjustthe PAI data by linear interpolation to zero LAI at the timewhen there were no more green leaves present in the canopy.The end of the defoliation and leaf fall periods were deter-mined from daily digital photos of the canopy using a cam-era mounted on top of the tower. The uncertainty of mea-surements was calculated as the standard deviation of the 10below-canopy readings.
2.3 Local meteorological measurements
The wind components in x-, y- and z-directions were mea-sured at 10 Hz sampling using an ultra-sonic anemome-ter (Metek-uSonic-3 Scientific) installed above the forestcanopy at 34 m height (Fig. 2). Half-hourly averaged valuesof wind velocity, wind direction, friction velocity, tempera-ture, and Monin–Obukhov length were calculated from the10 Hz sampling. Precipitation, relative humidity, soil tem-perature, soil water content, and global radiation were ob-tained from the European Fluxes Database Cluster (www.europe-fluxdata.eu) as described in Pilegaard et al. (2011).
2.4 Ammonia flux measurements
2.4.1 Relaxed eddy accumulation (REA)
The vertical turbulence-driven flux of NH3 (FNH3) wasestimated using the REA technique (Businger and On-cley, 1990). REA simplifies the eddy accumulation methods(Hicks and Mcmillen, 1984), where the sampling speed must
Fig. 2. Instrumental setup in Lille Bøgeskov for atmospheric am-monia (NH3) measurements. A flux tower (57 m) is equipped with asonic anemometer (34 m) to measure micro-meteorological param-eters, two wet effluent diffusion denuders (WEDDs) for the relaxededdy accumulation (REA) system (33 m) and seven glass denuders(29.8 m) to measure atmospheric NH3. The REA analysing systemis located at the top floor of a scaffolding tower (24 m).
be proportional to the vertical wind velocity, by relaxing thesampling at a constant flow rate (Businger and Oncley, 1990).REA combines measurements of the vertical momentum fluxand the difference between the average trace gas concentra-tion of upward and downward moving eddies.
A system to measure canopy-scaleFNH3 (µg NH3-N m−2 s−1) based on the REA technique was installed in theflux tower at the forest field station (Fig. 2) in the periodfrom 21 October to 15 November 2010. Two short breaksoccurred due to technical work on the instruments. The sys-tem consisted of three parts: (1) a sonic anemometer measur-ing vertical wind speed, (2) an inlet system, and (3) an an-alytical detection system (Fig. 3) to detect the concentrationsignals. The sonic anemometer was located in the mast at aheight of 34 m to control the conditional sampling of atmo-spheric NH3 in the up- and downdrafts respectively. The in-let system, comprised by twowet effluent diffusion denuders(WEDDs), was located just below the sonic anemometer at33 m. The WEDDs collected atmospheric NH3 from upwardand downward eddies separately by diffusion into a waterfilm (Hensen et al., 2009). The aqueous NH3 solution fromthe two WEDDs was pumped with a constant flow directlyto the analytical detection system which was located at thetop floor of a scaffolding tower. A fluorescent compound wasproduced by mixingo-phthaldialdehyde (OPA), sulphite, andthe aqueous NH3 solution (Sorensen et al., 1994). The liquidwas heated to 60◦C to enhance the formation of the fluo-rescent compound before injection into the fluorescence de-tector. Detailed information of the WEDD and the analytical
www.biogeosciences.net/10/4577/2013/ Biogeosciences, 10, 4577–4589, 2013

4580 K. Hansen et al.: Ammonia emissions from deciduous forest after leaf fall
system can be found in Sorensen et al. (1994). To preventfreezing of the fluent when air temperature was near freezingpoint, the water was mixed with ethanol. The analytical sys-tem was calibrated using standard calibration fluids of 0, 10and 25 ppb NH+4 . Half-hourly estimates ofFNH3 were calcu-lated from Eq. (1):
F = β σw (χ ↑ −χ ↓) , (1)
whereχ ↑ andχ ↓ are the average NH3 concentration in theup- and downdrafts respectively,σw is the standard deviationof the vertical wind velocityw′, andβ is a coefficient to bedetermined by the probability distribution ofw. Theβ coef-ficient is well defined for an ideal Gaussian joint frequencydistribution ofw andχ . However, turbulent transport, espe-cially over very rough surfaces, often violates the underlyingassumption of a linear relationship betweenw andχ (Rup-pert et al., 2006); thus the use of aβ0 coefficient determinedfrom a proxy scalar (such as the sensible heat flux) better re-flects the correctβ coefficient for a certain measurement pe-riod. A dynamic deadband was introduced as a threshold forpartitioningχ ↑ andχ ↓ (Businger and Oncley, 1990) wheresampling only took place when the vertical wind velocity ex-ceeded a predefined deadband velocityw0. Theβ-coefficienthas to be corrected for the choice of deadband velocity:
β = β0exp−0.75· w0
σw
, (2)
wherew0 is the dynamic deadband (set to 0.5σw m s−1 in thisstudy; Hensen et al., 2009),β0 is the coefficient whenw0 = 0,andβ0 was calculated based on the sensible heat flux:
β0 =w
′T
′
σw · (T ↑ −T ↓), (3)
wherew′T
′ is the sensible heat flux, andT ↑ andT ↓ rep-resent temperatures when the fluctuating component ofw isdirected upward and downward respectively. According tothe theoretical principles of the REA method,β0 is ∼ 0.6for a smooth surface. However, Gao (1995) foundβ0 to de-crease when measuring close to tall canopies, and Ren etal. (2011) experimentally determinedβ0 to ∼ 0.42± 0.02.Therefore, if the calculatedβ0 is less that 0.2 or larger than0.6, thenβ0 = 0.4 was used following the value found by Renet al. (2011).
The measurement uncertainty of NH3 concentration wasestimated from the relative uncertainty, based on the meanvalue of three calibration campaigns conducted during themeasurement period. For each calibration, concentration liq-uids of 0, 10 and 25 ppb were used, and the detection limitwas estimated. A few measurements on 25 October werefound to be lower than the estimated detection limit and ex-cluded from further analysis. The reliability of theFNH3 mea-surements was assessed by comparing the atmospheric NH3concentration measurements from the REA system (cRNH3)
with concentration measurements performed using diffusiondenuders (cdNH3).
2.5 Flux partitioning
The contribution to the atmospheric NH3 flux from the stom-atal, cuticular and ground in the forest was assessed by sim-ulating the forest component fluxesFs, Fw andFg (µg NH3-N m−2 s−1) using a simple two-layer bi-directional canopycompensation point biosphere–atmosphere modelling ap-proach (Nemitz er al., 2001). The model includes a NH3stomatal compensation point and allows NH3 emissions fromthe ground layer caused by e.g. soil emissions or litter de-composition. The NH3 canopy compensation pointχc andthe component fluxes are calculated as (Nemitz et al., 2001)
χc =χa (RaRb)
−1+χs(RaRs)
−1+ (RbRs)
−1+
(RgRs
)−1+χFg
(RbRg
)−1
(RaRb)−1
+ (RaRs)−1
+ (RaRw)−1+
(RbRg
)−1+ (RbRs)
−1+ (RbRw)−1
+(RgRs
)−1+
(RgRw
)−1, (4)
Fs = −χc − χs
Rs, (5)
Fw = −χc
Rw, (6)
Fg = −χ(c)−χg
Rg, (7)
where χs and χg are the stomatal and ground compensa-tion points (µg NH3-N m−3). Ra, Rb, Rs,Rw andRg are theaerodynamic, boundary layer, stomatal, cuticular, and groundresistances (s m−1), respectively. The total forest fluxFt(µg NH3-N m−2 s−1) is calculated as the sum of the threecomponent fluxes. The leaf physiological parameters suchas apoplast pH and NH+4 concentration are normally used tocalculate the stomatal emission potential0s [NH+
4 /H+] andthe stomatal compensation pointχs, and for this purpose avalue for0s of 250 found by Wang et al. (2011) in the latesenescent period for the forest was used. The ground layeremission potential0g [NH+
4 /H+] was fitted toFg (Eq. 7). Itwas found that, after leaf fall, a constant0gvalue of 80 000reproduces the measured net flux reasonably well. It shouldbe noted however thatRg is calculated as the sum of anin-canopy resistanceRac and a ground boundary layer re-sistanceRbg that are parameterised for agricultural cropsand free-water surfaces, respectively. Uncertainties regard-ing these parameterisations therefore exist when applied to aforest ecosystem.
2.6 Denuder measurement
Atmospheric NH3 concentrationcdNH3 (µg NH3-N m−3) at29.8 m height (Fig. 2) was sampled using seven 15 cm-long glass diffusion denuders (Ferm, 1979) for the period26 October to 11 November. The denuders were coatedwith a solution of citric acid in methanol which effectivelycaptures NH3. Air was pumped through the denuders at300 mL min−1. Chemical analyses of denuders were per-formed using ion chromatography. The uncertainty of mea-surements was estimated as the standard deviation of the
Biogeosciences, 10, 4577–4589, 2013 www.biogeosciences.net/10/4577/2013/

K. Hansen et al.: Ammonia emissions from deciduous forest after leaf fall 4581
three denuders, and the detection limit was calculated as3 times the standard deviation of the unexposed denuders(blank) to be 0.003 µg NH3-N m−3, following the methodused by Andersen et al. (1999).
2.7 Model calculations using DAMOS
The atmospheric NH3 deposition and concentration (cmNH3)
was modelled using the DAMOS system (Geels et al.,2012b). DAMOS is a combination of the regional-scaleDEHM model (Brandt et al., 2012; Christensen, 1997) andthe local-scale Gaussian dispersion/deposition model OML-DEP (Sommer et al., 2009). DEHM includes a detailed NH3emission model (Gyldenkærne et al., 2005; Skjøth et al.,2004, 2011) and provided in this study the wet NH3 depo-sition and upwind boundary conditions for the local-scaleOML-DEP model. OML-DEP was used to simulate atmo-spheric NH3 concentrations and deposition rates using a one-way dry deposition scheme (Simpson et al., 2003), a highspatial resolution (100 m) land cover (Nielsen et al., 2000)and local field NH3 emissions (Gyldenkærne et al., 2005;Skjøth et al., 2004). Estimates of field emissions consideredthe annual animal production in each agricultural building,and the location of buildings and storage facilities were rep-resented by their geographical coordinates (Fig. 4). Temporalchanges of emissions due to variable meteorological condi-tions, particularly air temperature and length of local grow-ing season, were also taken into account (Skjøth et al., 2011,2004). OML-DEP provided hourly simulations throughoutthe measurement period for 40× 40 receptor points in a16 km× 16 km grid. The flux tower was located in the centreof the modelling domain. A full description of DAMOS canbe found in Geels et al. (2012b) and Hertel et al. (2013).
3 Results
3.1 Meteorological and soil observations
The meteorological and soil conditions in the flux measure-ment period (21 October to 15 November 2010) are pre-sented in Fig. 5. A series of frontal passages characterisedthe environmental conditions which caused winds to primar-ily originate from the west and southwest although inter-rupted by shorter periods of northerly winds between the1/2 November and 8/9 November (Fig. 5a). The friction ve-locity varied mainly between 0 and 1 m s−1; however, duringthe period 3–14 November, three episodes withu∗ larger than1 m s−1 were observed with wind speeds of up to 8 m s−1
(Fig. 5b). The period with westerly winds was characterisedby near-neutral situations, while the shorter periods withmore northerly winds had episodes with either stable or un-stable conditions (Fig. 5f). Observed temperatures remainedin the range 5–14◦C until 7 November, after which temper-atures decreased and stabilised at 2–5◦C during the rest ofthe period (Fig. 5d). The same pattern was seen in soil tem-
31
1
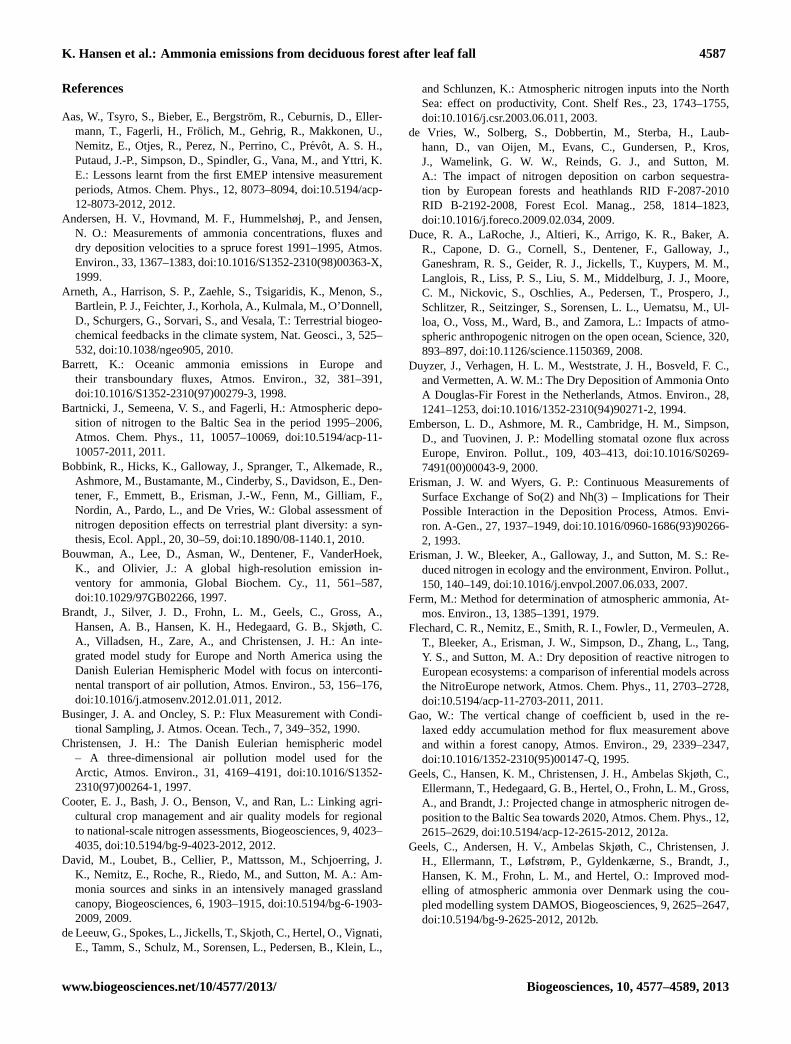
Figure 3. Schematic overview of the relaxed eddy accumulation (REA) analysing system for 2
NH3 flux measurements. The path of the liquid mixture of NH3 and H2O through the Wet 3
Effluent Diffusion Denuders (WEDDs) (one for updraft eddies of air and one for downdrafts) 4
is indicated with the blue line, the mixing with the chemical reagents o-phthaldialdehyde 5
(OPA) and sulphite with the red line, the path through the de-bubbler with green and finally 6
through the heating coiler and fluorescence detector with yellow. 7
8
Fig. 3. Schematic overview of the relaxed eddy accumulation(REA) analysing system for NH3 flux measurements. The path ofthe liquid mixture of NH3 and H2O through the wet effluent dif-fusion denuders (WEDDs) (one for updraft eddies of air and onefor downdrafts) is indicated with the blue line, the mixing withthe chemical reagentso-phthaldialdehyde (OPA) and sulphite withthe red line, the path through the de-bubbler with green and finallythrough the heating coiler and fluorescence detector with yellow.
perature, which decreased from 9 to 5◦C during the period(Fig. 5e). The period 21 October to 7 November had episodeswith a few mm of rain almost every day (Fig. 5g), whichled to high soil water content and high relative air humidity(Fig. 5i and h). It did not rain from 8 to 14 November.
3.2 High-resolution ammonia fluxes
Figure 6b shows the measured NH3 fluxes.FNH3 varied from−0.25± 0.30 µg NH3-N m−2 s−1 in the beginning of themeasurement period to 0.67± 0.28 µg NH3-N m−2 s−1 in theend of the period. The mean flux was 0.06± 0.17 µg NH3-N m−2 s−1 (Table 1). A clear tendency ofFNH3 going fromnegative (deposition) to positive (emission) fluxes was seenthroughout the measurement period. Even though estimateswere related to large uncertainties (0.006–0.344 µg NH3-N m−2 s−1), the occurrence of emissions was convincing.Comparing LAI andFNH3 during leaf fall showed a grad-ual increase ofFNH3 from negative to positive fluxes follow-ing defoliation (Fig. 6a and b). When defoliation ended (LAIreached zero) on 23 October, the deposition decreased to-wards zero (non-existent flux). In the leaf fall period (23 Oc-tober to 8 November),FNH3 gradually turned to positivefluxes, and a peak NH3 emission of 0.50 µg NH3-N m−2 s−1
was reached on 3 November. Following leaf fall,FNH3 stayedpositive and three emission peaks (8/9, 10 and 12 November)of up to 0.67± 0.28 µg NH3-N m−2 s−1 were observed.
www.biogeosciences.net/10/4577/2013/ Biogeosciences, 10, 4577–4589, 2013

4582 K. Hansen et al.: Ammonia emissions from deciduous forest after leaf fall
Fig. 4. NH3 emissions (kg NH3-N yr−1) from point sources in 2008 (data are described in Sect. 2.6). The flux tower is marked with awhite star in Lille Bøgeskov (the green scratched area). The concentration roses show measured concentration using REA (upper) andmodelled concentration using DAMOS (lower) related to measured and simulated wind direction, respectively. Red colours indicate thehighest assessed concentrations and blue indicate lowest concentrations.
Table 1.Statistics of the atmospheric ammonia (NH3) flux measuredFNH3above Lille Bøgeskov using relaxed eddy accumulation in 33 mand simulated using the two-layer bi-directional modelFt in the period 21 October to 15 November 2010.
Mean Min Max Stdev(µg NH3-N m−2 s−1) (µg NH3-N m−2 s−1) (µg NH3-N m−2 s−1) (µg NH3-N m−2 s−1)
FNH3 0.06 −0.25 0.67 0.15Ft 0.07 −0.03 0.47 0.11
Fig. 5. Meteorological and soil measurements of(a) wind direc-tion [◦], (b) friction velocity [m s−1], (c) global radiation [W m−2],(d) temperature [◦ C], (e)soil temperature [◦C], (f) atmospheric sta-bility (z L−1), (g) precipitation [mm],(h) relative humidity [%] and(i) soil water content [% vol] for Lille Bøgeskov during the period21 October to 15 November.
3.3 Stomatal, cuticular and ground NH3 fluxes
In Fig. 7 the forest component fluxesFs, Fw, Fg and the totalflux Ft simulated using the bi-directional NH3 compensationpoint model are illustrated together with the measured fluxFNH3. The dimensionless ratio0g [NH+
4 /H+] was fitted toFgand set to 300 before 30 October and to 80 000 in the follow-ing period. A ratio of 80 000 for0g is extremely high, but stillin the range of what has previously been found for fertilisedgrassland (Sutton et al., 2009). The bi-directional model wasable to reproduce the temporal variations in the NH3 emis-sions following 30 October but underestimated the deposi-tion fluxes by on average 75 % (minimum= 6.27 % and max-imum= 99.89 %) before 30 October. Following 30 October,the simulated ground flux comprises most of the total flux(142 %), whereas stomatal and cuticular fluxes represent only0.9 % and 41 % respectively.
3.4 Observed ammonia concentrations
Atmospheric NH3 concentrations measured by the REAsystem (cRNH3) varied from less than 0.03 to 2 µg NH3-N m−3 in the measurement period (Fig. 6b). The meancRNH3 was 0.56± 0.35 µg NH3-N m−3, and the detection
Biogeosciences, 10, 4577–4589, 2013 www.biogeosciences.net/10/4577/2013/

K. Hansen et al.: Ammonia emissions from deciduous forest after leaf fall 4583
limit was found to be 0.03 µg NH3-N m−3. From 26 Octoberto 11 November, the meancRNH3 was 0.68± 0.35 µg NH3-N m−3, and the mean concentration obtained from denudermeasurements (cdNH3) was 0.67± 0.05 µg NH3-N m−3 andabove the detection limit (Table 2). A clear diurnal patternwas seen incRNH3 particularly in the beginning of the mea-surement period, which indicated increasingcRNH3 at nightand decreasingcRNH3 during daytime (Fig. 6b). The con-centration roses (Fig. 4) indicate that the dominating con-tribution of atmospheric NH3 originated from the southwest,where many smaller point sources were located, but the high-est concentrations were related to northwesterly wind direc-tions, where two NH3 point sources were located at the forestedge. Relatively low concentrations were seen when wind di-rections were from the northeast, where only few NH3 emis-sion sources were located (Fig. 4).
3.5 Simulated ammonia concentration using DAMOS
Mean three-hourly modelled atmospheric concentrations byDAMOS (cmNH3) for the entire period (Fig. 6b) varied be-tween 0.03± 0.015 and 2.51± 1.255 µg NH3-N m−3, andmean cmNH3 was 0.50± 0.25 µg NH3-N m−3 (Table 2). Itshould be noted that the emission signal from the Danisharea includes only point sources (stables and storage) as dif-fuse sources from agricultural areas are inactive in the period1 October to 1 February due to Danish legislations on fertili-sation management. This legislation on actual farming prac-tice is dynamically incorporated in the NH3 emission model.Apart from five to six peaks exceeding 1 µg NH3-N m−3, thesimulated level ofcmNH3 remained between 0 and 1 µg NH3-N m−3, and no decreasing or increasing trends were observedfor the period. ThecmNH3 peaks exceeding 1 µg NH3-N m−3
(Fig. 6b) were related mainly to contributions from localpoint sources located in the southwestern sector (Fig. 4) andto difficulties of the model in handling low friction velocitiesand changes in atmospheric stability.
4 Discussion
Despite the different measurement heights of REA (33 m)and the denuders (29.8 m), the mean atmospheric NH3 con-centration measured for the period 26 October to 11 Novem-ber 2010 are in good agreement, i.e. 0.68± 0.35 (REA)and 0.67± 0.05 (Denuder), and the simulated concentrationsare also in a comparable range, i.e. 0.56± 0.28 µg NH3-N(DAMOS) (Table 2). Even though we compare atmosphericmeasurements of NH3 concentration from two different mea-surement systems installed at two different heights separatedby 3.2 m (cRNH3 in 33 m andcdNH3 in 29.8 m), we expect thatthe measured concentrations are comparable due to the rel-atively high standard deviation on the concentrations mea-sured by the REA system. Furthermore, the concentrationsassessed are comparable with measurements for forests in
Fig. 6. Lille Bøgeskov in the period 21 October to 15 November2010.(a) Half-hourly mean NH3 fluxes (black dots) measured usingREA at 33 m height, leaf area index (LAI) (dashed line) and plantarea index (PAI) (solid line). Grey shadings indicate the measure-ment uncertainty of the NH3 flux measurements.(b) Half-hourlymean NH3 concentrations (black dots) measured using REA andthree-hourly mean NH3 concentrations modelled using DAMOS(blue line). Shadings indicate the measurement uncertainty andmodel uncertainties.
other Danish and US studies (Andersen et al., 1999; Pryoret al., 2001). Many studies have reported that forests gener-ally act as efficient sinks taking up the atmospheric NH3 (i.e.Erisman and Wyers, 1993; Duyzer et al., 1994). In this studywhere leaf absorption of NH3 is almost non-existent due toleaf fall, 57.7 % of the measured fluxes indicated emissionsand 19.5 % indicated depositions. The atmospheric ammo-nia flux measurements show a temporal correlation with thecanopy’s vegetation development (Fig. 6a and b), suggestingthat FNH3 decreases as LAI decreases, and that NH3 emis-sions occur in the leaf fall period. Apart from decomposi-tion of litter, also natural emissions of NH3 linked to the leafstomatal compensation point may cause NH3 emissions toincrease in the senescent period (Wang et al., 2011, 2013).However such processes are not yet taken into account inthe DAMOS system, and thus impacts of forest NH3 emis-sions are not represented in thecNH3 model calculations. Therelations between the NH3 fluxes and the vegetation statusare discussed in the following along with the model perfor-mance.
4.1 LAI and NH 3 fluxes in the leaf fall period
Before 30 October, the measuredcRNH3 was less than0.5 µg NH3-N m−3, and during the leaf fall period
www.biogeosciences.net/10/4577/2013/ Biogeosciences, 10, 4577–4589, 2013

4584 K. Hansen et al.: Ammonia emissions from deciduous forest after leaf fall
Table 2. Statistics of the atmospheric ammonia (NH3) concentration conducted using the relaxed eddy accumulation (REA) measurementtechnique (33 m) (cRNH3), denuder measurements (29.8 m) (cdNH3) and the DAMOS model (cmNH3) for Lille Bøgeskov in the period26 October to 11 November 2010.
Mean Min Max Stdev(µg NH3-N m−3) (µg NH3-N m−3) (µg NH3-N m−3) (µg NH3-N m−3)
cRNH3 (REA) 0.68 0 1.98 0.40cdNH3 (Denuder) 0.67 – – –cmNH3 (DAMOS) 0.56 0.03 2.51 0.45
Fig. 7. Simulations of the forest component half-hourly fluxes inLille Bøgeskov in the period 21 October to 15 November 2010. Blueshading shows cuticular flux(Fw), brown shading shows groundflux
(Fg
), green shading shows stomatal flux(Fs), grey shading
shows the total flux(F t = Fw +Fg+Fs), and the open circles witherror bars indicate the measured fluxFNH3 and the measurementuncertainty.
(23 October to 8 November) a clear increase in thecRNH3
was seen (Fig. 6b). After 30 October, thecRNH3 level was typ-ically higher than the mean (0.56± 0.35 µg NH3-N m−3) forthe measurement period. This increase was found to be re-lated to the increasing forest NH3 flux that was observed af-ter 2 November (Fig. 6a). The modelled concentrationcmNH3
did not show such an increase in the same period, indicat-ing that a natural source, the forest, was causing the increasein cRNH3. As defoliation ended,FNH3 turned positive andchanged from showing net deposition to net emissions ofNH3 following the leaf fall period. The increased emissionscould be due to a combination of increased litter emissionsand decreased leaf absorption, but also to changes in the tur-bulent transfer above the canopy related to the leaf fall. Dur-ing and after the leaf all period, four evident NH3 emissionpeaks (on 2–4, 8/9, 10/11 and 12–14 November) occurred(Fig. 6a), and clear relations to the friction velocity (Fig. 5b)are seen for all four peak emissions, indicating that the turbu-
lent flow above the forest canopy controls a large part of theemission flux. Other than the friction velocity, no clear con-trol pattern of other environmental or climatic conditions isseen that can explain the emission events. However, as pre-cipitation occurred during most of the period (Fig. 5g), theemissions can also be caused by volatilisation of NH3 frommoist soil and wet leaves, as suggested by Pryor et al. (2001).The emissions found on 2–4 November and 12–14 Novem-ber were related to precipitation events followed by dry pe-riods with relatively high air temperatures. Such conditionsenhance the decomposition process of plant material andmay explain the emissions on these occasions. Such condi-tions were not present on 8/9 November and 10/11 Novem-ber, when peak emissions were also measured. Studies basedon dynamic chamber techniques and within-canopy profilemeasurements of the NH3 flux have reported NH3 emis-sions from intensively managed ecosystems, and suggest re-emission from senescent leaves and decomposition of leaflitter to be a strong source of NH3 emissions, particularly inhumid conditions (David et al., 2009; Nemitz et al., 2000a).The emission potential for senescent leaves or leaf litter ofgrassland was studied in the GRAMINAE Integrated Experi-ment (Sutton et al., 2009) and reported by David et al. (2009),who found that the emission potential was a hundred timeslarger than that of green leaves, and that emissions werelarger when the litter was moisturised than when dry. Soilconditions such as temperature, moisture, pH, and nitrogencontent have also been found to be controlling factors for theNH3 emissions (Riedo et al., 2002; Roelle and Aneja, 2002;Walker et al., 2013), however, not as crucial as the leaf litter.Despite the low pH of the soils in Lille Bøgeskov, the condi-tions for decomposition are relatively good, and volatilisationof NH3 due to the microbiological breakdown of organic ma-terial could occur. However, we are aware that the observedNH3 emissions are measured during relatively low air andsoil temperatures (below 10◦C) that slow down the decom-position processes.
The forest component fluxes from the bi-directional NH3compensation point model indicated high emission fluxesfrom the ground layer following 30 October correlated tothe atmospheric NH3 emissions. The decreased depositionin the senescence period could also be caused by reducedleaf uptake of NH3 through stomata, decreased cuticular
Biogeosciences, 10, 4577–4589, 2013 www.biogeosciences.net/10/4577/2013/

K. Hansen et al.: Ammonia emissions from deciduous forest after leaf fall 4585
desorption and larger NH3 emission potential of the senes-cent leaves related to remobilisation of nitrogen during leafsenescence (Wang et al., 2011, 2013). The bi-directionalmodel showed a slightly decreased cuticular fluxFw (Fig. 7)during senescence (21/30 October), however, no significanteffect of stomatal control of the NH3 flux. The model un-derestimated the deposition flux by on average 75 % be-fore 30 October and suggested cuticular deposition to bethe controlling process, while the stomatal flux was nearlynon-existent (emissions up to 0.003 µg NH3-N m−2 s−1). As-suming that the maximum possible flux permitted by turbu-lent transport can be calculated asFMax = −cNH3/Ra, themeasured deposition flux in the period 21–30 October ismuch larger thanFMax. However, theFMax parameterisa-tion is based on the assumptions of horizontal and verticalhomogeneity, and no chemical reactions must occur withinthe gradient. It has earlier been found that these assumptionswere violated for NH3 exchange between surfaces and theatmosphere (Sorensen et al., 2003; Duyzer et al., 1994). Fur-thermore, due to the uncertainty of the measurements in theperiod 21–30 October (±0.14 µg NH3-N m−2 s−1), the depo-sition flux measured could just as well be less thanFMax.
Following leaf fall, the magnitude and temporal structureof the measured NH3 emission fluxes could be adequately re-produced with the bi-directional resistance model. The mag-nitude was achieved by using a0g value of 80 000 followingleaf fall, which is in the range of values found for senesc-ing plant material (e.g. Sutton et al., 2009), but larger thanmeasurements of the litter emission potential established byWang et al. (2011) during the previous autumn. In the ab-sence of in-canopy turbulence measurements, the parameter-isation of the in-canopy transport resistance is poorly con-strained. Any scaling error in this resistance would result ina similar scaling error of0g. Because a constant value of0gis used after leaf fall, the temporal variability in the modelresult is dominated by the variability in u∗, on which the pa-rameterisation of in-canopy resistance is based. The resultsdemonstrate that the emissions are consistent with a sourceinside the canopy, the connection of which to the atmosphereis regulated by turbulence. A minor fraction of the NH3 emit-ted from the leaf litter at ground level is predicted to be re-captured by the surfaces of the tree canopy(Fw), and thisfraction decreases as the PAI decreases. The model underes-timates the net flux on 10 November and overestimates theflux on 13/14 November. The first period is at the end of adrying period and during very low turbulence when convec-tive processes contribute to in-canopy transport that wouldbe underestimated by au∗-based parameterisation. Alterna-tively, the re-establishment of good agreement on 12 Novem-ber follows a precipitation event, and this might indicate thata secondary effect of moisture on the mineralisation and thusemission rate further modulates the emission of the groundsurface.
4.2 OML-DEP model results
The simulated NH3 concentration level in the senescentperiod fitted well the measured concentrations, but themodelled concentrations were too low following leaf fall(Fig. 6b). On 10 November the measuredcRNH3 increasedrapidly up to 1.98 µg NH3-N m−3, caused by the forest NH3emission, while the modelledcmNH3 showed two narrowpeaks that were related to changes in the atmospheric sta-bility from the meteorological input to the model.cRNH3 wastwice the magnitude ofcmNH3 in this period, indicating thatthe missing contribution tocNH3 from the forest is of a rela-tively large magnitude and therefore important to study andalso include in model calculations.
Inadequate descriptions of surface properties such as aero-dynamic roughness, stomatal resistance and processes re-lated to the bi-directionality of atmospheric NH3 fluxesrepresent uncertainties in current biosphere–atmosphere ex-change modelling of NH3 (Simpson et al., 2011). The com-plex mechanisms controlling these exchange processes causecurrent model parameterisations of biological and chemicalpathways and processes to be empirical and based on few ex-isting datasets (Flechard et al., 2011; Menut and Bessagnet,2010; Pouliot et al., 2012). In DAMOS, the deposition is cal-culated for various land use categories and the surface resis-tance is divided into stomatal and non-stomatal components.For NH3 the non-stomatal component includes, among otherthings, an acidity ratio between SO2 and NH3 (Emberson etal., 2000; Simpson et al., 2003), while a stomatal compen-sation point is not included. Many on-going studies exploremethods to include these processes in models to calculatethe NH3 exchange between vegetative surfaces and the at-mosphere (Wichink Kruit et al., 2012; Massad et al., 2010).Riedo et al. (2002) coupled a two-layer resistance model toa NH3 exchange model to include ecosystem N dynamicsfor an intensively managed grassland. The model, PaSim,was able to simulate effects of cutting and fertilisation, butpostulated that leaf litter was the reason for underestimationof NH3 emission peaks. Other modelling concepts simulatedleaf NH3 emissions by including the stomatal compensationpoint and a litter layer with the emission potential,0, be-ing dependent on the relative air humidity (Nemitz et al.,2000b). Bi-directional approaches for simulating ammoniaemissions are being developed for several chemistry trans-port models (CTMs) such as the CMAQ, DEHM, EMEP,CHIMERE, and LOTUS-EUROS models (Aas et al., 2012;Skjøth et al., 2011; Cooter et al., 2012; Hamaoui-Laguel etal., 2012). Here, calculations of the ammonia emissions as afunction of ambient conditions are expected to improve cal-culations and understanding considerably (e.g. Hendriks etal., 2013). But to our knowledge, these methods do not in-clude ammonia emissions from litter fall from forest. Furtherexperiments conducting ground layer and canopy layer infor-mation of the stomatal and ground layer emission potential,
www.biogeosciences.net/10/4577/2013/ Biogeosciences, 10, 4577–4589, 2013

4586 K. Hansen et al.: Ammonia emissions from deciduous forest after leaf fall
0, are necessary to develop new parameterisations to forest–atmosphere exchange of NH3.
Despite these efforts, we are still lacking knowledge ofmost biosphere–atmosphere exchange processes of N com-pounds (including potential feedback mechanisms) (Arnethet al., 2010). Flux studies in combination with model calcu-lations are therefore needed in order to highlight the knowl-edge gaps and target future model improvements.
4.3 Diurnal dynamics in atmospheric ammoniaconcentration
MeasuredcRNH3 indicated a clear diurnal pattern in thebeginning of the measurement period with increased con-centrations during night and decreased concentrations dur-ing day, showing thatcNH3 varied significantly over shortertimescales (Fig. 6b). Stable atmospheric conditions duringnighttime suppress the mixing of air and reduce the atmo-spheric boundary layer height, thereby leading to higher NH3concentrations in the lower atmosphere. The model only cap-tured these diurnal variations to a small extent (24–26 Oc-tober) before defoliation ended, and it even showed anti-correlations for the three days 21–24 October. It is knownthat Gaussian models including OML have problems whenmeteorological conditions change from stable to unstable andlow friction velocities prevail (Olesen et al., 2007). One ofthe main problems is that the Gaussian formulation assumesstationary conditions during the calculation period, which isnot appropriate under certain conditions such as low windspeeds (see full discussion in Olesen et al., 2007). In thecurrent study, the comparison with high-resolution measure-ments showed that the observed diurnal variationcRNH3 ishard to capture by the model. Some of the conceptual limita-tions can be improved with more advanced parameterisationssuch as updating the description of horizontal dispersion inOML. Other limitations require the Gaussian OML to be re-placed with more advanced models (Olesen et al., 2007). Thelower performance of OML during these few and special me-teorological conditions does not affect the main conclusions:that there is a need to represent NH3 releases from naturalecosystems, such as forests during leaf fall, for accurate high-spatial and high-temporal (diurnal) atmospheric simulationof cNH3. Therefore, more data on NH3 fluxes are necessaryto improve our understanding of controlling parameters inthe biosphere–atmosphere NH3 exchange processes.
5 Conclusions
Measurements in a deciduous beech forest showed thatFNH3 changed from negative (deposition) to positive (emis-sion) fluxes during the leaf fall period 21 October to15 November 2010, causing increased atmospheric NH3concentration. This change was temporally correlated tothe vegetation status of the forest. The observations of
LAI and PAI showed that the period with increasedcRNH3
was in the leaf fall period, and peak emissions up to0.67± 0.28 µg NH3-N m−2 s−1 were observed. The simpletwo-layer bi-directional canopy compensation model wasable to adequately reproduce the magnitude and temporalstructure of the measured NH3 emission fluxes following leaffall and indicated that the forest ground layer (soil and litter)acted as the main contributing component to the NH3 emis-sions. The mean NH3 concentrations were well simulated us-ing DAMOS before leaf fall, but were underestimated fol-lowing leaf fall. This points to the need for representing for-est leaf fall and associated NH3 emissions in chemical trans-port models when simulating nitrogen deposition to forests.Besides influence on the atmosphere–forest exchange of NH3from the forest’s phenology, variations in meteorological andsoil conditions, and the canopy turbulence, our observationssupport the hypothesis that NH3 emissions occur from decid-uous forests in relation to leaf fall possibly due to increasedlitter emissions or decreased leaf absorption or a combina-tion of these. Additionally, diurnal variations ofcRNH3 re-lated to meteorological conditions (i.e. radiation control onstomatal resistance), forest phenology (i.e. LAI), and the spa-tial distribution of local anthropogenic NH3 sources werefound. This suggests that dedicated process studies includ-ing manipulation of ecosystems would be very valuable forimproved understanding of NH3 fluxes from natural veg-etation. Despite large uncertainties associated with the re-sults obtained in this study due to the assessment techniquesand the limited dataset, the good agreement betweencdNH3,cRNH3 and cmNH3 gives confidence in the data. The resultsmust be considered as a good contribution to improve ourunderstanding of the processes related to natural NH3 emis-sions. This knowledge can be used in direct ecosystem ma-nipulation studies or model studies in order to quantify theNH3 emission flux from ecosystems and the total biosphere–atmosphere net flux of reactive nitrogen.
Acknowledgements.This study was conducted within NitroEuropeIP (project no: 0174841-2). Additionally, the ECOCLIM projectfunded by the Danish Strategic Research Council supported thisstudy with a PhD grant to Kristina Hansen and the EU projectECLAIRE (project no: 282910) and the Villum-Kann RasmussenFoundation through a postdoc grant to Carsten Ambelas Skjøth.We gratefully acknowledge Helle V. Andersen and Christina F.Emborg (Dept. of Environmental Science, Aarhus University) fortheir making the chemical analyses of the denuder measurements,Søren Lund (Dept. of Wind Energy, Technical University Denmark)and Morten K. Hildan (Dept. of Environmental Science, AarhusUniversity) for technical support, Ebba Dellwik (Dept. of WindEnergy, Technical University Denmark) and Andreas Ibrom (Dept.of Chemical and Biochemical Engineering, Technical UniversityDenmark) for additionally providing us data from the field stationfor the analysis, and finally the editor Eiko Nemitz for constructivesupport.
Edited by: E. Nemitz
Biogeosciences, 10, 4577–4589, 2013 www.biogeosciences.net/10/4577/2013/
K. Hansen et al.: Ammonia emissions from deciduous forest after leaf fall 4587
References
Aas, W., Tsyro, S., Bieber, E., Bergstrom, R., Ceburnis, D., Eller-mann, T., Fagerli, H., Frolich, M., Gehrig, R., Makkonen, U.,Nemitz, E., Otjes, R., Perez, N., Perrino, C., Prevot, A. S. H.,Putaud, J.-P., Simpson, D., Spindler, G., Vana, M., and Yttri, K.E.: Lessons learnt from the first EMEP intensive measurementperiods, Atmos. Chem. Phys., 12, 8073–8094, doi:10.5194/acp-12-8073-2012, 2012.
Andersen, H. V., Hovmand, M. F., Hummelshøj, P., and Jensen,N. O.: Measurements of ammonia concentrations, fluxes anddry deposition velocities to a spruce forest 1991–1995, Atmos.Environ., 33, 1367–1383, doi:10.1016/S1352-2310(98)00363-X,1999.
Arneth, A., Harrison, S. P., Zaehle, S., Tsigaridis, K., Menon, S.,Bartlein, P. J., Feichter, J., Korhola, A., Kulmala, M., O’Donnell,D., Schurgers, G., Sorvari, S., and Vesala, T.: Terrestrial biogeo-chemical feedbacks in the climate system, Nat. Geosci., 3, 525–532, doi:10.1038/ngeo905, 2010.
Barrett, K.: Oceanic ammonia emissions in Europe andtheir transboundary fluxes, Atmos. Environ., 32, 381–391,doi:10.1016/S1352-2310(97)00279-3, 1998.
Bartnicki, J., Semeena, V. S., and Fagerli, H.: Atmospheric depo-sition of nitrogen to the Baltic Sea in the period 1995–2006,Atmos. Chem. Phys., 11, 10057–10069, doi:10.5194/acp-11-10057-2011, 2011.
Bobbink, R., Hicks, K., Galloway, J., Spranger, T., Alkemade, R.,Ashmore, M., Bustamante, M., Cinderby, S., Davidson, E., Den-tener, F., Emmett, B., Erisman, J.-W., Fenn, M., Gilliam, F.,Nordin, A., Pardo, L., and De Vries, W.: Global assessment ofnitrogen deposition effects on terrestrial plant diversity: a syn-thesis, Ecol. Appl., 20, 30–59, doi:10.1890/08-1140.1, 2010.
Bouwman, A., Lee, D., Asman, W., Dentener, F., VanderHoek,K., and Olivier, J.: A global high-resolution emission in-ventory for ammonia, Global Biochem. Cy., 11, 561–587,doi:10.1029/97GB02266, 1997.
Brandt, J., Silver, J. D., Frohn, L. M., Geels, C., Gross, A.,Hansen, A. B., Hansen, K. H., Hedegaard, G. B., Skjøth, C.A., Villadsen, H., Zare, A., and Christensen, J. H.: An inte-grated model study for Europe and North America using theDanish Eulerian Hemispheric Model with focus on interconti-nental transport of air pollution, Atmos. Environ., 53, 156–176,doi:10.1016/j.atmosenv.2012.01.011, 2012.
Businger, J. A. and Oncley, S. P.: Flux Measurement with Condi-tional Sampling, J. Atmos. Ocean. Tech., 7, 349–352, 1990.
Christensen, J. H.: The Danish Eulerian hemispheric model– A three-dimensional air pollution model used for theArctic, Atmos. Environ., 31, 4169–4191, doi:10.1016/S1352-2310(97)00264-1, 1997.
Cooter, E. J., Bash, J. O., Benson, V., and Ran, L.: Linking agri-cultural crop management and air quality models for regionalto national-scale nitrogen assessments, Biogeosciences, 9, 4023–4035, doi:10.5194/bg-9-4023-2012, 2012.
David, M., Loubet, B., Cellier, P., Mattsson, M., Schjoerring, J.K., Nemitz, E., Roche, R., Riedo, M., and Sutton, M. A.: Am-monia sources and sinks in an intensively managed grasslandcanopy, Biogeosciences, 6, 1903–1915, doi:10.5194/bg-6-1903-2009, 2009.
de Leeuw, G., Spokes, L., Jickells, T., Skjoth, C., Hertel, O., Vignati,E., Tamm, S., Schulz, M., Sorensen, L., Pedersen, B., Klein, L.,
and Schlunzen, K.: Atmospheric nitrogen inputs into the NorthSea: effect on productivity, Cont. Shelf Res., 23, 1743–1755,doi:10.1016/j.csr.2003.06.011, 2003.
de Vries, W., Solberg, S., Dobbertin, M., Sterba, H., Laub-hann, D., van Oijen, M., Evans, C., Gundersen, P., Kros,J., Wamelink, G. W. W., Reinds, G. J., and Sutton, M.A.: The impact of nitrogen deposition on carbon sequestra-tion by European forests and heathlands RID F-2087-2010RID B-2192-2008, Forest Ecol. Manag., 258, 1814–1823,doi:10.1016/j.foreco.2009.02.034, 2009.
Duce, R. A., LaRoche, J., Altieri, K., Arrigo, K. R., Baker, A.R., Capone, D. G., Cornell, S., Dentener, F., Galloway, J.,Ganeshram, R. S., Geider, R. J., Jickells, T., Kuypers, M. M.,Langlois, R., Liss, P. S., Liu, S. M., Middelburg, J. J., Moore,C. M., Nickovic, S., Oschlies, A., Pedersen, T., Prospero, J.,Schlitzer, R., Seitzinger, S., Sorensen, L. L., Uematsu, M., Ul-loa, O., Voss, M., Ward, B., and Zamora, L.: Impacts of atmo-spheric anthropogenic nitrogen on the open ocean, Science, 320,893–897, doi:10.1126/science.1150369, 2008.
Duyzer, J., Verhagen, H. L. M., Weststrate, J. H., Bosveld, F. C.,and Vermetten, A. W. M.: The Dry Deposition of Ammonia OntoA Douglas-Fir Forest in the Netherlands, Atmos. Environ., 28,1241–1253, doi:10.1016/1352-2310(94)90271-2, 1994.
Emberson, L. D., Ashmore, M. R., Cambridge, H. M., Simpson,D., and Tuovinen, J. P.: Modelling stomatal ozone flux acrossEurope, Environ. Pollut., 109, 403–413, doi:10.1016/S0269-7491(00)00043-9, 2000.
Erisman, J. W. and Wyers, G. P.: Continuous Measurements ofSurface Exchange of So(2) and Nh(3) – Implications for TheirPossible Interaction in the Deposition Process, Atmos. Envi-ron. A-Gen., 27, 1937–1949, doi:10.1016/0960-1686(93)90266-2, 1993.
Erisman, J. W., Bleeker, A., Galloway, J., and Sutton, M. S.: Re-duced nitrogen in ecology and the environment, Environ. Pollut.,150, 140–149, doi:10.1016/j.envpol.2007.06.033, 2007.
Ferm, M.: Method for determination of atmospheric ammonia, At-mos. Environ., 13, 1385–1391, 1979.
Flechard, C. R., Nemitz, E., Smith, R. I., Fowler, D., Vermeulen, A.T., Bleeker, A., Erisman, J. W., Simpson, D., Zhang, L., Tang,Y. S., and Sutton, M. A.: Dry deposition of reactive nitrogen toEuropean ecosystems: a comparison of inferential models acrossthe NitroEurope network, Atmos. Chem. Phys., 11, 2703–2728,doi:10.5194/acp-11-2703-2011, 2011.
Gao, W.: The vertical change of coefficient b, used in the re-laxed eddy accumulation method for flux measurement aboveand within a forest canopy, Atmos. Environ., 29, 2339–2347,doi:10.1016/1352-2310(95)00147-Q, 1995.
Geels, C., Hansen, K. M., Christensen, J. H., Ambelas Skjøth, C.,Ellermann, T., Hedegaard, G. B., Hertel, O., Frohn, L. M., Gross,A., and Brandt, J.: Projected change in atmospheric nitrogen de-position to the Baltic Sea towards 2020, Atmos. Chem. Phys., 12,2615–2629, doi:10.5194/acp-12-2615-2012, 2012a.
Geels, C., Andersen, H. V., Ambelas Skjøth, C., Christensen, J.H., Ellermann, T., Løfstrøm, P., Gyldenkærne, S., Brandt, J.,Hansen, K. M., Frohn, L. M., and Hertel, O.: Improved mod-elling of atmospheric ammonia over Denmark using the cou-pled modelling system DAMOS, Biogeosciences, 9, 2625–2647,doi:10.5194/bg-9-2625-2012, 2012b.
www.biogeosciences.net/10/4577/2013/ Biogeosciences, 10, 4577–4589, 2013

4588 K. Hansen et al.: Ammonia emissions from deciduous forest after leaf fall
Gyldenkærne, S., Skjøth, C. A., Hertel, O., and Ellermann, T.:A dynamical ammonia emission parameterization for use inair pollution models, J. Geophys. Res.-Atmos., 110, D07108,doi:10.1029/2004JD005459, 2005.
Hamaoui-Laguel, L., Meleux, F., Beekmann, M., Bessagnet, B.,Genermont, S., Cellier, P., and Letinois, L.: Improving ammoniaemissions in air quality modelling for France, Atmos. Environ.,doi:10.1016/j.atmosenv.2012.08.002, in press, 2012.
Hendriks, C., Kranenburg, R., Kuenen, J., van Gijlswijk, R.,Wichink Kruit, R., Segers, A., Denier van der Gon, H., andSchaap, M.: The origin of ambient particulate matter concentra-tions in the Netherlands, Atmos. Environ., 69, 289–303, 2013.
Hensen, A., Nemitz, E., Flynn, M. J., Blatter, A., Jones, S. K.,Sørensen, L. L., Hensen, B., Pryor, S. C., Jensen, B., Otjes, R. P.,Cobussen, J., Loubet, B., Erisman, J. W., Gallagher, M. W., Nef-tel, A., and Sutton, M. A.: Inter-comparison of ammonia fluxesobtained using the Relaxed Eddy Accumulation technique, Bio-geosciences, 6, 2575–2588, doi:10.5194/bg-6-2575-2009, 2009.
Hertel, O., Ambelas Skjøth, C., Brandt, J., Christensen, J. H., Frohn,L. M., and Frydendall, J.: Operational mapping of atmosphericnitrogen deposition to the Baltic Sea, Atmos. Chem. Phys., 3,2083–2099, doi:10.5194/acp-3-2083-2003, 2003.
Hertel, O., Skjøth, C. A., Reis, S., Bleeker, A., Harrison, R. M.,Cape, J. N., Fowler, D., Skiba, U., Simpson, D., Jickells, T., Kul-mala, M., Gyldenkærne, S., Sørensen, L. L., Erisman, J. W., andSutton, M. A.: Governing processes for reactive nitrogen com-pounds in the European atmosphere, Biogeosciences, 9, 4921–4954, doi:10.5194/bg-9-4921-2012, 2012.
Hertel, O., Geels, C., Frohn, L. M., Ellermann, T., Skjøth, C.A., Løfstrøm, P., Christensen, J. H., Andersen, H. V., andPeel, R. G.: Assessing atmospheric nitrogen deposition to nat-ural and semi-natural ecosystems e Experience from Danishstudies using the DAMOS, Atmos. Environ., 66, 151–160,doi:10.1016/j.atmosenv.2012.02.071, 2013.
Hicks, B. B. and Mcmillen, R. T.: A Simulation of theEddy Accumulation Method for Measuring Pollutant Fluxes,J. Clim. Appl. Meteorol., 23, 637–643,doi:10.1175/1520-0450(1984)023<0637:ASOTEA>2.0.CO;2, 1984.
Langner, J., Andersson, C., and Engardt, M.: Atmospheric input ofnitrogen to the Baltic Sea basin: present situation, variability dueto meteorology and impact of climate change, Boreal Environ.Res., 14, 226–237, 2009.
Massad, R.-S., Nemitz, E., and Sutton, M. A.: Review and param-eterisation of bi-directional ammonia exchange between vegeta-tion and the atmosphere, Atmos. Chem. Phys., 10, 10359–10386,doi:10.5194/acp-10-10359-2010, 2010.
Mattsson, M., Herrmann, B., David, M., Loubet, B., Riedo, M.,Theobald, M. R., Sutton, M. A., Bruhn, D., Neftel, A., andSchjoerring, J. K.: Temporal variability in bioassays of the stom-atal ammonia compensation point in relation to plant and soilnitrogen parameters in intensively managed grassland, Biogeo-sciences, 6, 171–179, doi:10.5194/bg-6-171-2009, 2009.
Menut, L. and Bessagnet, B.: Atmospheric composition forecastingin Europe, Ann. Geophys., 28, 61–74, doi:10.5194/angeo-28-61-2010, 2010.
Nemitz, E., Milford, C., and Sutton, M. A.: A two-layercanopy compensation point model for describing bi-directionalbiosphere-atmosphere exchange of ammonia, Q. J. Roy. Meteo-rol. Soc., 127, 815–833, doi:10.1256/smsqj.57305, 2001.
Nemitz, E., Sutton, M., Gut, A., San Jose, R., Husted, S.,and Schjoerring, J.: Sources and sinks of ammonia withinan oilseed rape canopy, Agr. Forest Meteorol., 105, 385–404,doi:10.1016/S0168-1923(00)00205-7, 2000a.
Nemitz, E., Sutton, M., Schjoerring, J., Husted, S., and Wyers,G.: Resistance modelling of ammonia exchange over oilseedrape, Agr. Forest Meteorol., 105, 405–425, doi:10.1016/S0168-1923(00)00206-9, 2000b.
Nielsen, K., Stjernholm, M., Olsen, B. O., Muller-Wohlfeil, D.,Madsen, I. K. A., Groom, G., Hansen, H. S., Rolev, A. M., Her-mansen, B., Skov-Petersen, H., Johannsen, V. K., Hvidberg, M.,Jensen, J. E., Bacher, V., and Larsen, H.: Areal Informations Sys-temet – AIS, Technical report, 112 pp., Danish Ministry of Envi-ronment, Denmark, 2000.
Olesen, H. R., Berkowicz, R. B., and Løfstrøm, P.: OML: Review ofmodel formulation, Technical Report No. 609, 130 pp., NationalEnvironmental Research Institute, Denmark, NERI, 2007.
Oncley, S. P., Delany, A. C., Horst, T. W., and Tans, P. P.: Verifica-tion of Flux Measurement Using Relaxed Eddy Accumulation,Atmos. Environ. A-Gen., 27, 2417–2426, 1993.
Østergard, J.: Jordbundsdannelse under bøgeskov og mark ved LilleBøgeskov, Sorø, Master’s thesis, 130 pp., Department of EarthSciences, University of Aarhus, Denmark, 2000 (in Danish).
Pilegaard, K., Ibrom, A., Courtney, M. S., Hummelshoj, P.,and Jensen, N. O.: Increasing net CO(2) uptake by a Dan-ish beech forest during the period from 1996 to 2009,RID A-9850-2011, Agr. Forest Meteorol., 151, 934–946,doi:10.1016/j.agrformet.2011.02.013, 2011.
Pouliot, G., Pierce, T., van der Gon, H. D., Schaap, M., Moran,M., and Nopmongcol, U.: Comparing emission inventoriesand model-ready emission datasets between Europe and NorthAmerica for the AQMEII project, Atmos. Environ., 53, 4–14,doi:10.1016/j.atmosenv.2011.12.041, 2012.
Pryor, S. C., Barthelmie, R. J., Sorensen, L. L., and Jensen, B.: Am-monia concentrations and fluxes over a forest in the midwest-ern USA, Atmos. Environ., 35, 5645–5656, doi:10.1016/S1352-2310(01)00259-X, 2001.
Reis, S., Pinder, R. W., Zhang, M., Lijie, G., and Sutton, M.A.: Reactive nitrogen in atmospheric emission inventories, At-mos. Chem. Phys., 9, 7657–7677, doi:10.5194/acp-9-7657-2009,2009.
Ren, X., Sanders, J. E., Rajendran, A., Weber, R. J., Goldstein, A.H., Pusede, S. E., Browne, E. C., Min, K.-E., and Cohen, R.C.: A relaxed eddy accumulation system for measuring verti-cal fluxes of nitrous acid, Atmos. Meas. Tech., 4, 2093–2103,doi:10.5194/amt-4-2093-2011, 2011.
Riedo, M., Milford, C., Schmid, M., and Sutton, M.: Cou-pling soil-plant-atmosphere exchange of ammonia with ecosys-tem functioning in grasslands, Ecol. Model., 158, 83–110,doi:10.1016/S0304-3800(02)00169-2, 2002.
Roelle, P. A. and Aneja, V. P.: Characterization of ammoniaemissions from soils in the upper coastal plain, North Car-olina, Atmos. Environ., 36, 1087-1097, doi:10.1016/S1352-2310(01)00355-7, 2002.
Ruppert, J., Thomas, C., and Foken, T.: Scalar similarity for relaxededdy accumulation methods, Bound.-Lay. Meteorol., 120, 39–63, doi:10.1007/s10546-005-9043-3, 2006.
Schjoerring, J. K., Husted, S., and Mattsson, M.: Physiolog-ical parameters controlling plant-atmosphere ammonia ex-
Biogeosciences, 10, 4577–4589, 2013 www.biogeosciences.net/10/4577/2013/

K. Hansen et al.: Ammonia emissions from deciduous forest after leaf fall 4589
change, Atmos. Environ., 32, 491–498, doi:10.1016/S1352-2310(97)00006-X, 1998.
Simpson, D., Fagerli, H., Jonson, J. E., Tsyro, S., Wind, P., andTuovinen J-P: Transboundary Acidification, Eutrophication andGround Level Ozone in Europe, PART I, Unified EMEP ModelDescription, 104 pp., 2003.
Simpson, D., Aas, W., Bartnicki, J., Berge, H., Bleeker, A., Cu-velier, K., Dentener, F., Dore, T., Erisman, J. W., Fagerli, H.,Flechard, C., Hertel, O., Jaarsveld, H. v., Jenkin, M., Schaap, M.,Semeena, V. S., Thunis, P., Vautard, R., and Vieno, M.: Atmo-spheric transport and deposition of nitrogen in Europe, in: TheEuropean Nitrogen Assessment, edited by: Sutton, M., Howard,C. M., Erisman, J. W., Billen, G., Bleeker, A., Grennfelt, P.,Grinsven, H., and Grizzetti, B., Cambridge University Press,298–316, 2011.
Skjøth, C. A. and Geels, C.: The effect of climate and climatechange on ammonia emissions in Europe, Atmos. Chem. Phys.,13, 117–128, doi:10.5194/acp-13-117-2013, 2013.
Skjøth, C. A., Hertel, O., Gyldenkaerne, S., and Ellermann, T.: Im-plementing a dynamical ammonia emission parameterization inthe large-scale air pollution model ACDEP, J. Geophys. Res.-Atmos., 109, D06306, doi:10.1029/2003JD003895, 2004.
Skjøth, C. A., Geels, C., Berge, H., Gyldenkærne, S., Fagerli, H.,Ellermann, T., Frohn, L. M., Christensen, J., Hansen, K. M.,Hansen, K., and Hertel, O.: Spatial and temporal variations inammonia emissions – a freely accessible model code for Europe,Atmos. Chem. Phys., 11, 5221–5236, doi:10.5194/acp-11-5221-2011, 2011.
Sommer, S. G., Østergard, H. S., Løfstrøm, P., Andersen, H. V., andJensen, L. S.: Validation of model calculation of ammonia de-position in the neighbourhood of a poultry farm using measuredNH3 concentrations and N deposition, Atmos. Environ., 43, 915–920, doi:10.1016/j.atmosenv.2008.10.045, 2009.
Sorensen, L. L., Granby, K., Nielsen, H., and Asman, W. A.H.: Diffusion Scrubber Technique Used for Measurementsof Atmospheric Ammonia, Atmos. Environ., 28, 3637–3645,doi:10.1016/1352-2310(94)00189-R, 1994.
Sorensen, L., Hertel, O., Skjoth, C., Lund, M., and Pedersen, B.:Fluxes of ammonia in the coastal marine boundary layer, Atmos.Environ., 37, 167–177, doi:10.1016/S1352-2310(03)00247-4,2003.
Stevens, C. J., Dise, N. B., Mountford, J. O., and Gowing, D. J.: Im-pact of nitrogen deposition on the species richness of grasslands,Science, 303, 1876–1879, doi:10.1126/science.1094678, 2004.
Sutton, M. A., Perthue, E., Fowler, D., Storetonwest, R. L., Cape, J.N., Arends, B. G., and Mols, J. J.: Vertical distribution and fluxesof ammonia at Great Dun Fell, Atmos. Environ., 31, 2615–2624,doi:10.1016/S1352-2310(96)00180-X, 1997.
Sutton, M. A., Nemitz, E., Theobald, M. R., Milford, C., Dorsey,J. R., Gallagher, M. W., Hensen, A., Jongejan, P. A. C., Eris-man, J. W., Mattsson, M., Schjoerring, J. K., Cellier, P., Loubet,B., Roche, R., Neftel, A., Hermann, B., Jones, S. K., Lehman,B. E., Horvath, L., Weidinger, T., Rajkai, K., Burkhardt, J.,Lopmeier, F. J., and Daemmgen, U.: Dynamics of ammonia ex-change with cut grassland: strategy and implementation of theGRAMINAE Integrated Experiment, Biogeosciences, 6, 309–331, doi:10.5194/bg-6-309-2009, 2009.
Sutton, M. A., Oenema, O., Erisman, J. W., Leip, A., van Grinsven,H., and Winiwarter, W.: Too much of a good thing, Nature, 472,159–161, doi:10.1038/472159a, 2011.
Velthof, G. L., van Bruggen, C., Groenestein, C. M., deHaan, B. J., Hoogeveen, M. W., and Huijsmans, J. F. M.:A model for inventory of ammonia emissions from agri-culture in the Netherlands, Atmos. Environ., 46, 248–255,doi:10.1016/j.atmosenv.2011.09.075, 2012.
Walker, J. T., Jones, M. R., Bash, J. O., Myles, L., Meyers, T.,Schwede, D., Herrick, J., Nemitz, E., and Robarge, W.: Pro-cesses of ammonia air–surface exchange in a fertilized Zea mayscanopy, Biogeosciences, 10, 981–998, doi:10.5194/bg-10-981-2013, 2013.
Wang, L., Xu, Y., and Schjoerring, J. K.: Seasonal variation in am-monia compensation point and nitrogen pools in beech leaves(Fagus sylvatica), Plant Soil, 343, 51–66, doi:10.1007/s11104-010-0693-7, 2011.
Wang, L., Ibrom, A., Korhonen, J. F. J., Arnoud Frumau, K. F., Wu,J., Pihlatie, M., and Schjoerring, J. K.: Interactions between leafnitrogen status and longevity in relation to N cycling in threecontrasting European forest canopies, Biogeosciences, 10, 999–1011, doi:10.5194/bg-10-999-2013, 2013.
Wichink Kruit , R. J., van Pul, W. A. J., Otjes, R. P., Hofschreuder,P., Jacobs, A. F. G., and Holtslag, A. A. M.: Ammonia fluxes andderived canopy compensation points over non-fertilized agricul-tural grassland in The Netherlands using the new gradient am-monia – high accuracy – monitor (GRAHAM), Atmos. Environ.,41, 1275–1287, 2007.
Wichink Kruit, R. J., Schaap, M., Sauter, F. J., van Zanten, M. C.,and van Pul, W. A. J.: Modeling the distribution of ammoniaacross Europe including bi-directional surface-atmosphere ex-change, Biogeosciences, 9, 5261–5277, doi:10.5194/bg-9-5261-2012, 2012.
Wyers, G. P. and Erisman, J. W.: Ammonia exchange over conif-erous forest, Atmos. Environ., 32, 441–451, doi:10.1016/S1352-2310(97)00275-6, 1998.
Wyers, G. P., Vermeulen, A. T., and Slanina, J.: Measurement ofDry Deposition of Ammonia on a Forest, Environ. Pollut., 75,25–28, doi:10.1016/0269-7491(92)90052-C, 1992.
Xiankai, L., Jiangming, M., and Shaofeng, D.: Effects of nitro-gen deposition on forest biodiversity, Acta Ecologica Sinica, 28,5532–5548, doi:10.1016/S1872-2032(09)60012-3, 2008.
Zhang, L., Wright, L. P., and Asman, W. A. H.: Bi-directional air-surface exchange of atmospheric ammonia: A review of mea-surements and a development of a big-leaf model for applicationsin regional-scale air-quality models, J. Geophys. Res.-Atmos.,115, D20310, doi:10.1029/2009JD013589, 2010.
www.biogeosciences.net/10/4577/2013/ Biogeosciences, 10, 4577–4589, 2013