Embed Size (px)
Citation preview
MONITORING AND EVALUATING THE NUTRITION OUTCOMES OF
INTERVENTIONS
KEY CONCEPTS AND INDICATORS

WHAT TO MEASURE?
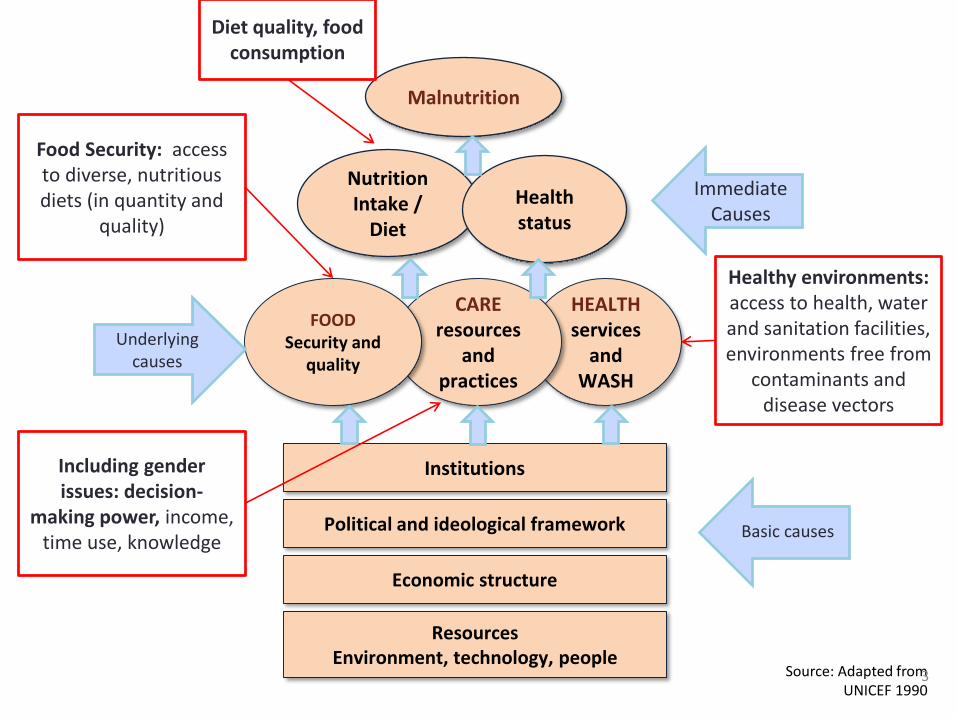
Malnutrition
Institutions
Political and ideological framework
Economic structure
ResourcesEnvironment, technology, people
HEALTHservices
and WASH
CAREresources
and practices
FOODSecurity and
quality
Nutrition Intake /
Diet
Health status
Source: Adapted from UNICEF 1990
Immediate Causes
Underlying causes
Basic causes
Food Security: access to diverse, nutritious diets (in quantity and
quality)
Healthy environments: access to health, water and sanitation facilities, environments free from
contaminants and disease vectors
Including gender issues: decision-
making power, income, time use, knowledge
3
Diet quality, food consumption
What to measure?
• To choose indicators, projects should identify which of the domains they affect, and how it will lead to improved food access, diet, and/or nutrition – in other words, the impact pathway.
• Not all nutrition-sensitive agriculture projects will have the same impact pathway.
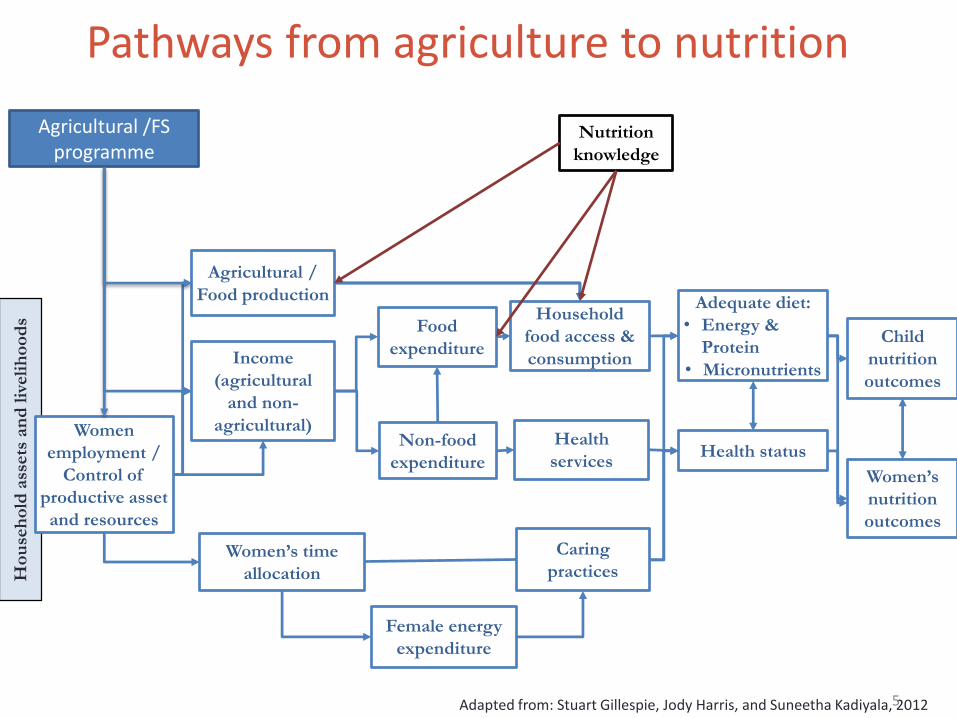
Adapted from: Stuart Gillespie, Jody Harris, and Suneetha Kadiyala, 2012
Household
food access &
consumption
Food
expenditure
Non-food
expenditure
Adequate diet:
• Energy &
Protein
• Micronutrients
Child
nutrition
outcomes
Ho
use
ho
ld a
ssets
an
d l
iveli
ho
od
s
Health status
Women’s
nutrition
outcomes
Health
services
Women
employment /
Control of
productive asset
and resources
Income
(agricultural
and non-
agricultural)
Caring
practices
Female energy
expenditure
Agricultural /
Food production
Pathways from agriculture to nutrition
5
Women’s time
allocation
Agricultural /FS programme
Nutrition
knowledge

agricultural production
maternal health
and care
child care
income-earning
activities
The zero-sum game
McGuire and Popkin, Food & Nutr Bull, 1989 6
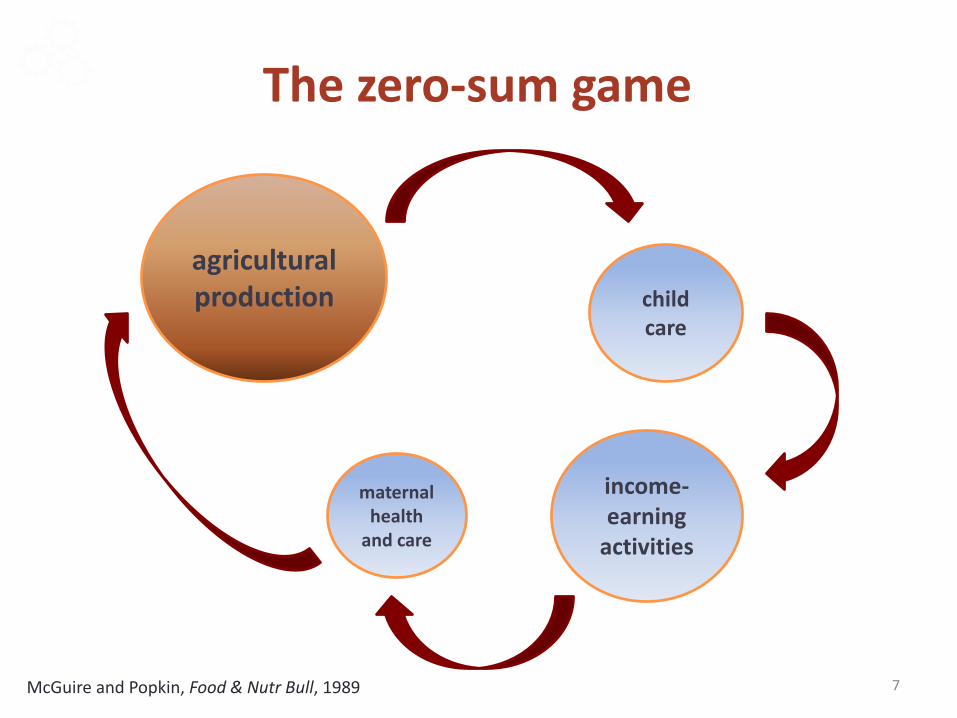
agricultural production
maternal health
and care
child care
income-earning
activities
McGuire and Popkin, Food & Nutr Bull, 1989
The zero-sum game
7

Adapted from: Stuart Gillespie, Jody Harris, and Suneetha Kadiyala, 2012
Household
food access &
consumption
Food
expenditure
Non-food
expenditure
Adequate diet:
• Energy &
Protein
• Micronutrients
Child
nutrition
outcomes
Ho
use
ho
ld a
ssets
an
d l
iveli
ho
od
s
Health status
Women’s
nutrition
outcomes
Health
services
Women
employment /
Control of
productive asset
and resources
Income
(agricultural
and non-
agricultural)
Caring
practices
Female energy
expenditure
Agricultural /
Food production
Pathways from agriculture to nutrition
9
Women’s time
allocation
Agricultural /FS programme
Household practices
Agricultural production
Nutrition outcomes
Food and diets
Household knowledge
‘Do no harm’ to health and care
Nutrition
knowledge
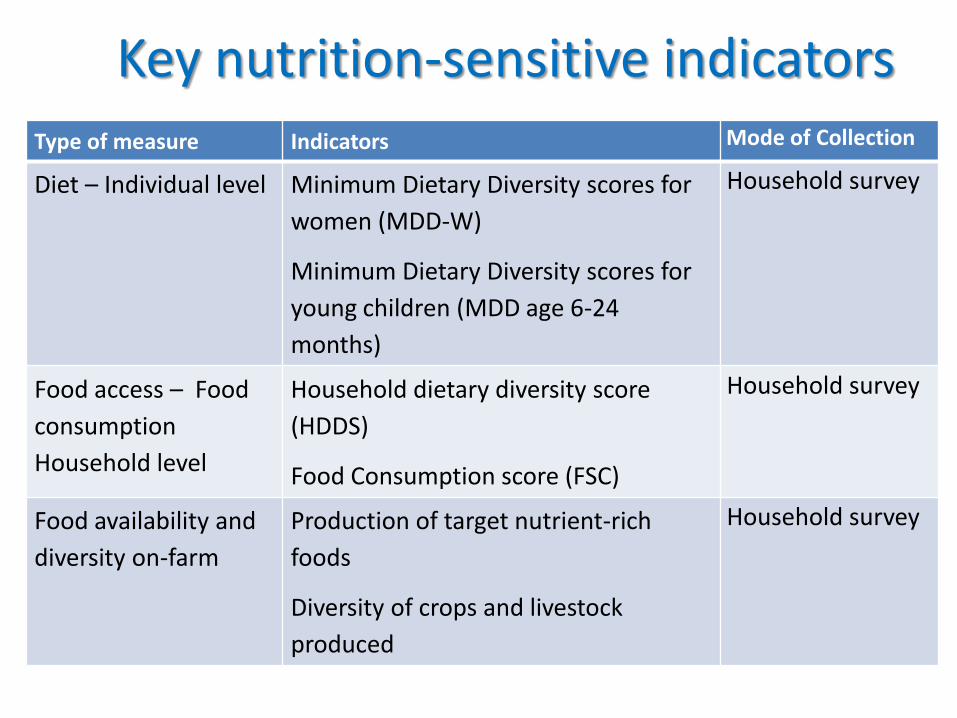
Type of measure Indicators Mode of Collection
Diet – Individual level Minimum Dietary Diversity scores for
women (MDD-W)
Minimum Dietary Diversity scores for
young children (MDD age 6-24
months)
Household survey
Food access – Food
consumption
Household level
Household dietary diversity score
(HDDS)
Food Consumption score (FSC)
Household survey
Food availability and
diversity on-farm
Production of target nutrient-rich
foods
Diversity of crops and livestock
produced
Household survey
Key nutrition-sensitive indicators

Type of measure Indicators Mode of Collection
Food environment in
market
Availability and prices of
targeted nutrient-rich
foods
Market / Price
Information System when
they exist; Rapid market
survey
Women’s
empowerment
Women’s Empowerment
in Agriculture Index,
Time-use survey, and/or
Qualitative inquiry
Household survey and/or
qualitative process
Nutrition and food
safety knowledge and
norms
(indicators will be project-
specific)
Household survey and/or
qualitative process
Natural resource
management
Access to improved
drinking water sources
Household survey
Key nutrition-sensitive indicators
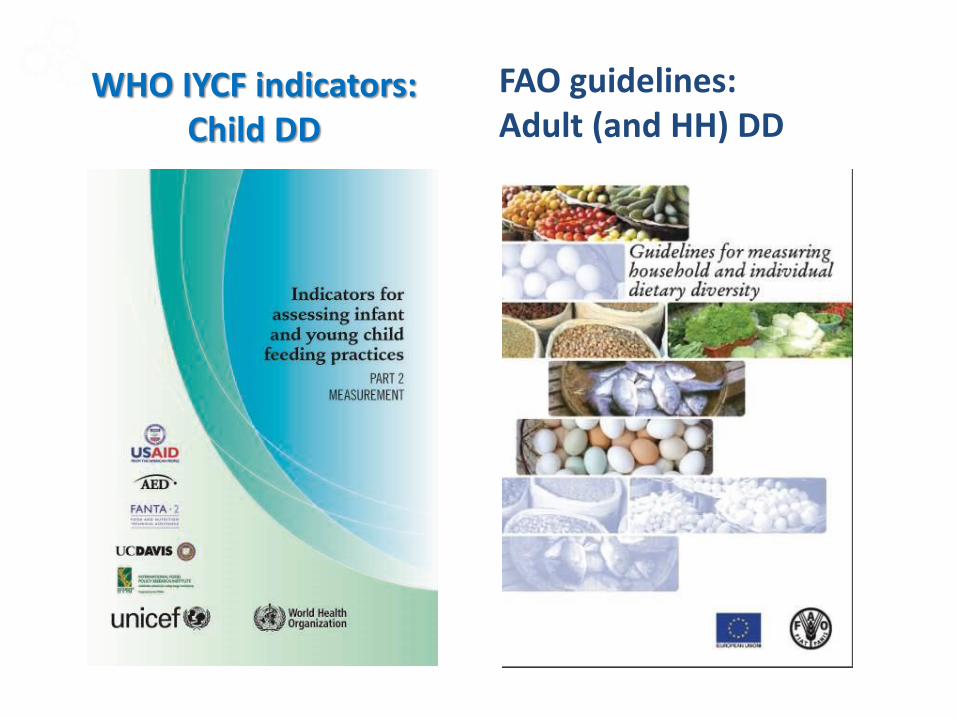
WHO IYCF indicators: Child DD
FAO guidelines: Adult (and HH) DD

HOW TO MEASURE IT WELL
13
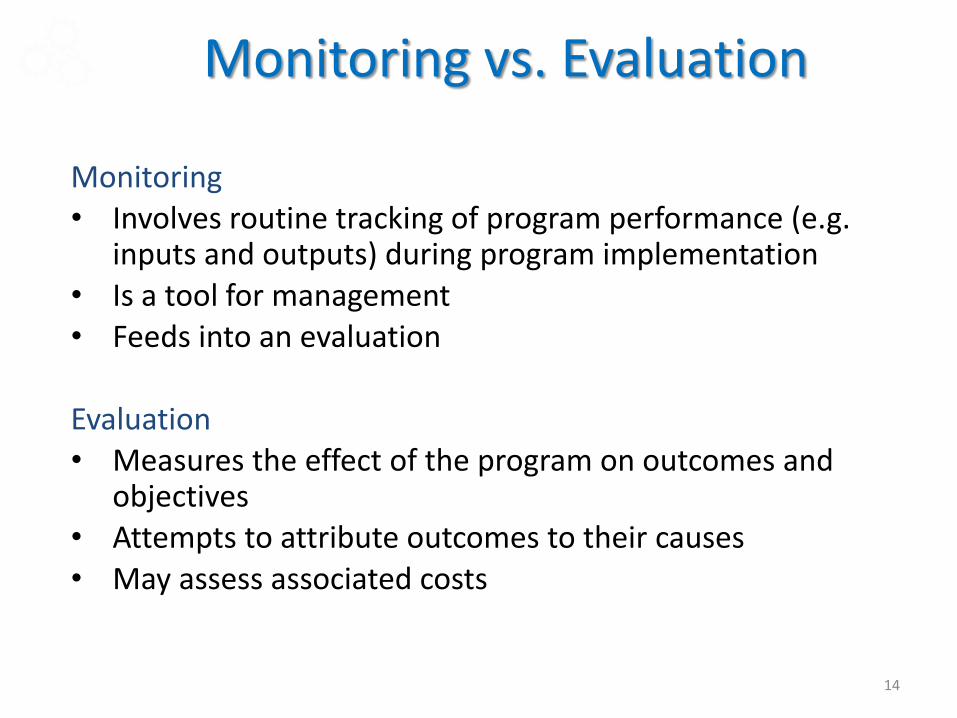
Monitoring vs. Evaluation
Monitoring• Involves routine tracking of program performance (e.g.
inputs and outputs) during program implementation• Is a tool for management• Feeds into an evaluation
Evaluation • Measures the effect of the program on outcomes and
objectives • Attempts to attribute outcomes to their causes• May assess associated costs
14
15
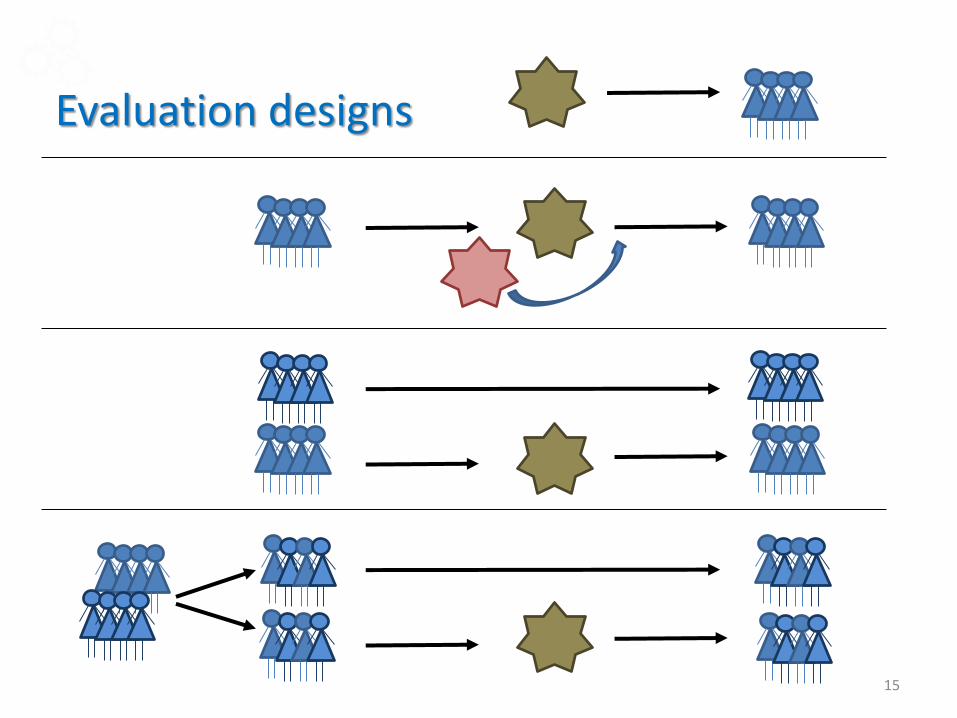
Evaluation designs
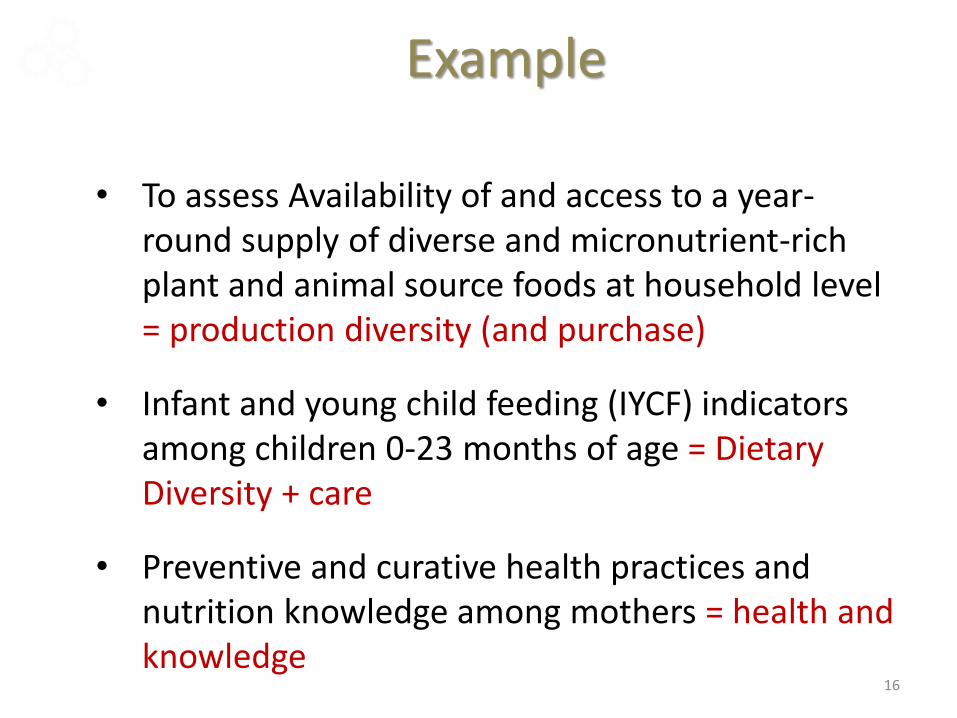
Example
• To assess Availability of and access to a year-round supply of diverse and micronutrient-rich plant and animal source foods at household level = production diversity (and purchase)
• Infant and young child feeding (IYCF) indicators among children 0-23 months of age = Dietary Diversity + care
• Preventive and curative health practices and nutrition knowledge among mothers = health and knowledge
16
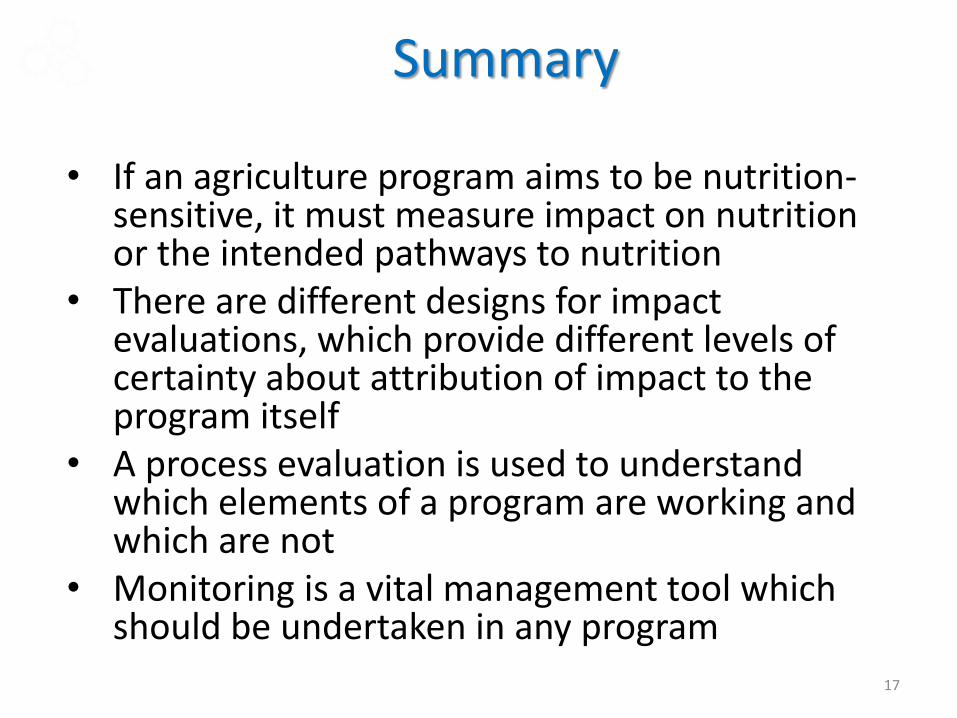
Summary
• If an agriculture program aims to be nutrition-sensitive, it must measure impact on nutrition or the intended pathways to nutrition
• There are different designs for impact evaluations, which provide different levels of certainty about attribution of impact to the program itself
• A process evaluation is used to understand which elements of a program are working and which are not
• Monitoring is a vital management tool which should be undertaken in any program
17
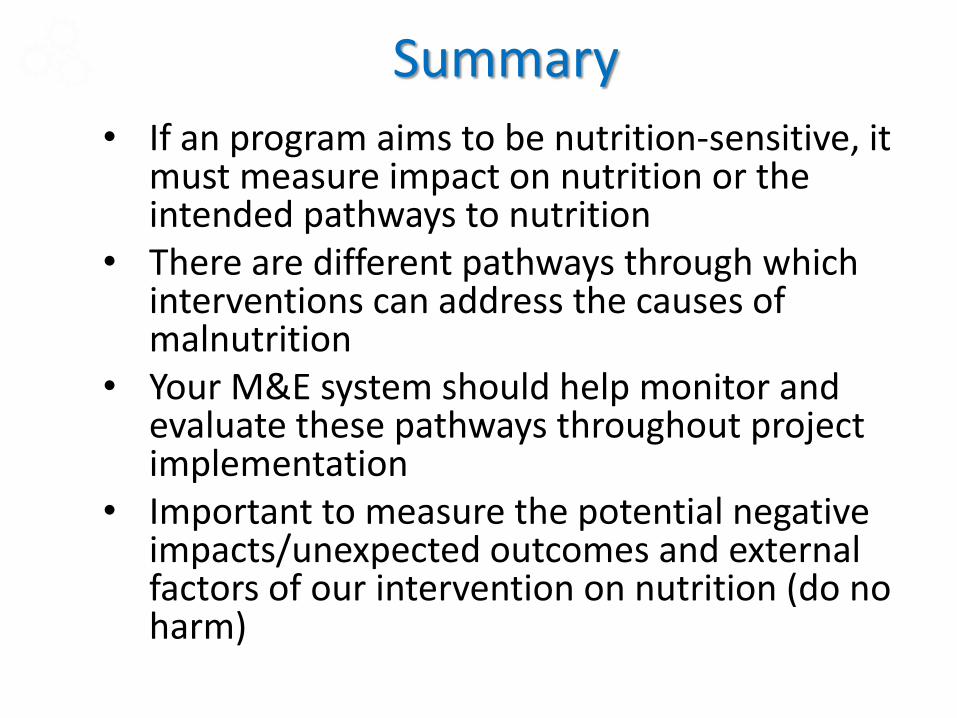
Summary
• If an program aims to be nutrition-sensitive, it must measure impact on nutrition or the intended pathways to nutrition
• There are different pathways through which interventions can address the causes of malnutrition
• Your M&E system should help monitor and evaluate these pathways throughout project implementation
• Important to measure the potential negative impacts/unexpected outcomes and external factors of our intervention on nutrition (do no harm)
Summary
• What a program measures will depend on the program aims
• Stunting is a good impact indicator of multisectoral long-term programmes but not for emergency or resilience programmes
• For Food Security interventions, important to measure impact at least on household food consumption, if possible individual because nutrition is about individuals and considering the individual level is the only way to understand maternal and child nutrition
BUILDING CAPACITIES FOR BETTER...BUILDING CAPACITIES FOR BETTER...
Indicators
Diet quality – Individual level
• Why to use: to understand if limited food access or income has impacted diet quality
• No easy indicator currently exists that can capture diet quality holistically in its entirely. E.g.: MDD-W, IYCF (Minimum Dietary Diversity), IDDS
• MDD-W: validated as an indicator of micronutrient adequacy among women of reproductive age, relatively easy to administer, but it does not capture dietary quality completely.
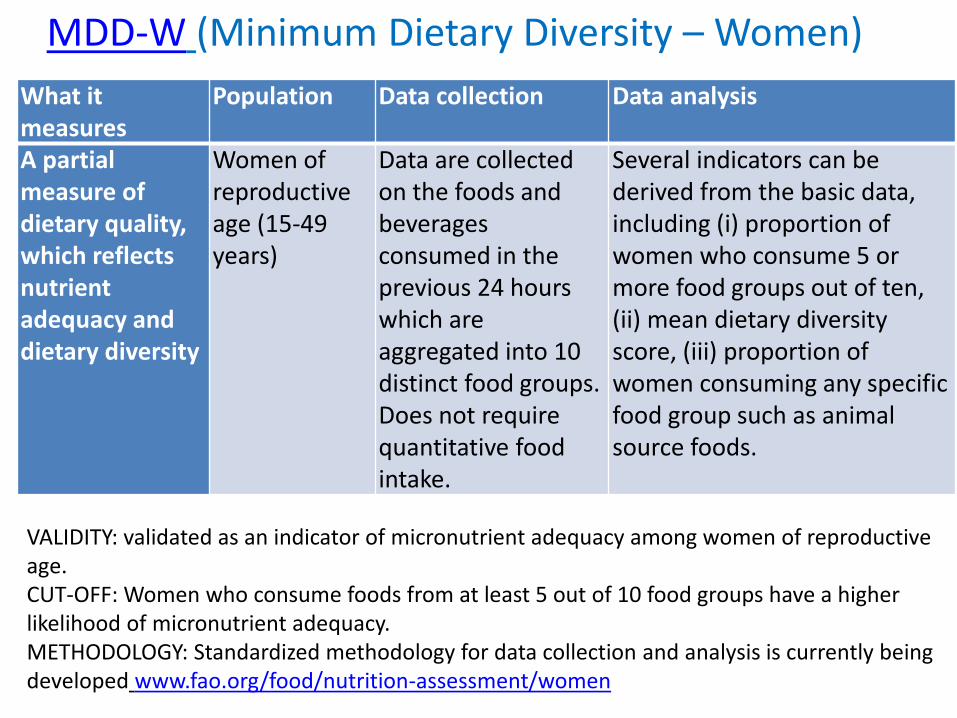
MDD-W (Minimum Dietary Diversity – Women)
What it measures
Population Data collection Data analysis
A partial measure of dietary quality, which reflects nutrient adequacy and dietary diversity
Women of reproductive age (15-49 years)
Data are collected on the foods and beverages consumed in the previous 24 hours which are aggregated into 10 distinct food groups. Does not require quantitative food intake.
Several indicators can be derived from the basic data, including (i) proportion of women who consume 5 or more food groups out of ten, (ii) mean dietary diversity score, (iii) proportion of women consuming any specific food group such as animal source foods.
VALIDITY: validated as an indicator of micronutrient adequacy among women of reproductive age. CUT-OFF: Women who consume foods from at least 5 out of 10 food groups have a higher likelihood of micronutrient adequacy.METHODOLOGY: Standardized methodology for data collection and analysis is currently being developed www.fao.org/food/nutrition-assessment/women
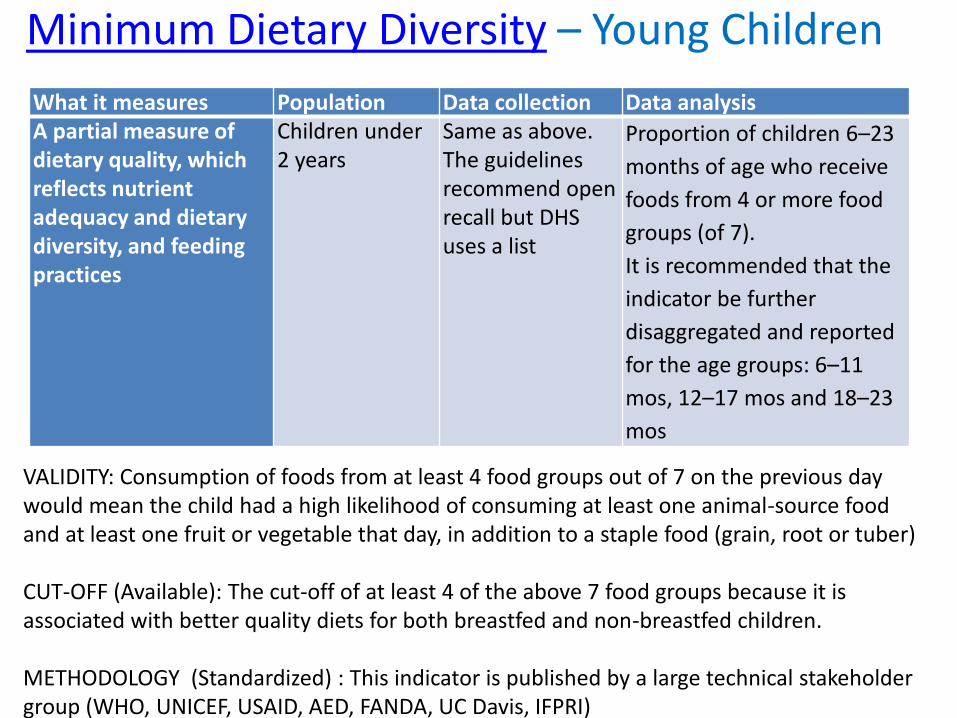
Minimum Dietary Diversity – Young Children
What it measures Population Data collection Data analysisA partial measure of dietary quality, which reflects nutrient adequacy and dietary diversity, and feeding practices
Children under 2 years
Same as above. The guidelines recommend open recall but DHS uses a list
Proportion of children 6–23
months of age who receive
foods from 4 or more food
groups (of 7).
It is recommended that the
indicator be further
disaggregated and reported
for the age groups: 6–11
mos, 12–17 mos and 18–23
mos
VALIDITY: Consumption of foods from at least 4 food groups out of 7 on the previous day would mean the child had a high likelihood of consuming at least one animal-source food and at least one fruit or vegetable that day, in addition to a staple food (grain, root or tuber)
CUT-OFF (Available): The cut-off of at least 4 of the above 7 food groups because it is associated with better quality diets for both breastfed and non-breastfed children.
METHODOLOGY (Standardized) : This indicator is published by a large technical stakeholder group (WHO, UNICEF, USAID, AED, FANDA, UC Davis, IFPRI)
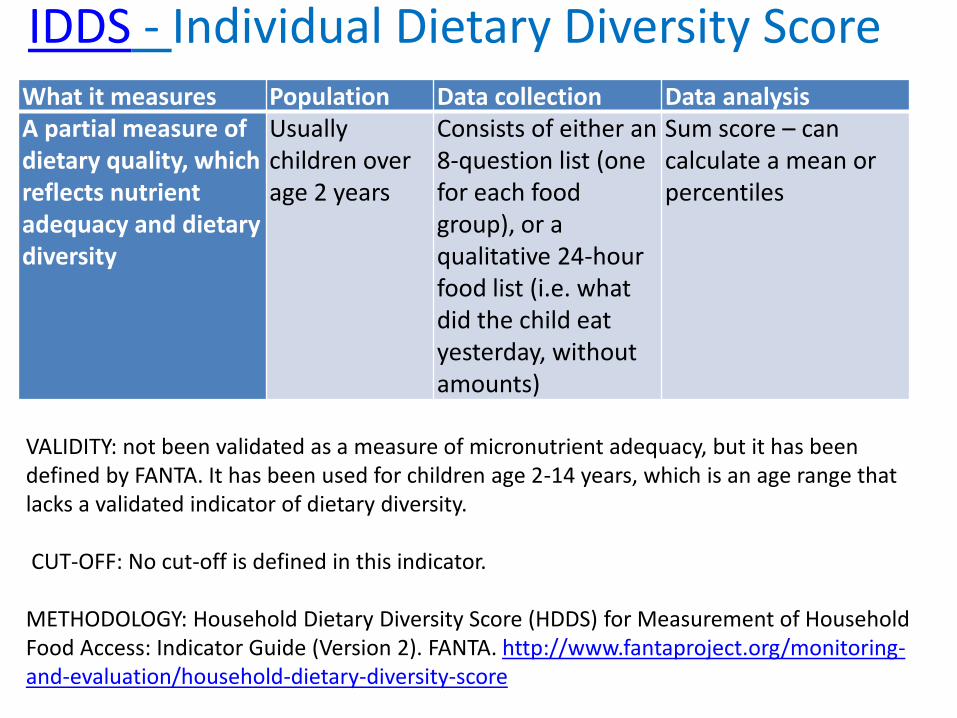
IDDS - Individual Dietary Diversity ScoreWhat it measures Population Data collection Data analysisA partial measure of dietary quality, which reflects nutrient adequacy and dietary diversity
Usually children over age 2 years
Consists of either an 8-question list (one for each food group), or a qualitative 24-hour food list (i.e. what did the child eat yesterday, without amounts)
Sum score – can calculate a mean or percentiles
VALIDITY: not been validated as a measure of micronutrient adequacy, but it has been defined by FANTA. It has been used for children age 2-14 years, which is an age range that lacks a validated indicator of dietary diversity.
CUT-OFF: No cut-off is defined in this indicator.
METHODOLOGY: Household Dietary Diversity Score (HDDS) for Measurement of Household Food Access: Indicator Guide (Version 2). FANTA. http://www.fantaproject.org/monitoring-and-evaluation/household-dietary-diversity-score
WHO IYCF indicators: Child DD
FAO guidelines: Adult and (HH) DD
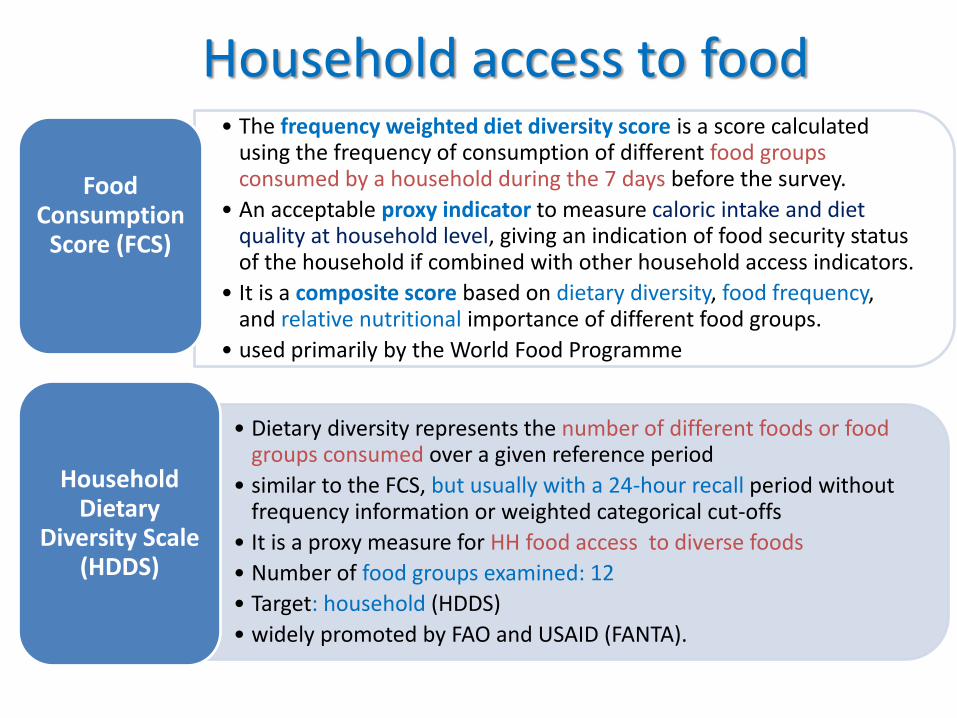
Household access to food• The frequency weighted diet diversity score is a score calculated
using the frequency of consumption of different food groups consumed by a household during the 7 days before the survey.
• An acceptable proxy indicator to measure caloric intake and diet quality at household level, giving an indication of food security status of the household if combined with other household access indicators.
• It is a composite score based on dietary diversity, food frequency, and relative nutritional importance of different food groups.
• used primarily by the World Food Programme
Food Consumption
Score (FCS)
• Dietary diversity represents the number of different foods or food groups consumed over a given reference period
• similar to the FCS, but usually with a 24-hour recall period without frequency information or weighted categorical cut-offs
• It is a proxy measure for HH food access to diverse foods
• Number of food groups examined: 12
• Target: household (HDDS)
• widely promoted by FAO and USAID (FANTA).
Household Dietary
Diversity Scale (HDDS)
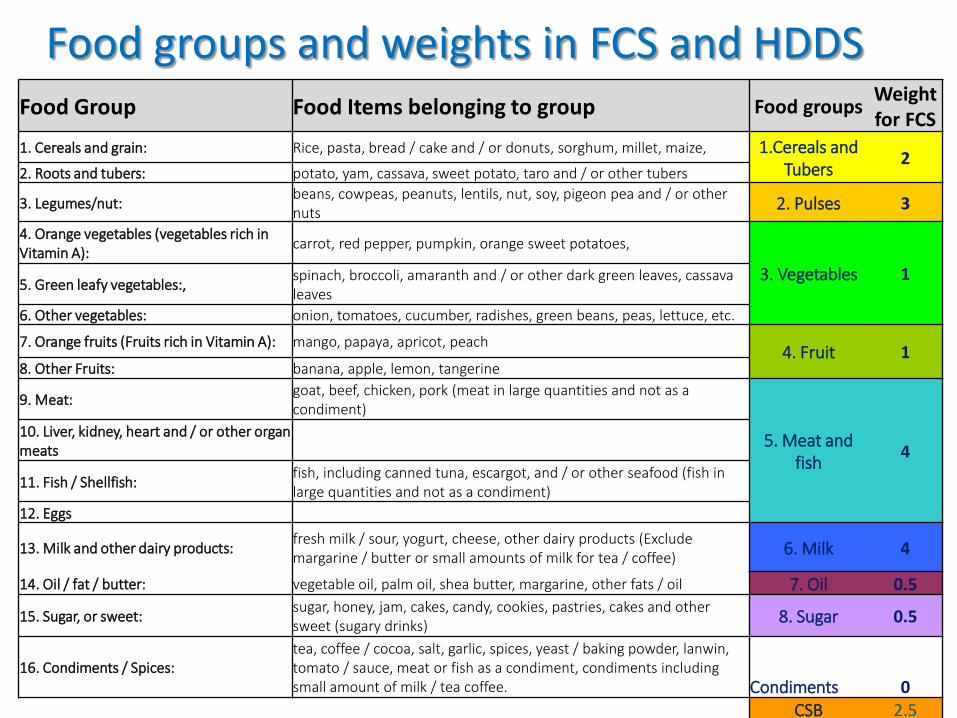
Food groups and weights in FCS and HDDSFood Group Food Items belonging to group Food groups
Weight for FCS
1. Cereals and grain: Rice, pasta, bread / cake and / or donuts, sorghum, millet, maize, 1.Cereals and Tubers
22. Roots and tubers: potato, yam, cassava, sweet potato, taro and / or other tubers
3. Legumes/nut:beans, cowpeas, peanuts, lentils, nut, soy, pigeon pea and / or other nuts
2. Pulses 3
4. Orange vegetables (vegetables rich in Vitamin A):
carrot, red pepper, pumpkin, orange sweet potatoes,
3. Vegetables 15. Green leafy vegetables:,
spinach, broccoli, amaranth and / or other dark green leaves, cassava leaves
6. Other vegetables: onion, tomatoes, cucumber, radishes, green beans, peas, lettuce, etc.
7. Orange fruits (Fruits rich in Vitamin A): mango, papaya, apricot, peach4. Fruit 1
8. Other Fruits: banana, apple, lemon, tangerine
9. Meat:goat, beef, chicken, pork (meat in large quantities and not as a condiment)
5. Meat and fish
410. Liver, kidney, heart and / or other organ meats
11. Fish / Shellfish:fish, including canned tuna, escargot, and / or other seafood (fish in large quantities and not as a condiment)
12. Eggs
13. Milk and other dairy products:fresh milk / sour, yogurt, cheese, other dairy products (Exclude margarine / butter or small amounts of milk for tea / coffee)
6. Milk 4
14. Oil / fat / butter: vegetable oil, palm oil, shea butter, margarine, other fats / oil 7. Oil 0.5
15. Sugar, or sweet:sugar, honey, jam, cakes, candy, cookies, pastries, cakes and other sweet (sugary drinks)
8. Sugar 0.5
16. Condiments / Spices:tea, coffee / cocoa, salt, garlic, spices, yeast / baking powder, lanwin, tomato / sauce, meat or fish as a condiment, condiments including small amount of milk / tea coffee. Condiments 0
CSB 2.5