Embed Size (px)
Citation preview
Improving Child Nutrition Outcomes in India Can the Integrated Child Development Services Program Be
More Effective?
Monica Das Gupta [email protected],
Michael Lokshin
Michele Gragnolati [email protected]
Oleksiy Ivaschenko
Development Research Group The World Bank
World Bank Policy Research Working Paper 3647, June 2005 The Policy Research Working Paper Series disseminates the findings of work in progress to encourage the exchange of ideas about development issues. An objective of the series is to get the findings out quickly, even if the presentations are less than fully polished. The papers carry the names of the authors and should be cited accordingly. The findings, interpretations, and conclusions expressed in this paper are entirely those of the authors. They do not necessarily represent the view of the World Bank, its Executive Directors, or the countries they represent. Policy Research Working Papers are available online at http://econ.worldbank.org. Acknowledgements: We are grateful for helpful suggestions and comments on an earlier version of this paper from Harold Alderman, Jere Behrman, Yi-Kyoung Lee, and anonymous referees.
WPS3647
Pub
lic D
iscl
osur
e A
utho
rized
Pub
lic D
iscl
osur
e A
utho
rized
Pub
lic D
iscl
osur
e A
utho
rized
Pub
lic D
iscl
osur
e A
utho
rized
ii
Abstract Levels of child malnutrition in India fell only slowly during the 1990s, despite significant economic growth and substantial public spending on the Integrated Child Development Services (ICDS) program, of which the major component is supplementary feeding for malnourished children. To begin to unravel this puzzle, we assess the program’s placement and its outcomes, using NFHS data from 1992 and 1998. We find that program placement is clearly regressive across states. The states with the greatest need for the program ⎯ the poor Northern states with high levels of child malnutrition and nearly half India’s population ⎯ have the lowest program coverage, and the lowest budgetary allocations from the central government. Program placement within a state is more progressive: poorer and larger villages have a higher probability of having an ICDS centre, as do those with other development programs or community associations. We also find little evidence of program impact on child nutrition status in villages with ICDS centers.
1
1. Introduction India is in the curious position of having very high levels of malnutrition despite large stocks of food-grains resulting from increased agricultural productivity. Moreover, the country experienced rapid economic growth during the 1990s, but this was accompanied by very modest declines in child malnutrition. Estimated levels of moderate or severe under-nutrition among children below age 3 were 52 percent in 1992, and 47 percent in 1998.1 There are two factors responsible for this outcome. A significant proportion of the population remains unable to buy enough food. And the whole population is vulnerable to becoming malnourished due to exposure to diseases ⎯ in particular diarrheal diseases and parasitic infections resulting from poor sanitation and living conditions ⎯ and malnutrition in turn increases future susceptibility to disease.2 These synergies take a heavy toll in labor productivity and outlays on health care, as well as mortality.3 To ameliorate the situation, the government of India has developed several major programs for increasing access to food. One approach is through price controls: for example, the Public Distribution System4 makes some staple foods such as food-grains and sugar available at controlled prices through “fair-price shops”. Another thrust has been through income support: such as a range of food-for-work programs and employment guarantee programs, where people are paid (often in foodgrains) for working on building or maintaining public infrastructure.5 A third approach has been to directly feed children: this includes mid-day meal programs for school-going children, and nutrition supplementation programs. By far the biggest nutrition supplementation program is the Integrated Child Development Services (ICDS). The ICDS program aims to provide child growth monitoring, supplementary feeding, and pre-school education to young children, along with some basic health services to young children, pregnant women and lactating mothers. With support from UNICEF and other donors, it has emerged from small beginnings in 1975 to become India’s flagship program in these areas. The program has expanded rapidly: the number of blocks covered rose from 33 in 1975, to 4,200 around 2000, and over 5,500 in 20036. During the 1990s,
1 IIPS 2000: Table 7.17 and Figure 7.3. The Government of India (1999) estimated that 33% of newborns were of low birthweight, constituting 35% of the total low birthweight children in the developing world (Department of Women and Child Development, cited in Greiner and Pyle, 2000.) 2 See for example Esrey et al.1990, and Scrimshaw and SanGiovanni 1997. 3 There is a large literature on this, but see the review and analysis in Behrman et al. 2004. 4 Initiated under wartime rationing during the Second World War, this has expanded greatly thereafter (Nawani 1994). 5 Over the years, these programs have been variously re-named and re-structured, including into the National Rural Employment Program and the Rural Landless Employment Guarantee Program, which were merged in 1989 into the Jawahar Rozgar Yojana and as of 2001 re-formulated into the Sampoorna Grameen Rozgar Yojana. Sources: Government of India, Planning Commission (no date), and Government of India, Ministry of Rural Development (no date). 6 Greiner and Pyle 2000:5, Government of India 2000, and Parliament of India 2003.
2
there was almost a doubling in the number of beneficiaries as well as in the program budget (Government of India 2000). By 1999-2000, the budgetary allocation for the program was around $170 million. This is a substantial budgetary outlay, even if not large in per capita terms. It will increase rapidly in the near future, as the government aims to cover all administrative blocks.7 It is perhaps the largest program of the kind in the world. The combination of economic growth, agricultural surpluses, and a slew of programs aimed at increasing access to food might be expected to yield more than a modest decline in child malnutrition. To begin to unravel this puzzle, we examine the functioning of the ICDS program, which seeks to directly provide nutritional supplementation to children in need. Given the importance of the program’s objectives and the size of the budget, it is important to assess whether it is effective in its main objective of enhancing child nutritional status. One of the crucial determinants of program success is program placement: whether the ICDS centers are allocated to the areas with the highest level of malnutrition. Despite the importance of this problem, there has been little formal analysis of program placement. The effectiveness of program placement is therefore the main focus of our analysis. Program efficacy depends also on how well it is implemented once it is in place. This is more difficult to evaluate formally, due to a lack of prospective data on recipients and non-recipients of the program. Several studies have sought nevertheless to evaluate program impact, but most compare outcomes between areas where the program is present and those where it is not ⎯ without controlling for differences in the characteristics of the children, households and villages that could bias the estimates of program effect.8 We use a more rigorous methodology to ensure that the children in the “treatment” and “control” villages are matched along a wide range of dimensions, but conclusive impact evaluation depends on collecting panel data. We begin by summarizing findings on the success of nutrition supplementation programs elsewhere, and information from studies monitoring the implementation of the ICDS program. We then (1) examine trends in child malnutrition in different socio-economic groups, (2) analyze whether the ICDS program placement is consistent with its goals of reducing child malnutrition, and (3) evaluate its impact on child anthropometric outcomes as best possible given the available data. The analysis is based on the National Family Health Surveys (NFHS) 1992-93 and 1998-99, which have information on child anthropometry as well as much information on the child, the mother, the household, and the village: including whether an ICDS program was in place in the village. We find that a major reason why the ICDS program has had little apparent impact on aggregate child nutrition levels is that it is regressively distributed across states: states
7 Government of India, 2000. Estimates vary: according to Greiner and Pyle (2000:19) in 1998-99, the Central Government expenditure on ICDS was about $230 million. 8 Amongst the national level studies, see NIPCCD 1992, and Deolalikar 2004.
3
with the highest prevalence of child malnutrition have the lowest coverage by the program and receive the lowest funding for it. Within states, the distribution seems to be more progressive. It also appears that where the program is in place, its impact is hindered by the widely noted problems with program implementation: our attempt to evaluate the program’s impact shows little evidence of impact on child nutritional status. These findings suggest that evaluations of nutritional supplementation programs ⎯ and more generally intervention programs ⎯ in India and elsewhere need to carefully examine the effectiveness and political economy of program placement. 2. Background The experience with nutrition supplementation programs Nutritional supplementation programs have been tried in many settings, and their outcomes have been mixed. Programs which seek to achieve highly specific forms of supplementation (such as salt iodization or Vitamin A doses) offer many examples of success not only under controlled conditions but also in actual implementation in some large programs.9 For example, it is estimated that goiter rates halved in the PRC after their national salt iodization program (Gillespie and Haddad (2001:25). Broader efforts to improve children’s nutritional status through providing complementary inputs of foods with higher density of energy and/or other nutrients have been found to be successful in some controlled trials, but of limited or little effectiveness in others (Gillespie and Haddad (2001:17). Some longitudinal community-based projects have improved child growth by delivering supplementary feeding through intensive efforts in small areas, which would be very difficult to replicate on a larger scale. A study in Guatemala found that children in villages with supplementary feeding had higher growth than those without it (Guzman et al. 1968). The same was found in a study in Haiti, which had temporary targeted supplementary feeding for children with growth faltering (Berggren et al. 1985). But there is little evidence of the impact of large-scale programs for supplementary feeding. Reviews10 find that these show little evidence of success due to a variety of problems, including leakage; inadequate institutional capacity to meet the formidable challenges of implementing such programs on a wide scale; and inadequate effort to target needy children at the optimal ages for influencing growth. An exception is the Progresa program in Mexico, which is estimated to have had a significant positive impact on the growth of the poor children targeted for the intervention (Behrman and Hoddinott 2001). The ICDS program 9 See for example the reviews by Allen and Gillespie 2001, and Gillespie and Haddad 2001. See also Rogers and Coates’ (2001) annotated bibliography. 10 Kennedy and Alderman 1987; Beaton and Ghassemi 1982, Anderson et al. 1981, and Allen and Gillespie 2001: 69-87, and Appendix 1.
4
The government of India started the ICDS program in 1975, with support from UNICEF. The government perceives child development to be hindered by “poverty, poor environmental sanitation, disease, infection, inadequate access to primary health care, and inappropriate child care and feeding practices” (Government of India, 2000). The ICDS programs aims to alleviate some of these problems by providing a holistic package of services, including: • Supplementary nutrition and some basic health services for children aged below 6 years, and pregnant and lactating mothers • Nutrition and health education for mothers, and • Growth monitoring, de-worming, and pre-school education for children. To do this, ICDS (Anganwadi) centers are established in villages in selected administrative blocks. Most of these are in rural and tribal areas: only 6 percent of the sanctioned ICDS blocks in 2003 were in urban slums (Parliament of India 2003). The center is staffed by an anganwadi worker (AWW) whose task is to provide some services directly to a rotating roster of children and pregnant women. Health and nutrition education is given by visiting homes of women who are pregnant or have infant children. The worker is also expected to liaise with other frontline workers, in particular from the health department, to assure that children and pregnant women receive key frontline MCH services, including immunization, health check-ups, and referral services. They are responsible also for ensuring ancillary health services, such as distributing folic acid to pregnant women, and de-worming children. A large number of monitoring studies11 indicate that the ICDS program has many problems with implementation, as well as program design. One major implementation problem is that AWWs are inadequately trained, supervised and supported, while their duties require considerable understanding of nutrition, pre-school education, and maternal and child health issues. A second problem is erratic provision of supplies12, and leakage in food procurement. Thirdly, the food supplementation is poorly targeted: it is not confined to malnourished children, and reaches mostly children aged 4-6 years old, who are past the optimal window for influencing growth.13 Problems of program design include a lack of community participation (Greiner and Pyle 2000). The program is run in a very top-down fashion, with all the logistical and implementational inefficiencies and rigidities that such an approach entails, and workers are not accountable to the communities they serve. Also, the heavy focus of the ICDS on nutritional supplementation leads to the relative neglect of other more cost-effective approaches to improving nutrition outcomes. This would include efforts to improve
11 See, for example, NIPCCD 1992, NCAER 2001, Allen and Gillespie 2001, Greiner and Pyle 2000, and Bredenkamp 2004. 12 A national evaluation (NIPCCD 1992) in 1992 found that the average AWC was without food for 20 percent of the time, and for more than a quarter of the AWCs this was for over 30 percent of the time. 13 Allen and Gillespie 2001:36. Many of these problems were addressed in Tamil Nadu’s modification of the ICDS program (TINP), which halved the prevalence of severe malnutrition in the villages in which it was implemented by targeting the food to the needy and requiring them to eat it on the premises instead of taking it home to share with others (Heaver 1989, Greiner and Pyle 2000).
5
environmental hygiene and domestic health management practices, so that children are less exposed to disease and its consequent toll on child growth.14 3. Data and Definitions This paper uses the data from the two rounds of the National Family Health Surveys (NFHS) conducted in India during 1992/93 and 1998/99. The surveys cover all the states of India (with the exception of Sikkim in 1992/93, a total of 26 states at the time of survey), and the survey samples are designed to ensure that the data is representative at the state level.15 Both surveys target about 90,000 households each, and approximately the same number of ever-married women was interviewed. NFHS-1 (92/93) and NFHS-2 (98/99) use three types of questionnaire: the Village, Household, and the Woman’s Questionnaire. The Village Questionnaire collected information on the availability of various facilities in the village and amenities such as electricity and telephone connections, and type of the drainage system. Respondents to the Village Questionnaire were also asked about development and welfare programs operating in the village. In particular, the Village Questionnaire identifies the villages that received the Integrated Child Development Services (ICDS) Program. The Household Questionnaire includes information on age, sex, education, employment status, occupation, marital status, and relationship to the head of the household for each household member. It inquires about household dwelling conditions and the ownership of various assets. Information is also obtained on religion and caste/tribe of the household head. At the same time, the Household Questionnaire does not include any direct measures of household income or consumption expenditure. The Woman’s Questionnaire gathers information from all ever-married women age 15-49 who were usual residents of the sample households or visitors who stayed in the sample households the night before the interview. The questionnaire collects information about woman’s education, age at marriage, reproductive behavior, child feeding practices and other background characteristics. In addition, measurements of height and weight were obtained for all young children in a household to assess their nutritional status.16
14 See, for example, Esrey et al.1990, Scrimshaw and SanGiovanni 1997, Allen and Gillespie 2001:26, Black et al. 1984, and the review of studies in Bhan et al 2001. 15 The 1998/1999 survey is also intended to provide estimates at the regional level for four states (Bihar, Madhya Pradesh, Rajastan, and Uttar Pradesh) and estimates for three metro cities (Calcutta, Chennai, Mumbai), as well as slum areas in Mumbai. 16 While NFHS-1 collected measurements of weight and height for children born in the four years preceding the survey, NFHS-2 did it for children born in the three years preceding the survey. In NFHS-2 13 percent of eligible children were not measured, either because the child was not at home, or because the mother refused to allow the measurement. Also excluded from the analysis are respondents whose month and year of birth are not known, and those with grossly improbably height or weight measurement. NFHS-2 also collected anthropometrical information on the mothers. NFHS-1 did not collect the height measurement data in five states: Andhra Pradesh, Himachal Pradesh, Madhya Pradesh, Tamil Nadu and West Bengal.
6
The information on the access to ICDS programs is available only at the village level. There is no information on which households and children within the village have actually benefited from the program. Main constructed variables To assess household economic status in the absence of household income or expenditure data we construct, following the methodology of Filmer and Pritchett (2001), a linear index from a set of asset indicators using principal components analysis to derive the weights for each asset indicator. Our economic status index is the fist principal component of a number of household assets such as clock, radio, TV, VCR, refrigerator, ownership of bicycles, motorbikes, cars, as well as the type of utilities used in the household. The first principal component is an unobserved vector that explains the largest amount of variability in the observed data. The household assets based first principal component derived from NFHS-1 data accounts for 29.6 percent, and from NFHS-2 for 28.3 percent of the total variance of the relevant variables17. Availability of electricity, flush toilet, TV, and ceiling fan are the most influential variables in the estimation of the index. This finding is consistent across both surveys. The distribution of other factors in relationship to the economic status index also makes economic sense. For example, households with a higher wealth index are more likely to live in pucca (brick) houses, and have such amenities as refrigerator, motorbike and radio. They are less likely to use kerosene for lightning and wood for cooking, as well as utilize unsafe drinking water. Our main indicators of children’s nutritional status are two indices that are commonly used to assess this from anthropometrical data. These indices are expressed in standard deviation units (z-scores) from the median for the international reference population (Dibley et al 1987a, 1987b).18 Height-for-age z-score (HAZ) and weight-by-age z-score (WAZ) are defined as (mi-mr)/σrm, where mi is the observed height (weight) of a child of a specified age and gender, mr is the median height (weight), and σr is the standard deviation of the corresponding measurement for the reference population of children in that age-gender group. Low height-for age (stunting) reflects chronic under-nutrition and/or repeated bouts of illness. Low weight-for-age (underweight) reflects either or both acute and chronic malnutrition and /or illness. Children who are over two standard deviations below the median of the reference population in terms of these indices are considered to be severely to moderately under-nourished (stunted or underweight). Anthropometric measurements are, of course, just one way of measuring nutrition
17 The first principal component based on NFHS-1 data in Filmer and Pritchett (1998) explains 25.6 percent of total variation. However, their calculation was using a slightly different and smaller set of variables. 18 This standard is recommended by the WHO, and the Nutrition Foundation of India (Agarwal et al., 1999) has concluded that it is generally applicable to Indian children (NFHS II India report, page 265). The use of this reference group is based on the empirical finding that well-nourished children in all population groups for which data exist follow very similar growth patterns (Martorell and Habicht 1986).

7
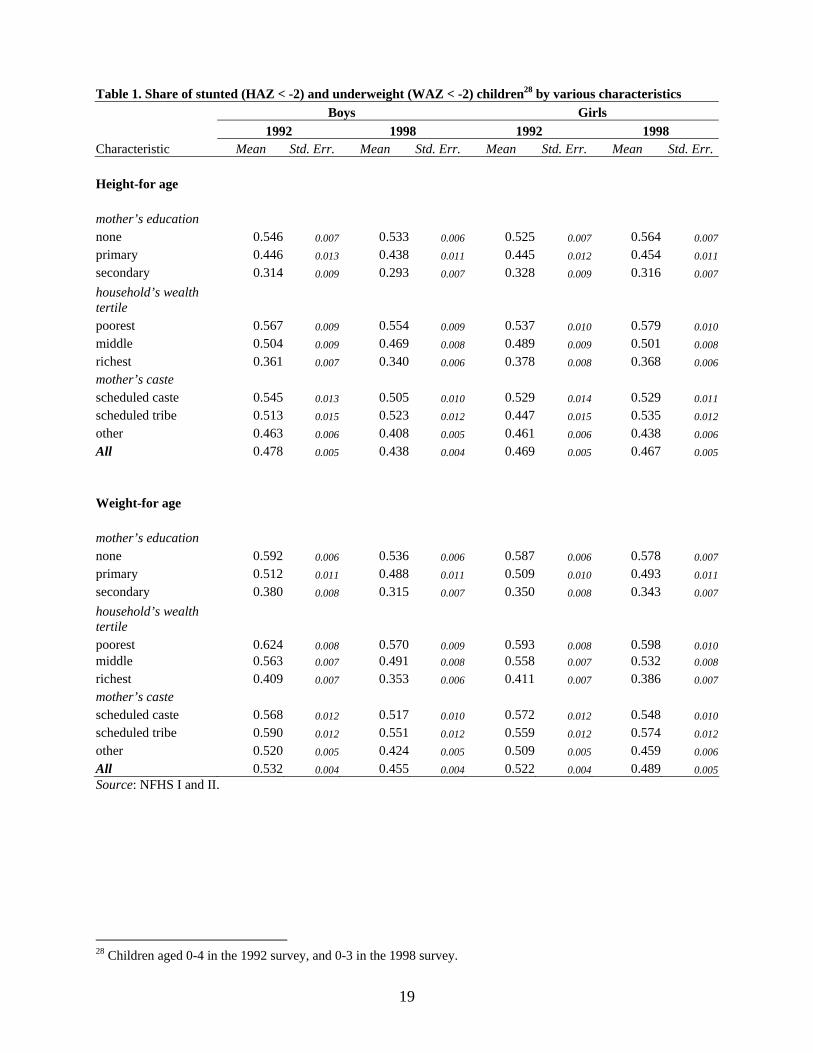
outcomes. Their use has been debated,19 but they remain the simplest measure to obtain with any accuracy from a large population, and therefore the most commonly used by both researchers and clinicians. 4. Trends in Child Malnutrition between 1992 and 1998: Gainers and Losers It is striking to see how widespread is the incidence of underweight amongst children in India. Even amongst boys (the sex in which parents invest the most) in the highest wealth tertile in 1998, over a third were underweight. This tertile has an average caloric consumption of around 2500 calories per day,20 so child malnutrition cannot be attributed to shortage of food. High burdens of disease are the probable cause of these high proportions underweight. Children’s nutritional status grows sharply worse amongst lower socio-economic groups (Table 1). Looking at differences by mother’s education level, in 1998 the share of stunted boys amongst mothers with no education was 53 percent, compared with 29 percent among mothers with secondary or higher levels of education. The corresponding shares of underweight boys were 54 percent and 32 percent, respectively. The differences by household wealth tertiles are equally sharp: for example in 1998, 35 percent of boys from the richest tertile were underweight, compared with 57 percent amongst the lowest tertile. Differences between castes are less sharp, though the boys of upper castes show better outcomes than lower castes or tribes. The higher socio-economic groups also made stronger gains in child nutrition status during 1992-98 than the lower groups. The gains are especially strong amongst the boys of mothers with secondary school education and above, compared with lower education groups. The same applies to the upper castes versus the lower castes and tribes. Household wealth groups show less differences in improvement during1992-98. Girls’ position deteriorated relative to boys between 1992 and 1998: they had similar or marginally lower proportions stunted and underweight as boys in 1992, but by 1998 girls were nutritionally more disadvantaged than boys across all socio-economic groups. Girls from the highest socio-economic groups showed improvement in nutritional status between 1992 and 1998. Amongst most of the other socio-economic groups, girls showed much more modest declines in the prevalence of underweight. There was an increase in the proportion underweight amongst girls in the poorest wealth tertile and the scheduled tribes, and in the prevalence of stunting amongst girls in all the lower socio-economic groups. This suggests that levels of discrimination against girls may actually have risen amongst the lower socio-economic status groups between 1992 and 1998: including uneducated mothers and poorer households. It has risen sharply amongst the tribal populations. This could be because people are reducing family size in India ⎯ which, combined with
19 See, for example, Kumar and Stewart. 20 World Bank 2005, citing data from the National Sample Survey Organisation, 2001.
8
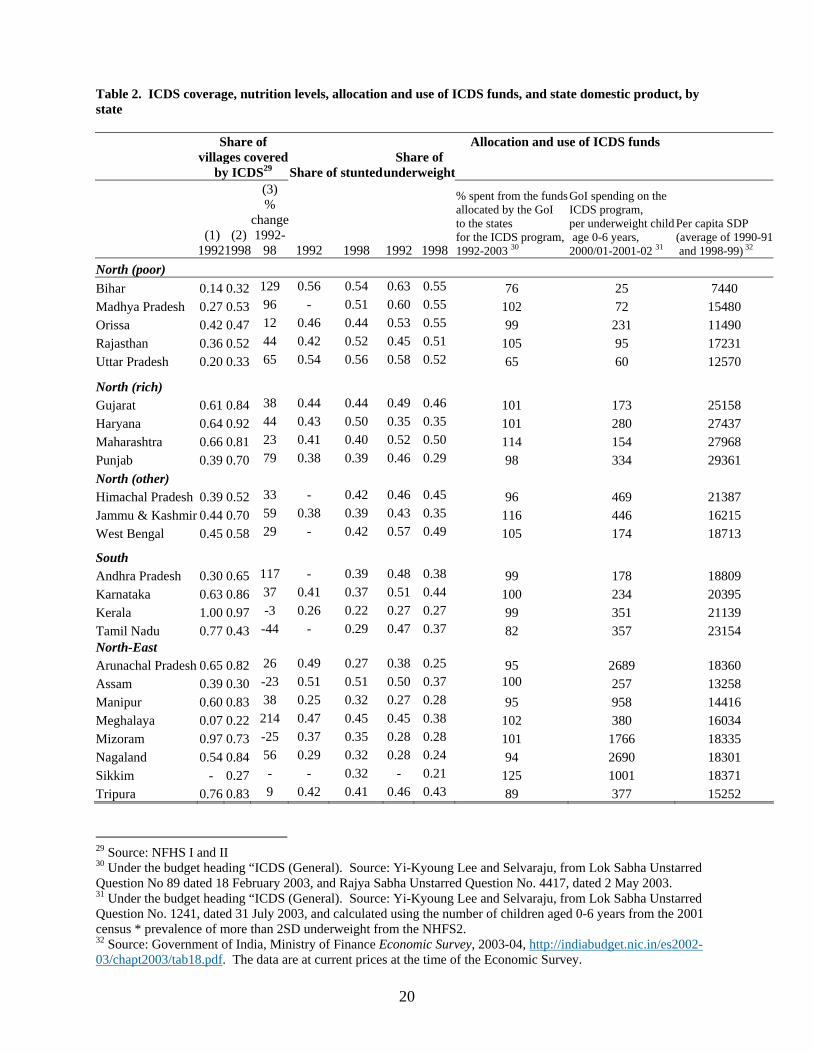
strong son preference, puts pressure on reducing the number of girls in the family.21 Higher socio-economic groups have greater access to sex-selective abortion, and are therefore in a position to care more equally for the children that are born. Lower socio-economic groups have limited access to prenatal sex selection technology, and this may lead to unequal treatment of children who are unwanted. There is, for example, considerable evidence that girls are less likely than boys to be taken for medical treatment, and the quality of treatment sought also differs ⎯ which could impact on their anthropometric status. 5. Assessment of the ICDS’ Program Placement Coverage of the ICDS program is high: a substantial proportion of India’s villages are covered by the ICDS today, and this number rose sharply during the 1990s. Of the villages sampled by the NFHS, a third had an ICDS program in place in 1992, and more than a half of the surveyed villages had it in 1998 (Table 2). A few states, notably Kerala, had virtually complete coverage already by 1992. Program coverage is especially high in the southern region, the northeastern region, and the non-poor states of the northern region. The apparent decline in coverage in Tamil Nadu during the 1990s is probably the result of re-classification of the nutritional supplementation program to the TINP (Tamil Nadu Integrated Nutrition Program), which is broadly similar in concept to the ICDS. (i) Program placement across states For ease of discussion, we have grouped India’s states by region: the South, the Northeast,22 and the North. Since the Northern region is vast and highly heterogeneous ⎯ comprising both the poorest and the richest states in the country ⎯ we have divided them into the “poor North” (Bihar, Uttar Pradesh, Orissa, Madhya Pradesh and Rajasthan), “rich North” (Punjab, Haryana, Gujarat and Maharashtra)23 and “other North” (Himachal Pradesh, Jammu & Kashmir, and West Bengal) (Table 2). The poor Northern states have some of the poorest outcomes in the country not only in nutrition, but also in terms of education and child survival, reflecting a history of poor governance. The need for the program varies substantially across states (Table 2). It is especially high in the poor Northern states, where over half of the children aged below 3 were moderately or severely underweight. These are large states, with well over 40 percent of the population of the country, and therefore contribute a high proportion of the total malnourished children in the country. At the other end of the spectrum are states such as Kerala and several of the northeastern states, with the lowest levels of child malnutrition. The northeastern states tend also to have good human development indicators in terms of
21 Das Gupta and Bhat 1997. On son preference more broadly, see Miller 1981, Dyson and Moore 1983, and Das Gupta 1987. On gender differentials in tribal populations, see Maharatna 2000. 22 Sikkim is not included where data are required for 1992, since these are not available. 23 By the time of the 2001 Census, Uttar Pradesh, Madhya Pradesh, and Bihar had some additional states carved out of them: Uttaranchal, Chhattisgarh, and Jharkhand respectively. To facilitate inter-survey comparison, we use the old state definitions.
9
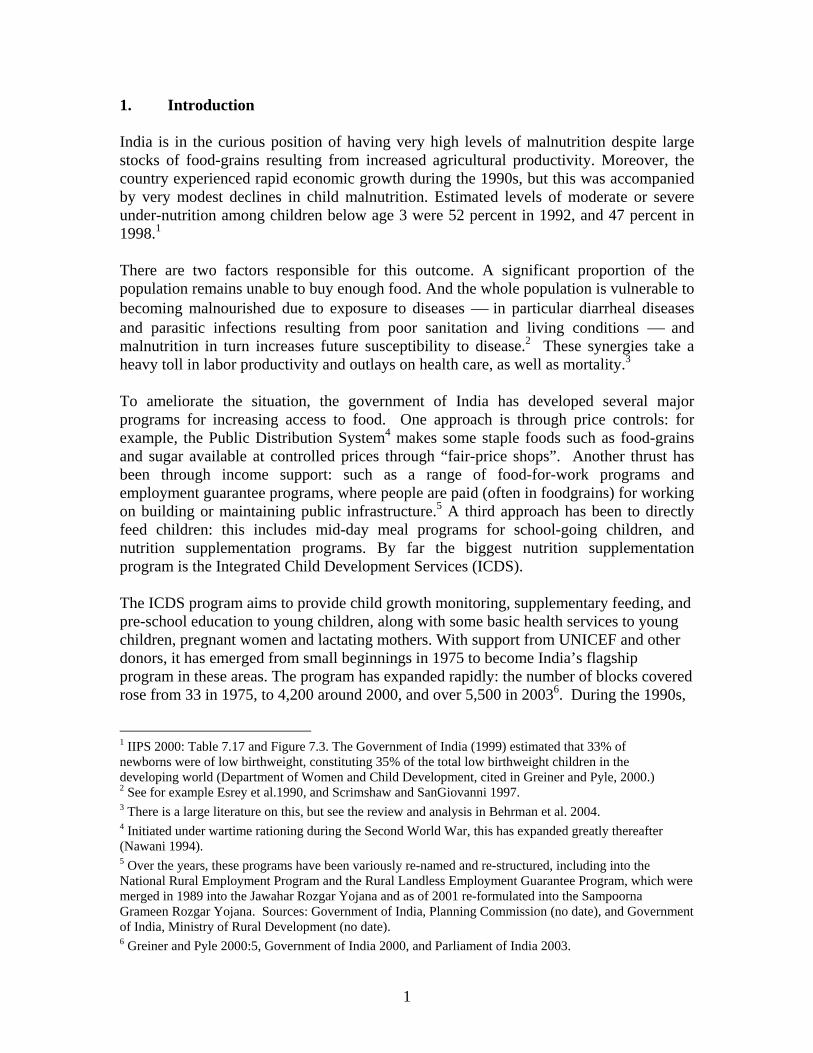
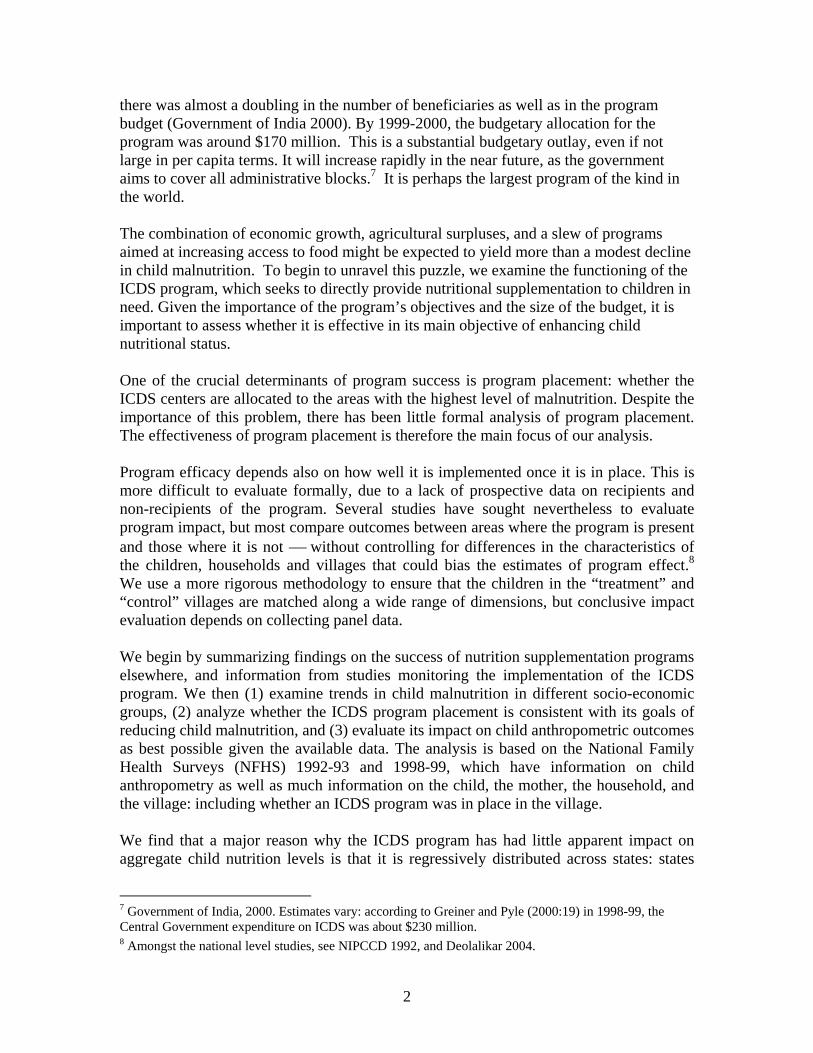
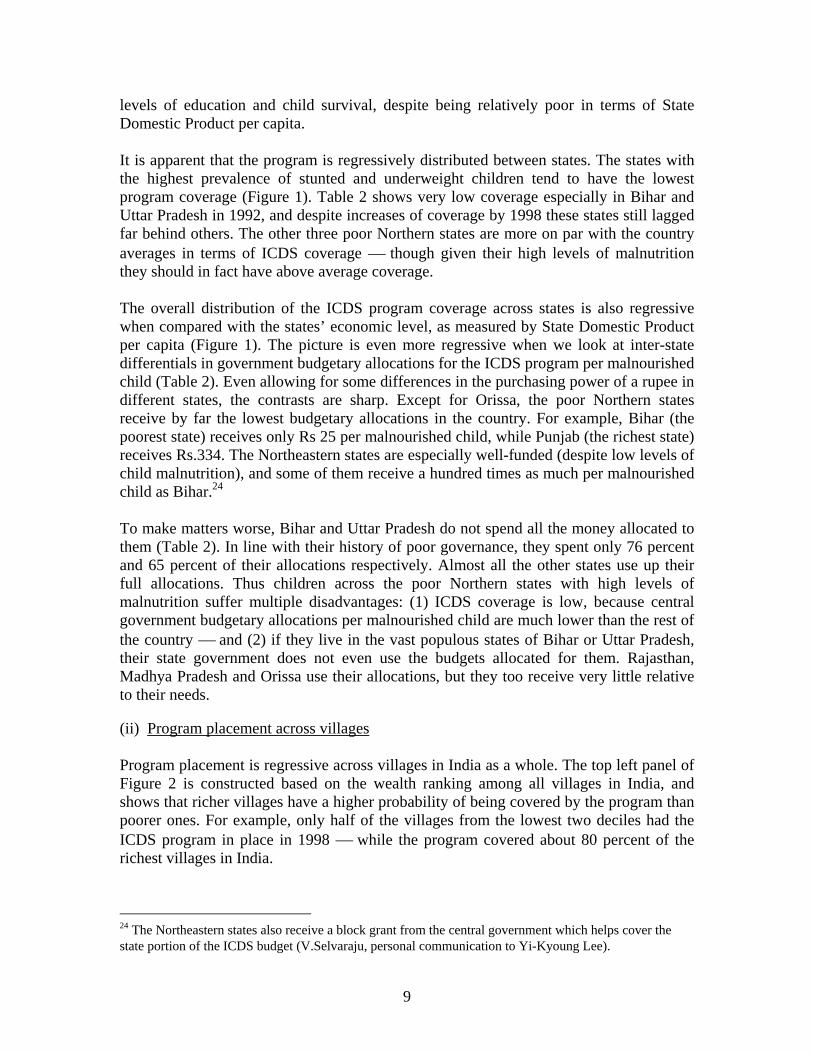
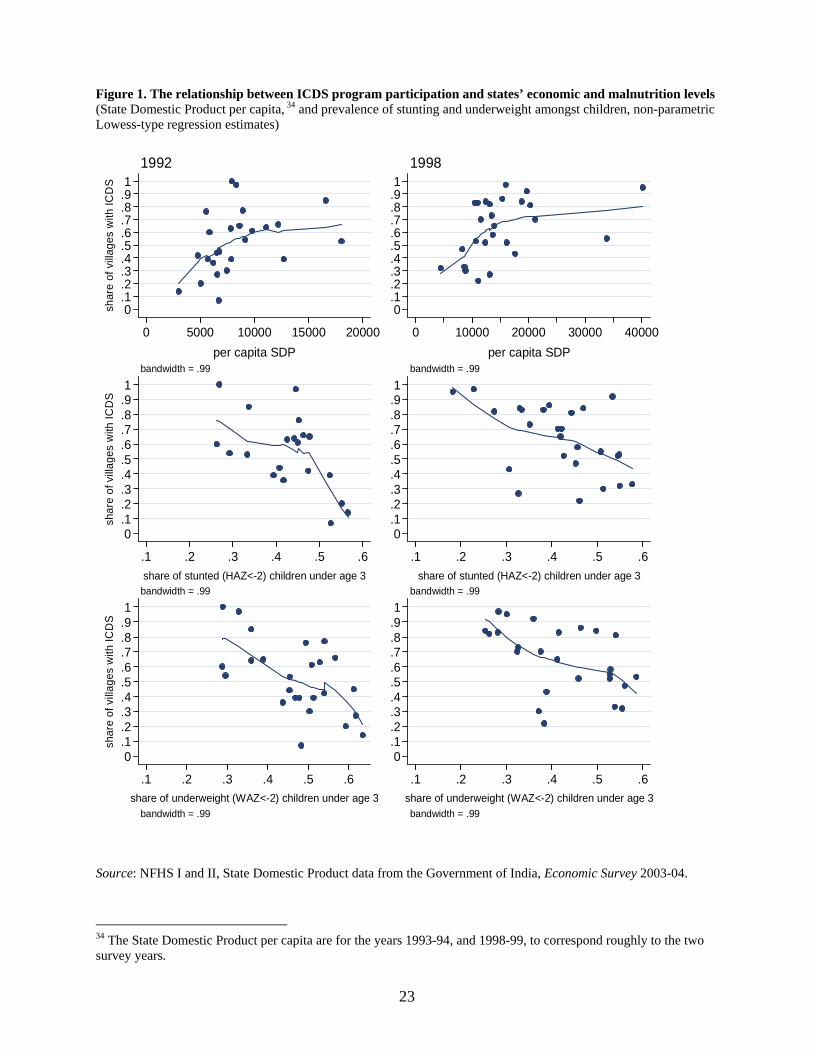
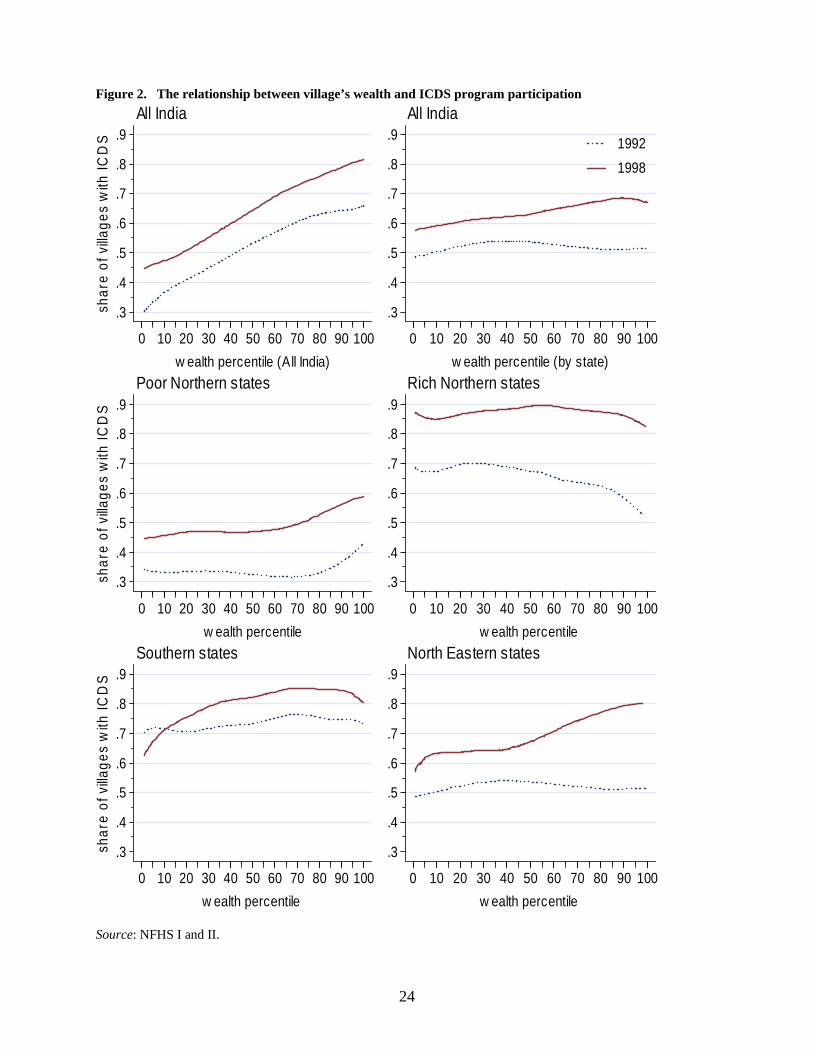
levels of education and child survival, despite being relatively poor in terms of State Domestic Product per capita. It is apparent that the program is regressively distributed between states. The states with the highest prevalence of stunted and underweight children tend to have the lowest program coverage (Figure 1). Table 2 shows very low coverage especially in Bihar and Uttar Pradesh in 1992, and despite increases of coverage by 1998 these states still lagged far behind others. The other three poor Northern states are more on par with the country averages in terms of ICDS coverage ⎯ though given their high levels of malnutrition they should in fact have above average coverage. The overall distribution of the ICDS program coverage across states is also regressive when compared with the states’ economic level, as measured by State Domestic Product per capita (Figure 1). The picture is even more regressive when we look at inter-state differentials in government budgetary allocations for the ICDS program per malnourished child (Table 2). Even allowing for some differences in the purchasing power of a rupee in different states, the contrasts are sharp. Except for Orissa, the poor Northern states receive by far the lowest budgetary allocations in the country. For example, Bihar (the poorest state) receives only Rs 25 per malnourished child, while Punjab (the richest state) receives Rs.334. The Northeastern states are especially well-funded (despite low levels of child malnutrition), and some of them receive a hundred times as much per malnourished child as Bihar.24 To make matters worse, Bihar and Uttar Pradesh do not spend all the money allocated to them (Table 2). In line with their history of poor governance, they spent only 76 percent and 65 percent of their allocations respectively. Almost all the other states use up their full allocations. Thus children across the poor Northern states with high levels of malnutrition suffer multiple disadvantages: (1) ICDS coverage is low, because central government budgetary allocations per malnourished child are much lower than the rest of the country ⎯ and (2) if they live in the vast populous states of Bihar or Uttar Pradesh, their state government does not even use the budgets allocated for them. Rajasthan, Madhya Pradesh and Orissa use their allocations, but they too receive very little relative to their needs. (ii) Program placement across villages Program placement is regressive across villages in India as a whole. The top left panel of Figure 2 is constructed based on the wealth ranking among all villages in India, and shows that richer villages have a higher probability of being covered by the program than poorer ones. For example, only half of the villages from the lowest two deciles had the ICDS program in place in 1998 ⎯ while the program covered about 80 percent of the richest villages in India.
24 The Northeastern states also receive a block grant from the central government which helps cover the state portion of the ICDS budget (V.Selvaraju, personal communication to Yi-Kyoung Lee).
10
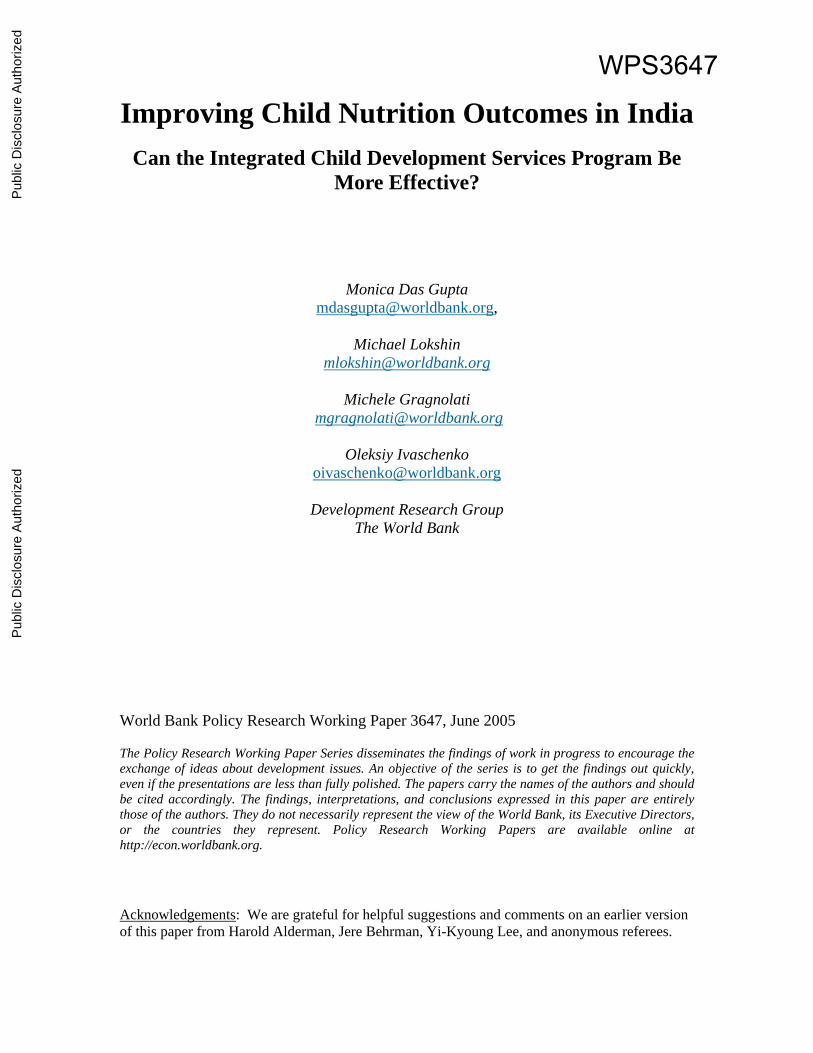
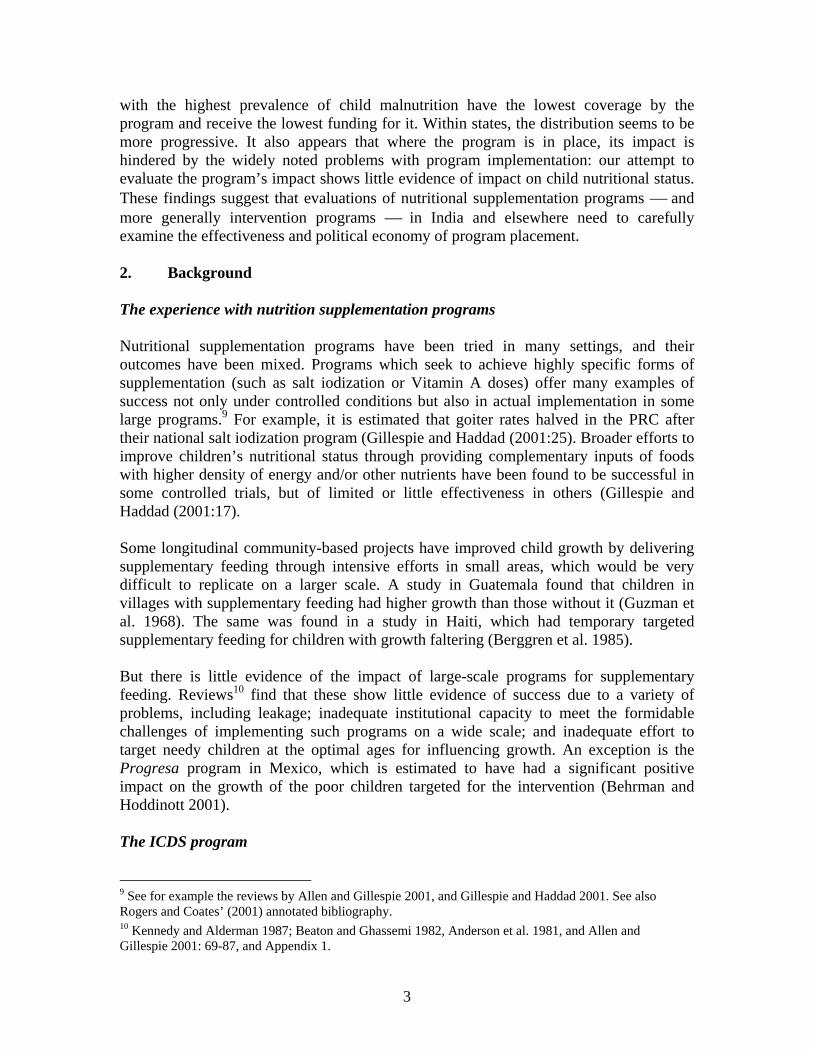
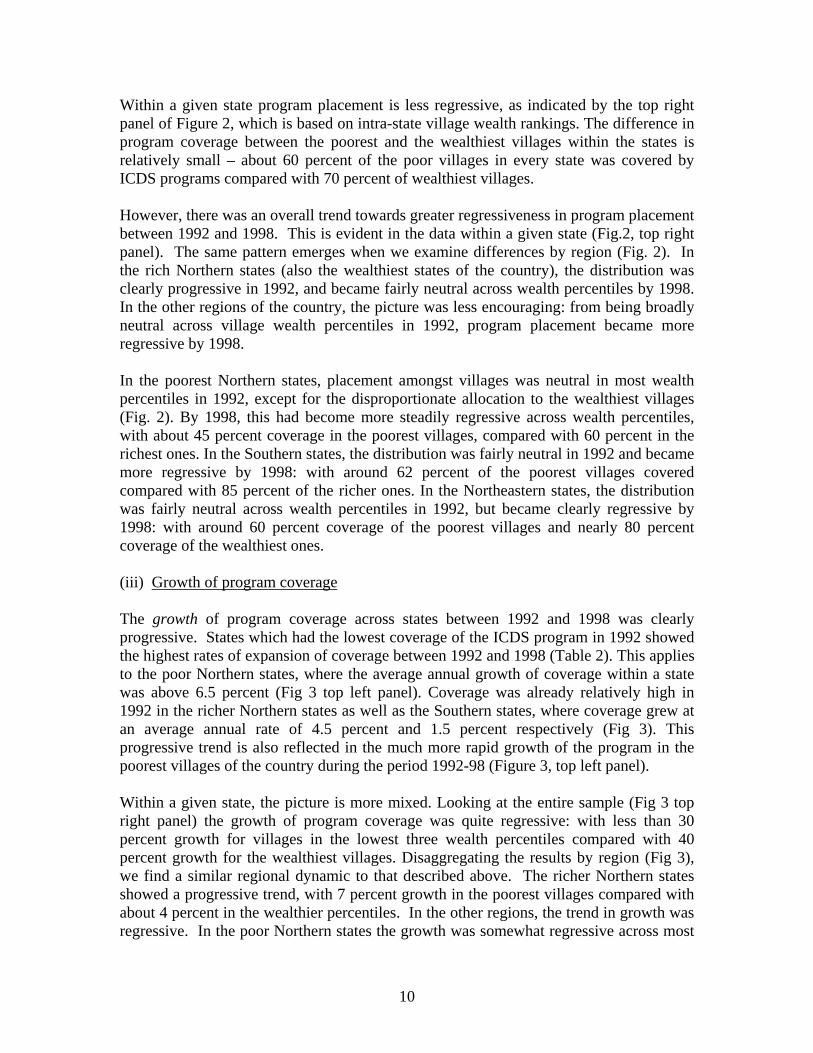
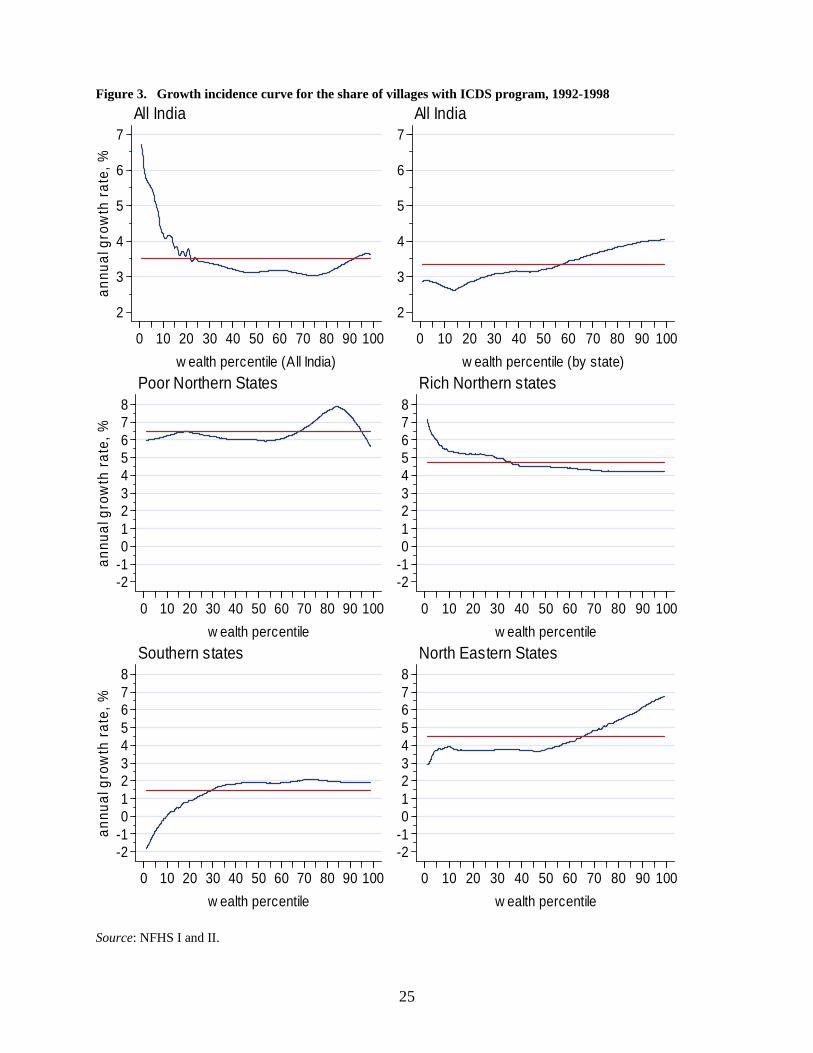
Within a given state program placement is less regressive, as indicated by the top right panel of Figure 2, which is based on intra-state village wealth rankings. The difference in program coverage between the poorest and the wealthiest villages within the states is relatively small – about 60 percent of the poor villages in every state was covered by ICDS programs compared with 70 percent of wealthiest villages. However, there was an overall trend towards greater regressiveness in program placement between 1992 and 1998. This is evident in the data within a given state (Fig.2, top right panel). The same pattern emerges when we examine differences by region (Fig. 2). In the rich Northern states (also the wealthiest states of the country), the distribution was clearly progressive in 1992, and became fairly neutral across wealth percentiles by 1998. In the other regions of the country, the picture was less encouraging: from being broadly neutral across village wealth percentiles in 1992, program placement became more regressive by 1998. In the poorest Northern states, placement amongst villages was neutral in most wealth percentiles in 1992, except for the disproportionate allocation to the wealthiest villages (Fig. 2). By 1998, this had become more steadily regressive across wealth percentiles, with about 45 percent coverage in the poorest villages, compared with 60 percent in the richest ones. In the Southern states, the distribution was fairly neutral in 1992 and became more regressive by 1998: with around 62 percent of the poorest villages covered compared with 85 percent of the richer ones. In the Northeastern states, the distribution was fairly neutral across wealth percentiles in 1992, but became clearly regressive by 1998: with around 60 percent coverage of the poorest villages and nearly 80 percent coverage of the wealthiest ones. (iii) Growth of program coverage The growth of program coverage across states between 1992 and 1998 was clearly progressive. States which had the lowest coverage of the ICDS program in 1992 showed the highest rates of expansion of coverage between 1992 and 1998 (Table 2). This applies to the poor Northern states, where the average annual growth of coverage within a state was above 6.5 percent (Fig 3 top left panel). Coverage was already relatively high in 1992 in the richer Northern states as well as the Southern states, where coverage grew at an average annual rate of 4.5 percent and 1.5 percent respectively (Fig 3). This progressive trend is also reflected in the much more rapid growth of the program in the poorest villages of the country during the period 1992-98 (Figure 3, top left panel). Within a given state, the picture is more mixed. Looking at the entire sample (Fig 3 top right panel) the growth of program coverage was quite regressive: with less than 30 percent growth for villages in the lowest three wealth percentiles compared with 40 percent growth for the wealthiest villages. Disaggregating the results by region (Fig 3), we find a similar regional dynamic to that described above. The richer Northern states showed a progressive trend, with 7 percent growth in the poorest villages compared with about 4 percent in the wealthier percentiles. In the other regions, the trend in growth was regressive. In the poor Northern states the growth was somewhat regressive across most
11
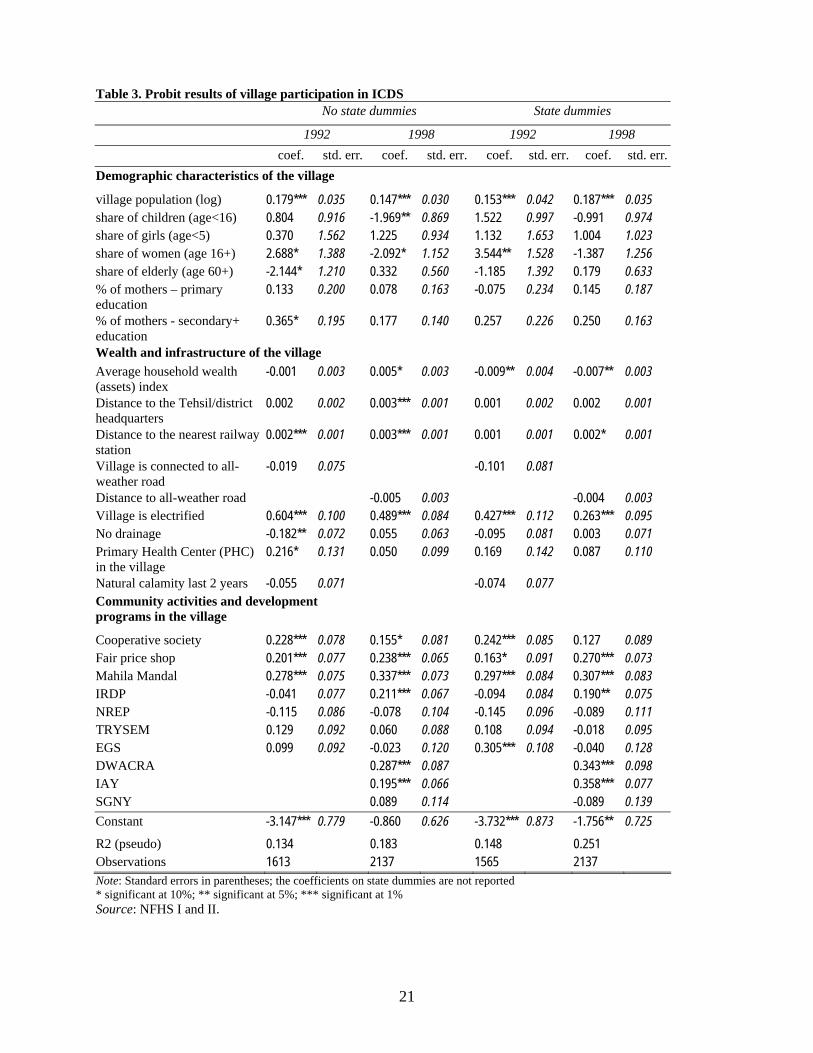
of the village wealth percentiles, except that the wealthiest villages showed lower growth than the others. In the Southern states, the poorest villages showed almost 2 percent decline in coverage while villages in the fortieth wealth percentile and above showed about 2 percent growth. The Northeastern states showed a mildly regressive trend, with 2-3 percent growth amongst the poorer villages and 4 percent in the richest villages. (iv) Probability of program placement by village characteristics The observed presence of the ICDS program in a village could be interpreted as a result of two processes: program placement and program retention. The official policy of the Government of India is to place the ICDS program in poorer administrative blocks and villages, with a preference for larger villages where an ICDS center can have a larger population to serve. However, a number of factors could in practice modify the application of these placement criteria: for example, politicians may seek to corner benefits for their own electorate at the cost of more deserving candidates; and officials may seek to select villages which are easily accessible and have good infrastructure conditions to work in. A village’s ability to retain the program depends on its ability to create good conditions for its functioning. There are many ways in which the levels of local cooperation are critical to making it possible for the anganwadi worker (AWW) to function. A good space has to be made available for the center. It also helps if the community is willing to help the anganwadi worker overcome difficulties encountered in her work: such as accessing water supplies, reaching the more difficult households, or rounding up children for immunization drives. Anganwadi workers operate under difficult conditions, far from their superiors, so communities which are better at offering such support are more likely to be able to retain the program. The probability of program retention is likely to be indicated by the presence of other development programs in the village, which implies that there is a network of formal agents in place to provide occasional support to the AWW, and also that the village is able to retain development programs in general. Community capacity for collective action is also indicated by the presence of cooperatives and women’s associations. We model the probability that a village is selected into the ICDS program as a function of various village characteristics, using the standard probit framework. The dependent variable is a binary indicator of whether there is an ICDS center in a village. The explanatory variables include the village’s demographic characteristics, wealth, distance from towns and transport connections, infrastructure, and the presence of other development programs and community associations. The results of this estimation are shown in Table 3, with and without state dummies. These results confirm the results from the descriptive analysis, that program placement is regressive between states: the estimations without the control for the state-specific characteristics demonstrate a neutral (in 1992) and pro-rich (1998) bias in placement. However, they show more clearly than the descriptive results that placement is progressive within a given state: when the state dummies are introduced, villages with
12
lower average household wealth index were significantly more likely to have the program. Within a given state, villages with larger populations and villages with electricity are significantly more likely to have the program. Villages that have development programs such as employment generation programs and “fair price shops’ (selling foodgrains and a few other basic food items at controlled prices), and women’s associations (Mahila Mandals) have a higher probability of being selected into the program. At the same time, such characteristics as the village’s distance to the district centers, accessibility, and the average level of women’s education are not significantly related to the probability of placement in either year. Our results support the view that program placement follows the official policy of giving preference to villages in poorer administrative blocks, with larger population size. If politicians are modifying the application of these guidelines to meet electoral pressures, this is not to an extent that is perceptible in the data. There also seems little evidence that program placement is geared towards officials’ convenience, as the village’s connection to transport networks or distance from the district center does not increase its likelihood of being selected. A village’s likelihood of being selected is also greater if it has other development programs and community associations in place, possibly partly because this indicates the village’s ability to attract as well as to retain development programs. 6. Evaluation of Outcomes: Impact of the ICDS Program We turn now to evaluating whether children living in villages with the ICDS program have significantly different anthropometric outcomes from those living in village without the program. The unconditional distributions of child anthropometric measurements in both the 1992 and 1998 surveys is very similar among children living in villages served by the program, and those living in villages without the program (not shown). This suggests little evidence of program impact on child nutrition outcomes. To investigate this more rigorously, we modeled the impact of the ICDS program on child nutritional status, comparing anthropometric outcomes for the children in the beneficiary villages with those of children from a comparison group of villages. We use the Propensity Score Method, which removes the selection bias due to differences between villages with and without projects (Rubin 1973), to the extent that selection of a village into the program is based purely on observable characteristics. Each child in the villages with the ICDS program (the treatment group in evaluation literature terminology) is paired with one in the villages without the program (the control group), with similar observed characteristics of the child (age, birth order and gender); of the mother (age, education, caste, religion); household wealth; and of the village (population, and development indicators25). We then test for significant differences in nutritional
25 The village development indicators include electrification, drainage, road connection, primary health centre, women’s association, controlled-price shops, and development programs such as the IRDP, EGS and NREP for income-generation.

13
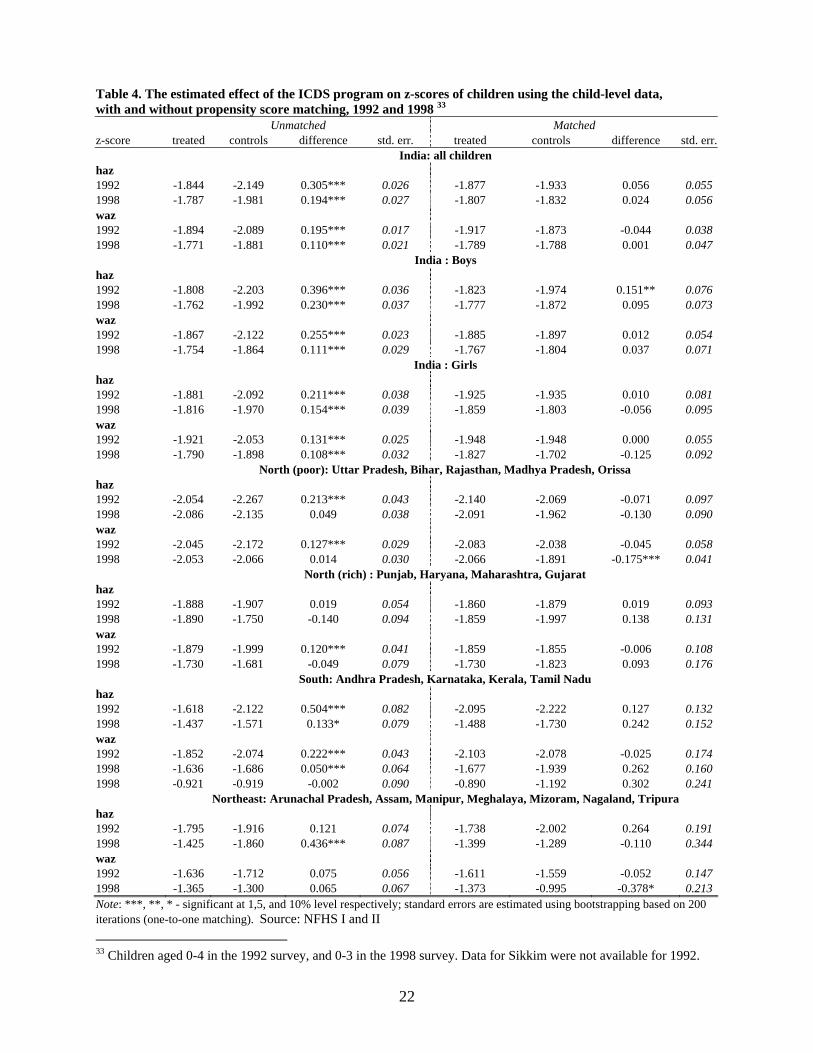
outcomes between the children in the treatment group and their matched counterparts in the control group.26 The results, indicate little overall effect of the ICDS program on nutritional outcomes (Table 4). We find that the only significant effect of the program was a positive effect on boys’ stunting in the data from the 1992 survey, but not in 1998. For girls, the effect was not significant. We disaggregated the results to see whether there are significant effects at regional levels, but found none except a significant negative impact in the poor Northern states, and in the Northeastern states. There, children living in an ICDS village had a higher probability of being underweight in the 1998 survey. Other studies also find little evidence of program impact on child nutritional status. A national study (NIPCCD 1992) found the prevalence of underweight children to be somewhat lower where the program was in place, but given the sample sizes of the control and treatment groups these differences are not statistically significant. Using the 1992 NFHS data, Deolalikar (2004) found that the presence of an ICDS center is associated with a 5 percent reduction in the probability of being underweight for boys, but not for girls. Our results from the same survey are in line with this (Table 4). Using data from a sub-group of states, Bredenkamp (2004) found that the presence of a center has no significant effect. Our results on program impact are not conclusive, because of the absence of panel data on children (or villages) participating in the program. Our method is an improvement on previous studies, because we tried to control for various observed factors that could bias the estimates of the effects of the ICDS programs. However, with cross-sectional data some unobservable household or village characteristics correlated with the program placement and program outcome could introduce bias into the estimates of project impact.27 If, for example, the program were placed in a village because a food shortage was anticipated there, the evaluation procedure would underestimate the effectiveness in the program. Given the available data, we can only say that there is nothing to indicate that the program has had an impact.
26 To measure the difference in nutritional outcomes between the children from the villages with and without the program, we use the standard estimator of the average treatment on the treated defined as: E(z1 –z0| s=1), where z1 is a particular health outcome (z-scores) for the child in the treatment and z0 is a z-score for a child in the control group, and s is the binary indicator equals to 1 if the child resides in the village with the program and 0 otherwise. We can also define the average effect conditional on some set of child’s characteristics x as: E(z1 – z0| s=1,x). Matching estimators require that conditional on a vector of observed characteristics, x, (z1 and z0) are independent of s. Children for whom a match could not be found were dropped from the analysis in order to avoid the primary cause of a bias in a matching estimator (Heckman, Ichimura and Todd 1997, 1998). 27 This problem is thought to be severe for the programs in poor areas if the deficient state of children’s health in the initial period not only attracts the program, but also reduces future growth (Jalan and Ravallion 2003).

14
7. Discussion Overall levels of child malnutrition fell slowly in India during the 1990s, although this was a decade of fairly rapid growth in all sectors of the economy. The main gains in nutrition status were among the upper socio-economic groups: among the children of educated mothers, wealthier households, and the upper castes. Girls gained less than boys, and their nutrition status actually worsened among the lower socio-economic groups. The high prevalence of underweight among the children of the highest socio-economic groups (with adequate per capita nutritional intake) indicates that exposure to disease is a major cause of poor child growth, and that it cannot be attributed solely to poverty. And the living conditions of the lower socio-economic groups make them even more exposed to disease than better-off groups. This suggests that it might be more cost-effective for the ICDS program to focus its efforts more on improving environmental hygiene and child feeding practices, to improve child nutritional outcomes. The program currently places heavy emphasis on supplementary feeding, which has been found to be ineffective in many large-scale programs. Program placement is clearly regressive across states. The states with the greatest need for the program ⎯ the poor Northern states with high levels of child malnutrition and nearly half India’s population ⎯ have the lowest program coverage, and by far the lowest budgetary allocations from the central government. To make things worse, two of these states (Bihar and Uttar Pradesh) do not even spend the full funds allocated for this, highlighting issues of poor governance. By contrast, most states spend their allocations. Program placement within a state is more progressive. Placement appears to follow the government guidelines of selecting villages from poorer administrative blocks, with a larger population to serve. Villages which already have other development programs in place, or have community associations, are also more likely to have the program. Infrastructure such as electricity raises the probability of placement, but not distance to district headquarters or access to transport. The application of official guidelines seems to be a stronger determinant of outcomes than considerations of cultivating particular electorates or personal convenience. During the 1990s, when the program expanded very rapidly, the growth of program coverage was progressive across states: it was more rapid in states with the lowest levels of coverage in 1992. However, its distribution within a state became somewhat less progressive during this period. It may be that the rapid program expansion diluted care in selection of villages. This is consistent with monitoring reports which indicate that the rapid expansion led to dilution of program quality on various fronts. The rich Northern states are consistently the most progressive region of India in their program placement, underscoring the fact that the states which least need the program not only get the most funding, but also use the funding the most effectively. There are clearly many issues at play ⎯ including states’ ability to provide matching funds,
15
political clout, and governance ability ⎯ in determining which states are able to attract funds and use them effectively. This needs to be studied carefully in further research. There is little evidence of ICDS program impact on overall child nutrition status. However, these results need to be interpreted with caution. As we indicated above, using cross-sectional data can lead to various kinds of biases in estimations of the effectiveness of the program. A conclusive evaluation of program impact will have to wait until panel data are available. Yet many studies have highlighted problems with the implementation of the ICDS program, which would limit its impact and are consistent with our result. In sum, we find limited evidence that the ICDS program is meeting its goals of reducing child malnutrition in India. Some modifications are needed towards this end. Firstly, program coverage and fund allocation needs to be shifted towards states with the highest prevalence of child malnutrition. Secondly, efforts have to be made to ensure that funds are fully utilized in the few states where this is not the case. Thirdly, the impact of the program on recipients can be enhanced by changing some aspects of program design and implementation. With such changes, the substantial resources allocated to the ICDS can be used more effectively for raising future generations of healthy children. Bibliography Alderman, Harold, Jesko Hentschel, and Ricardo Sabates. 2003. With the help of one’s
neighbors: externalities in the production of nutrition in Peru, Social Science and Medicine, 56: 2019-2031.
Allen, Lindsay H. and Stuart R. Gillespie. 2001. What Works? A review of the efficacy and effectiveness of nutrition interventions, Manila: UN Administrative Committee on Coordination Subcommittee on Nutrition, in collaboration with the Asian Development Bank.
Anderson, Mary Ann, James E. Austin, Joe D.Wray, and Marian F. Zeitlin. 1981. Nutrition Interventions in Developing Countries, Study 1: Supplementary Feeding. Cambridge MA: Oelgeschlager, Gunn and Hain.
Beaton, George, and Hossein Ghassemi. 1982. Supplementary feeding programs for young children in developing countries, American Journal of Clinical Nutrition 34 (supplement):864-916.
Behrman, Jere R. and John Hoddinott. 2001. Program Evaluation with Unobserved Heterogeneity, Selective Implementation and Imperfectly Targeted Beneficiaries: the Mexican Progresa impact on child nutrition. Paper presented at the Northeast Universities Development Consortium (NEUDC) Conference, September 28-30, 2001, Boston.
Behrman, Jere R., Harold Alderman, and John Hoddinott. 2004. Hunger and Malnutrition, Copenhagen Consensus Challenge Paper. (http://www.copenhagenconsensus.com/Files/Filer/CC/Papers/Hunger_and_Malnutrition_070504.pdf)
Berggren G. Hebert J. Waternaux C. 1985. “Comparison of Haitian children in a nutrition intervention program with children in the Haitian National Nutrition Survey. “ Bulletin of the World Health Organization 63:1141- 1150.
16
Bhan, Maharaj Kishan, Rajiv Bahl, and Nita Bhandari. 2001. Infection: how important are its effects on child nutrition and growth? In Reynaldo Martorell and Ferdinand Haschke (eds.). 2001. Nutrition and Growth, USA: Nestec Ltd and Lippincoot Williams and Wilkins, (Nestle Nutrition Workshop Series, Pediatric Program, Vol 47). (note: place of publication not specified in the book)
Black RE, Brown KH, Becker S. Alim ARM, and Huq 1.1982. “Longitudinal studies of infectious diseases and physical growth of children in rural Bangladesh. II. Incidence of diarrhea and association with known pathogens.” American Journal of Epidemiology 115:315-324.
Census of India 2001. Provisional Population Totals, Series 1, India, Paper 1 of 2001. (http://www.censusindia.net/results/)
Das Gupta, Monica. 1987. “Selective discrimination against female children in rural Punjab, India”, Population and Development Review 13: 77-100.
Das Gupta, Monica, and P.N.Mari Bhat. 1997. “Fertility Decline and Increased Manifestation of Sex Bias in India”, Population Studies 51(3): 307-315.
Deolalikar, Anil B. 2004. Attaining the Millenium Development Goals in India, Washington DC: The World Bank, Human Development Unit, South Asia Region (mimeo).
Dibley MJ, Goldsby JB, Staehling NW, Trowbridge FL. 1987a. Development of normalized curves for the international growth reference: historical and technical considerations. American Journal of Clinical Nutrition 1987 46:736-48.
Dibley MJ, Staehling N, Nieburg P, Trowbridge FL. 1987b. Interpretation of Z-score anthropometric indicators derived from the international growth reference. American Journal of Clinical Nutrition 46:749-62.
Dyson, Tim, and Mick Moore. 1983. “On kinship structure, female autonomy and demographic behavior in India”, Population and Development Review 9(1):35-60.
Engle, Patrice L., Purnima Menon, and Lawrence Haddad. 1999. Care and Nutrition: Concepts and Measurement, World Development 27(8):1309-1337
Esrey, Steven A., James B.Potash, Leslie Roberts, and Clive Shiff. 1990. Health benefits from improvements in water supply and sanitation: survey and analysis of the literature on selected diseases, Washington DC: USAID, WASH Technical Report No. 66.
Filmer, Deon, and Lant Pritchett. 2001. Estimating Wealth Effects without Expenditure Data --- or Tears: an application to educational enrollments in states of India, Demography 38(1):115-32.
Gillespie, Stuart (ed.).1997. Malnutrition in South Asia : a regional profile, Kathmandu: UNICEF Regional Office for South Asia.
Gillespie, Stuart and Lawrence Haddad. 2001. Attacking the double burden of malnutrition in Asia, Manila: Asian Development Bank and IFPRI, ADB Nutrition Development Series No 4.
Gillespie, Stuart, Milla McLachlan, and Roger Shrimpton (eds.). 2003. Combating Malnutrition: Time to Act, Washington DC: The World Bank, Human Development Network, Health Nutrition and Population Series (World Bank-UNICEF Nutrition Assessment).
Gopalan, C. “Growth Charts in Primary Child-Health Care: Time for Reassessment.” Indian Journal of Maternal and Child Health 3.4 (1992): 98-103.
Government of India, Ministry of Rural Development (no date) http://rural.nic.in/book01-02/ch-2.pdf. See also http://rural.nic.in/book00-01/ch-2.pdf
17
Government of India, Planning Commission. (no date). Program Evaluation Office Study No.147 (http://planningcommission.nic.in/reports/peoreport/cmpdmpeo/volume1/147.pdf)
Government of India. circa 2000. Child Development. Ministry of Human Resource Development, Department of Women and Child Development (http://wcd.nic.in/)
Government of India. 2002. The Indian Child: a profile. Ministry of Human Resource Development, Department of Women and Child Development (http://wcd.nic.in/)
Government of India, Department of Women and Child Development. 2003. Empirical Analysis of Integrated Child Development, National Family Health Survey.
Government of India, Ministry of Finance Economic Survey, 2003-04, http://indiabudget.nic.in/es2002-03/chapt2003/tab18.pdf.
Greiner, Theodore, and David F. Pyle.2000. “Nutrition Assessment ⎯ India”, paper presented at the World Bank-UNICEF Joint Nutrition Assessment Workshop, Oct 11-12, 2000.
Heckman, J., Ichimura, H., and P. Todd, (1998), “Matching as an Econometric Evaluation Estimator: Evidence from Evaluating a Job Training Program,” Review of Economic Studies Vol. 64(4): 605-654
Heckman, J., Ichimura, H., J., Smith and P. Todd, (1998), “Characterizing Selection Bias using Experimental Data,” Econometrica, Vol. 66: 1017-1099
International Institute for Population Sciences (IIPS). 1995. National Family Health Survey – India 1992-93, Bombay: IIPS. (http://www.nfhsindia.org/india1.html)
International Institute for Population Sciences (IIPS) and ORC Macro. 2000. National Family Health Survey (NFHS-2), 1998-99: India, Mumbai: IIPS. (http://www.nfhsindia.org/india2.html)
Jalan, Jyotsna and Martin Ravallion (2003) “Does Piped Water Reduce Diarrhea for Children in Rural India?” Journal of Econometrics Vol. 12(1): 153-73.
Kennedy, Eileen T. and Harold Alderman. 1987. Comparative analysis of nutritional effectiveness of food subsidies and other food-related interventions, Washington DC: International Food Policy Research Institute and Joint WHO-UNICEF Nutrition Support Program (ISBN 0-89629-060-3).
King KW, Fougere W. Hilaire A, Webb RE, Berggren W. Berggren G. 1978. “Preventive and therapeutic benefits in relation to cost: performance over ten years of mothercraft centers in Haiti.” American Journal of Clinical Nutrition 31:679-690.
Kumar, Gopalkrishna, and Francis Stewart. Tackling Malnutrition: what can targeted nutritional interventions achieve? In B. Harriss, S. Guhan and R.H.Cassen (eds.) Poverty in India, Bombay: Oxford University Press.
Maharatna, Arup. 2000. ‘Fertility, Mortality and Gender Bias Among Tribal Population: An Indian Perspective’, Social Science and Medicine 50(10): 1333-1351.
Martorell, Reynaldo and Ferdinand Haschke (eds.). 2001. Nutrition and Growth, USA: Nestec Ltd and Lippincoot Williams and Wilkins, (Nestle Nutrition Workshop Series, Pediatric Program, Vol 47). (note: place of publication not specified in the book)
Measham, Anthony R. and Meera Chatterjee. 1999. Wasting Away: the crisis of malnutrition in South Asia, Washington DC: The World Bank, Directions in Development Series.
Miller, Barbara. 1981. The Endangered Sex: neglect of female children in rural North India, Ithaca: Cornell University Press.
National Council of Applied Economic Research. 2001. Concurrent Evaluation of the ICDS Program (Vols I and II), New Delhi: National Council of Applied Economic Research.
18
National Institute of Public Cooperation and Child Development (NIPCCD).1992. National Evaluation of Integrated Child Development Services, New Delhi: NIPCCD.
Nawani, N.P.. 1994. Indian Experience on Household Food and Nutrition Security, paper prepared for the Regional Expert Consulation, FAO-UN, Bangkok Thailand, August 1994. (http://www.fao.org/DOCREP/x0172e/x0172e00.htm)
Parikh, Kirit and R.Radhakrishna (eds.). 2002. India Development Report 2002, New Delhi: Oxford University Press.
Parliament of India, Rajya Sabha. 2003. Department-related Parliamentary Standing Committee on Human Resource Development 104th Report (April 2003). (http://parliamentofindia.nic.in/rs/book2/reports/HRD/Report140th.htm)
Radhakrishna, R. 2002. “Food and nutrition security”, in Kirit S. Parikh and R. Radhakrishna (eds.) India Development Report 2002, Oxford University Press.
Radhakrishna, R. and K. Subbarao.1997. India’s Public Distribution System : a national and international perspective. Washington DC: The World Bank Discussion Paper no. 380.
Rosenbaum, P., and D., Rubin, (1983) “The Central Role of the Propensity Score in Observational Studies for Causal Effects.” Biometrika, Vol. 70: 41-55
Rogers, B.L. and J.Coates. 2001. Food Safety Net Programs and Related Nutrition Intervention Annotated Bibliography (http://www.worldbank.org/wbi/socialprotection/southasia/pdf/readings/day1/rogersbiblio.pdf)
Roy, S.K. 1997. Complementary Feeding in South Asia, in Stuart Gillespie (ed.).1997. Malnutrition in South Asia : a regional profile, Kathmandu: UNICEF Regional Office for South Asia.
Rubin, D., (1973) “The Use of Matched Sampling and Regression Adjustment to Remove Bias in Observational Studies.” Biometrics Vol. 29: 159–183
Scrimshaw, Nevin S. (ed.). 1995. Community-based Longitudinal Nutrition and Health Studies: Classical Examples from Guatemala, Haiti and Mexico, Boston, MA USA: International Foundation for Developing Countries (INFDC). (http://www.unu.edu/unupress/food2/UIN09E/uin09e00.htm#Contents)
Shrimpton R, CG Victora, M de Onis, R Costa Lima, M Blössner, and G Clugston. 2001.Worldwide timing of growth faltering: implications for nutritional interventions. Pediatrics 107(5).
Whang, In-Joun, 1981: Management of Rural Change in Korea, Seoul: Seoul National University Press.
World Bank. 1998. Project Appraisal Document… for a Woman and Child Development Project, Washington DC: The World Bank, South Asia Region, Health, Nutrition and Population Sector Unit.
19
Table 1. Share of stunted (HAZ < -2) and underweight (WAZ < -2) children28 by various characteristics Boys Girls 1992 1998 1992 1998 Characteristic Mean Std. Err. Mean Std. Err. Mean Std. Err. Mean Std. Err.
Height-for age
mother’s education none 0.546 0.007 0.533 0.006 0.525 0.007 0.564 0.007primary 0.446 0.013 0.438 0.011 0.445 0.012 0.454 0.011secondary 0.314 0.009 0.293 0.007 0.328 0.009 0.316 0.007
household’s wealth tertile
poorest 0.567 0.009 0.554 0.009 0.537 0.010 0.579 0.010middle 0.504 0.009 0.469 0.008 0.489 0.009 0.501 0.008richest 0.361 0.007 0.340 0.006 0.378 0.008 0.368 0.006mother’s caste scheduled caste 0.545 0.013 0.505 0.010 0.529 0.014 0.529 0.011scheduled tribe 0.513 0.015 0.523 0.012 0.447 0.015 0.535 0.012other 0.463 0.006 0.408 0.005 0.461 0.006 0.438 0.006
All 0.478 0.005 0.438 0.004 0.469 0.005 0.467 0.005
Weight-for age
mother’s education none 0.592 0.006 0.536 0.006 0.587 0.006 0.578 0.007primary 0.512 0.011 0.488 0.011 0.509 0.010 0.493 0.011secondary 0.380 0.008 0.315 0.007 0.350 0.008 0.343 0.007
household’s wealth tertile poorest 0.624 0.008 0.570 0.009 0.593 0.008 0.598 0.010middle 0.563 0.007 0.491 0.008 0.558 0.007 0.532 0.008richest 0.409 0.007 0.353 0.006 0.411 0.007 0.386 0.007mother’s caste scheduled caste 0.568 0.012 0.517 0.010 0.572 0.012 0.548 0.010scheduled tribe 0.590 0.012 0.551 0.012 0.559 0.012 0.574 0.012other 0.520 0.005 0.424 0.005 0.509 0.005 0.459 0.006
All 0.532 0.004 0.455 0.004 0.522 0.004 0.489 0.005Source: NFHS I and II.
28 Children aged 0-4 in the 1992 survey, and 0-3 in the 1998 survey.
20
Table 2. ICDS coverage, nutrition levels, allocation and use of ICDS funds, and state domestic product, by state
Share of villages covered
by ICDS29 Share of stunted Share of
underweight
Allocation and use of ICDS funds
(1) 1992
(2) 1998
(3) %
change1992-
98
1992 1998 1992 1998
% spent from the funds allocated by the GoI to the states for the ICDS program, 1992-2003 30
GoI spending on the ICDS program, per underweight child age 0-6 years, 2000/01-2001-02 31
Per capita SDP (average of 1990-91 and 1998-99) 32
North (poor) Bihar 0.14 0.32 129 0.56 0.54 0.63 0.55 76 25 7440 Madhya Pradesh 0.27 0.53 96 - 0.51 0.60 0.55 102 72 15480 Orissa 0.42 0.47 12 0.46 0.44 0.53 0.55 99 231 11490 Rajasthan 0.36 0.52 44 0.42 0.52 0.45 0.51 105 95 17231 Uttar Pradesh 0.20 0.33 65 0.54 0.56 0.58 0.52 65 60 12570
North (rich)
Gujarat 0.61 0.84 38 0.44 0.44 0.49 0.46 101 173 25158 Haryana 0.64 0.92 44 0.43 0.50 0.35 0.35 101 280 27437 Maharashtra 0.66 0.81 23 0.41 0.40 0.52 0.50 114 154 27968 Punjab 0.39 0.70 79 0.38 0.39 0.46 0.29 98 334 29361 North (other) Himachal Pradesh 0.39 0.52 33 - 0.42 0.46 0.45 96 469 21387 Jammu & Kashmir 0.44 0.70 59 0.38 0.39 0.43 0.35 116 446 16215 West Bengal 0.45 0.58 29 - 0.42 0.57 0.49 105 174 18713
South Andhra Pradesh 0.30 0.65 117 - 0.39 0.48 0.38 99 178 18809 Karnataka 0.63 0.86 37 0.41 0.37 0.51 0.44 100 234 20395 Kerala 1.00 0.97 -3 0.26 0.22 0.27 0.27 99 351 21139 Tamil Nadu 0.77 0.43 -44 - 0.29 0.47 0.37 82 357 23154 North-East Arunachal Pradesh 0.65 0.82 26 0.49 0.27 0.38 0.25 95 2689 18360 Assam 0.39 0.30 -23 0.51 0.51 0.50 0.37 100 257 13258 Manipur 0.60 0.83 38 0.25 0.32 0.27 0.28 95 958 14416 Meghalaya 0.07 0.22 214 0.47 0.45 0.45 0.38 102 380 16034 Mizoram 0.97 0.73 -25 0.37 0.35 0.28 0.28 101 1766 18335 Nagaland 0.54 0.84 56 0.29 0.32 0.28 0.24 94 2690 18301 Sikkim - 0.27 - - 0.32 - 0.21 125 1001 18371 Tripura 0.76 0.83 9 0.42 0.41 0.46 0.43 89 377 15252
29 Source: NFHS I and II 30 Under the budget heading “ICDS (General). Source: Yi-Kyoung Lee and Selvaraju, from Lok Sabha Unstarred Question No 89 dated 18 February 2003, and Rajya Sabha Unstarred Question No. 4417, dated 2 May 2003. 31 Under the budget heading “ICDS (General). Source: Yi-Kyoung Lee and Selvaraju, from Lok Sabha Unstarred Question No. 1241, dated 31 July 2003, and calculated using the number of children aged 0-6 years from the 2001 census * prevalence of more than 2SD underweight from the NHFS2. 32 Source: Government of India, Ministry of Finance Economic Survey, 2003-04, http://indiabudget.nic.in/es2002-03/chapt2003/tab18.pdf. The data are at current prices at the time of the Economic Survey.
21
Table 3. Probit results of village participation in ICDS No state dummies State dummies
1992 1998 1992 1998 coef. std. err. coef. std. err. coef. std. err. coef. std. err.Demographic characteristics of the village
village population (log) 0.179*** 0.035 0.147*** 0.030 0.153*** 0.042 0.187*** 0.035 share of children (age<16) 0.804 0.916 -1.969** 0.869 1.522 0.997 -0.991 0.974 share of girls (age<5) 0.370 1.562 1.225 0.934 1.132 1.653 1.004 1.023 share of women (age 16+) 2.688* 1.388 -2.092* 1.152 3.544** 1.528 -1.387 1.256 share of elderly (age 60+) -2.144* 1.210 0.332 0.560 -1.185 1.392 0.179 0.633 % of mothers – primary education
0.133 0.200 0.078 0.163 -0.075 0.234 0.145 0.187
% of mothers - secondary+ education
0.365* 0.195 0.177 0.140 0.257 0.226 0.250 0.163
Wealth and infrastructure of the village Average household wealth (assets) index
-0.001 0.003 0.005* 0.003 -0.009** 0.004 -0.007** 0.003
Distance to the Tehsil/district headquarters
0.002 0.002 0.003*** 0.001 0.001 0.002 0.002 0.001
Distance to the nearest railway station
0.002*** 0.001 0.003*** 0.001 0.001 0.001 0.002* 0.001
Village is connected to all-weather road
-0.019 0.075 -0.101 0.081
Distance to all-weather road -0.005 0.003 -0.004 0.003 Village is electrified 0.604*** 0.100 0.489*** 0.084 0.427*** 0.112 0.263*** 0.095 No drainage -0.182** 0.072 0.055 0.063 -0.095 0.081 0.003 0.071 Primary Health Center (PHC) in the village
0.216* 0.131 0.050 0.099 0.169 0.142 0.087 0.110
Natural calamity last 2 years -0.055 0.071 -0.074 0.077 Community activities and development programs in the village
Cooperative society 0.228*** 0.078 0.155* 0.081 0.242*** 0.085 0.127 0.089 Fair price shop 0.201*** 0.077 0.238*** 0.065 0.163* 0.091 0.270*** 0.073 Mahila Mandal 0.278*** 0.075 0.337*** 0.073 0.297*** 0.084 0.307*** 0.083 IRDP -0.041 0.077 0.211*** 0.067 -0.094 0.084 0.190** 0.075 NREP -0.115 0.086 -0.078 0.104 -0.145 0.096 -0.089 0.111 TRYSEM 0.129 0.092 0.060 0.088 0.108 0.094 -0.018 0.095 EGS 0.099 0.092 -0.023 0.120 0.305*** 0.108 -0.040 0.128 DWACRA 0.287*** 0.087 0.343*** 0.098 IAY 0.195*** 0.066 0.358*** 0.077 SGNY 0.089 0.114 -0.089 0.139 Constant -3.147*** 0.779 -0.860 0.626 -3.732*** 0.873 -1.756** 0.725 R2 (pseudo) 0.134 0.183 0.148 0.251 Observations 1613 2137 1565 2137 Note: Standard errors in parentheses; the coefficients on state dummies are not reported * significant at 10%; ** significant at 5%; *** significant at 1% Source: NFHS I and II.
22
Table 4. The estimated effect of the ICDS program on z-scores of children using the child-level data, with and without propensity score matching, 1992 and 1998 33 Unmatched Matched z-score treated controls difference std. err. treated controls difference std. err. India: all children haz 1992 -1.844 -2.149 0.305*** 0.026 -1.877 -1.933 0.056 0.0551998 -1.787 -1.981 0.194*** 0.027 -1.807 -1.832 0.024 0.056waz 1992 -1.894 -2.089 0.195*** 0.017 -1.917 -1.873 -0.044 0.0381998 -1.771 -1.881 0.110*** 0.021 -1.789 -1.788 0.001 0.047 India : Boys haz 1992 -1.808 -2.203 0.396*** 0.036 -1.823 -1.974 0.151** 0.0761998 -1.762 -1.992 0.230*** 0.037 -1.777 -1.872 0.095 0.073waz 1992 -1.867 -2.122 0.255*** 0.023 -1.885 -1.897 0.012 0.0541998 -1.754 -1.864 0.111*** 0.029 -1.767 -1.804 0.037 0.071 India : Girls haz 1992 -1.881 -2.092 0.211*** 0.038 -1.925 -1.935 0.010 0.0811998 -1.816 -1.970 0.154*** 0.039 -1.859 -1.803 -0.056 0.095waz 1992 -1.921 -2.053 0.131*** 0.025 -1.948 -1.948 0.000 0.0551998 -1.790 -1.898 0.108*** 0.032 -1.827 -1.702 -0.125 0.092 North (poor): Uttar Pradesh, Bihar, Rajasthan, Madhya Pradesh, Orissa haz 1992 -2.054 -2.267 0.213*** 0.043 -2.140 -2.069 -0.071 0.0971998 -2.086 -2.135 0.049 0.038 -2.091 -1.962 -0.130 0.090waz 1992 -2.045 -2.172 0.127*** 0.029 -2.083 -2.038 -0.045 0.0581998 -2.053 -2.066 0.014 0.030 -2.066 -1.891 -0.175*** 0.041 North (rich) : Punjab, Haryana, Maharashtra, Gujarat haz 1992 -1.888 -1.907 0.019 0.054 -1.860 -1.879 0.019 0.0931998 -1.890 -1.750 -0.140 0.094 -1.859 -1.997 0.138 0.131waz 1992 -1.879 -1.999 0.120*** 0.041 -1.859 -1.855 -0.006 0.1081998 -1.730 -1.681 -0.049 0.079 -1.730 -1.823 0.093 0.176 South: Andhra Pradesh, Karnataka, Kerala, Tamil Nadu haz 1992 -1.618 -2.122 0.504*** 0.082 -2.095 -2.222 0.127 0.1321998 -1.437 -1.571 0.133* 0.079 -1.488 -1.730 0.242 0.152waz 1992 -1.852 -2.074 0.222*** 0.043 -2.103 -2.078 -0.025 0.1741998 -1.636 -1.686 0.050*** 0.064 -1.677 -1.939 0.262 0.1601998 -0.921 -0.919 -0.002 0.090 -0.890 -1.192 0.302 0.241 Northeast: Arunachal Pradesh, Assam, Manipur, Meghalaya, Mizoram, Nagaland, Tripura haz 1992 -1.795 -1.916 0.121 0.074 -1.738 -2.002 0.264 0.1911998 -1.425 -1.860 0.436*** 0.087 -1.399 -1.289 -0.110 0.344waz 1992 -1.636 -1.712 0.075 0.056 -1.611 -1.559 -0.052 0.1471998 -1.365 -1.300 0.065 0.067 -1.373 -0.995 -0.378* 0.213Note: ***, **, * - significant at 1,5, and 10% level respectively; standard errors are estimated using bootstrapping based on 200 iterations (one-to-one matching). Source: NFHS I and II 33 Children aged 0-4 in the 1992 survey, and 0-3 in the 1998 survey. Data for Sikkim were not available for 1992.
23
Figure 1. The relationship between ICDS program participation and states’ economic and malnutrition levels (State Domestic Product per capita, 34 and prevalence of stunting and underweight amongst children, non-parametric Lowess-type regression estimates)
0.1.2.3.4.5.6.7.8.91
shar
e of
vill
ages
with
ICD
S
0 5000 10000 15000 20000per capita SDP
bandwidth = .99
1992
0.1.2.3.4.5.6.7.8.91
0 10000 20000 30000 40000per capita SDP
bandwidth = .99
1998
0.1.2.3.4.5.6.7.8.91
shar
e of
vill
ages
with
ICD
S
.1 .2 .3 .4 .5 .6share of stunted (HAZ<-2) children under age 3bandwidth = .99
0.1.2.3.4.5.6.7.8.91
.1 .2 .3 .4 .5 .6share of stunted (HAZ<-2) children under age 3
bandwidth = .99
0.1.2.3.4.5.6.7.8.91
shar
e of
vill
ages
with
ICD
S
.1 .2 .3 .4 .5 .6share of underweight (WAZ<-2) children under age 3
bandwidth = .99
0.1.2.3.4.5.6.7.8.91
.1 .2 .3 .4 .5 .6share of underweight (WAZ<-2) children under age 3bandwidth = .99
Source: NFHS I and II, State Domestic Product data from the Government of India, Economic Survey 2003-04.
34 The State Domestic Product per capita are for the years 1993-94, and 1998-99, to correspond roughly to the two survey years.
24
Figure 2. The relationship between village’s wealth and ICDS program participation
.3
.4
.5
.6
.7
.8
.9
shar
e of
villa
ges
with
ICD
S
0 10 20 30 40 50 60 70 80 90 100w ealth percentile (All India)
All India
.3
.4
.5
.6
.7
.8
.9
0 10 20 30 40 50 60 70 80 90 100w ealth percentile (by state)
19921998
All India
.3
.4
.5
.6
.7
.8
.9
shar
e of
villa
ges
with
ICD
S
0 10 20 30 40 50 60 70 80 90 100w ealth percentile
Poor Northern states
.3
.4
.5
.6
.7
.8
.9
0 10 20 30 40 50 60 70 80 90 100w ealth percentile
Rich Northern states
.3
.4
.5
.6
.7
.8
.9
shar
e of
villa
ges
with
ICD
S
0 10 20 30 40 50 60 70 80 90 100w ealth percentile
Southern states
.3
.4
.5
.6
.7
.8
.9
0 10 20 30 40 50 60 70 80 90 100w ealth percentile
North Eastern states
Source: NFHS I and II.
25
Figure 3. Growth incidence curve for the share of villages with ICDS program, 1992-1998
2
3
4
5
6
7
annu
al g
row
th ra
te, %
0 10 20 30 40 50 60 70 80 90 100w ealth percentile (All India)
All India
2
3
4
5
6
7
0 10 20 30 40 50 60 70 80 90 100w ealth percentile (by state)
All India
-2-1012345678
annu
al g
row
th ra
te, %
0 10 20 30 40 50 60 70 80 90 100w ealth percentile
Poor Northern States
-2-1012345678
0 10 20 30 40 50 60 70 80 90 100w ealth percentile
Rich Northern states
-2-1012345678
annu
al g
row
th ra
te, %
0 10 20 30 40 50 60 70 80 90 100w ealth percentile
Southern states
-2-1012345678
0 10 20 30 40 50 60 70 80 90 100w ealth percentile
North Eastern States
Source: NFHS I and II.