Embed Size (px)
Citation preview
Program Development and Evaluation
USER’S GUIDE FOR
EVALUATING LEARNING OUTCOMES FROM CITIZEN SCIENCETina PhillipsMarion FergusonMatthew MinarchekNorman Porticella Rick Bonney
USER’S GUIDE FOR EVALUATING LEARNING OUTCOMES IN CITIZEN SCIENCE
Developed by the Program Development and Evaluation group at the Cornell Lab of Ornithology
Project Leader: Tina B. Phillips User’s Guide Writers: Tina B. Phillips, Evaluation Associate
Marion Ferguson, Research Assistant Matthew Minarchek, Research Assistant
Norman Porticella, Post Doctoral Associate Rick Bonney, Director, Program Development and Evaluation
Design Director: Diane Tessaglia-Hymes Graphic Designer: Lynn Nguyen
Website: Jennifer Shirk, www.citizenscience.org
Consultants Cecilia Garibay, Kate Haley-Goldman, Joe Heimlich, Bruce Lewenstein, and Kirsten Ellenbogen
If you have questions about any aspect of this user’s guide, please contact Tina Phillips [email protected]
800-843-2473 159 Sapsucker Woods Road, Ithaca, NY 14850
www.citizenscience.org
The Cornell Lab of Ornithology is a nonprofit membership institution whose mission is to interpret and conserve the earth’s biological diversity through research, education,
and citizen science focused on birds.
This document is based upon work supported by the National Science Foundation under Grant No. 1010744: DEVISE (Developing, Validating, and Implementing Situated Evaluation Instruments).
Any opinions, findings, and conclusions or recommendations expressed in these materials are those of the authors and do not necessarily reflect the views of the National Science Foundation.
Recommended citation: Phillips, T. B., Ferguson, M., Minarchek, M., Porticella, N., and Bonney, R. 2014 User’s Guide for Evaluating Learning Outcomes in Citizen Science.
Ithaca, NY: Cornell Lab of Ornithology.
Copyright 2014 Cornell Lab of Ornithology 159 Sapsucker Woods Road
Ithaca, NY 14850
Cover Photos Monarch, Great Smoky Mountain Institute at Tremont courtesy GSMIT Archives
Surveyor, Reef Environmental Education Foundation (REEF) by Paul Humann
Printed on paper containing at least 10% post-consumer waste.

Purpose 1Evaluation Primer 3Types of Evaluations 6How to Use this Guide 7
PHASE 1: PLAN YOUR EVALUATION
APPENDICES
BACKGROUND
CONTENTS
Inventory 8Define 14Design 17
Develop 20Field Test 21Administer 23
Analyze 24Report 28Disseminate and Inform 29
PHASE 2: IMPLEMENT YOUR EVALUATION
PHASE 3: SHARE YOUR EVALUATION
Appendix A. Sample Goals, Outcomes, and Indicators for Citizen Science 30Appendix B. Logic Model Worksheet 32Appendix C. Participant Consent Form Template 33Appendix D. Comparison of Data Collection Methods 34Appendix E. Data Collection Strategy 36Appendix F. Checklist for Developing Surveys 37Appendix G. Basic Demographic Questions 39Appendix H. Evaluation Plan Worksheet 40Appendix I. Glossary of Terms 49Appendix J. References and Resources 51Appendix K. Additional Resources for Use in Planning and Conducting Project Evaluation 52
LIST OF FIGURES, TABLES AND SIDEBARSFIGURES
Figure 1: Approaches to Citizen Science 2Figure 2: Evaluation Cycle 7Figure 3: Framework for Evaluating Citizen Science Learning Outcomes 10
Table 1: NSF & LSIE Impact Categories 9Table 2: Sample Program Logic Model 12Table 3: Strengths & Weaknesses of Evaluation Designs 19Table 4: Example Data Codebook 25
TABLES
Sidebar 1: Theory of Change 13Sidebar 2: What Is an IRB? 16Sidebar 3: What Is an “Instrument?” 22Sidebar 4: Types of Data 27
SIDEBARS
1
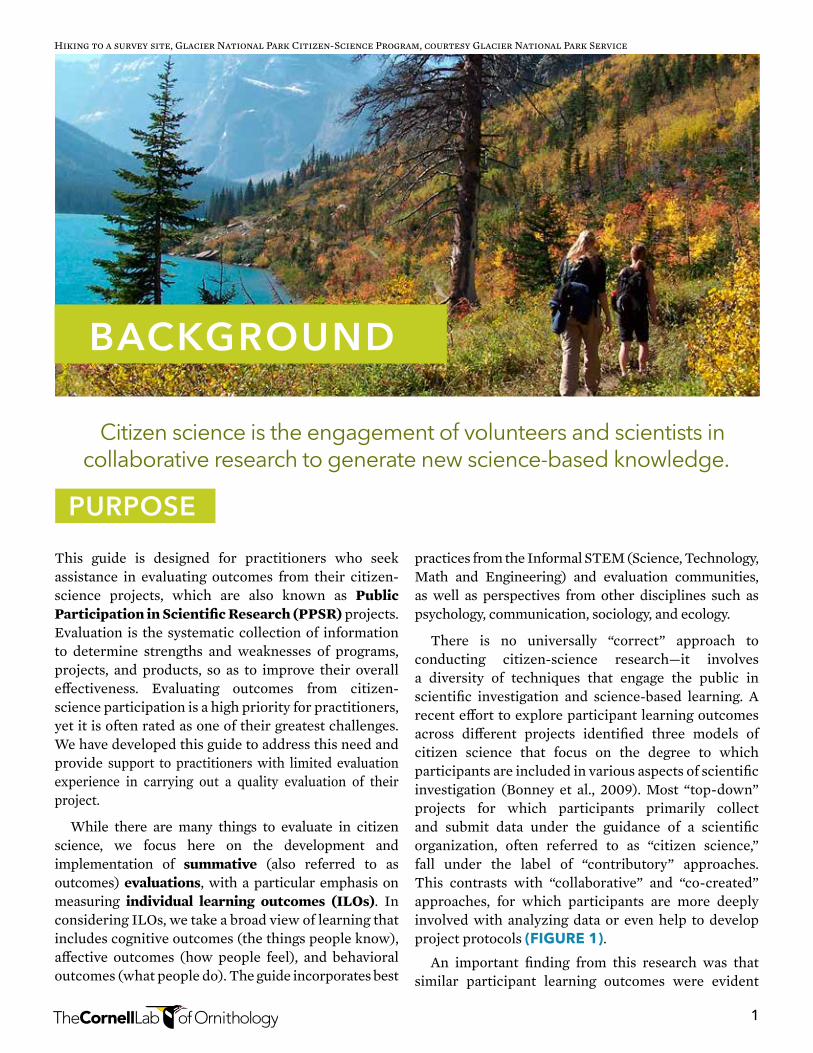
Citizen science is the engagement of volunteers and scientists in collaborative research to generate new science-based knowledge.
BACKGROUND
PURPOSE
Hiking to a survey site, Glacier National Park Citizen-Science Program, courtesy Glacier National Park Service
This guide is designed for practitioners who seek assistance in evaluating outcomes from their citizen-science projects, which are also known as Public Participation in Scientific Research (PPSR) projects. Evaluation is the systematic collection of information to determine strengths and weaknesses of programs, projects, and products, so as to improve their overall effectiveness. Evaluating outcomes from citizen-science participation is a high priority for practitioners, yet it is often rated as one of their greatest challenges. We have developed this guide to address this need and provide support to practitioners with limited evaluation experience in carrying out a quality evaluation of their project.
While there are many things to evaluate in citizen science, we focus here on the development and implementation of summative (also referred to as outcomes) evaluations, with a particular emphasis on measuring individual learning outcomes (ILOs). In considering ILOs, we take a broad view of learning that includes cognitive outcomes (the things people know), affective outcomes (how people feel), and behavioral outcomes (what people do). The guide incorporates best
practices from the Informal STEM (Science, Technology, Math and Engineering) and evaluation communities, as well as perspectives from other disciplines such as psychology, communication, sociology, and ecology.
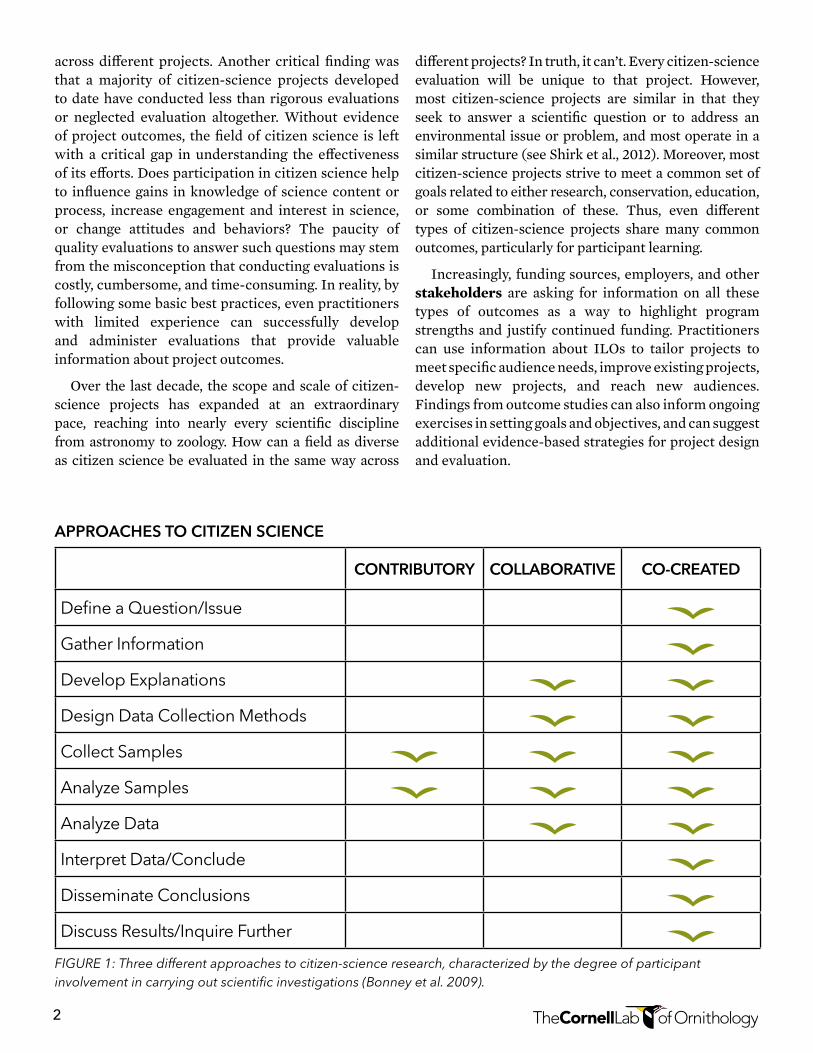
There is no universally “correct” approach to conducting citizen-science research—it involves a diversity of techniques that engage the public in scientific investigation and science-based learning. A recent effort to explore participant learning outcomes across different projects identified three models of citizen science that focus on the degree to which participants are included in various aspects of scientific investigation (Bonney et al., 2009). Most “top-down” projects for which participants primarily collect and submit data under the guidance of a scientific organization, often referred to as “citizen science,” fall under the label of “contributory” approaches. This contrasts with “collaborative” and “co-created” approaches, for which participants are more deeply involved with analyzing data or even help to develop project protocols (Figure 1).
An important finding from this research was that similar participant learning outcomes were evident
2
CONTRIBUTORY COLLABORATIVE CO-CREATED
Define a Question/Issue
Gather Information
Develop Explanations
Design Data Collection Methods
Collect Samples
Analyze Samples
Analyze Data
Interpret Data/Conclude
Disseminate Conclusions
Discuss Results/Inquire Further
FIGURE 1: Three different approaches to citizen-science research, characterized by the degree of participant involvement in carrying out scientific investigations (Bonney et al. 2009).
across different projects. Another critical finding was that a majority of citizen-science projects developed to date have conducted less than rigorous evaluations or neglected evaluation altogether. Without evidence of project outcomes, the field of citizen science is left with a critical gap in understanding the effectiveness of its efforts. Does participation in citizen science help to influence gains in knowledge of science content or process, increase engagement and interest in science, or change attitudes and behaviors? The paucity of quality evaluations to answer such questions may stem from the misconception that conducting evaluations is costly, cumbersome, and time-consuming. In reality, by following some basic best practices, even practitioners with limited experience can successfully develop and administer evaluations that provide valuable information about project outcomes.
Over the last decade, the scope and scale of citizen-science projects has expanded at an extraordinary pace, reaching into nearly every scientific discipline from astronomy to zoology. How can a field as diverse as citizen science be evaluated in the same way across
different projects? In truth, it can’t. Every citizen-science evaluation will be unique to that project. However, most citizen-science projects are similar in that they seek to answer a scientific question or to address an environmental issue or problem, and most operate in a similar structure (see Shirk et al., 2012). Moreover, most citizen-science projects strive to meet a common set of goals related to either research, conservation, education, or some combination of these. Thus, even different types of citizen-science projects share many common outcomes, particularly for participant learning.
Increasingly, funding sources, employers, and other stakeholders are asking for information on all these types of outcomes as a way to highlight program strengths and justify continued funding. Practitioners can use information about ILOs to tailor projects to meet specific audience needs, improve existing projects, develop new projects, and reach new audiences. Findings from outcome studies can also inform ongoing exercises in setting goals and objectives, and can suggest additional evidence-based strategies for project design and evaluation.
APPROACHES TO CITIZEN SCIENCE
3
A. What is Evaluation? (And what is it not?)Evaluation is the systematic collection of data to determine strengths and weaknesses of programs, policies, or products, so as to improve their overall effectiveness. Evaluation is also a discipline of study that is grounded in accountability and social inquiry-based theories relating to use, methods, and values. Program evaluation occurs in both public and private sectors such as government, education, and public health.
Evaluation is sometimes confused with related activities such as audits, assessments, surveys, and research. These activities, however, are not synonymous with evaluation. An audit, for example, typically focuses on compliance with existing rules or common standards, and auditors have a different relationship with a project team than evaluators do. Whereas an evaluator works very closely with a project team, auditors typically observe and inspect and develop little synergy with project teams. Assessments are also different. While they can be part of an evaluation, an assessment’s main purpose is to measure or to calculate a value for something. Assessments often use standardized values to measure against; standardized tests are good examples. Surveys are sets of questions used to collect systematic information about a defined population that also can be administered as part of an evaluation, but in and of themselves, they are not evaluations. Finally, evaluation is not the same as research, which is intended to add to the body of knowledge about a particular topic through dissemination of findings via publication in peer-reviewed journals. In contrast, evaluations are conducted to gather evidence that clients can use to improve whatever is being evaluated. Evaluation uses
many of the same methodologies as scientific research but the goals, audience, and end products of evaluation are different.
In sum, evaluation is a comprehensive process that involves a strategy to plan, implement, and report results. The unit of analysis for evaluation is often quite broad, and executing a quality evaluation involves a thorough understanding of all of the stakeholders involved, their needs, and the environment or context in which the program operates.
B. Who is Involved?Evaluation involves a diverse array of people and organizations – often referred to as stakeholders – who have a vested interest in the project. Stakeholders can include project developers, project staff, participants and their communities, partner organizations, and project funders. It is important to identify all the stakeholders in a project before beginning an evaluation as there may be conflicting opinions regarding the evaluation’s purpose.
Evaluations can be carried out by an internal evaluator, an external evaluator, or both. There are pros and cons to all approaches. For example, internal staff who conduct evaluations are likely to have a high degree of knowledge of the culture of the organization and subject matter, be
EVALUATION PRIMER
Evaluation is a comprehensive
process that involves a strategy to plan, implement, and report results.
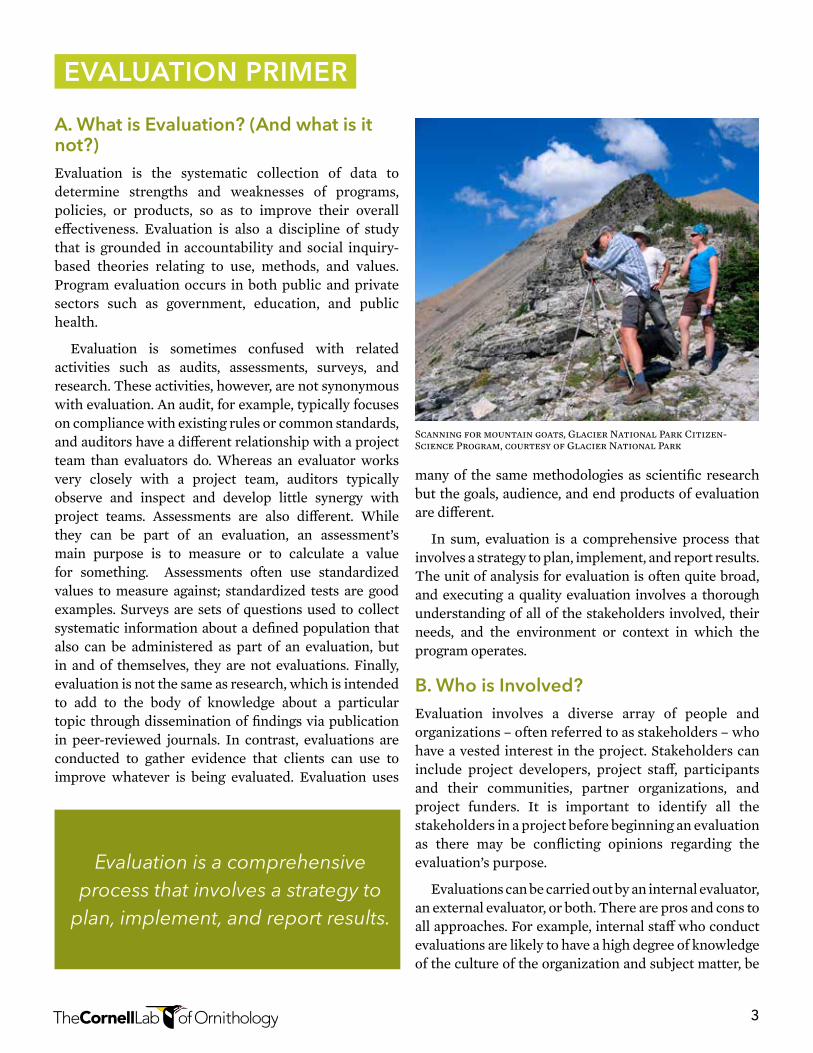
Scanning for mountain goats, Glacier National Park Citizen- Science Program, courtesy of Glacier National Park
4
more accessible for ongoing dialogue and meetings, and are typically less expensive then external evaluators. However, internal evaluators may be seen as biased because they may have a vested interest in the outcome of the evaluation and they also may face internal political challenges. External evaluators are generally more expensive and maintaining regular communication with them can be challenging, but they are less prone to bias because they are not directly influenced by an evaluation’s outcome.
Some projects blend these approaches by having internal staff conduct evaluations under the guidance of an independent evaluator who reviews the evaluation design and assesses the validity of the findings and conclusions. This approach can maintain external expertise and impartiality along with the benefit of an internal person’s first-hand project knowledge (Marcussen 2012).
C. When to EvaluateEvaluation can happen at any time in a project life cycle, but for best results, it should be considered throughout the entire life of a project – before, during, and after. For example, when a project or a component of a project is taking shape, evaluation can provide baseline data about your audience or project. Evaluation conducted during the project development phase, when there is still room for change and adaptation, can help to determine if the project is running as expected. Finally, evaluations can occur once a project has become established to measure outcomes and impacts.
Even if evaluation is not actually conducted, thinking about and planning for an evaluation will provide an outline for articulating your project’s goals and outcomes and the pathways by which to achieve them. Failing to at least plan for evaluation can result in a project without focus and direction. You can read more about when to conduct certain types of evaluations in the next section.
D. Why Evaluate?Some of the major reasons that organizations or projects undertake evaluation include:
• Todetermineprogramstrengthsandweaknesses
• Togatherevidenceofsuccess
• Tounderstandaudienceneeds
• Tosustainorobtainadditionalfunding
Evaluations are also conducted to measure overall program efficiency, to conduct cost-benefit analyses, to help plan for the future or reflect on program history, to gather baseline data, to measure ongoing progress, to compare to other similar projects, and to test usability and functionality of discrete project components.
E. Ethics in EvaluationFollowing a tumultuous time in history (1950s-1990s) when ethical standards for conducting research on human subjects was neglected, contemporary social and medical research now operates under a set of standards aimed at protecting human rights. Conducting evaluation means respecting the security, dignity, and self-worth of respondents, program participants, clients, and other evaluation stakeholders. Any evaluation involving people should attempt to follow these basic ethical standards:
Voluntary participation – Requires that people agree to participate in research without any coercion.
Informed consent – Tells potential participants about the procedures and risks involved in the research and ensures that they give their consent to participate.
Explaining risks of harm – Ensures that participants are not placed in a situation where they risk being harmed physically or mentally.
Confidentiality – Assures participants that their information will not be made available to anyone who is not directly involved in the study.
Anonymity – Guarantees privacy, ensuring that even the researchers cannot identify individuals in the study. In many types of evaluation, anonymity can be difficult to achieve.
For more information on ethics in evaluation, see the sidebar: “What is an IRB?” on page 16.
Conducting evaluation means respecting the security, dignity, and self-worthofrespondents,program
participants, clients, and other evaluationstakeholders.
5
F. A Note About Cultural Competence in Evaluation Evaluators interact with a broad range of people from many political, religious, ethnic, language, and racial groups and need special qualities to conduct culturally competent work. Frierson, Hood, Hughes, and Thomas state in The 2010 User-Friendly Guide to Project Evaluation (NSF 2010a, p. 75): “Culturally responsive evaluators honor the cultural context in which an evaluation takes place by bringing needed, shared life experiences and understandings to the evaluation tasks at hand and hearing diverse voices and perspectives. The approach requires that evaluators critically examine culturally relevant but often neglected variables in project design and evaluation. In order to accomplish this task, the evaluator must have a keen awareness of the context in which the project is taking place and an understanding of how this context might influence the behavior of individuals in the project.”
The American Evaluation Association affirms the significance of cultural competence in evaluation, stating: “To ensure recognition, accurate interpretation, and respect for diversity, evaluators should ensure that the members of the evaluation team collectively
demonstrate cultural competence. Cultural competence is a stance taken toward culture, not a discrete status or simple mastery of particular knowledge and skills. A culturally competent evaluator is prepared to engage with diverse segments of communities to include cultural and contextual dimensions important to the evaluation. Culturally competent evaluators respect the cultures represented in the evaluation throughout the process.
Evaluations cannot be culture free. Cultural competence in evaluation requires that evaluators maintain a high degree of self-awareness and self-examination to better understand how their own backgrounds and other life experiences serve as assets or limitations in the conduct of an evaluation. In constructing logic models and evaluation plans, the culturally competent evaluator reflects the diverse values and perspectives of all key stakeholder groups (including project participants).” (AEA, 2011).
In order to conduct a culturally responsive evaluation, you should be conscious of how it might be attentive to issues of culture and context. Find ways to make this a part of your planning. For example, you might do this by ensuring that partners or advisors from the community are included to help inform the evaluation process and implementation.
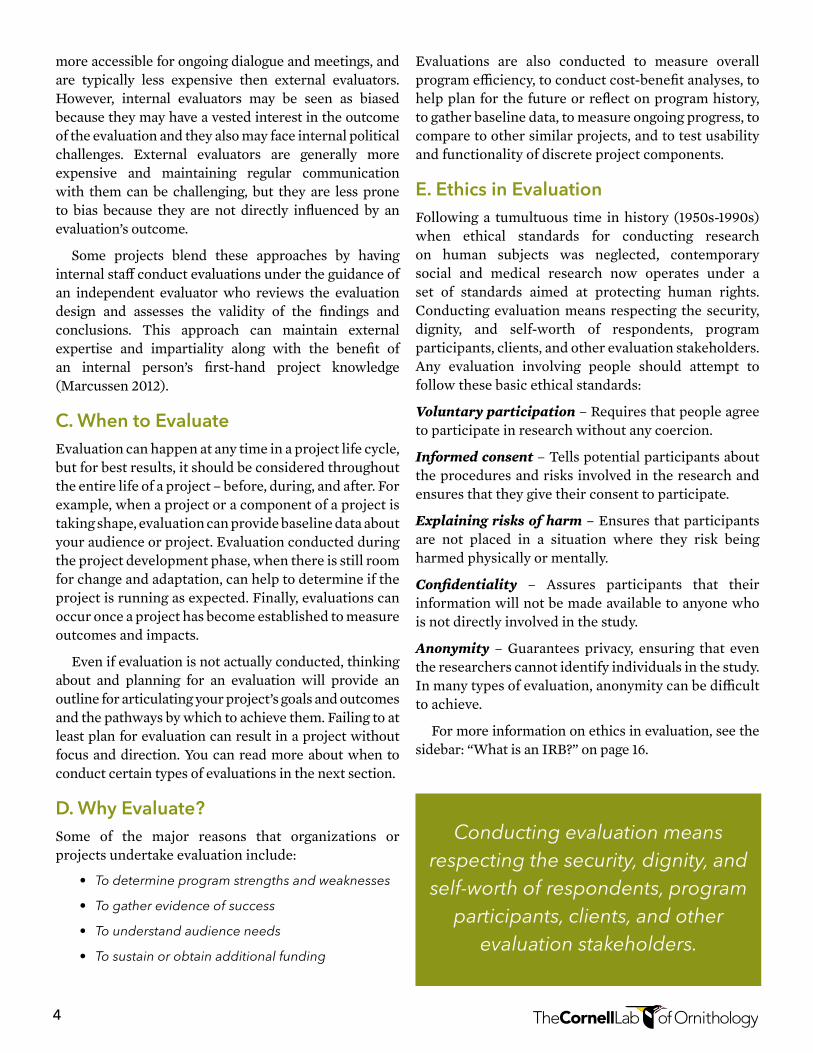
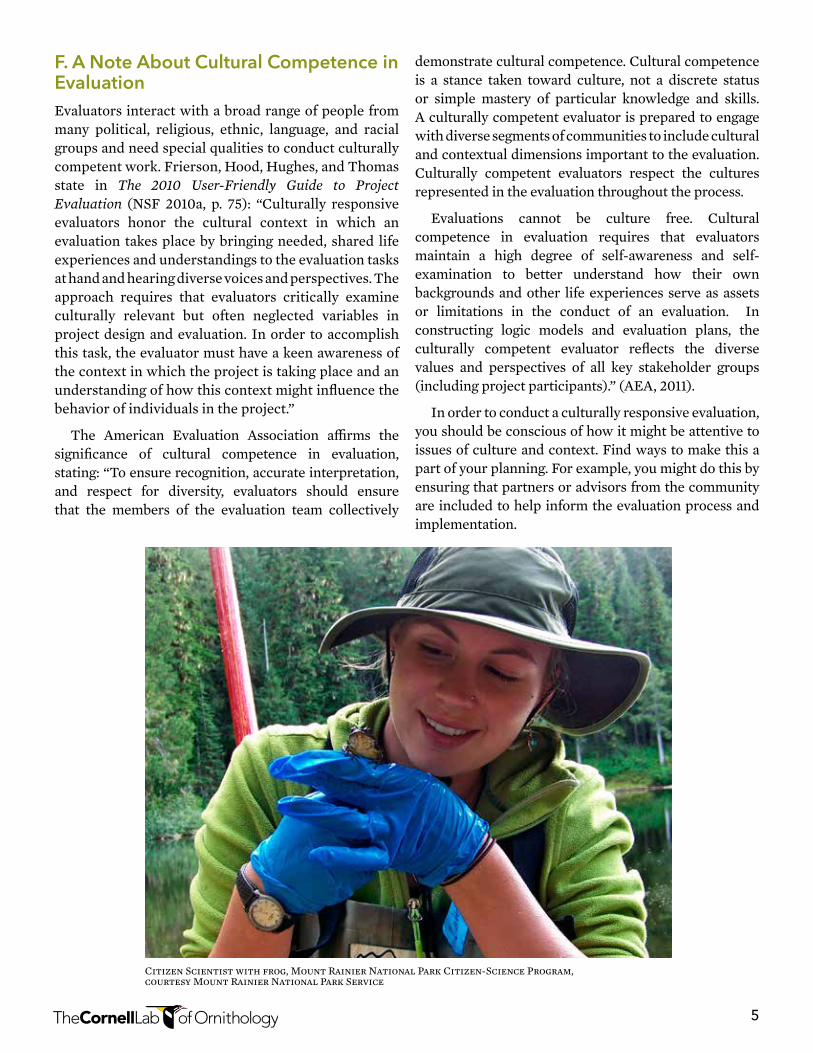
Citizen Scientist with frog, Mount Rainier National Park Citizen-Science Program, courtesy Mount Rainier National Park Service
6
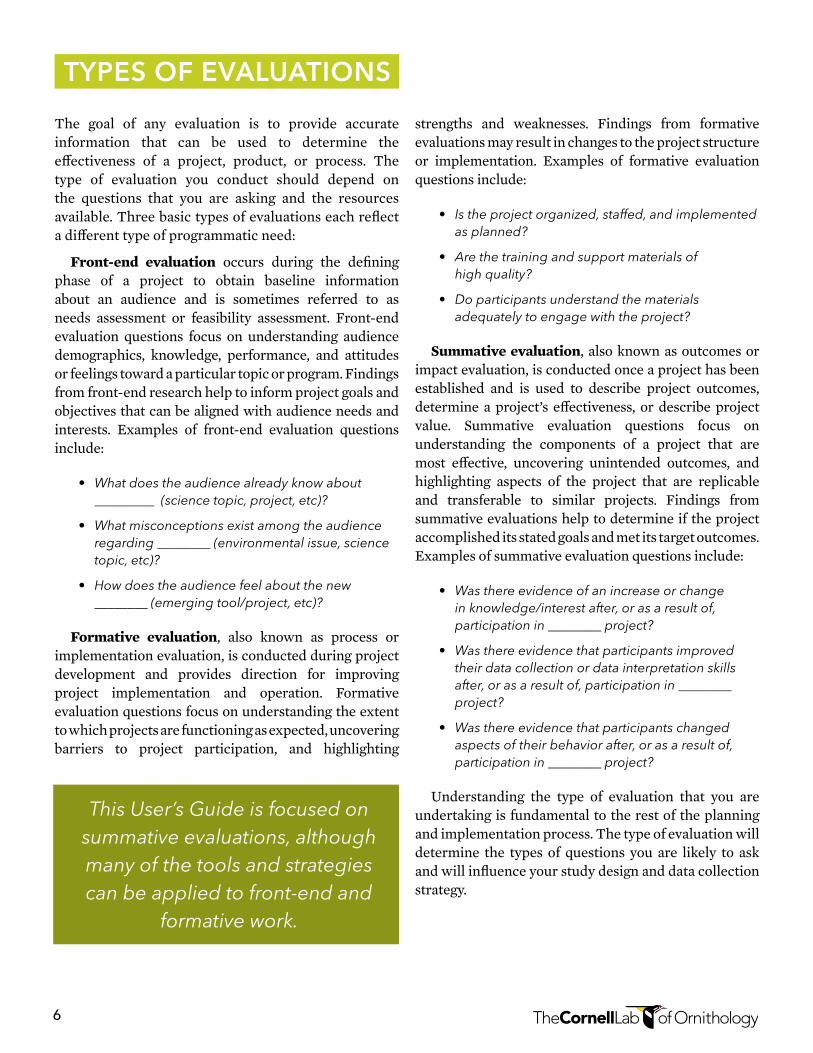
The goal of any evaluation is to provide accurate information that can be used to determine the effectiveness of a project, product, or process. The type of evaluation you conduct should depend on the questions that you are asking and the resources available. Three basic types of evaluations each reflect a different type of programmatic need:
Front-end evaluation occurs during the defining phase of a project to obtain baseline information about an audience and is sometimes referred to as needs assessment or feasibility assessment. Front-end evaluation questions focus on understanding audience demographics, knowledge, performance, and attitudes or feelings toward a particular topic or program. Findings from front-end research help to inform project goals and objectives that can be aligned with audience needs and interests. Examples of front-end evaluation questions include:
• Whatdoestheaudiencealreadyknowabout_________ (science topic, project, etc)?
• Whatmisconceptionsexistamongtheaudienceregarding ________ (environmental issue, science topic, etc)?
• Howdoestheaudiencefeelaboutthenew________ (emerging tool/project, etc)?
Formative evaluation, also known as process or implementation evaluation, is conducted during project development and provides direction for improving project implementation and operation. Formative evaluation questions focus on understanding the extent to which projects are functioning as expected, uncovering barriers to project participation, and highlighting
strengths and weaknesses. Findings from formative evaluations may result in changes to the project structure or implementation. Examples of formative evaluation questions include:
• Istheprojectorganized,staffed,andimplemented as planned?
• Arethetrainingandsupportmaterialsofhigh quality?
• Doparticipantsunderstandthematerialsadequatelytoengagewiththeproject?
Summative evaluation, also known as outcomes or impact evaluation, is conducted once a project has been established and is used to describe project outcomes, determine a project’s effectiveness, or describe project value. Summative evaluation questions focus on understanding the components of a project that are most effective, uncovering unintended outcomes, and highlighting aspects of the project that are replicable and transferable to similar projects. Findings from summative evaluations help to determine if the project accomplished its stated goals and met its target outcomes. Examples of summative evaluation questions include:
• Wasthereevidenceofanincreaseorchangeinknowledge/interestafter,orasaresultof,participation in ________ project?
• Wasthereevidencethatparticipantsimprovedtheirdatacollectionordatainterpretationskillsafter, or as a result of, participation in ________ project?
• Wasthereevidencethatparticipantschangedaspects of their behavior after, or as a result of, participation in ________ project?
Understanding the type of evaluation that you are undertaking is fundamental to the rest of the planning and implementation process. The type of evaluation will determine the types of questions you are likely to ask and will influence your study design and data collection strategy.
This User’s Guide is focused on summative evaluations, although many of the tools and strategies can be applied to front-end and
formativework.
TYPES OF EVALUATIONS
7
While the guide is not intended to serve as an introduction to evaluation (for that, we refer readers to the many excellent resources located in the References and Resources sections), we offer a brief overview of evaluation in the previous section. Throughout the guide we provide practical advice to increase practitioner comfort and confidence in carrying out evaluations within the context of citizen science. This guide also provides an evaluation framework (pg. 10) that we hope will be widely adopted by citizen-science practitioners to facilitate comparisons of individual learning outcomes across projects.
Designing and implementing a quality evaluation does not have to be a complex, time-consuming, or daunting process. This guide provides a common-sense approach to project evaluation, which can minimize the complexity and allow you to conduct an evaluation that is both informative and efficient. Keep in mind that conducting a quality evaluation is as much an art as it is a science. No two evaluations are the same, and there is no single universal step-by-step approach. There are, however, recognized processes that are essential to any evaluation.
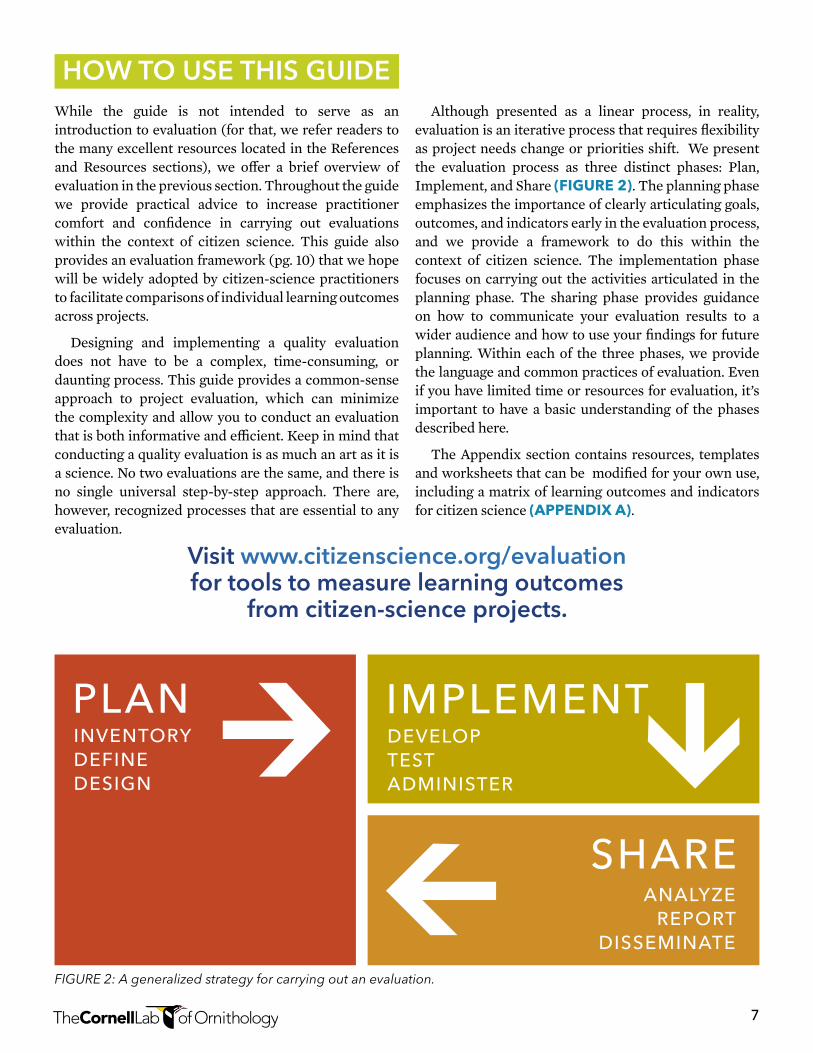
Although presented as a linear process, in reality, evaluation is an iterative process that requires flexibility as project needs change or priorities shift. We present the evaluation process as three distinct phases: Plan, Implement, and Share (Figure 2). The planning phase emphasizes the importance of clearly articulating goals, outcomes, and indicators early in the evaluation process, and we provide a framework to do this within the context of citizen science. The implementation phase focuses on carrying out the activities articulated in the planning phase. The sharing phase provides guidance on how to communicate your evaluation results to a wider audience and how to use your findings for future planning. Within each of the three phases, we provide the language and common practices of evaluation. Even if you have limited time or resources for evaluation, it’s important to have a basic understanding of the phases described here.
The Appendix section contains resources, templates and worksheets that can be modified for your own use, including a matrix of learning outcomes and indicators for citizen science (Appendix A).
FIGURE2:Ageneralizedstrategyforcarryingoutanevaluation.
IMPLEMENTDEVELOPTESTADMINISTER
PLANINVENTORYDEFINEDESIGN
SHAREANALYZE
REPORTDISSEMINATE
HOW TO USE THIS GUIDE
Visit www.citizenscience.org/evaluation for tools to measure learning outcomes
from citizen-science projects.
8
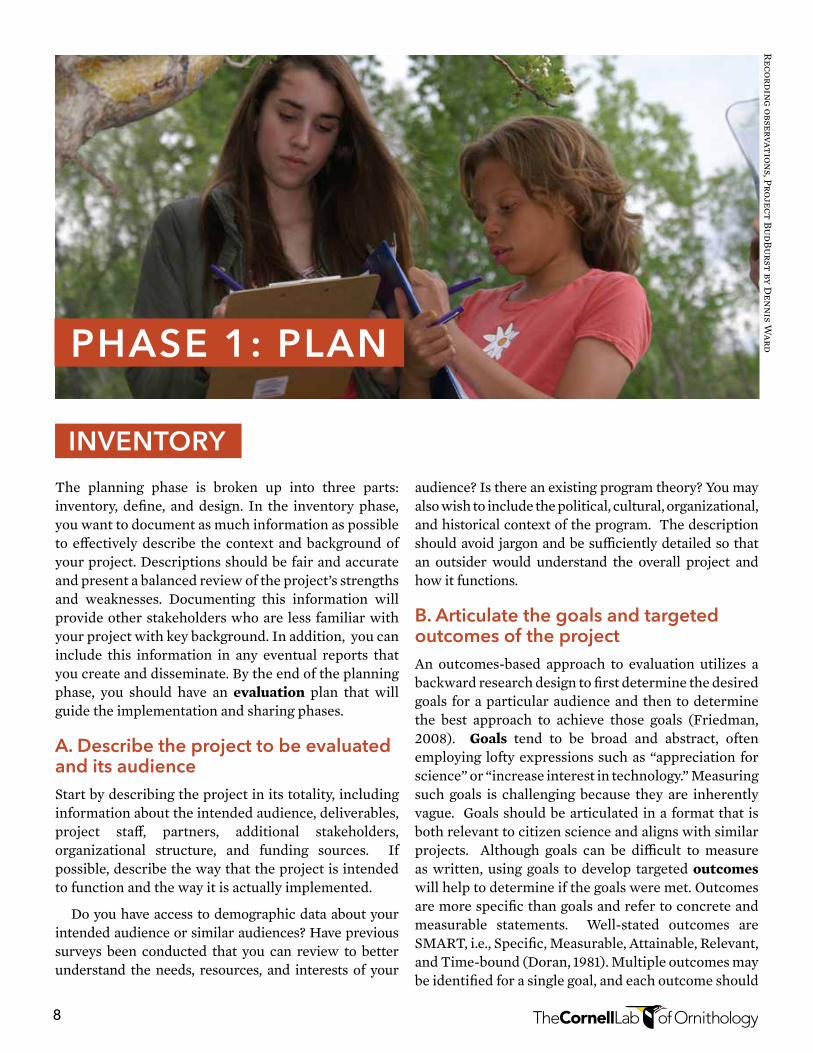
The planning phase is broken up into three parts: inventory, define, and design. In the inventory phase, you want to document as much information as possible to effectively describe the context and background of your project. Descriptions should be fair and accurate and present a balanced review of the project’s strengths and weaknesses. Documenting this information will provide other stakeholders who are less familiar with your project with key background. In addition, you can include this information in any eventual reports that you create and disseminate. By the end of the planning phase, you should have an evaluation plan that will guide the implementation and sharing phases.
A. Describe the project to be evaluated and its audience Start by describing the project in its totality, including information about the intended audience, deliverables, project staff, partners, additional stakeholders, organizational structure, and funding sources. If possible, describe the way that the project is intended to function and the way it is actually implemented.
Do you have access to demographic data about your intended audience or similar audiences? Have previous surveys been conducted that you can review to better understand the needs, resources, and interests of your
audience? Is there an existing program theory? You may also wish to include the political, cultural, organizational, and historical context of the program. The description should avoid jargon and be sufficiently detailed so that an outsider would understand the overall project and how it functions.
B. Articulate the goals and targeted outcomes of the project An outcomes-based approach to evaluation utilizes a backward research design to first determine the desired goals for a particular audience and then to determine the best approach to achieve those goals (Friedman, 2008). Goals tend to be broad and abstract, often employing lofty expressions such as “appreciation for science” or “increase interest in technology.” Measuring such goals is challenging because they are inherently vague. Goals should be articulated in a format that is both relevant to citizen science and aligns with similar projects. Although goals can be difficult to measure as written, using goals to develop targeted outcomes will help to determine if the goals were met. Outcomes are more specific than goals and refer to concrete and measurable statements. Well-stated outcomes are SMART, i.e., Specific, Measurable, Attainable, Relevant, and Time-bound (Doran, 1981). Multiple outcomes may be identified for a single goal, and each outcome should
INVENTORY
PHASE 1: PLAN
Recording observations, Project BudBurst by D
ennis Ward
9
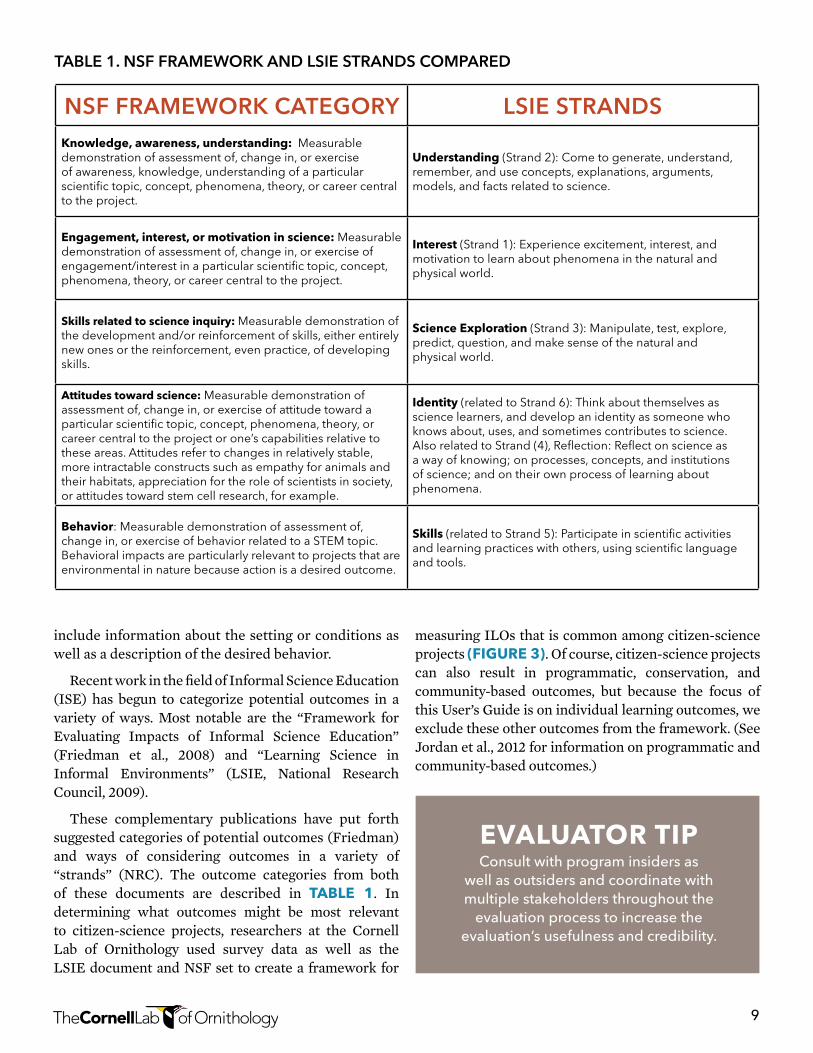
NSF FRAMEWORK CATEGORY LSIE STRANDSKnowledge, awareness, understanding: Measurable demonstration of assessment of, change in, or exercise of awareness, knowledge, understanding of a particular scientific topic, concept, phenomena, theory, or career central to the project.
understanding (Strand 2): Come to generate, understand, remember, and use concepts, explanations, arguments, models, and facts related to science.
engagement, interest, or motivation in science: Measurable demonstration of assessment of, change in, or exercise of engagement/interest in a particular scientific topic, concept, phenomena, theory, or career central to the project.
interest (Strand 1): Experience excitement, interest, and motivation to learn about phenomena in the natural and physical world.
Skills related to science inquiry: Measurable demonstration of the development and/or reinforcement of skills, either entirely new ones or the reinforcement, even practice, of developing skills.
Science exploration (Strand 3): Manipulate, test, explore, predict, question, and make sense of the natural and physical world.
Attitudes toward science: Measurable demonstration of assessment of, change in, or exercise of attitude toward a particular scientific topic, concept, phenomena, theory, or career central to the project or one’s capabilities relative to these areas. Attitudes refer to changes in relatively stable, more intractable constructs such as empathy for animals and their habitats, appreciation for the role of scientists in society, or attitudes toward stem cell research, for example.
identity (related to Strand 6): Think about themselves as science learners, and develop an identity as someone who knows about, uses, and sometimes contributes to science. Also related to Strand (4), Reflection: Reflect on science as a way of knowing; on processes, concepts, and institutions of science; and on their own process of learning about phenomena.
Behavior: Measurable demonstration of assessment of, change in, or exercise of behavior related to a STEM topic. Behavioral impacts are particularly relevant to projects that are environmental in nature because action is a desired outcome.
Skills (related to Strand 5): Participate in scientific activities and learning practices with others, using scientific language and tools.
include information about the setting or conditions as well as a description of the desired behavior.
Recent work in the field of Informal Science Education (ISE) has begun to categorize potential outcomes in a variety of ways. Most notable are the “Framework for Evaluating Impacts of Informal Science Education” (Friedman et al., 2008) and “Learning Science in Informal Environments” (LSIE, National Research Council, 2009).
These complementary publications have put forth suggested categories of potential outcomes (Friedman) and ways of considering outcomes in a variety of “strands” (NRC). The outcome categories from both of these documents are described in TABle 1. In determining what outcomes might be most relevant to citizen-science projects, researchers at the Cornell Lab of Ornithology used survey data as well as the LSIE document and NSF set to create a framework for
measuring ILOs that is common among citizen-science projects (Figure 3). Of course, citizen-science projects can also result in programmatic, conservation, and community-based outcomes, but because the focus of this User’s Guide is on individual learning outcomes, we exclude these other outcomes from the framework. (See Jordan et al., 2012 for information on programmatic and community-based outcomes.)
TABLE 1. NSF FRAMEWORK AND LSIE STRANDS COMPARED
evAluATor TipConsult with program insiders as
well as outsiders and coordinate with multiple stakeholders throughout the
evaluation process to increase the evaluation’s usefulness and credibility.
10
FRAMEWORK FOR EVALUATING CITIZEN SCIENCE LEARNING OUTCOMES
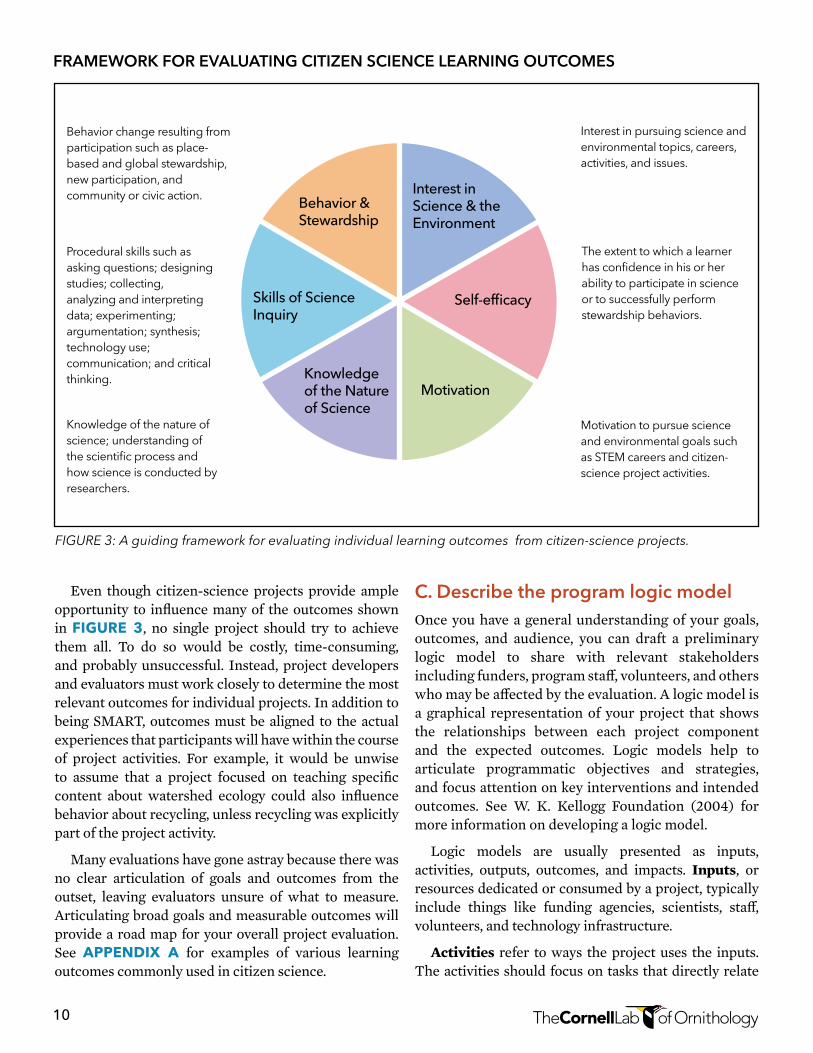
Even though citizen-science projects provide ample opportunity to influence many of the outcomes shown in Figure 3, no single project should try to achieve them all. To do so would be costly, time-consuming, and probably unsuccessful. Instead, project developers and evaluators must work closely to determine the most relevant outcomes for individual projects. In addition to being SMART, outcomes must be aligned to the actual experiences that participants will have within the course of project activities. For example, it would be unwise to assume that a project focused on teaching specific content about watershed ecology could also influence behavior about recycling, unless recycling was explicitly part of the project activity.
Many evaluations have gone astray because there was no clear articulation of goals and outcomes from the outset, leaving evaluators unsure of what to measure. Articulating broad goals and measurable outcomes will provide a road map for your overall project evaluation. See Appendix A for examples of various learning outcomes commonly used in citizen science.
C. Describe the program logic model Once you have a general understanding of your goals, outcomes, and audience, you can draft a preliminary logic model to share with relevant stakeholders including funders, program staff, volunteers, and others who may be affected by the evaluation. A logic model is a graphical representation of your project that shows the relationships between each project component and the expected outcomes. Logic models help to articulate programmatic objectives and strategies, and focus attention on key interventions and intended outcomes. See W. K. Kellogg Foundation (2004) for more information on developing a logic model.
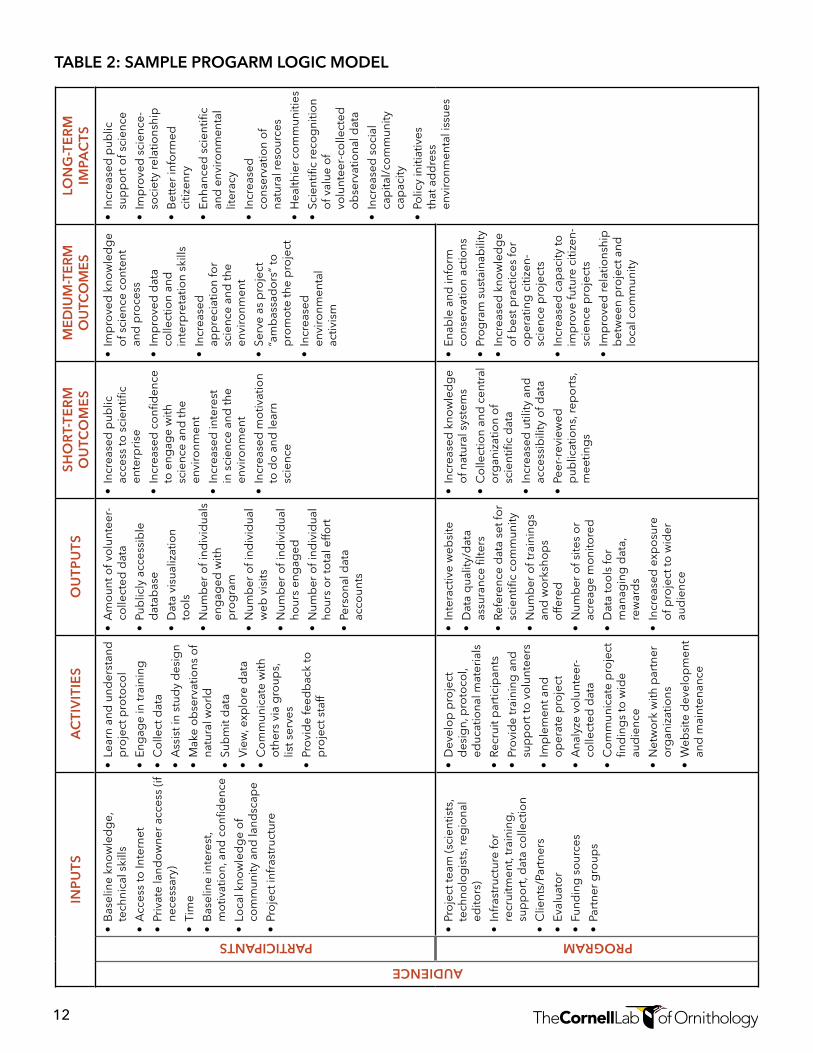
Logic models are usually presented as inputs, activities, outputs, outcomes, and impacts. Inputs, or resources dedicated or consumed by a project, typically include things like funding agencies, scientists, staff, volunteers, and technology infrastructure.
Activities refer to ways the project uses the inputs. The activities should focus on tasks that directly relate
Behavior & Stewardship
Interest in Science & the Environment
Skills of Science Inquiry
Knowledge of the Nature of Science
Motivation
Self-efficacy
Behavior change resulting from participation such as place-based and global stewardship, new participation, and community or civic action.
Procedural skills such as asking questions; designing studies; collecting, analyzing and interpreting data; experimenting; argumentation; synthesis; technology use; communication; and critical thinking.
Knowledge of the nature of science; understanding of the scientific process and how science is conducted by researchers.
Interest in pursuing science and environmental topics, careers, activities, and issues.
The extent to which a learner has confidence in his or her ability to participate in science or to successfully perform stewardship behaviors.
Motivation to pursue science and environmental goals such as STEM careers and citizen-science project activities.
FIGURE3:Aguidingframeworkforevaluatingindividuallearningoutcomesfromcitizen-scienceprojects.
11
to the participants and should not include those that are administrative in nature. In most large-scale citizen-science projects, scientists and staff typically develop the research topics, questions, and protocols, while the activities of volunteers tend to revolve around data collection. However, in smaller projects or those classified as collaborative or co-created, activities related to study design may vary widely. Also, many projects provide various forms of training for participants, and these should be included as activities.
Outputs are the direct products of the stated activities and demonstrate immediate results of activities. In general, outputs are easy to quantify and focus on things done by participants. Examples are the amount of data collected, the number of trainings conducted, the number of web visits, or the number of data forms downloaded.
Outcomes, described in the previous section, refer to the changes in behavior that a project is intended to produce in individuals, groups, or communities as a result of project participation. Summative evaluations typically focus on measuring outcomes, for example, knowledge gains, increased interest and motivation,
improved skills, or changed behaviors. Outcomes are more difficult to quantify than outputs and are often described as short-term, occurring within a few years of the activity; medium-term, happening within four to seven years after the activity; or long-term, happening many years after an activity has commenced (W. K. Kellogg Foundation, 1998).
Impacts are generally considered long-term outcomes that are broad in scope, aimed at expanding knowledge and capacity for a particular field of study, and meant to provide benefits to society. Although difficult to measure, impacts are important to describe as they are of particular interest to funding agencies.
TABle 2 provides examples of inputs, activities, outputs, outcomes, and impacts for citizen-science projects that might be used in a logic model. Your project will likely have different, and fewer examples. To show the distinction between participant and program outcomes, we provide examples from both. A typical logic model would focus only on one of these depending on the overall goals of the evaluation. See Appendix B for a Logic Model template (adapted from University of Wisconsin Extension, 2005).
evAluATor TipLogic models are dynamic! Revise any part of the logic model that is affected
by iterative design changes.
Articulatingshort-andlong-termoutcomesandhowtheywillbeachievedisan
extremelyimportantstepthatmust be conducted prior to
beginning an evaluation.
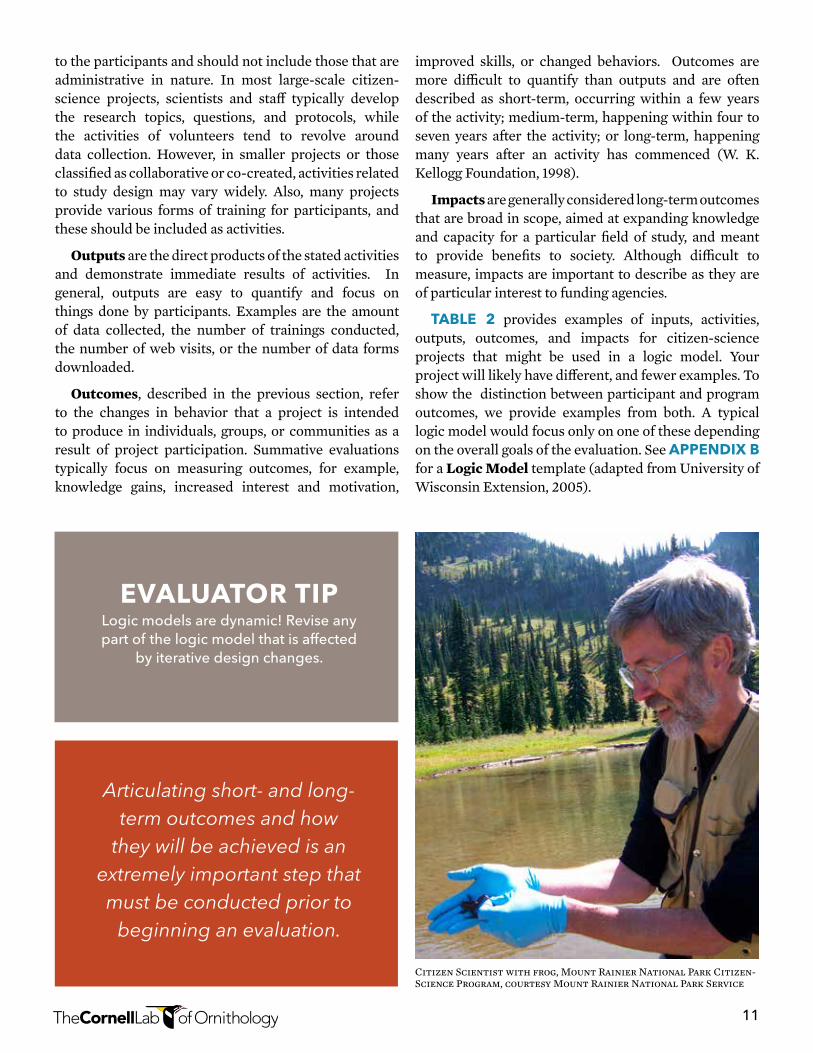
Citizen Scientist with frog, Mount Rainier National Park Citizen-Science Program, courtesy Mount Rainier National Park Service
12
TABLE 2: SAMPLE PROGARM LOGIC MODEL IN
PU
TSA
CTI
VIT
IES
OU
TPU
TSSH
OR
T-TE
RM
O
UTC
OM
ES
ME
DIU
M-T
ER
M
OU
TCO
ME
SLO
NG
-TE
RM
IM
PAC
TSAUDIENCE
PARTICIPANTS•
Bas
elin
e kn
ow
led
ge,
te
chni
cal s
kills
•A
cces
s to
Inte
rnet
•Pr
ivat
e la
ndo
wne
r ac
cess
(if
nece
ssar
y)
•Ti
me
•B
asel
ine
inte
rest
, m
otiv
atio
n, a
nd c
onfi
den
ce
•Lo
cal k
now
led
ge
of
com
mun
ity a
nd la
ndsc
ape
•Pr
oje
ct in
fras
truc
ture
•Le
arn
and
und
erst
and
p
roje
ct p
roto
col
•En
gag
e in
trai
ning
•C
olle
ct d
ata
•A
ssis
t in
stud
y d
esig
n
•M
ake
ob
serv
atio
ns o
f na
tura
l wo
rld
•Su
bm
it d
ata
•V
iew
, exp
lore
dat
a
•C
om
mun
icat
e w
ith
oth
ers
via
gro
ups,
lis
t ser
ves
•Pr
ovi
de
feed
bac
k to
p
roje
ct s
taff
•A
mo
unt o
f vo
lunt
eer-
colle
cted
dat
a
•Pu
blic
ly a
cces
sib
le
dat
abas
e
•D
ata
visu
aliz
atio
n to
ols
•N
umb
er o
f ind
ivid
uals
en
gag
ed w
ith
pro
gra
m
•N
umb
er o
f ind
ivid
ual
web
vis
its
•N
umb
er o
f ind
ivid
ual
hour
s en
gag
ed
•N
umb
er o
f ind
ivid
ual
hour
s o
r to
tal e
ffort
•Pe
rso
nal d
ata
acco
unts
•In
crea
sed
pub
lic
acce
ss to
sci
entifi
c en
terp
rise
•In
crea
sed
co
nfid
ence
to
eng
age
with
sc
ienc
e an
d th
e en
viro
nmen
t
•In
crea
sed
inte
rest
in
sci
ence
and
the
envi
ronm
ent
•In
crea
sed
mo
tivat
ion
to d
o a
nd le
arn
scie
nce
•Im
pro
ved
kno
wle
dg
e o
f sci
ence
co
nten
t an
d p
roce
ss
•Im
pro
ved
dat
a co
llect
ion
and
in
terp
reta
tion
skill
s
•In
crea
sed
ap
pre
ciat
ion
for
scie
nce
and
the
envi
ronm
ent
•Se
rve
as p
roje
ct
“am
bas
sad
ors
” to
p
rom
ote
the
pro
ject
•In
crea
sed
en
viro
nmen
tal
activ
ism
•In
crea
sed
pub
lic
sup
po
rt o
f sci
ence
•Im
pro
ved
sci
ence
-so
ciet
y re
latio
nshi
p
•B
ette
r in
form
ed
citiz
enry
•En
hanc
ed s
cien
tific
and
env
ironm
enta
l lit
erac
y
•In
crea
sed
co
nser
vatio
n o
f na
tura
l res
our
ces
•H
ealth
ier c
om
mun
ities
•Sc
ient
ific
reco
gni
tion
of v
alue
of
volu
ntee
r-co
llect
ed
ob
serv
atio
nal d
ata
•In
crea
sed
so
cial
ca
pita
l/co
mm
unity
ca
pac
ity
•Po
licy
initi
ativ
es
that
ad
dre
ss
envi
ronm
enta
l iss
ues
PROGRAM
•Pr
oje
ct te
am (s
cien
tists
, te
chno
log
ists
, reg
iona
l ed
itors
)
•In
fras
truc
ture
for
recr
uitm
ent,
trai
ning
, su
pp
ort
, dat
a co
llect
ion
•C
lient
s/Pa
rtne
rs
•Ev
alua
tor
•Fu
ndin
g s
our
ces
•Pa
rtne
r g
roup
s
•D
evel
op
pro
ject
d
esig
n, p
roto
col,
educ
atio
nal m
ater
ials
•Re
crui
t par
ticip
ants
•Pr
ovi
de
trai
ning
and
su
pp
ort
to v
olu
ntee
rs
•Im
ple
men
t and
o
per
ate
pro
ject
•A
naly
ze v
olu
ntee
r-co
llect
ed d
ata
•C
om
mun
icat
e p
roje
ct
find
ing
s to
wid
e au
die
nce
•N
etw
ork
with
par
tner
o
rgan
izat
ions
•W
ebsi
te d
evel
op
men
t an
d m
aint
enan
ce
•In
tera
ctiv
e w
ebsi
te
•D
ata
qua
lity/
dat
a as
sura
nce
filte
rs
•Re
fere
nce
dat
a se
t fo
r sc
ient
ific
com
mun
ity
•N
umb
er o
f tra
inin
gs
and
wo
rksh
op
s o
ffere
d
•N
umb
er o
f site
s o
r ac
reag
e m
oni
tore
d
•D
ata
too
ls fo
r m
anag
ing
dat
a,
rew
ard
s
•In
crea
sed
exp
osu
re
of p
roje
ct to
wid
er
aud
ienc
e
•In
crea
sed
kno
wle
dg
e o
f nat
ural
sys
tem
s
•C
olle
ctio
n an
d c
entr
al
org
aniz
atio
n o
f sc
ient
ific
dat
a
•In
crea
sed
util
ity a
nd
acce
ssib
ility
of d
ata
•Pe
er-r
evie
wed
p
ublic
atio
ns, r
epo
rts,
m
eetin
gs
•En
able
and
info
rm
cons
erva
tion
actio
ns
•Pr
og
ram
sus
tain
abili
ty
•In
crea
sed
kno
wle
dg
e o
f bes
t pra
ctic
es fo
r o
per
atin
g c
itize
n-sc
ienc
e p
roje
cts
•In
crea
sed
cap
acity
to
imp
rove
futu
re c
itize
n-sc
ienc
e p
roje
cts
•Im
pro
ved
rela
tions
hip
b
etw
een
pro
ject
and
lo
cal c
om
mun
ity
13
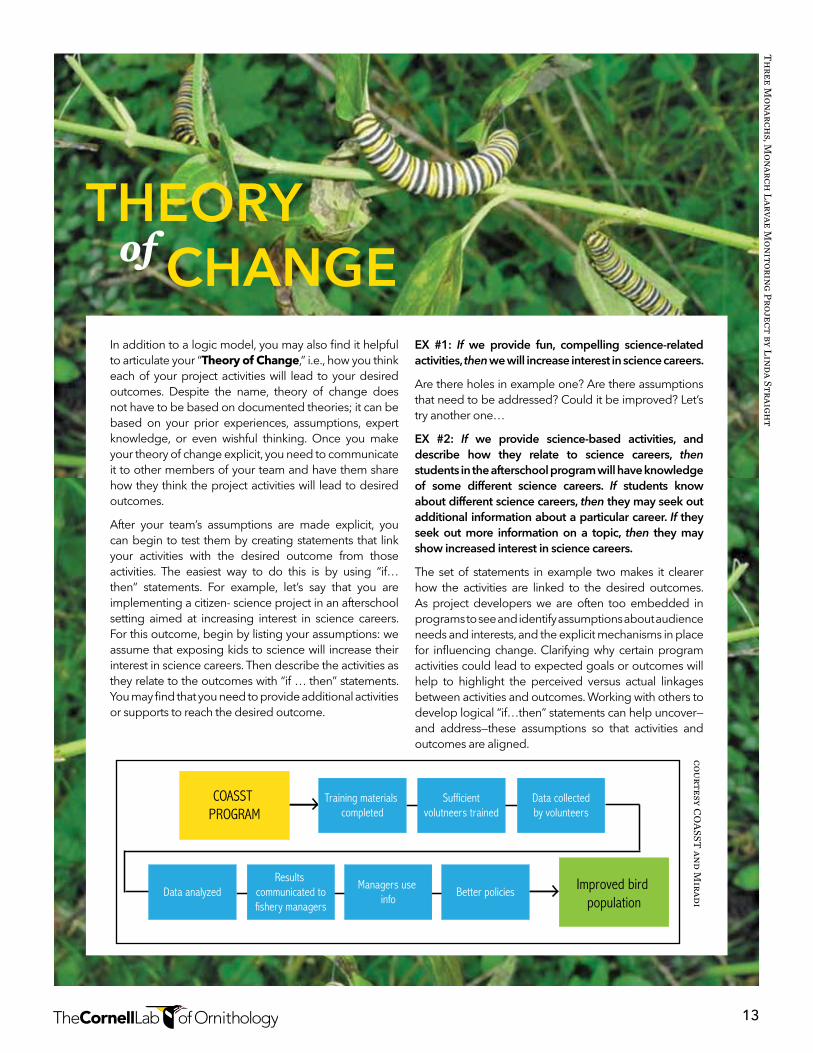
In addition to a logic model, you may also find it helpful to articulate your “Theory of Change,” i.e., how you think each of your project activities will lead to your desired outcomes. Despite the name, theory of change does not have to be based on documented theories; it can be based on your prior experiences, assumptions, expert knowledge, or even wishful thinking. Once you make your theory of change explicit, you need to communicate it to other members of your team and have them share how they think the project activities will lead to desired outcomes.
After your team’s assumptions are made explicit, you can begin to test them by creating statements that link your activities with the desired outcome from those activities. The easiest way to do this is by using “if…then” statements. For example, let’s say that you are implementing a citizen- science project in an afterschool setting aimed at increasing interest in science careers. For this outcome, begin by listing your assumptions: we assume that exposing kids to science will increase their interest in science careers. Then describe the activities as they relate to the outcomes with “if … then” statements. You may find that you need to provide additional activities or supports to reach the desired outcome.
EX #1: If we provide fun, compelling science-related activities, then we will increase interest in science careers.
Are there holes in example one? Are there assumptions that need to be addressed? Could it be improved? Let’s try another one…
EX #2: If we provide science-based activities, and describe how they relate to science careers, then students in the afterschool program will have knowledge of some different science careers. If students know about different science careers, then they may seek out additional information about a particular career. If they seek out more information on a topic, then they may show increased interest in science careers.
The set of statements in example two makes it clearer how the activities are linked to the desired outcomes. As project developers we are often too embedded in programs to see and identify assumptions about audience needs and interests, and the explicit mechanisms in place for influencing change. Clarifying why certain program activities could lead to expected goals or outcomes will help to highlight the perceived versus actual linkages between activities and outcomes. Working with others to develop logical “if…then” statements can help uncover—and address—these assumptions so that activities and outcomes are aligned.
THEORY of CHANGE
Th
ree Monarch
s, Monarch
Larvae Monitoring Project by Linda Straigh
t
courtesy CO
ASST
and Miradi
COASST PROGRAM
Training materials completed
Sufficientvolutneers trained
Data collectedby volunteers
Improved bird population
Data analyzedResults
communicated tofishery managers
Managers use info
Better policies
14
The next step in planning your evaluation is working with stakeholders to define what exactly will be evaluated, determine key evaluation questions, and lay out the evaluation timeline, budget, and limitations.
A. State the purpose of the evaluationExplicitly articulating the reasons for your evaluation will structure the scope of work you will do. Inexperienced evaluators sometimes try to evaluate every aspect of a program. Attempting to do so will be very costly and may result in findings that are incomplete or lack depth. To avoid this problem, consider just one or two main reasons for conducting an evaluation. Frequently, evaluations are conducted to:
• gaugeparticipantlearning;
• identifyprojectstrengthsandweaknesses;
• promoteaprojectmorebroadly;
• obtainadditionalfundingorsupport;
• clarifyprogrampurposeortheory;
• increaseorganizationalcapacitybuilding;
• reflectonprojecthistory;
• providerecommendationstoimproveprojectfunctioning.
Once you decide on the main purpose of the evaluation, discuss it with significant stakeholders and then document what is and what is not going to be evaluated.
B. Develop and prioritize key questions that you hope will be answered as a result of the evaluationSuccessful evaluation requires framing appropriate evaluation questions within the context of desired outcomes and the evaluation purpose. Defining and refining your evaluation questions is perhaps the most critical aspect of planning your evaluation because it hones in on what to evaluate. Evaluation questions should be broad enough to frame the overall evaluation, yet specific enough to focus the evaluation. Articulating well-formed questions (those that frame the overall study, not questions that might be asked of participants) will help you determine the overall study design, approach, and selection of methods (Diamond 2009). For example, a needs assessment evaluation to better understand a project’s audience might include the following types of questions:
• Whatdoestheaudiencealreadyknowaboutthisparticular topic?
• Whatmisconceptionsexistamongtheaudienceregarding this topic?
• Howinterestedistheintendedaudienceinthisnewemergingtopic?
Formative evaluation questions, which focus on understanding the extent to which a project is functioning as expected, might ask:
• What,ifany,werethebarrierstoparticipation?
• Wereprojectparticipantssatisfiedwiththeirexperience?Whyorwhynot?
• Didtheprojectreachitsintendedaudience?Whyorwhynot?
• Whatlessonshavewelearnedaboutdevelopingand implementing this project?
Outcome evaluations, for which the emphasis is on determining if projects have met their goals, might ask the following questions:
• Wasthereevidenceofanincreaseorchangeinknowledgeasaresultofengagingwiththisproject?
• Wasthereevidencethatparticipantsimprovedtheirskillsindatainterpretationafterorasaresultof participating in the project?
DEFINEG
reat
Bac
kyar
d Bi
rd C
ount
Par
tici
pant
s, fr
om G
BBC
Arc
hive
s
15
• Wasthereevidencethatparticipantschangedaspects of their consumer behavior as a result of participating in this project?
You will likely come up with many questions for which you would like answers, but it is important to remember that not all questions can be answered given allotted time and resources, and not all questions have the same importance to all stakeholders.
To get the most bang for your buck, ensure that the questions are 1) answerable; 2) appropriate for the various stages of evaluation; 3) aligned to the desired outcomes; and 4) provide important information for stakeholders. In addition to these criteria, you should also prioritize the questions by considering the following aspects:
• Theresourcesneededtoanswerthequestion
• Thetimerequired
• Thevalueoftheinformationininformingtheevaluation purpose
As each question is examined through the lens of these criteria, some will present themselves as high priority, while others will be eliminated altogether. At the end of this process you should feel comfortable knowing that the questions you focus on will demonstrate measurability, relevance, and feasibility, while setting the stage for the rest of the evaluation.
C. Determine the indicators for each intended outcomeWith goals, outcomes, and evaluation questions articulated, the next task is developing quality indicators, or criteria for measuring the extent to which your desired outcomes are being achieved. An indicator answers the question: How will you know success when you see it? Indicators provide specific types of information that let you know that an outcome has been achieved. Effective indicators align directly to outcomes and are clear, measurable, unbiased, and sensitive to change. So, if an outcome relates to knowledge gains, the indicator should measure knowledge gains. You may come up with more than one indicator for each desired outcome. And while indicators are measurable, they do not always need to be quantifiable. They can be qualitative and descriptive, i.e., “Participants will describe that they. . .” Indicators are the main source of information that will be used as credible evidence.
An example of goals, outcomes, and indicators is provided below:
Goal: Participation in citizen science will result in development of science inquiry skills.
Short-term Outcome: Within three months of joining the project, at least half of participants will be able to successfully collect and submit data.
Indicator: The number of new participants that submit data and show increased confidence in being able to collect data.
When developing indicators, it is important to consider the type of program or activity, the duration of the program, and the logistics of administering the measurement instrument. For a list of measurement instruments aligned to the framework on page 10, please visit www.citizenscience.org/evaluation.
D. Construct a timeline for the evaluation (include major milestones)Somewhere in the evaluation plan, you should develop an estimated timeline that provides anticipated start and end dates for completing key tasks and meeting established milestones. Such timelines are often presented in calendar format. Tap into your knowledge of your project and its audience to help you develop a reasonable timeline. Although all timelines inevitably change, having the timeline be as accurate as possible early in the evaluation will help avoid frustration later because of initial unrealistic expectations.
E. Construct a rough budget for the evaluationThis section of the plan estimates how much the evaluation will cost, which can vary greatly depending on the complexity of the evaluation. For example, evaluations incorporating experimental designs with control groups may be very costly. However, interviewing, transcribing, and analyzing information from 50 people for 60–90 minutes each can also be very time intensive (and thereby expensive). Recruiting participants can be costly depending on how you intend to engage them, particularly if incentives are required to ensure their participation. Obviously larger, more complex evaluations will cost more than those that are smaller in scope. Include costs related to salaries, travel, consultants, printing, mailing, copying, telephoning, and any necessary software or equipment.
16
IRB is the acronym for Institutional Review Board for Human Participants. An IRB is charged with protecting the rights and welfare of all people involved in research. Although initially developed for protection of people involved in medical research, obtaining IRB approval is now required for any institution that receives federal funding to conduct research (or evaluation) with human participants. The IRB for Human Participants has the authority to review, approve, disapprove, or require changes in research or related activities involving human participants.
Although most evaluation does not risk harm to participants in the traditional sense, audio- or video-recording people, or collecting information that can identify individuals, risks invading their privacy in ways that can make participants feel uncomfortable. If working with children, special considerations must be met for protecting their privacy since as minors they are considered a vulnerable population and only parents or guardians can decide on their participation.
Behavioral and survey research also fall under the category of research involving human subjects, so before any data collection begins, determine whether you need to obtain IRB approval for your evaluation—even if your organization does not accept federal funding.
Also, be sure to provide participants with an informed consent form before engaging them in the study. Consent forms typically describe the purpose and procedures of the study, risks and benefits, the voluntary nature of participation, how information will remain confidential, and researcher contact information.
See Appendix C for a Sample Participant Consent Form.
Visit Cornell University’s Institutional Review Board FAQ for additional information.
www.irb.cornell.edu/faq
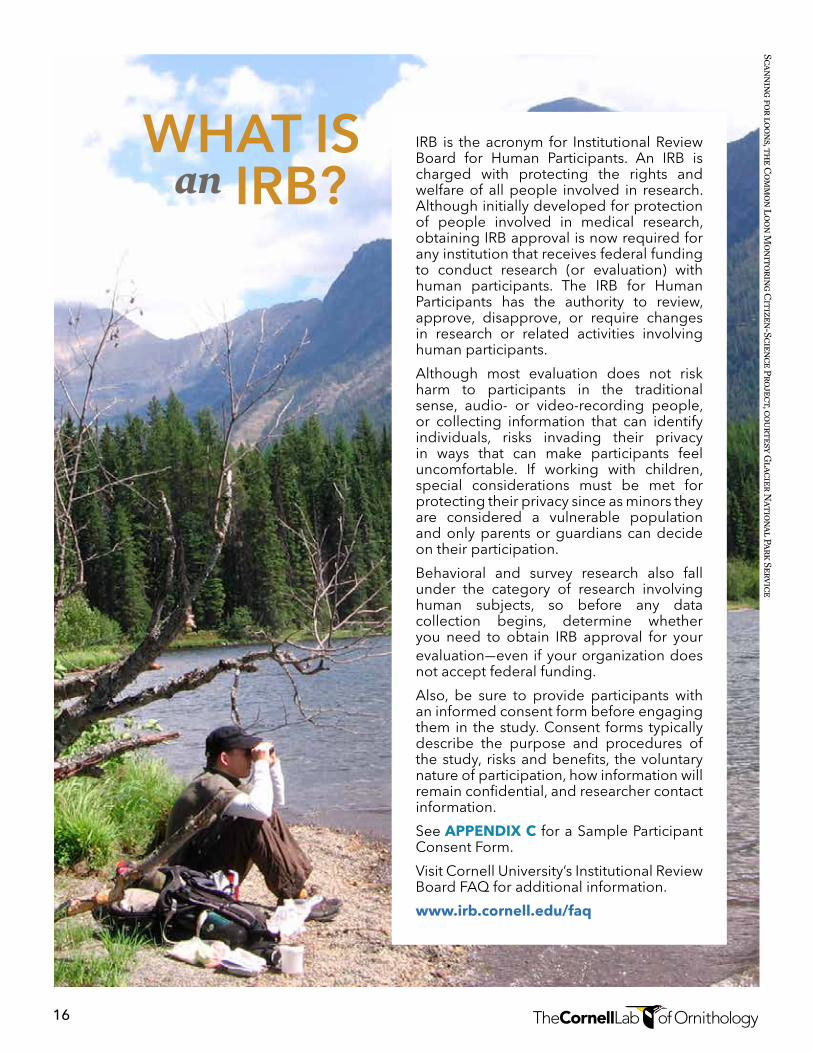
WHAT IS an IRB?
Scanning for loons, the Com
mon Loon M
onitoring Citizen-Science Project, courtesy G
lacier National Park Service
17
The last part of the planning phase is designing the plan for data collection. The goal is to create a data collection strategy that identifies procedures that are feasible, cost-effective, and viable to keep the project focused and on schedule. Before implementation begins, all relevant personnel should review and understand the data collection strategy.
A. Determine your study designAt this point you will need to determine the strategy you will use to design the overall evaluation. The design should reflect the types of questions you need answered, the reason for conducting the evaluation, the methods that best address the evaluation question, the amount of resources you can commit to the evaluation, and the information stakeholders hope to learn.
Many different evaluation approaches and study designs exist, and it is beyond the scope of this guide to describe them all. Different study designs are better suited for different types of evaluation questions. If your question is concerned with comparing outcomes for participants directly before and after project participation, then pre-post designs will likely fit the bill. Questions that seek to answer causal processes where you can include control groups and random assignment are best suited for experimental designs.
Researchers usually consider evaluation designs to be either quantitative—for example, surveys, tests, or other methods of collecting evaluation data that can be analyzed numerically—or qualitative, i.e., interviews, focus groups, or observations whose findings must be interpreted by the researcher. If you are comfortable with multiple methodologies you can combine these approaches to achieve mixed-methods designs, incorporating both quantitative and qualitative techniques. For example, if one of your questions is best answered by broad representation of a population and data are easy to acquire through questionnaires, then quantitative survey methods work very well. If another question requires gathering robust information on participant experiences and you can gain easy access to participants, then qualitative interview or focus group methods can also be used. Combining these methods into a single study can increase the validity of results by triangulating the findings (Creswell, 2003).
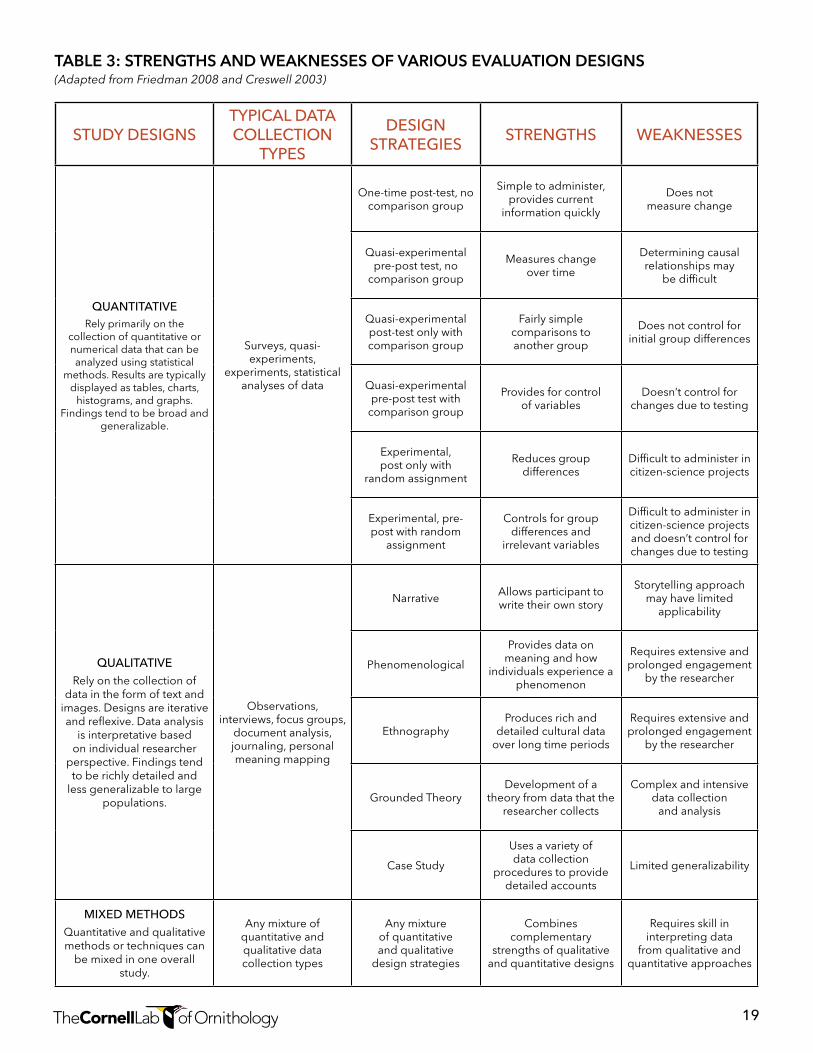
TABle 3 compares quantitative, qualitative, and mixed-methods approaches and the corresponding strengths and weaknesses of various design strategies that are typical of each.
In deciding on a study design, consider the following questions:
• Howwelldoyouknowyourtopic?Youmayneedtoconductaliteraturereviewtounderstandthetopicanddeterminehowpastevaluationshavebeen designed.
• Whatapproachtoresearchareyoumostcomfortablewith(i.e.,qualitative,quantitative,mixed)?
• Canyoudedicateenoughtime,resources,andstaffexpertisetotheevaluation?Ifnot,youmayneedtoconsiderhiringanexternalevaluator.
• Whoarethestakeholdersandwhatdotheyhope
to learn from the evaluation?
B. For each outcome, determine the population to sample from and the appropriate sample size The sample is a representative subset of the larger group or population. A representative sample will help minimize sampling bias and error. Simple random sampling (where each member of the population has an equal chance of selection) is the preferred sampling method. However, you may have more than one subset of the population you need to include, in which case you might employ a stratified sample. If your study is not aiming to generalize to the whole population, you can consider using a convenience sample—which allows you to include participants that are easy to contact—or
DESIGN
Determiningtheapproachthatisbestforyouwilldependonthe types of questions you’re
askingandthetime,budget,andexpertiseavailabletodothework.
18
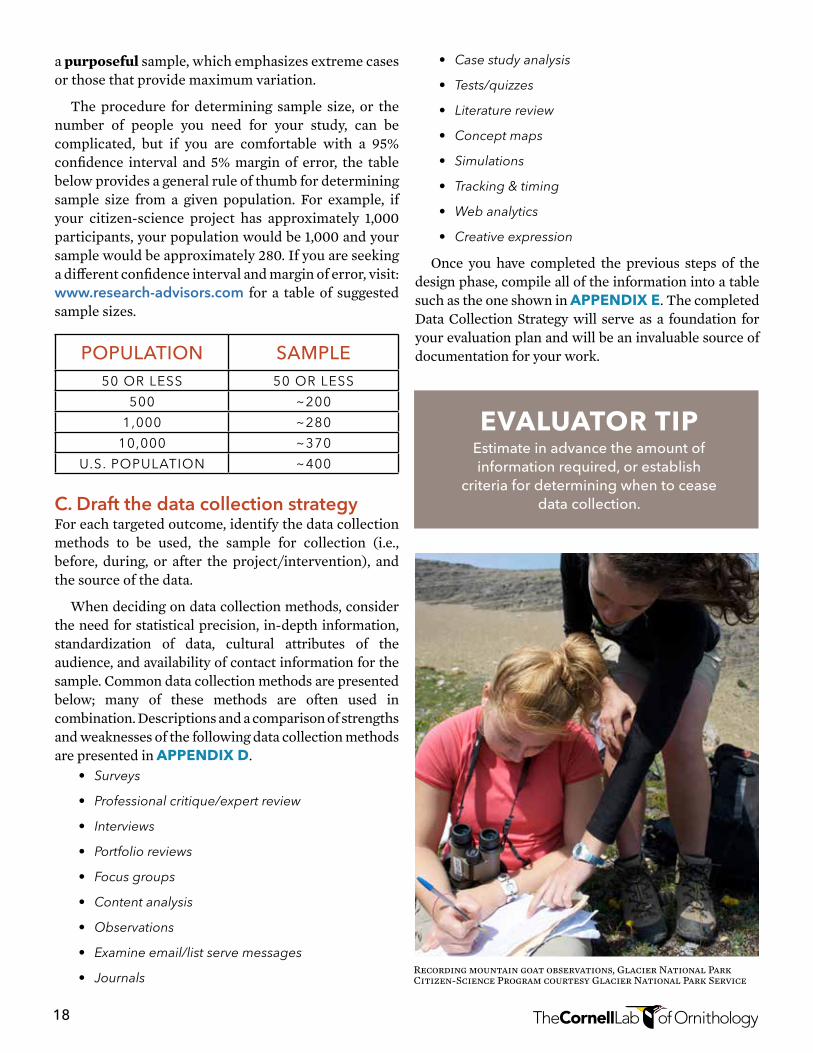
a purposeful sample, which emphasizes extreme cases or those that provide maximum variation.
The procedure for determining sample size, or the number of people you need for your study, can be complicated, but if you are comfortable with a 95% confidence interval and 5% margin of error, the table below provides a general rule of thumb for determining sample size from a given population. For example, if your citizen-science project has approximately 1,000 participants, your population would be 1,000 and your sample would be approximately 280. If you are seeking a different confidence interval and margin of error, visit: www.research-advisors.com for a table of suggested sample sizes.
C. Draft the data collection strategyFor each targeted outcome, identify the data collection methods to be used, the sample for collection (i.e., before, during, or after the project/intervention), and the source of the data.
When deciding on data collection methods, consider the need for statistical precision, in-depth information, standardization of data, cultural attributes of the audience, and availability of contact information for the sample. Common data collection methods are presented below; many of these methods are often used in combination. Descriptions and a comparison of strengths and weaknesses of the following data collection methods are presented in Appendix d.
• Surveys
• Professionalcritique/expertreview
• Interviews
• Portfolioreviews
• Focusgroups
• Contentanalysis
• Observations
• Examineemail/listservemessages
• Journals
• Casestudyanalysis
• Tests/quizzes
• Literaturereview
• Conceptmaps
• Simulations
• Tracking&timing
• Webanalytics
• Creativeexpression
Once you have completed the previous steps of the design phase, compile all of the information into a table such as the one shown in Appendix e. The completed Data Collection Strategy will serve as a foundation for your evaluation plan and will be an invaluable source of documentation for your work.
evAluATor TipEstimate in advance the amount of information required, or establish
criteria for determining when to cease data collection.
POPULATION SAMPLE50 OR LESS 50 OR LESS
500 ~200
1,000 ~280
10,000 ~370
U.S. POPULATION ~400
Recording mountain goat observations, Glacier National Park Citizen-Science Program courtesy Glacier National Park Service
19
STUDY DESIGNSTYPICAL DATA COLLECTION
TYPES
DESIGN STRATEGIES STRENGTHS WEAKNESSES
QUANTITATIVE Rely primarily on the
collection of quantitative or numerical data that can be analyzed using statistical
methods. Results are typically displayed as tables, charts,
histograms, and graphs. Findings tend to be broad and
generalizable.
Surveys, quasi-experiments,
experiments, statistical analyses of data
One-time post-test, no comparison group
Simple to administer, provides current
information quickly
Does not measure change
Quasi-experimental pre-post test, no
comparison group
Measures change over time
Determining causal relationships may
be difficult
Quasi-experimental post-test only with comparison group
Fairly simple comparisons to another group
Does not control for initial group differences
Quasi-experimental pre-post test with
comparison group
Provides for control of variables
Doesn’t control for changes due to testing
Experimental, post only with
random assignment
Reduces group differences
Difficult to administer in citizen-science projects
Experimental, pre-post with random
assignment
Controls for group differences and
irrelevant variables
Difficult to administer in citizen-science projects and doesn’t control for changes due to testing
QUALITATIVERely on the collection of
data in the form of text and images. Designs are iterative and reflexive. Data analysis
is interpretative based on individual researcher
perspective. Findings tend to be richly detailed and
less generalizable to large populations.
Observations, interviews, focus groups,
document analysis, journaling, personal meaning mapping
Narrative Allows participant to write their own story
Storytelling approach may have limited
applicability
Phenomenological
Provides data on meaning and how
individuals experience a phenomenon
Requires extensive and prolonged engagement
by the researcher
EthnographyProduces rich and
detailed cultural data over long time periods
Requires extensive and prolonged engagement
by the researcher
Grounded TheoryDevelopment of a
theory from data that the researcher collects
Complex and intensive data collection
and analysis
Case Study
Uses a variety of data collection
procedures to provide detailed accounts
Limited generalizability
MIxED METHODSQuantitative and qualitative methods or techniques can
be mixed in one overall study.
Any mixture of quantitative and qualitative data collection types
Any mixture of quantitative and qualitative
design strategies
Combines complementary
strengths of qualitative and quantitative designs
Requires skill in interpreting data
from qualitative and quantitative approaches
TABLE 3: STRENGTHS AND WEAKNESSES OF VARIOUS EVALUATION DESIGNS(AdaptedfromFriedman2008andCreswell2003)

20
The previous section described how to plan an evaluation. This section explains how to use the plan to guide implementation of your evaluation. The goal of the implementation phase is to collect credible data that will increase the accuracy and utility of the evaluation.
A. Choose your instrumentInstruments can include protocols for interviews, observation, or focus groups; surveys and questionnaires; and tests and quizzes. If you are planning on using surveys or questionnaires for data collection, use existing measures whenever possible, (see sidebar “What is an Instrument” on page 22). The drawback to using an existing instrument is that it may not fit your exact needs, in which case you may need to modify it slightly. If you do modify an instrument, check with the developers to make sure that your changes do not effect its validity and reliability.
Sometimes it is necessary to develop original instruments to measure outcomes of your intended audience. The most important part of instrument development is to clearly define what you want to measure, often called a “construct” or an idea containing various conceptual elements. See page 10 for examples of learning constructs relevant to citizen
science. You may also need to review the literature to determine how the construct you are interested in measuring has been studied.
B. Follow best practices for survey developmentIf you are creating a new instrument such as a survey, create a draft and share it with your colleagues or with individuals considered to be experts in the construct. Seek their feedback on the instrument’s relevance to the construct, as well as its language, clarity, and redundancy. Make any changes or revisions to the instrument from your internal review. Keep the instrument as brief as possible and collect only the data that you are certain will be analyzed and used. See Appendix F for guidance on developing a quality survey.
Whatever instrument you use, be sure to include demographic items that describe your population. Common demographic items include age, gender, ethnicity, and education level. Examples of demo-graphic items can be found in Appendix g.
DEVELOP
PHASE 2: IMPLEMENT
Monitoring mountain goats, Glacier National Park Citizen-Science Program, Courtesy Glacier National Park Service
21
evAluATor TipIf developing an original survey, make sure questions and answers are specific, short,
and use simple language. Avoid using jargon, abbreviations, and double-barreled
questions. Review “How to Conduct Your Own Survey” by Salant and Dillman (1994)
for information on survey design.
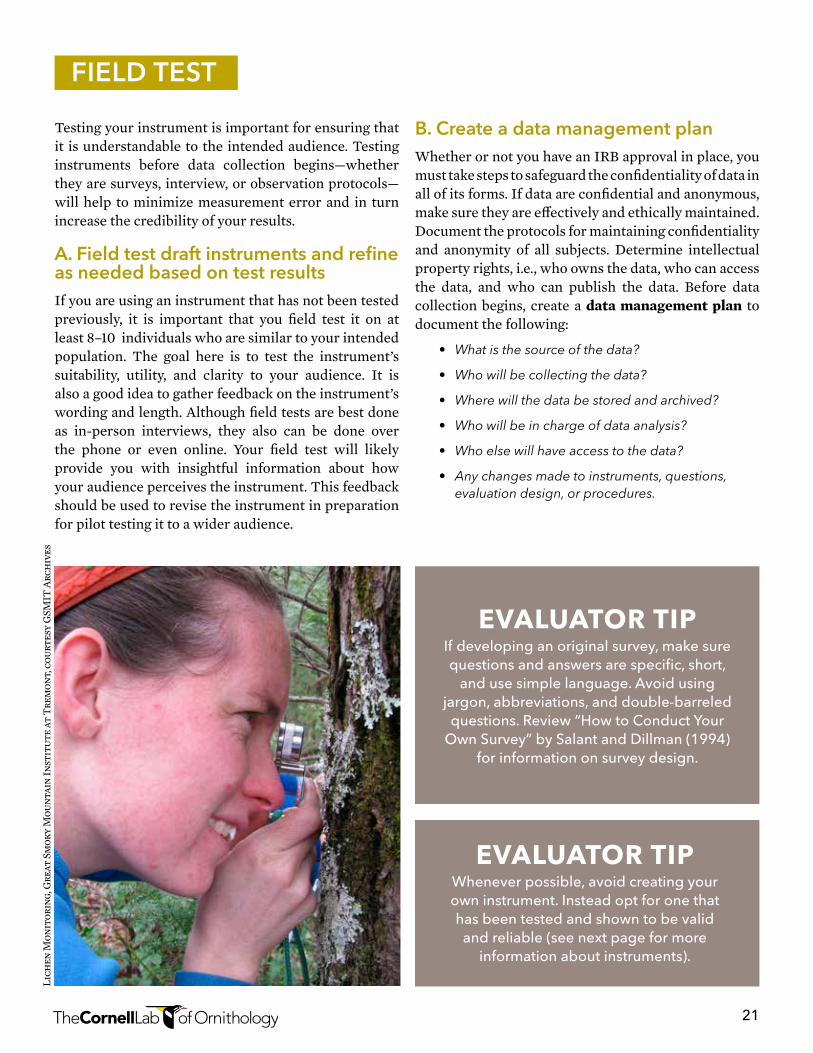
Testing your instrument is important for ensuring that it is understandable to the intended audience. Testing instruments before data collection begins—whether they are surveys, interview, or observation protocols—will help to minimize measurement error and in turn increase the credibility of your results.
A. Field test draft instruments and refine as needed based on test results If you are using an instrument that has not been tested previously, it is important that you field test it on at least 8–10 individuals who are similar to your intended population. The goal here is to test the instrument’s suitability, utility, and clarity to your audience. It is also a good idea to gather feedback on the instrument’s wording and length. Although field tests are best done as in-person interviews, they also can be done over the phone or even online. Your field test will likely provide you with insightful information about how your audience perceives the instrument. This feedback should be used to revise the instrument in preparation for pilot testing it to a wider audience.
B. Create a data management planWhether or not you have an IRB approval in place, you must take steps to safeguard the confidentiality of data in all of its forms. If data are confidential and anonymous, make sure they are effectively and ethically maintained. Document the protocols for maintaining confidentiality and anonymity of all subjects. Determine intellectual property rights, i.e., who owns the data, who can access the data, and who can publish the data. Before data collection begins, create a data management plan to document the following:
• Whatisthesourceofthedata?
• Whowillbecollectingthedata?
• Wherewillthedatabestoredandarchived?
• Whowillbeinchargeofdataanalysis?
• Whoelsewillhaveaccesstothedata?
• Anychangesmadetoinstruments,questions,evaluation design, or procedures.
FIELD TEST
evAluATor TipWhenever possible, avoid creating your own instrument. Instead opt for one that has been tested and shown to be valid and reliable (see next page for more
information about instruments).
Lich
en M
onit
orin
g, G
reat
Sm
oky
Mou
ntai
n In
stit
ute
at T
rem
ont,
cou
rtes
y G
SMIT
Arc
hive
s
22
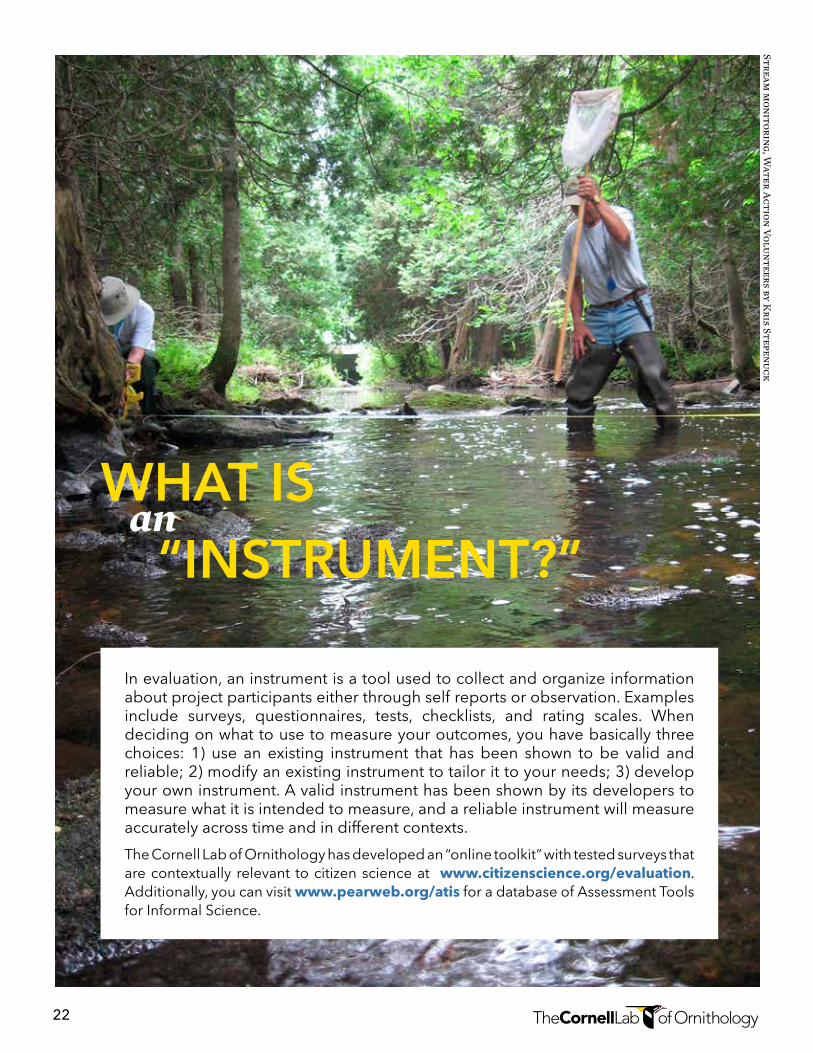
In evaluation, an instrument is a tool used to collect and organize information about project participants either through self reports or observation. Examples include surveys, questionnaires, tests, checklists, and rating scales. When deciding on what to use to measure your outcomes, you have basically three choices: 1) use an existing instrument that has been shown to be valid and reliable; 2) modify an existing instrument to tailor it to your needs; 3) develop your own instrument. A valid instrument has been shown by its developers to measure what it is intended to measure, and a reliable instrument will measure accurately across time and in different contexts.
The Cornell Lab of Ornithology has developed an “online toolkit” with tested surveys that are contextually relevant to citizen science at www.citizenscience.org/evaluation. Additionally, you can visit www.pearweb.org/atis for a database of Assessment Tools for Informal Science.
WHAT ISan
“INSTRUMENT?”
Stream m
onitoring, Water A
ction Volunteers by Kris Stepenuck
23
Administering your data collection instrument(s) is perhaps the most exciting phase of conducting your evaluation. Whether you are administering a survey or series of interviews, observations, or focus groups, this is where all your hard work begins to pay off by collecting credible evidence about your project.
A. Recruit participantsRecruiting participants for your evaluation is often harder and more time-consuming than expected. Give yourself plenty of time to recruit participants and plan on recruiting more than you need, with the expectation that many will not agree to participate. You also will need to determine the best medium for collecting your data. Will you use an online survey tool, phone, in-person, or mail campaign?
Before collecting data, be sure participants under-stand the purpose of the evaluation, the time required, any potential risks and benefits of participating, how data will be used, who to contact for more information, and how confidentiality will be protected. If you are collecting any type of personal information, including email, it is wise to have participants read and sign a consent form tailored to your study (see Appendix C for a sample form). If you are working with children, be sure to have parents and/or guardians consent to their participation. Importantly, determine if your institution has an Institutional Review Board (IRB); if so you will likely need to obtain its approval before initiating your study.
B. Administer final instruments and collect dataOnce data collection begins, keep a detailed electronic spreadsheet that tracks all of your data collection efforts and includes information such as the instru-ment name, creation date, administration date, initial and final sample size, overall response rate (final sample size/initial sample size) and any changes made to the instrument.
It is also a good idea to periodically monitor the data being collected and take steps to improve data quality if necessary. Check your data early to help answer the following important questions:
• Areyoureachingyourintendedaudienceoraresomegroups under or overrepresented?
• Arethedataprovidingthekindofusefulinformationyouintended?Dotheyhelpansweryourinitialevaluation questions?
• Arethedatabeingcollectedinawaythatcanbeanalyzed?
• Areyoucollectingtherightamountofdata?
ADMINISTER
evAluATor TipFor more information on ethics in
evaluation, see the American Evaluation Association’s Guiding Principles for Evaluators at: http://www.eval.org/publications/guidingprinciples.asp.
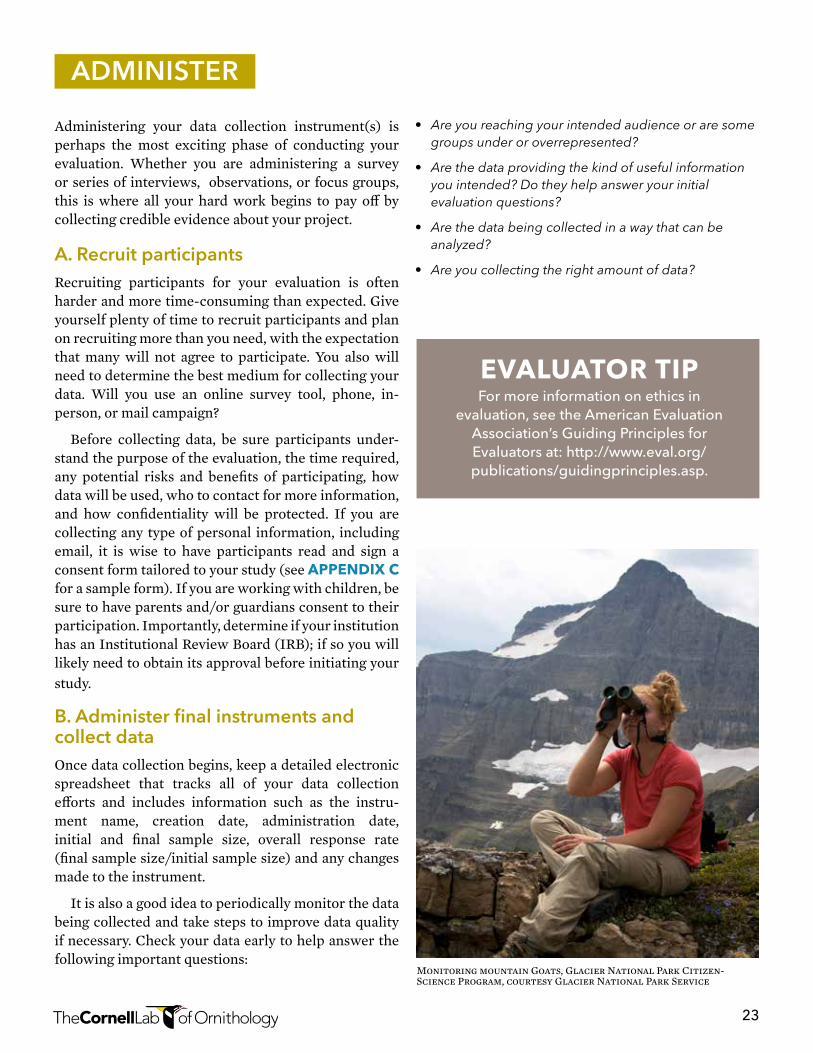
Monitoring mountain Goats, Glacier National Park Citizen-Science Program, courtesy Glacier National Park Service
24
Data analysis can take many different forms depending on the project need, audience, and how the information will be used. If expertise in data analysis is not available internally, consider hiring someone with the required skill set. Before analysis takes place, review the evaluation questions to focus your data analysis.
A. Make a copy of the original raw dataIrrespective of the kind of data collected, and before any data analysis takes place, copy and rename a working data file. Whether the data arrive electronically or on paper, be sure to keep the original, raw data untouched. Document the description and location of the file, as well as any changes to the working data file such as cleaning, transformation, and coding.
B. Working with quantitative data (numerically-based data)Quantitative data are numerical in nature, and typically analyzed using statistical tests and methods. Common stats packages include Excel, Access, JMP, SAS, SPSS, STATA, R, and Minitab. Most of these are not free, but check with your organization regarding the availability of a group license. Results are typically displayed as tables, charts, and graphs.
1. Create a codebook for organizing all your data.
If data arrive to you on paper, take the time to convert the information to an electronic database. Then develop a codebook, which helps you manage your data by providing definitions of variable labels and other important information that can be shared with anyone who is analyzing the data. As you examine your data, determine the type of data for each variable (i.e., categorical, ordinal, interval, or continuous—see sidebar on page 27). TABle 4 illustrates an example codebook.
2. Clean and transform the data
Most quantitative data will need to be checked for errors. For example, look to see that for each variable, the answers are within acceptable ranges. In some cases you can fix the errors but sometimes you may have to treat the errors as missing data. You also may decide to exclude certain data in your analysis, e.g., if some respondents skipped a majority of questions.
After error-checking is complete, you will likely need to transform the data. For example, yes/no responses are typically coded as “1” for yes and “0” for no. If you have scale items (i.e., strongly disagree to strongly agree), you will need to record each of these as numbers. In general, number the recoded items such that the higher the number the more positive the response.
ANALYZE
PHASE 3: SHARE
Aquatic Salamander Monitoring, Great Smoky Mountain Institute at Tremont, courtesy GSMIT Archives
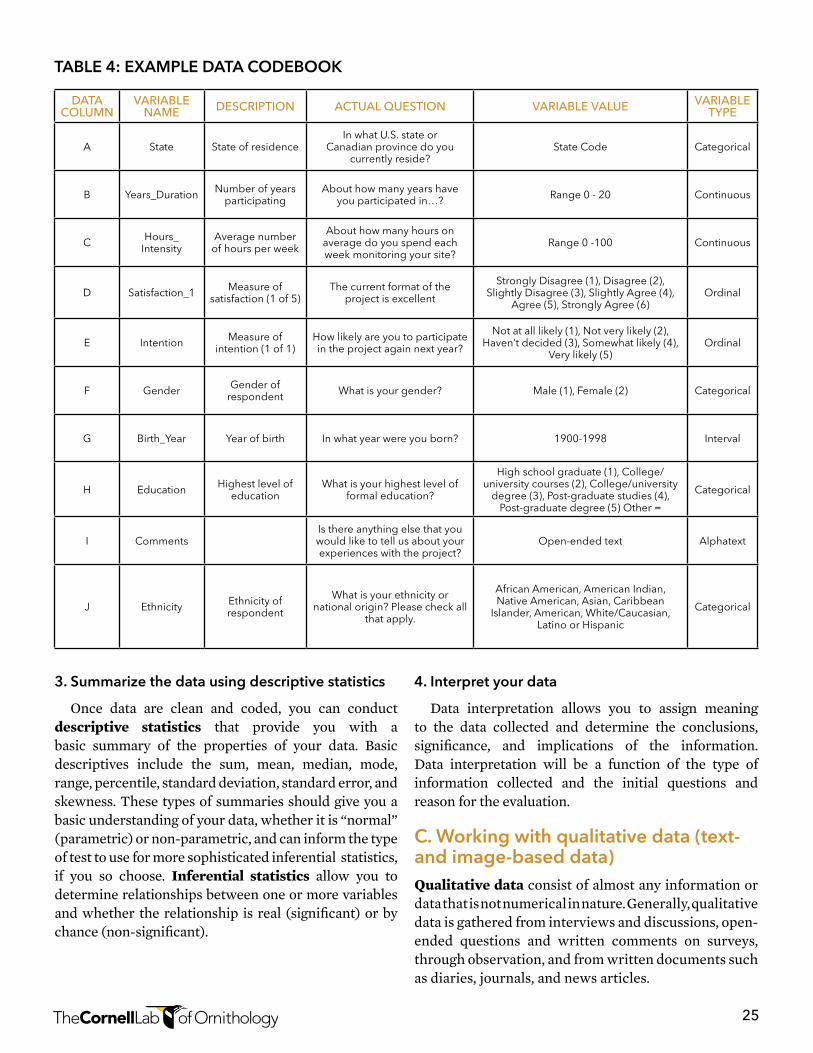
25
3. Summarize the data using descriptive statistics
Once data are clean and coded, you can conduct descriptive statistics that provide you with a basic summary of the properties of your data. Basic descriptives include the sum, mean, median, mode, range, percentile, standard deviation, standard error, and skewness. These types of summaries should give you a basic understanding of your data, whether it is “normal” (parametric) or non-parametric, and can inform the type of test to use for more sophisticated inferential statistics, if you so choose. Inferential statistics allow you to determine relationships between one or more variables and whether the relationship is real (significant) or by chance (non-significant).
4. Interpret your data
Data interpretation allows you to assign meaning to the data collected and determine the conclusions, significance, and implications of the information. Data interpretation will be a function of the type of information collected and the initial questions and reason for the evaluation.
C. Working with qualitative data (text- and image-based data)Qualitative data consist of almost any information or data that is not numerical in nature. Generally, qualitative data is gathered from interviews and discussions, open-ended questions and written comments on surveys, through observation, and from written documents such as diaries, journals, and news articles.
DATA COLUMN
VARIABLE NAME DESCRIPTION ACTUAL QUESTION VARIABLE VALUE VARIABLE
TYPE
A State State of residenceIn what U.S. state or
Canadian province do you currently reside?
State Code Categorical
B Years_Duration Number of years participating
About how many years have you participated in…? Range 0 - 20 Continuous
C Hours_Intensity
Average number of hours per week
About how many hours on average do you spend each week monitoring your site?
Range 0 -100 Continuous
D Satisfaction_1 Measure of satisfaction (1 of 5)
The current format of the project is excellent
Strongly Disagree (1), Disagree (2), Slightly Disagree (3), Slightly Agree (4),
Agree (5), Strongly Agree (6)Ordinal
E Intention Measure of intention (1 of 1)
How likely are you to participate in the project again next year?
Not at all likely (1), Not very likely (2), Haven’t decided (3), Somewhat likely (4),
Very likely (5)Ordinal
F Gender Gender of respondent What is your gender? Male (1), Female (2) Categorical
G Birth_Year Year of birth In what year were you born? 1900-1998 Interval
H Education Highest level of education
What is your highest level of formal education?
High school graduate (1), College/university courses (2), College/university
degree (3), Post-graduate studies (4), Post-graduate degree (5) Other =
Categorical
I CommentsIs there anything else that you would like to tell us about your experiences with the project?
Open-ended text Alphatext
j Ethnicity Ethnicity of respondent
What is your ethnicity or national origin? Please check all
that apply.
African American, American Indian, Native American, Asian, Caribbean
Islander, American, White/Caucasian, Latino or Hispanic
Categorical
TABLE 4: EXAMPLE DATA CODEBOOK
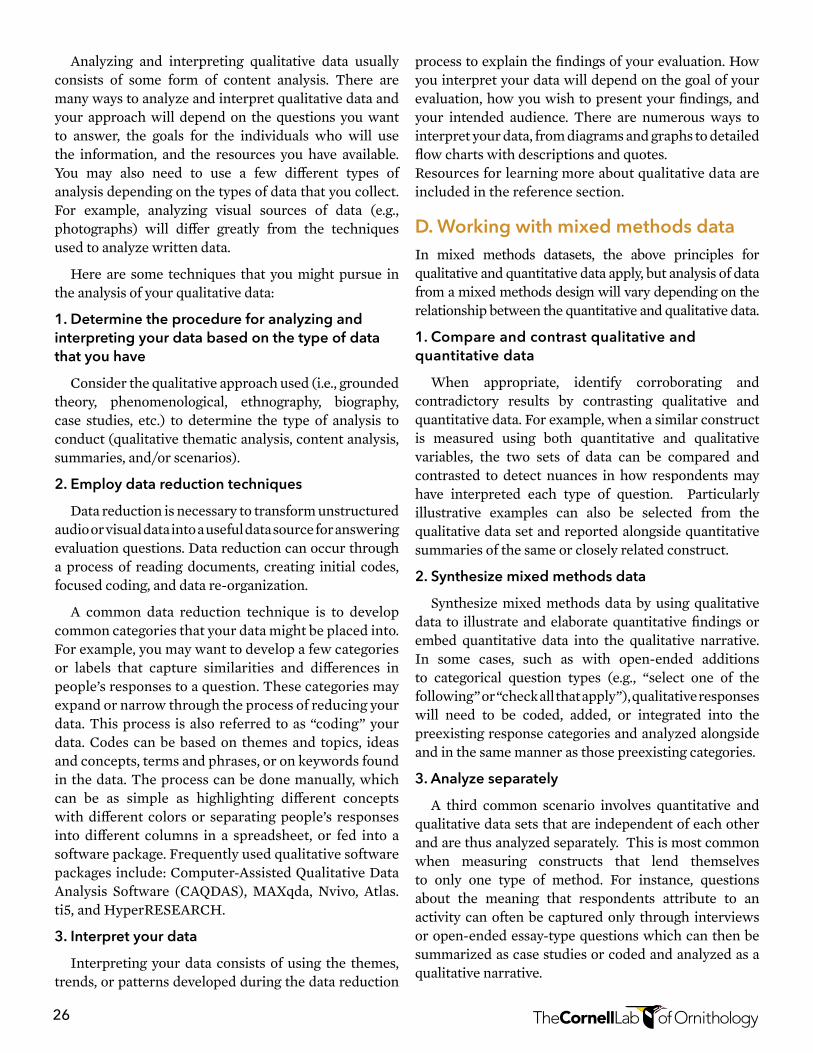
26
Analyzing and interpreting qualitative data usually consists of some form of content analysis. There are many ways to analyze and interpret qualitative data and your approach will depend on the questions you want to answer, the goals for the individuals who will use the information, and the resources you have available. You may also need to use a few different types of analysis depending on the types of data that you collect. For example, analyzing visual sources of data (e.g., photographs) will differ greatly from the techniques used to analyze written data.
Here are some techniques that you might pursue in the analysis of your qualitative data:
1. Determine the procedure for analyzing and interpreting your data based on the type of data that you have
Consider the qualitative approach used (i.e., grounded theory, phenomenological, ethnography, biography, case studies, etc.) to determine the type of analysis to conduct (qualitative thematic analysis, content analysis, summaries, and/or scenarios).
2. Employ data reduction techniques
Data reduction is necessary to transform unstructured audio or visual data into a useful data source for answering evaluation questions. Data reduction can occur through a process of reading documents, creating initial codes, focused coding, and data re-organization.
A common data reduction technique is to develop common categories that your data might be placed into. For example, you may want to develop a few categories or labels that capture similarities and differences in people’s responses to a question. These categories may expand or narrow through the process of reducing your data. This process is also referred to as “coding” your data. Codes can be based on themes and topics, ideas and concepts, terms and phrases, or on keywords found in the data. The process can be done manually, which can be as simple as highlighting different concepts with different colors or separating people’s responses into different columns in a spreadsheet, or fed into a software package. Frequently used qualitative software packages include: Computer-Assisted Qualitative Data Analysis Software (CAQDAS), MAXqda, Nvivo, Atlas.ti5, and HyperRESEARCH.
3. Interpret your data
Interpreting your data consists of using the themes, trends, or patterns developed during the data reduction
process to explain the findings of your evaluation. How you interpret your data will depend on the goal of your evaluation, how you wish to present your findings, and your intended audience. There are numerous ways to interpret your data, from diagrams and graphs to detailed flow charts with descriptions and quotes. Resources for learning more about qualitative data are included in the reference section.
D. Working with mixed methods dataIn mixed methods datasets, the above principles for qualitative and quantitative data apply, but analysis of data from a mixed methods design will vary depending on the relationship between the quantitative and qualitative data.
1. Compare and contrast qualitative and quantitative data
When appropriate, identify corroborating and contradictory results by contrasting qualitative and quantitative data. For example, when a similar construct is measured using both quantitative and qualitative variables, the two sets of data can be compared and contrasted to detect nuances in how respondents may have interpreted each type of question. Particularly illustrative examples can also be selected from the qualitative data set and reported alongside quantitative summaries of the same or closely related construct.
2. Synthesize mixed methods data
Synthesize mixed methods data by using qualitative data to illustrate and elaborate quantitative findings or embed quantitative data into the qualitative narrative. In some cases, such as with open-ended additions to categorical question types (e.g., “select one of the following” or “check all that apply”), qualitative responses will need to be coded, added, or integrated into the preexisting response categories and analyzed alongside and in the same manner as those preexisting categories.
3. Analyze separately
A third common scenario involves quantitative and qualitative data sets that are independent of each other and are thus analyzed separately. This is most common when measuring constructs that lend themselves to only one type of method. For instance, questions about the meaning that respondents attribute to an activity can often be captured only through interviews or open-ended essay-type questions which can then be summarized as case studies or coded and analyzed as a qualitative narrative.
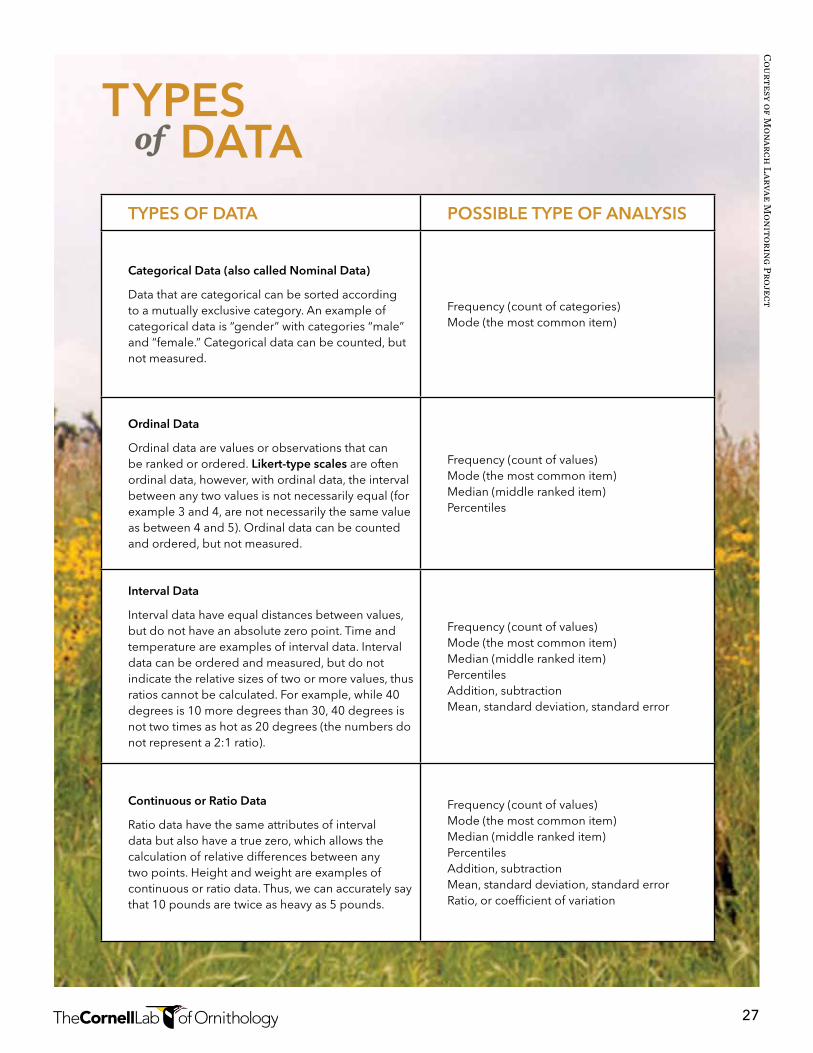
27
TYPES OF DATA POSSIBLE TYPE OF ANALYSIS
Categorical Data (also called Nominal Data)
Data that are categorical can be sorted according to a mutually exclusive category. An example of categorical data is “gender” with categories “male” and “female.” Categorical data can be counted, but not measured.
Frequency (count of categories) Mode (the most common item)
Ordinal Data
Ordinal data are values or observations that can be ranked or ordered. Likert-type scales are often ordinal data, however, with ordinal data, the interval between any two values is not necessarily equal (for example 3 and 4, are not necessarily the same value as between 4 and 5). Ordinal data can be counted and ordered, but not measured.
Frequency (count of values) Mode (the most common item) Median (middle ranked item) Percentiles
Interval Data
Interval data have equal distances between values, but do not have an absolute zero point. Time and temperature are examples of interval data. Interval data can be ordered and measured, but do not indicate the relative sizes of two or more values, thus ratios cannot be calculated. For example, while 40 degrees is 10 more degrees than 30, 40 degrees is not two times as hot as 20 degrees (the numbers do not represent a 2:1 ratio).
Frequency (count of values) Mode (the most common item) Median (middle ranked item) Percentiles Addition, subtraction Mean, standard deviation, standard error
Continuous or Ratio Data
Ratio data have the same attributes of interval data but also have a true zero, which allows the calculation of relative differences between any two points. Height and weight are examples of continuous or ratio data. Thus, we can accurately say that 10 pounds are twice as heavy as 5 pounds.
Frequency (count of values) Mode (the most common item) Median (middle ranked item) Percentiles Addition, subtraction Mean, standard deviation, standard error Ratio, or coefficient of variation
TYPES of DATA
Courtesy of M
onarch Larvae M
onitoring Project
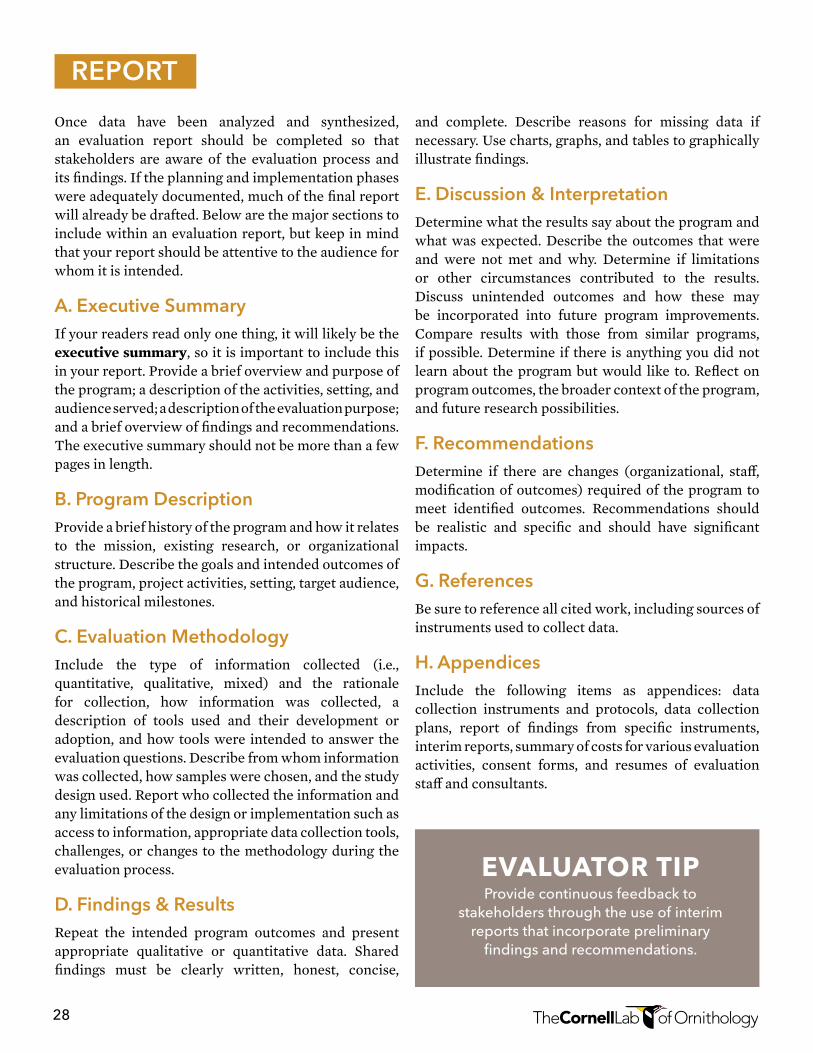
28
Once data have been analyzed and synthesized, an evaluation report should be completed so that stakeholders are aware of the evaluation process and its findings. If the planning and implementation phases were adequately documented, much of the final report will already be drafted. Below are the major sections to include within an evaluation report, but keep in mind that your report should be attentive to the audience for whom it is intended.
A. Executive Summary If your readers read only one thing, it will likely be the executive summary, so it is important to include this in your report. Provide a brief overview and purpose of the program; a description of the activities, setting, and audience served; a description of the evaluation purpose; and a brief overview of findings and recommendations. The executive summary should not be more than a few pages in length.
B. Program DescriptionProvide a brief history of the program and how it relates to the mission, existing research, or organizational structure. Describe the goals and intended outcomes of the program, project activities, setting, target audience, and historical milestones.
C. Evaluation MethodologyInclude the type of information collected (i.e., quantitative, qualitative, mixed) and the rationale for collection, how information was collected, a description of tools used and their development or adoption, and how tools were intended to answer the evaluation questions. Describe from whom information was collected, how samples were chosen, and the study design used. Report who collected the information and any limitations of the design or implementation such as access to information, appropriate data collection tools, challenges, or changes to the methodology during the evaluation process.
D. Findings & ResultsRepeat the intended program outcomes and present appropriate qualitative or quantitative data. Shared findings must be clearly written, honest, concise,
and complete. Describe reasons for missing data if necessary. Use charts, graphs, and tables to graphically illustrate findings.
E. Discussion & InterpretationDetermine what the results say about the program and what was expected. Describe the outcomes that were and were not met and why. Determine if limitations or other circumstances contributed to the results. Discuss unintended outcomes and how these may be incorporated into future program improvements. Compare results with those from similar programs, if possible. Determine if there is anything you did not learn about the program but would like to. Reflect on program outcomes, the broader context of the program, and future research possibilities.
F. RecommendationsDetermine if there are changes (organizational, staff, modification of outcomes) required of the program to meet identified outcomes. Recommendations should be realistic and specific and should have significant impacts.
G. References Be sure to reference all cited work, including sources of instruments used to collect data.
H. AppendicesInclude the following items as appendices: data collection instruments and protocols, data collection plans, report of findings from specific instruments, interim reports, summary of costs for various evaluation activities, consent forms, and resumes of evaluation staff and consultants.
REPORT
evAluATor TipProvide continuous feedback to
stakeholders through the use of interim reports that incorporate preliminary
findings and recommendations.
29
It may seem like a long journey to finally reach this point, but here is where you get to put all of this effort to good use. Not all evaluations will show positive findings, but remember that this is a learning opportunity to understand what worked and what didn’t. Although no one wants to highlight negative results, refrain from reporting only on positive findings. Including what did not work adds credibility to your efforts and helps inform the practice of other practitioners. For various reasons, many evaluation reports never see the light of day, so make it a point to get your report disseminated in both traditional and non-traditional venues.
A. Share with stakeholdersIt is important that your stakeholders are comfortable with what is in your report and where you plan to disseminate it, so after the report has been written, share it with key stakeholders before disseminating it more broadly.
B. Consider publishingWhat have you learned as a result of your evaluation? Perhaps there are key findings that could be of value to others working within the citizen-science realm. With a little bit of work, an evaluation report can be rewritten as a paper for peer review. Below is a partial list of journals that have published papers on citizen-science outcomes:
• EcologyandSociety
• JournalofEnvironmentalEducation
• PublicUnderstandingofScience
• ConservationBiology
• ScienceEducation
• FrontiersinEcologyandtheEnvironment
• InternationalJournalofScienceEducation
C. Consider non-traditional optionsMany other options exist for disseminating your work. If your goal is to showcase your program far and wide, consider these ideas:
• Uploadthereporttoinformalscience.organdcitizenscience.org.
• Uploadyourreportonyourorganization’swebsite.
• Publishresultsorpartofyourresultsinalocalnewspaper.
• Airyourresultsonalocalradiostation.
• Summarizethereportasaneasy-to-readflyerandpost it in visible places at your organization, local businesses, community centers, and libraries.
D. Inform your programWith your evaluation complete, you can now make important decisions about your program based on sound evidence. One of the first questions that a summative evaluation helps to answer is: “Did the program achieve its intended goals and outcomes?” If not, your evaluation should provide information to help determine why outcomes were not met. These types of findings can be just as important as those that show positive program impact because they can help clarify where your program needs improvement.
With buy-in from key staff and stakeholders, it is critical to review the evaluation findings and determine what, if any, modifications to the program should be implemented. The evaluation report will likely provide recommendations, some of which will be more feasible than others. Together, your team should prioritize the recommendations based on what is feasible given time and resources, what is most critical, and what is likely to be supported by stakeholders. Program staff should develop a working timeline for implementing and monitoring key recommendations, with ample opportunity to provide feedback on the changes.
The evaluation report may also highlight some unintended outcomes that can be extremely enlightening for future planning. Unintended outcomes should be discussed at length with the project team as they can result in a shift or new emphasis for your program that you had not considered before.
DISSEMINATE & INFORM
evAluATor TipSchedule follow-up meetings with
evaluation users to assist in the transmission of evaluation results and recommendations into appropriate action or decision-making.
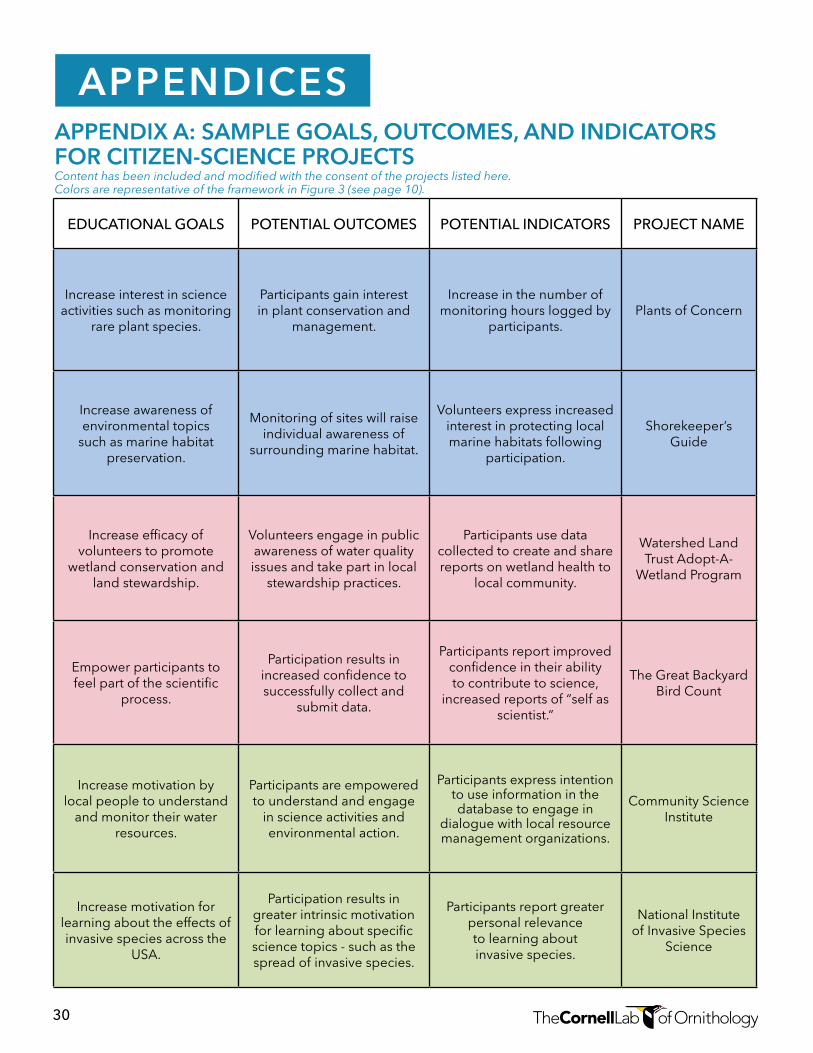
30
APPENDICESAPPENDIX A: SAMPLE GOALS, OUTCOMES, AND INDICATORS FOR CITIZEN-SCIENCE PROjECTS
EDUCATIONAL GOALS POTENTIAL OUTCOMES POTENTIAL INDICATORS PROJECT NAME
Increase interest in science activities such as monitoring
rare plant species.
Participants gain interest in plant conservation and
management.
Increase in the number of monitoring hours logged by
participants.Plants of Concern
Increase awareness of environmental topics
such as marine habitat preservation.
Monitoring of sites will raise individual awareness of
surrounding marine habitat.
Volunteers express increased interest in protecting local marine habitats following
participation.
Shorekeeper’s Guide
Increase efficacy of volunteers to promote
wetland conservation and land stewardship.
Volunteers engage in public awareness of water quality issues and take part in local
stewardship practices.
Participants use data collected to create and share reports on wetland health to
local community.
Watershed Land Trust Adopt-A-
Wetland Program
Empower participants to feel part of the scientific
process.
Participation results in increased confidence to successfully collect and
submit data.
Participants report improved confidence in their ability to contribute to science,
increased reports of “self as scientist.”
The Great Backyard Bird Count
Increase motivation by local people to understand
and monitor their water resources.
Participants are empowered to understand and engage
in science activities and environmental action.
Participants express intention to use information in the database to engage in
dialogue with local resource management organizations.
Community Science Institute
Increase motivation for learning about the effects of invasive species across the
USA.
Participation results in greater intrinsic motivation for learning about specific science topics - such as the spread of invasive species.
Participants report greater personal relevance to learning about invasive species.
National Institute of Invasive Species
Science
Contenthasbeenincludedandmodifiedwiththeconsentoftheprojectslistedhere.ColorsarerepresentativeoftheframeworkinFigure3(seepage10).
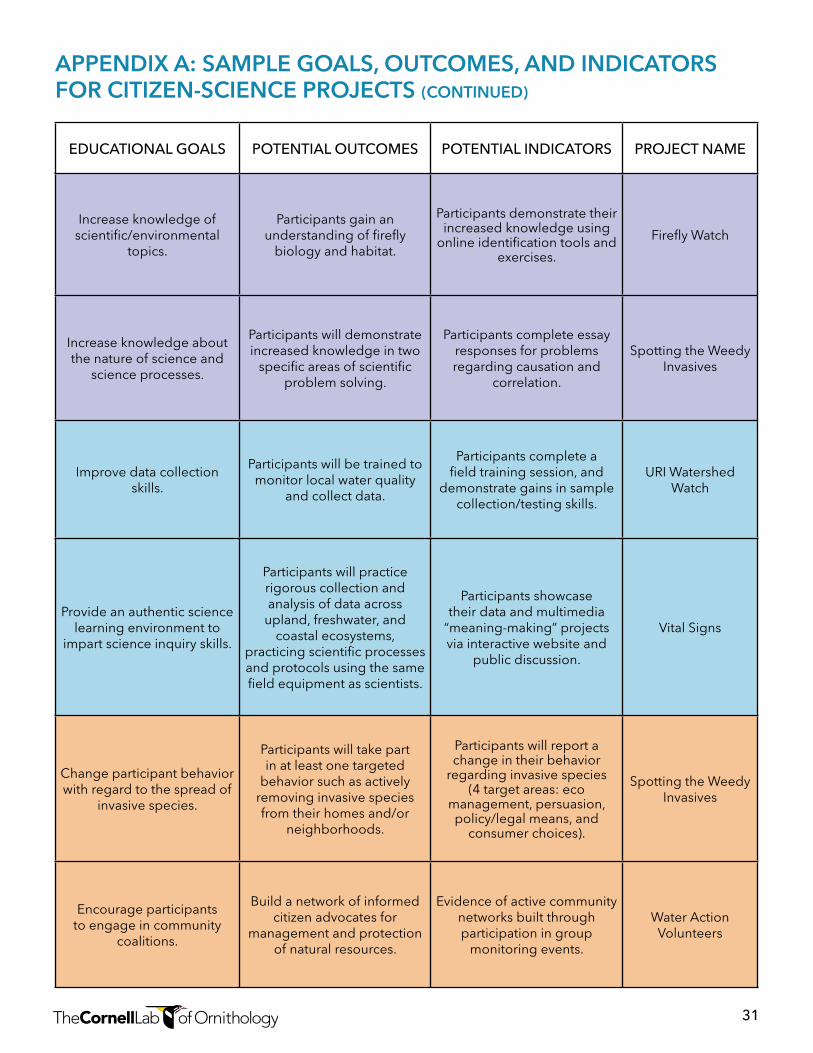
31
APPENDIX A: SAMPLE GOALS, OUTCOMES, AND INDICATORS FOR CITIZEN-SCIENCE PROjECTS (CONTINUED)
EDUCATIONAL GOALS POTENTIAL OUTCOMES POTENTIAL INDICATORS PROJECT NAME
Increase knowledge of scientific/environmental
topics.
Participants gain an understanding of firefly
biology and habitat.
Participants demonstrate their increased knowledge using
online identification tools and exercises.
Firefly Watch
Increase knowledge about the nature of science and
science processes.
Participants will demonstrate increased knowledge in two
specific areas of scientific problem solving.
Participants complete essay responses for problems regarding causation and
correlation.
Spotting the Weedy Invasives
Improve data collection skills.
Participants will be trained to monitor local water quality
and collect data.
Participants complete a field training session, and
demonstrate gains in sample collection/testing skills.
URI Watershed Watch
Provide an authentic science learning environment to
impart science inquiry skills.
Participants will practice rigorous collection and analysis of data across
upland, freshwater, and coastal ecosystems,
practicing scientific processes and protocols using the same field equipment as scientists.
Participants showcase their data and multimedia
“meaning-making” projects via interactive website and
public discussion.
Vital Signs
Change participant behavior with regard to the spread of
invasive species.
Participants will take part in at least one targeted
behavior such as actively removing invasive species from their homes and/or
neighborhoods.
Participants will report a change in their behavior
regarding invasive species (4 target areas: eco
management, persuasion, policy/legal means, and
consumer choices).
Spotting the Weedy Invasives
Encourage participants to engage in community
coalitions.
Build a network of informed citizen advocates for
management and protection of natural resources.
Evidence of active community networks built through participation in group
monitoring events.
Water Action Volunteers
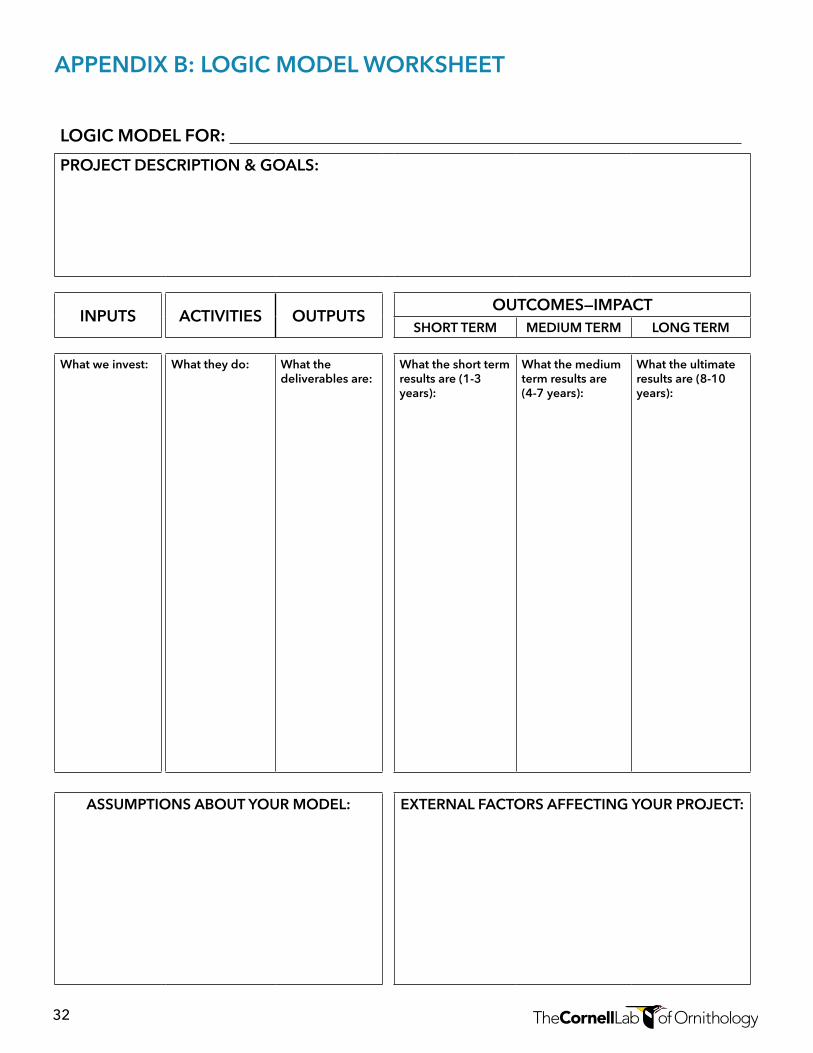
32
LOGIC MODEL FOR:
PROjECT DESCRIPTION & GOALS:
INPUTS ACTIVITIES OUTPUTSOUTCOMES—IMPACT
SHORT TERM MEDIUM TERM LONG TERM
What we invest: What they do: What the deliverables are:
What the short term results are (1-3 years):
What the medium term results are (4-7 years):
What the ultimate results are (8-10 years):
ASSUMPTIONS ABOUT YOUR MODEL: EXTERNAL FACTORS AFFECTING YOUR PROjECT:
APPENDIX B: LOGIC MODEL WORKSHEET
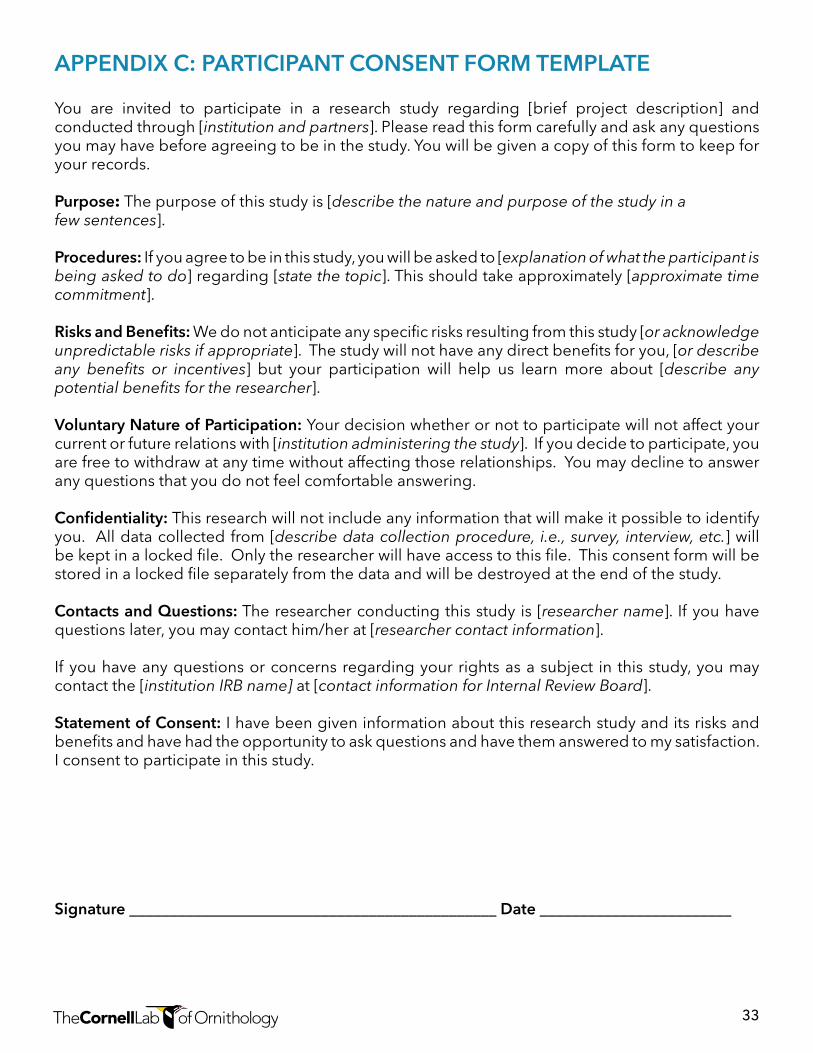
33
APPENDIX C: PARTICIPANT CONSENT FORM TEMPLATE
You are invited to participate in a research study regarding [brief project description] and conducted through [institution and partners]. Please read this form carefully and ask any questions you may have before agreeing to be in the study. You will be given a copy of this form to keep for your records.
Purpose: The purpose of this study is [describe the nature and purpose of the study in a fewsentences].
Procedures: If you agree to be in this study, you will be asked to [explanationofwhattheparticipantisbeingaskedtodo] regarding [state the topic]. This should take approximately [approximatetimecommitment].
Risks and Benefits: We do not anticipate any specific risks resulting from this study [oracknowledgeunpredictablerisksifappropriate]. The study will not have any direct benefits for you, [or describe any benefits or incentives] but your participation will help us learn more about [describe any potential benefits for the researcher].
Voluntary Nature of Participation: Your decision whether or not to participate will not affect your current or future relations with [institution administering the study]. If you decide to participate, you are free to withdraw at any time without affecting those relationships. You may decline to answer any questions that you do not feel comfortable answering.
Confidentiality: This research will not include any information that will make it possible to identify you. All data collected from [describedatacollectionprocedure, i.e.,survey, interview,etc.] will be kept in a locked file. Only the researcher will have access to this file. This consent form will be stored in a locked file separately from the data and will be destroyed at the end of the study.
Contacts and Questions: The researcher conducting this study is [researcher name]. If you have questions later, you may contact him/her at [researcher contact information].
If you have any questions or concerns regarding your rights as a subject in this study, you may contact the [institution IRB name] at [contactinformationforInternalReviewBoard].
Statement of Consent: I have been given information about this research study and its risks and benefits and have had the opportunity to ask questions and have them answered to my satisfaction. I consent to participate in this study.
Signature ______________________________________________ Date ________________________

34
APPENDIX D: COMPARISON OF DATA COLLECTION METHODSM
ETH
OD
DE
SCR
IPTI
ON
STR
EN
GTH
SW
EA
KN
ESS
ES
Surv
eyD
ata
are
usua
lly c
olle
cted
thro
ugh
q
uest
ionn
aire
s, a
ltho
ugh
som
etim
es
rese
arch
ers
dire
ctly
inte
rvie
w s
ubje
cts.
Su
rvey
s ca
n us
e q
ualit
ativ
e (e
.g. a
sk
op
en-e
nded
que
stio
ns) o
r q
uant
itativ
e (e
.g.,
use
forc
ed-c
hoic
e q
uest
ions
) m
easu
res.
Surv
eys
can
be
used
to c
olle
ct a
wid
e ra
nge
of
info
rmat
ion
and
are
a g
reat
sta
rtin
g p
oin
t to
div
e d
eep
er in
to a
n is
sue.
The
y ca
n b
e in
exp
ensi
ve a
nd
easy
to a
dm
inis
ter,
and
pro
vid
e an
ony
mity
. The
y al
so p
rovi
de
a so
urce
of g
ener
aliz
able
sta
tistic
al
dat
a. S
urve
ys c
an b
e ad
min
iste
red
via
tele
pho
ne,
thro
ugh
emai
l, an
d in
per
son.
If no
t dev
elo
ped
pro
per
ly, s
urve
ys c
an b
e la
den
w
ith m
ultip
le s
our
ces
of e
rro
r. O
ften
, sur
veys
o
nly
scan
the
surf
ace
of a
n is
sue.
Sam
plin
g a
nd
stat
istic
al e
xper
tise
may
be
nece
ssar
y.
Inte
rvie
ws
Inte
rvie
ws
invo
lve
dire
ct d
iscu
ssio
n b
etw
een
the
rese
arch
er a
nd th
e p
artic
ipan
t. In
terv
iew
s ca
n b
e in
form
al
or
stru
ctur
ed.
Inte
rvie
ws
are
com
pre
hens
ive
and
ad
apta
ble
. Th
ey p
rovi
de
in-d
epth
det
ail a
nd u
niq
ue in
sig
hts
abo
ut a
top
ic. I
nter
view
s ca
n b
e he
ld v
ia te
lep
hone
, th
roug
h em
ail,
and
in p
erso
n.
Inte
rvie
ws
lack
sta
tistic
al r
igo
r an
d m
ay h
ave
limite
d g
ener
aliz
abili
ty. T
hey
can
be
time-
cons
umin
g, c
ost
ly, a
nd d
ifficu
lt to
ana
lyze
. In
terv
iew
er b
ias
is a
co
ncer
n.
Focu
s g
roup
sIn
a fo
cus
gro
up, p
eop
le a
re a
sked
ab
out
thei
r p
erce
ptio
ns, o
pin
ions
, b
elie
fs, a
nd a
ttitu
des
reg
ard
ing
so
me
top
ic. F
ocu
s g
roup
s us
ually
take
pla
ce
in a
n in
tera
ctiv
e g
roup
set
ting
, typ
ical
ly
in p
erso
n.
Pro
vid
e an
in-d
epth
dis
cuss
ion
of c
onc
epts
and
al
low
the
rese
arch
er to
und
erst
and
co
ncer
ns in
a
loca
l co
ntex
t. Th
e re
sear
cher
can
ob
serv
e g
roup
in
tera
ctio
ns a
nd n
otic
e th
e d
ynam
ics
bet
wee
n nu
mer
ous
peo
ple
with
in a
co
mm
unity
.
Oth
ers
can
influ
ence
op
inio
ns in
the
gro
up a
nd
par
ticip
ants
may
no
t be
rep
rese
ntat
ive
of t
he
po
pul
atio
n. S
om
e p
artic
ipan
ts m
ay b
e re
luct
ant t
o
spea
k, w
hile
oth
ers
may
do
min
ate
conv
ersa
tion.
A
naly
sis
can
be
chal
leng
ing
.
Ob
serv
atio
nsO
bse
rvat
iona
l res
earc
h te
chni
que
s in
volv
e th
e re
sear
cher
or
rese
arch
ers
mak
ing
ob
serv
atio
ns o
f a s
ituat
ion,
ev
ent,
or
activ
ity a
nd ta
king
no
tes
or
reco
rdin
gs
of t
heir
ob
serv
atio
ns.
Allo
ws
for
a un
ique
insi
ght
into
co
ntex
ts,
rela
tions
hip
s, a
nd b
ehav
iors
pre
vio
usly
unk
now
n to
the
rese
arch
er th
at m
ay b
e cr
ucia
l fo
r th
e in
terp
reta
tion
of o
ther
dat
a.
It is
diffi
cult
to re
cord
dat
a an
d th
e q
ualit
y o
f the
d
ata
dep
end
s o
n th
e d
ilig
ence
of t
he re
sear
cher
. O
bse
rvat
ions
can
be
time-
cons
umin
g a
nd
inte
rpre
tatio
n o
f beh
avio
rs m
ay b
e d
ifficu
lt.
Eval
uato
r m
ust b
e p
rese
nt to
mak
e o
bse
rvat
ions
.
Trac
king
and
tim
ing
Refe
rs to
follo
win
g a
nd re
cord
ing
vi
sito
r b
ehav
ior,
incl
udin
g w
here
vi
sito
rs g
o, w
hat t
hey
do
, and
ho
w
long
they
sp
end
at e
ach
exhi
bit
in a
n ex
hib
itio
n. S
imila
r to
web
ana
lytic
s fo
r w
ebsi
tes.
The
rese
arch
er c
an g
et a
bet
ter
und
erst
and
ing
of
po
pul
arity
tren
ds
and
the
exhi
bits
or
pro
ject
s th
at
visi
tors
tend
to fa
vor.
Do
es n
ot p
rovi
de
feed
bac
k o
n th
e ex
hib
it o
r al
low
th
e re
sear
cher
to g
aug
e th
e vi
sito
r’s p
erce
ptio
ns o
r b
elie
fs re
gar
din
g th
e ex
hib
itio
n.
Co
ncep
t map
sC
onc
ept m
aps
incl
ude
a lin
king
of
idea
s an
d h
iera
rchi
es in
a v
isua
l, g
rap
hic
rep
rese
ntat
ion.
May
incl
ude
wo
rd li
nks
or
dire
ctio
nal a
rro
ws
to m
ap
man
y id
eas.
Can
be
gen
erat
ed o
nlin
e o
r in
-per
son
sim
ulta
neo
usly
by
num
ero
us p
eop
le. C
onc
ept
map
s p
rovi
de
a p
erm
anen
t rec
ord
of i
ndiv
idua
l un
der
stan
din
g a
t a p
artic
ular
tim
e, w
hich
will
sho
w
chan
ges
in u
nder
stan
din
g o
ver
time.
Rese
arch
ers
mus
t lea
rn h
ow
to u
se a
nd te
ach
the
tech
niq
ue a
nd p
artic
ipan
ts m
ust b
e ta
ught
ho
w
to c
ons
truc
t the
m, w
hich
can
be
time-
cons
umin
g.
Ana
lysi
s an
d in
terp
reta
tion
can
be
chal
leng
ing
.
Car
d s
ort
sC
onc
epts
of i
nter
est a
re id
entifi
ed a
nd
then
wri
tten
ont
o c
ard
s. P
artic
ipan
ts
sort
the
card
s in
to g
roup
ing
s an
d th
en
nam
e th
e ca
teg
ori
es. T
he re
sults
are
la
ter
anal
yzed
to re
veal
pat
tern
s.
Part
icip
ants
cre
ate
cate
go
ries
that
are
mea
ning
ful
to th
em. T
his
tech
niq
ue w
ork
s w
ell w
hen
sim
ilari
ties
bet
wee
n ite
ms
mak
e th
em d
ifficu
lt to
div
ide
clea
rly
into
cat
ego
ries
and
no
exi
stin
g ta
xono
my
has
bee
n es
tab
lishe
d. C
ard
so
rt is
low
-tec
h an
d c
an b
e in
exp
ensi
ve to
acc
om
plis
h. C
an b
e d
one
in p
erso
n o
r o
nlin
e.
May
pro
vid
e fa
irly
co
nsis
tent
resu
lts b
etw
een
par
ticip
ants
, or
may
var
y w
idel
y. A
naly
sis
of
the
dat
a ca
n b
e d
ifficu
lt an
d ti
me-
cons
umin
g,
par
ticul
arly
if th
ere
is li
ttle
co
nsis
tenc
y b
etw
een
par
ticip
ants
. Par
ticip
ants
may
no
t co
nsid
er w
hat
the
cont
ent i
s ab
out
and
may
just
so
rt b
y su
rfac
e ch
arac
teri
stic
s su
ch a
s d
ocu
men
t typ
es.
Dra
win
gs
Part
icip
ants
dra
w a
pic
ture
of
som
ethi
ng, w
hich
is th
en a
naly
zed
by
the
eval
uato
r.
Dra
win
gs
allo
w th
e p
artic
ipan
t to
co
mm
unic
ate
thei
r b
elie
fs a
nd p
erce
ptio
ns in
way
s th
ey c
an’t
thro
ugh
verb
al m
eans
.
Lack
sta
tistic
al r
igo
r an
d c
an b
e d
ifficu
lt to
an
alyz
e fo
r th
e re
sear
cher
. D
raw
ing
s ca
n o
nly
be
adm
inis
tere
d w
hen
the
eval
uato
r is
pre
sent
.
Web
ana
lytic
sW
eb a
naly
tics
loo
ks a
t the
use
of a
w
ebsi
te o
r p
arts
of a
web
site
to fi
nd
whi
ch s
ectio
ns a
re v
isite
d m
ost
oft
en.
Use
ful f
or
und
erst
and
ing
and
op
timiz
ing
web
us
age
and
und
erst
and
ing
tren
ds
in th
ose
that
vis
it yo
ur w
ebsi
te.
Do
esn’
t pro
vid
e in
form
atio
n o
n w
hy v
isito
rs m
ake
cert
ain
cho
ices
onl
ine.
Lim
ited
util
ity fo
r m
ost
su
mm
ativ
e ev
alua
tions
.
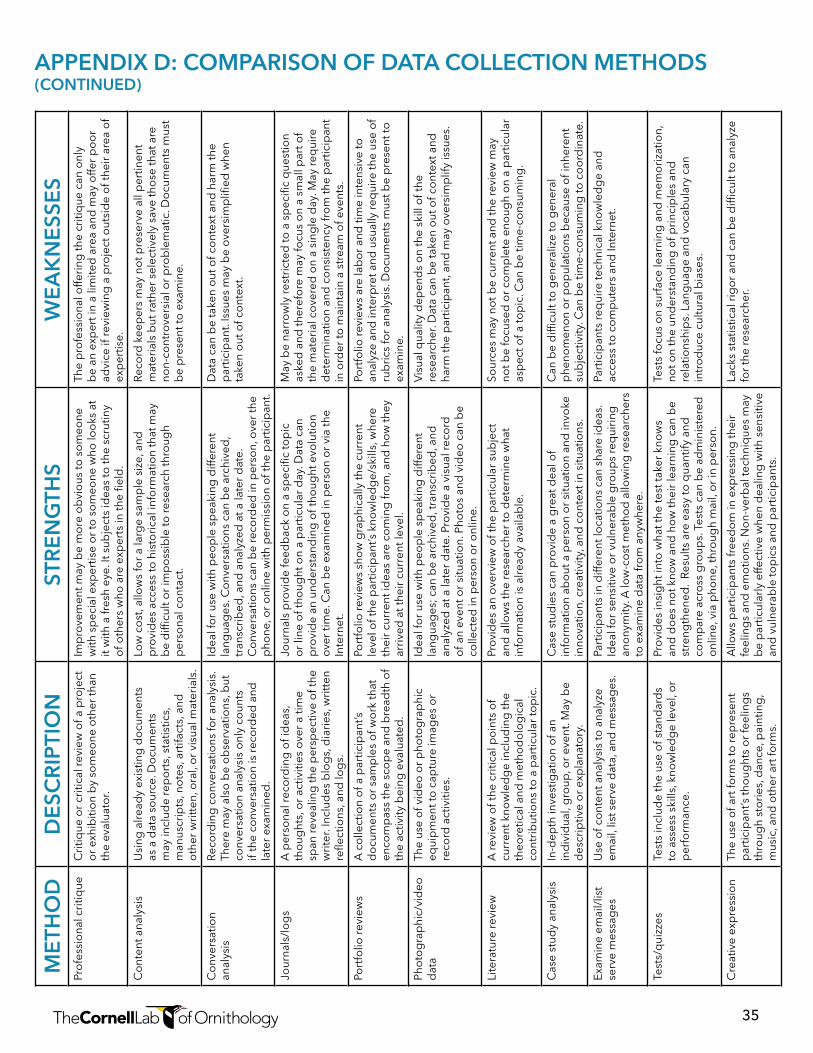
35
APPENDIX D: COMPARISON OF DATA COLLECTION METHODS (CONTINUED)
ME
THO
DD
ESC
RIP
TIO
NST
RE
NG
THS
WE
AK
NE
SSE
SPr
ofe
ssio
nal c
ritiq
ueC
ritiq
ue o
r cr
itica
l rev
iew
of a
pro
ject
o
r ex
hib
itio
n b
y so
meo
ne o
ther
than
th
e ev
alua
tor.
Imp
rove
men
t may
be
mo
re o
bvi
ous
to s
om
eone
w
ith s
pec
ial e
xper
tise
or
to s
om
eone
who
loo
ks a
t it
with
a fr
esh
eye.
It s
ubje
cts
idea
s to
the
scru
tiny
of o
ther
s w
ho a
re e
xper
ts in
the
field
.
The
pro
fess
iona
l offe
ring
the
criti
que
can
onl
y b
e an
exp
ert i
n a
limite
d a
rea
and
may
offe
r p
oo
r ad
vice
if re
view
ing
a p
roje
ct o
utsi
de
of t
heir
are
a o
f ex
per
tise.
Co
nten
t ana
lysi
sU
sing
alre
ady
exis
ting
do
cum
ents
as
a d
ata
sour
ce. D
ocu
men
ts
may
incl
ude
rep
ort
s, s
tatis
tics,
m
anus
crip
ts, n
ote
s, a
rtifa
cts,
and
o
ther
wri
tten
, ora
l, o
r vi
sual
mat
eria
ls.
Low
co
st, a
llow
s fo
r a
larg
e sa
mp
le s
ize,
and
p
rovi
des
acc
ess
to h
isto
rica
l inf
orm
atio
n th
at m
ay
be
diffi
cult
or
imp
oss
ible
to re
sear
ch th
roug
h p
erso
nal c
ont
act.
Reco
rd k
eep
ers
may
no
t pre
serv
e al
l per
tinen
t m
ater
ials
but
rat
her
sele
ctiv
ely
save
tho
se th
at a
re
non-
cont
rove
rsia
l or
pro
ble
mat
ic. D
ocu
men
ts m
ust
be
pre
sent
to e
xam
ine.
Co
nver
satio
n an
alys
isRe
cord
ing
co
nver
satio
ns fo
r an
alys
is.
Ther
e m
ay a
lso
be
ob
serv
atio
ns, b
ut
conv
ersa
tion
anal
ysis
onl
y co
unts
if
the
conv
ersa
tion
is re
cord
ed a
nd
late
r ex
amin
ed.
Idea
l fo
r us
e w
ith p
eop
le s
pea
king
diff
eren
t la
ngua
ges
. Co
nver
satio
ns c
an b
e ar
chiv
ed,
tran
scri
bed
, and
ana
lyze
d a
t a la
ter
dat
e.
Co
nver
satio
ns c
an b
e re
cord
ed in
per
son,
ove
r th
e p
hone
, or
onl
ine
with
per
mis
sio
n o
f the
par
ticip
ant.
Dat
a ca
n b
e ta
ken
out
of c
ont
ext a
nd h
arm
the
par
ticip
ant.
Issu
es m
ay b
e o
vers
imp
lified
whe
n ta
ken
out
of c
ont
ext.
jour
nals
/lo
gs
A p
erso
nal r
eco
rdin
g o
f id
eas,
th
oug
hts,
or
activ
ities
ove
r a
time
span
reve
alin
g th
e p
ersp
ectiv
e o
f the
w
rite
r. In
clud
es b
log
s, d
iari
es, w
ritt
en
refle
ctio
ns, a
nd lo
gs.
jour
nals
pro
vid
e fe
edb
ack
on
a sp
ecifi
c to
pic
o
r lin
e o
f tho
ught
on
a p
artic
ular
day
. Dat
a ca
n p
rovi
de
an u
nder
stan
din
g o
f tho
ught
evo
lutio
n o
ver
time.
Can
be
exam
ined
in p
erso
n o
r vi
a th
e In
tern
et.
May
be
narr
ow
ly re
stri
cted
to a
sp
ecifi
c q
uest
ion
aske
d a
nd th
eref
ore
may
focu
s o
n a
smal
l par
t of
the
mat
eria
l co
vere
d o
n a
sing
le d
ay. M
ay re
qui
re
det
erm
inat
ion
and
co
nsis
tenc
y fr
om
the
par
ticip
ant
in o
rder
to m
aint
ain
a st
ream
of e
vent
s.
Port
folio
revi
ews
A c
olle
ctio
n o
f a p
artic
ipan
t’s
do
cum
ents
or
sam
ple
s o
f wo
rk th
at
enco
mp
ass
the
sco
pe
and
bre
adth
of
the
activ
ity b
eing
eva
luat
ed.
Port
folio
revi
ews
sho
w g
rap
hica
lly th
e cu
rren
t le
vel o
f the
par
ticip
ant’s
kno
wle
dg
e/sk
ills,
whe
re
thei
r cu
rren
t id
eas
are
com
ing
fro
m, a
nd h
ow
they
ar
rive
d a
t the
ir c
urre
nt le
vel.
Port
folio
revi
ews
are
lab
or
and
tim
e in
tens
ive
to
anal
yze
and
inte
rpre
t and
usu
ally
req
uire
the
use
of
rub
rics
for
anal
ysis
. Do
cum
ents
mus
t be
pre
sent
to
exam
ine.
Pho
tog
rap
hic/
vid
eo
dat
aTh
e us
e o
f vid
eo o
r p
hoto
gra
phi
c eq
uip
men
t to
cap
ture
imag
es o
r re
cord
act
iviti
es.
Idea
l fo
r us
e w
ith p
eop
le s
pea
king
diff
eren
t la
ngua
ges
; can
be
arch
ived
, tra
nscr
ibed
, and
an
alyz
ed a
t a la
ter
dat
e. P
rovi
de
a vi
sual
reco
rd
of a
n ev
ent o
r si
tuat
ion.
Pho
tos
and
vid
eo c
an b
e co
llect
ed in
per
son
or
onl
ine.
Vis
ual q
ualit
y d
epen
ds
on
the
skill
of t
he
rese
arch
er. D
ata
can
be
take
n o
ut o
f co
ntex
t and
ha
rm th
e p
artic
ipan
t, an
d m
ay o
vers
imp
lify
issu
es.
Lite
ratu
re re
view
A re
view
of t
he c
ritic
al p
oin
ts o
f cu
rren
t kno
wle
dg
e in
clud
ing
the
theo
retic
al a
nd m
etho
do
log
ical
co
ntri
but
ions
to a
par
ticul
ar to
pic
.
Pro
vid
es a
n o
verv
iew
of t
he p
artic
ular
sub
ject
an
d a
llow
s th
e re
sear
cher
to d
eter
min
e w
hat
info
rmat
ion
is a
lread
y av
aila
ble
.
Sour
ces
may
no
t be
curr
ent a
nd th
e re
view
may
no
t be
focu
sed
or
com
ple
te e
noug
h o
n a
par
ticul
ar
asp
ect o
f a to
pic
. Can
be
time-
cons
umin
g.
Cas
e st
udy
anal
ysis
In-d
epth
inve
stig
atio
n o
f an
ind
ivid
ual,
gro
up, o
r ev
ent.
May
be
des
crip
tive
or
exp
lana
tory
.
Cas
e st
udie
s ca
n p
rovi
de
a g
reat
dea
l of
info
rmat
ion
abo
ut a
per
son
or
situ
atio
n an
d in
voke
in
nova
tion,
cre
ativ
ity, a
nd c
ont
ext i
n si
tuat
ions
.
Can
be
diffi
cult
to g
ener
aliz
e to
gen
eral
p
heno
men
on
or
po
pul
atio
ns b
ecau
se o
f inh
eren
t su
bje
ctiv
ity. C
an b
e tim
e-co
nsum
ing
to c
oo
rdin
ate.
Exam
ine
emai
l/lis
t se
rve
mes
sag
esU
se o
f co
nten
t ana
lysi
s to
ana
lyze
em
ail,
list s
erve
dat
a, a
nd m
essa
ges
.Pa
rtic
ipan
ts in
diff
eren
t lo
catio
ns c
an s
hare
idea
s.
Idea
l fo
r se
nsiti
ve o
r vu
lner
able
gro
ups
req
uiri
ng
ano
nym
ity. A
low
-co
st m
etho
d a
llow
ing
rese
arch
ers
to e
xam
ine
dat
a fr
om
any
whe
re.
Part
icip
ants
req
uire
tech
nica
l kno
wle
dg
e an
d
acce
ss to
co
mp
uter
s an
d In
tern
et.
Test
s/q
uizz
esTe
sts
incl
ude
the
use
of s
tand
ard
s to
ass
ess
skill
s, k
now
led
ge
leve
l, o
r p
erfo
rman
ce.
Pro
vid
es in
sig
ht in
to w
hat t
he te
st ta
ker
kno
ws
and
do
es n
ot k
now
and
ho
w th
eir
lear
ning
can
be
stre
ngth
ened
. Re
sults
are
eas
y to
qua
ntify
and
co
mp
are
acro
ss g
roup
s. T
ests
can
be
adm
inis
tere
d
onl
ine,
via
pho
ne, t
hro
ugh
mai
l, o
r in
per
son.
Test
s fo
cus
on
surf
ace
lear
ning
and
mem
ori
zatio
n,
not o
n th
e un
der
stan
din
g o
f pri
ncip
les
and
re
latio
nshi
ps.
Lan
gua
ge
and
vo
cab
ular
y ca
n in
tro
duc
e cu
ltura
l bia
ses.
Cre
ativ
e ex
pre
ssio
nTh
e us
e o
f art
form
s to
rep
rese
nt
par
ticip
ant’s
tho
ught
s o
r fe
elin
gs
thro
ugh
sto
ries
, dan
ce, p
aint
ing
, m
usic
, and
oth
er a
rt fo
rms.
Allo
ws
par
ticip
ants
free
do
m in
exp
ress
ing
thei
r fe
elin
gs
and
em
otio
ns. N
on-
verb
al te
chni
que
s m
ay
be
par
ticul
arly
effe
ctiv
e w
hen
dea
ling
with
sen
sitiv
e an
d v
ulne
rab
le to
pic
s an
d p
artic
ipan
ts.
Lack
s st
atis
tical
rig
or
and
can
be
diffi
cult
to a
naly
ze
for
the
rese
arch
er.
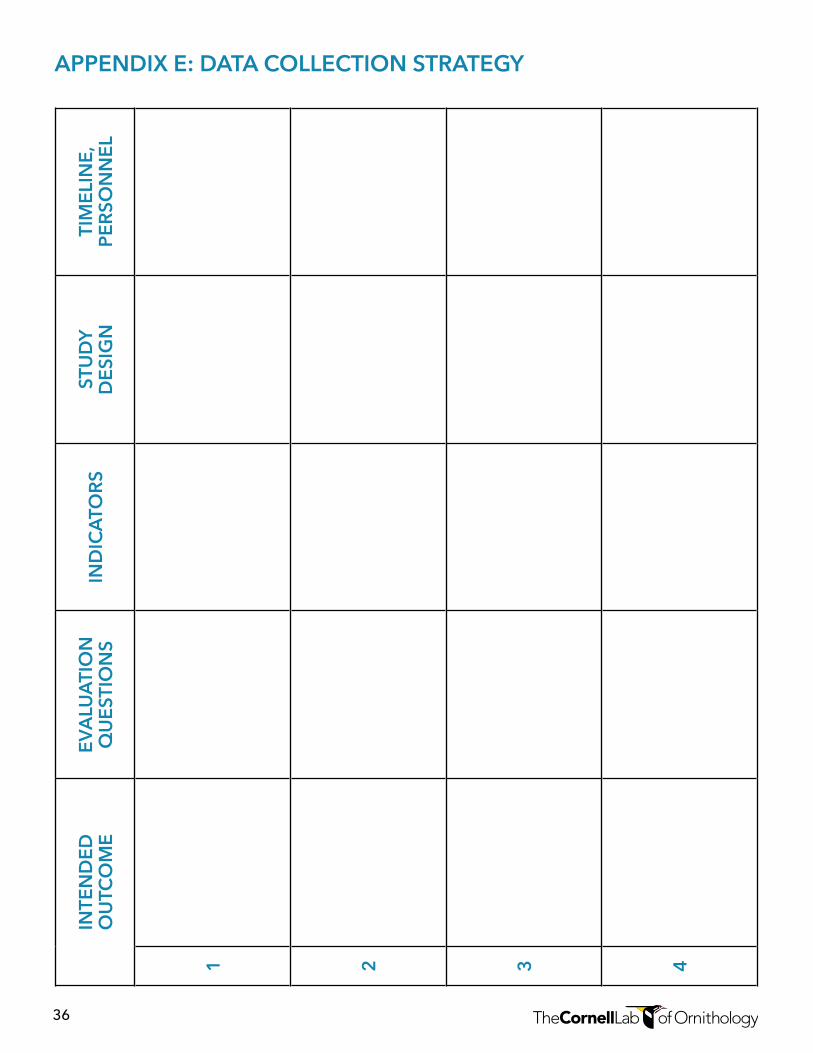
36
APPENDIX E: DATA COLLECTION STRATEGYIN
TEN
DE
D
OU
TCO
ME
EV
ALU
ATI
ON
Q
UE
STIO
NS
IND
ICA
TOR
SST
UD
Y D
ESI
GN
TIM
ELI
NE
, P
ER
SON
NE
L
1 2 3 4
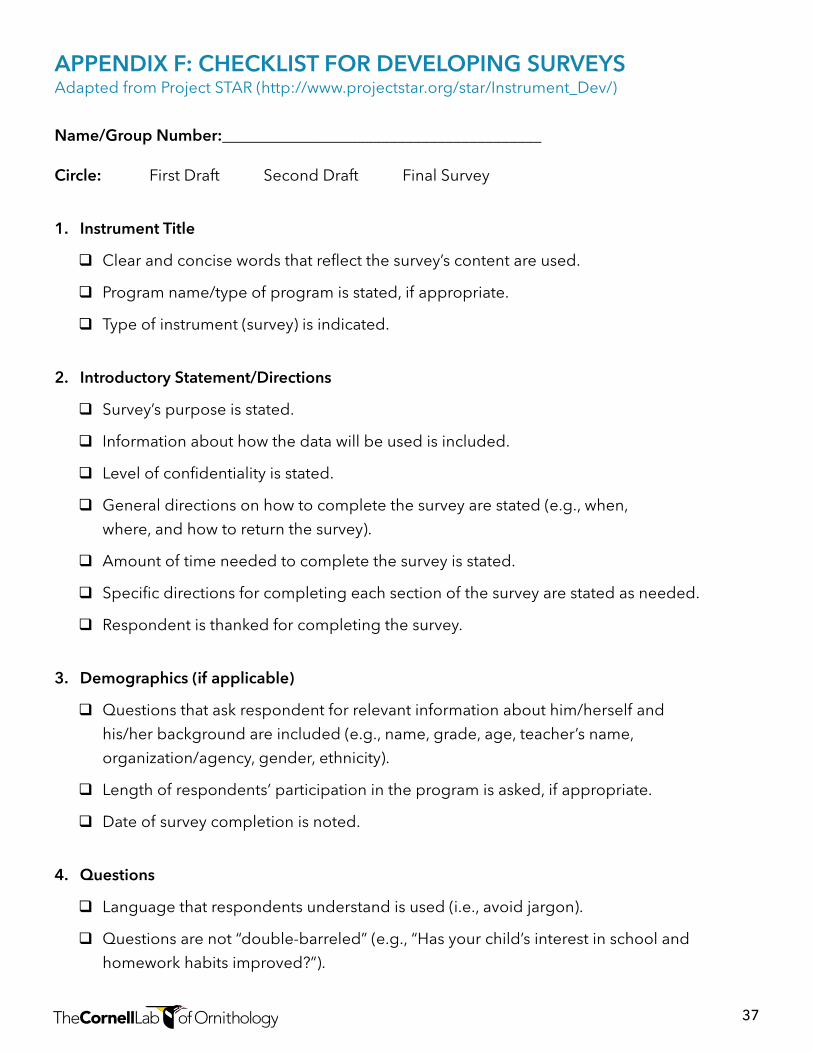
37
Adapted from Project STAR (http://www.projectstar.org/star/Instrument_Dev/)
Name/Group Number:________________________________________
Circle: First Draft Second Draft Final Survey
1. Instrument Title
q Clear and concise words that reflect the survey’s content are used.
q Program name/type of program is stated, if appropriate.
q Type of instrument (survey) is indicated.
2. Introductory Statement/Directions
q Survey’s purpose is stated.
q Information about how the data will be used is included.
q Level of confidentiality is stated.
q General directions on how to complete the survey are stated (e.g., when,
where, and how to return the survey).
q Amount of time needed to complete the survey is stated.
q Specific directions for completing each section of the survey are stated as needed.
q Respondent is thanked for completing the survey.
3. Demographics (if applicable)
qQuestions that ask respondent for relevant information about him/herself and
his/her background are included (e.g., name, grade, age, teacher’s name,
organization/agency, gender, ethnicity).
qLength of respondents’ participation in the program is asked, if appropriate.
qDate of survey completion is noted.
4. Questions
qLanguage that respondents understand is used (i.e., avoid jargon).
qQuestions are not “double-barreled” (e.g., “Has your child’s interest in school and
homework habits improved?”).
APPENDIX F: CHECKLIST FOR DEVELOPING SURVEYS
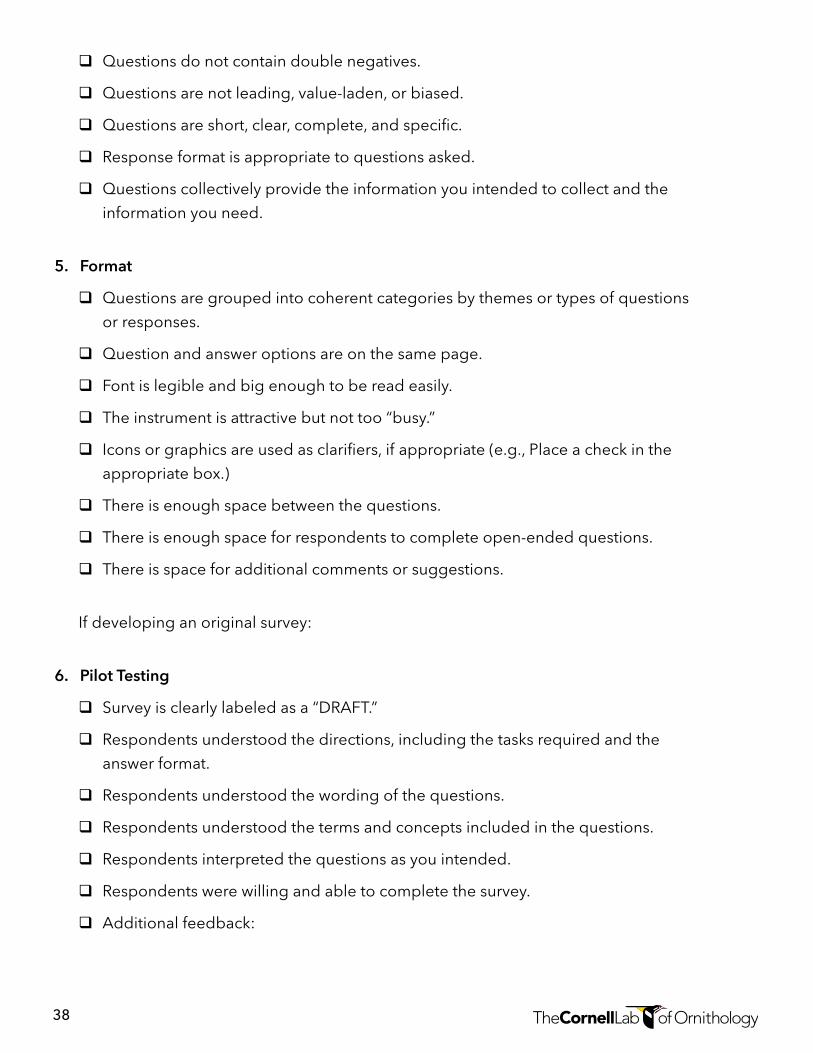
38
qQuestions do not contain double negatives.
qQuestions are not leading, value-laden, or biased.
qQuestions are short, clear, complete, and specific.
qResponse format is appropriate to questions asked.
qQuestions collectively provide the information you intended to collect and the
information you need.
5. Format
qQuestions are grouped into coherent categories by themes or types of questions
or responses.
qQuestion and answer options are on the same page.
qFont is legible and big enough to be read easily.
qThe instrument is attractive but not too “busy.”
qIcons or graphics are used as clarifiers, if appropriate (e.g., Place a check in the
appropriate box.)
qThere is enough space between the questions.
qThere is enough space for respondents to complete open-ended questions.
qThere is space for additional comments or suggestions.
If developing an original survey:
6. Pilot Testing
qSurvey is clearly labeled as a “DRAFT.”
qRespondents understood the directions, including the tasks required and the
answer format.
qRespondents understood the wording of the questions.
qRespondents understood the terms and concepts included in the questions.
qRespondents interpreted the questions as you intended.
qRespondents were willing and able to complete the survey.
qAdditional feedback:
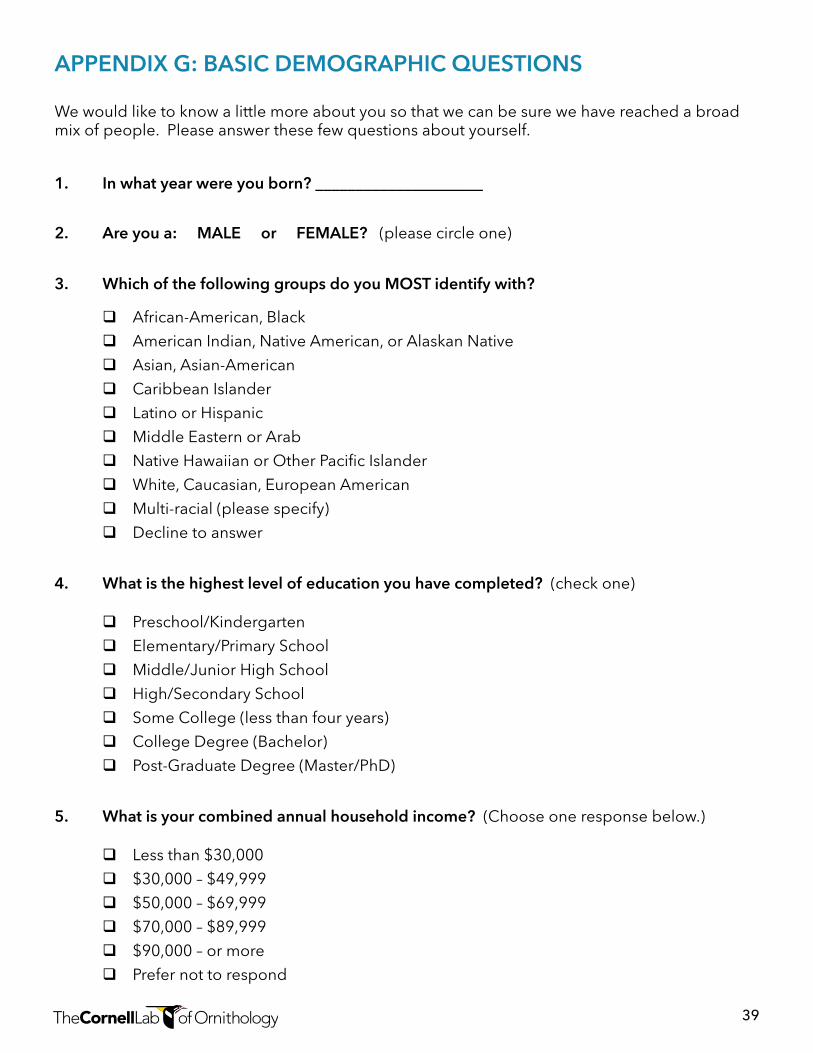
39
APPENDIX G: BASIC DEMOGRAPHIC QUESTIONS
We would like to know a little more about you so that we can be sure we have reached a broad mix of people. Please answer these few questions about yourself.
1. In what year were you born? _____________________
2. Are you a: MALE or FEMALE? (please circle one)
3. Which of the following groups do you MOST identify with?
qAfrican-American, Black
qAmerican Indian, Native American, or Alaskan Native
qAsian, Asian-American
qCaribbean Islander
qLatino or Hispanic
qMiddle Eastern or Arab
qNative Hawaiian or Other Pacific Islander
qWhite, Caucasian, European American
qMulti-racial (please specify)
qDecline to answer
4. What is the highest level of education you have completed? (check one)
qPreschool/Kindergarten
qElementary/Primary School
qMiddle/junior High School
qHigh/Secondary School
qSome College (less than four years)
qCollege Degree (Bachelor)
qPost-Graduate Degree (Master/PhD)
5. What is your combined annual household income? (Choose one response below.)
qLess than $30,000
q$30,000 – $49,999
q$50,000 – $69,999
q$70,000 – $89,999
q$90,000 – or more
qPrefer not to respond
40
APPENDIX H: EVALUATION PLAN WORKSHEET
PHASE 1: PLANNING—INVENTORY
A. Describe the project to be evaluated and its audience.
B. Articulate the goals and intended outcomes of the project.
C. Describe the program logic model in terms of inputs-activities-outputs-outcomes-impacts. (See Appendix B for Logic Model Template)
Inputs:
Activities:
Outputs:
41
D. Determine if approval by your organization’s Internal Review Board (IRB) is necessary for conducting an evaluation.
qYes
q No
PHASE 1: PLANNING—DEFINE
A. State the purpose of the evaluation and what you hope to learn as a result of it.
B. Who are the stakeholders? What do they want to learn from the evaluation and how will the findings be used?
Short-term Outcomes:
Medium-term Outcomes:
Long-term Outcomes/Impacts:
42
C. Develop and prioritize key questions that you hope will be answered as a result of the evaluation.
D. Determine the indicators for the outcomes you intend to measure.
QUESTIONSREQUIRED
RESOURCESTIME REQUIRED
VALUE OF THE INFORMATION
PRIORITY
Outcome 1:
Outcome 2:
Outcome 3:
43
E. Construct a timeline for the evaluation. (Include major milestones.)
MILESTONE STAFF INVOLVED DUE DATE
Hold initial meetings with stakeholders
Identify key people
Obtain IRB approval
Draft scope of work and budget outline
Refine Goals, Outcomes, Indicators
Develop Logic Model, Theory of Change
Develop and prioritize evaluation questions
Determine indicators
Develop study design and data collection strategy
Deliver draft evaluation plan to stakeholders, refine if needed
Obtain existing or develop draft instruments
Share instruments with stakeholders, refine if needed
Pilot draft instruments (if applicable)
Refine instruments (if applicable)
Begin pre/post data collection
Gather & clean (pre/post) data
Analyze (pre/post) data
Review other pertinent data sources
Discuss preliminary findings with stakeholders
Draft and disseminate final report
Secure data according to data management plan
Implement evaluation findings
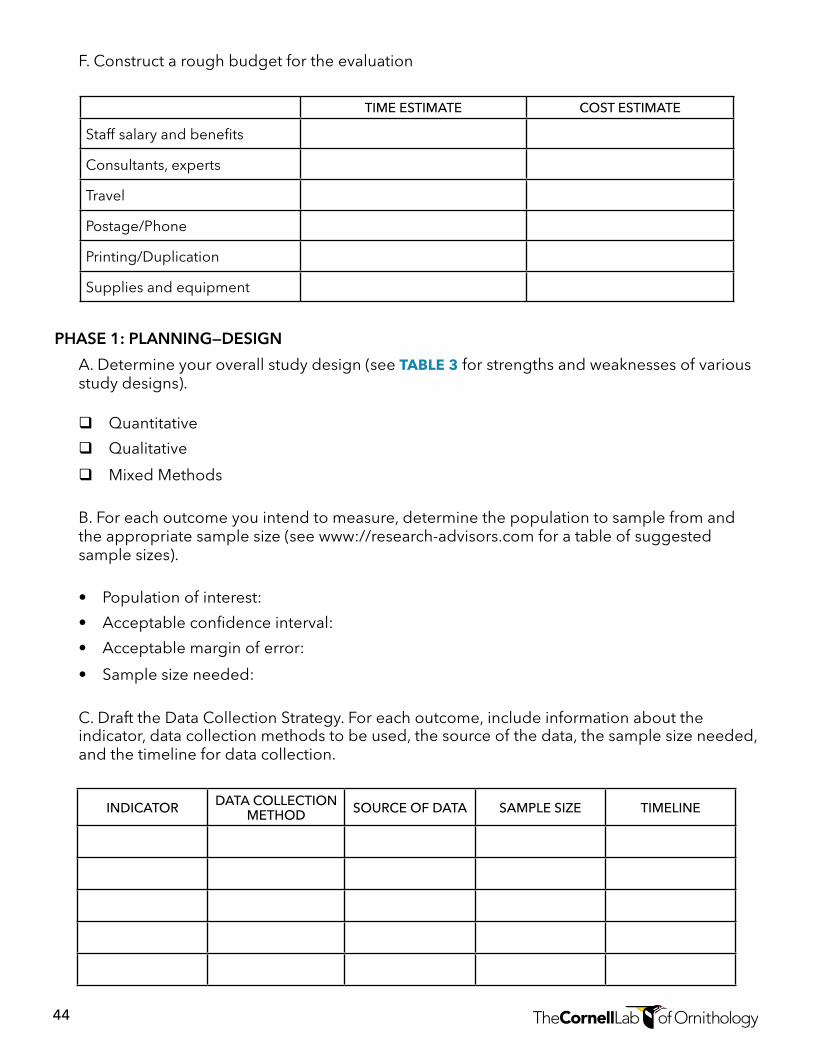
44
TIME ESTIMATE COST ESTIMATE
Staff salary and benefits
Consultants, experts
Travel
Postage/Phone
Printing/Duplication
Supplies and equipment
INDICATOR DATA COLLECTION METHOD SOURCE OF DATA SAMPLE SIZE TIMELINE
F. Construct a rough budget for the evaluation
PHASE 1: PLANNING—DESIGN
A. Determine your overall study design (see TABle 3 for strengths and weaknesses of various study designs).
qQuantitative
qQualitative
qMixed Methods
B. For each outcome you intend to measure, determine the population to sample from and the appropriate sample size (see www://research-advisors.com for a table of suggested sample sizes).
• Populationofinterest:
• Acceptableconfidenceinterval:
• Acceptablemarginoferror:
• Samplesizeneeded:
C. Draft the Data Collection Strategy. For each outcome, include information about the indicator, data collection methods to be used, the source of the data, the sample size needed, and the timeline for data collection.
45
PHASE 2: IMPLEMENT—DEVELOP
A. Articulate the construct of interest and develop draft instruments, if necessary, or document sources for other original work.
B. Describe the attributes of the instruments and the rationale for selection.
C. Review Appendix F (Checklist for Developing Surveys, if necessary)
Define constructs of interest:
Cite possible existing sources of instruments:
46
PHASE 2: IMPLEMENT—TEST
A. Pilot and/or field test draft instruments and refine as needed based on test results:
B. Document any changes to the instrument based on pilot and field tests:
INSTRUMENT NAME
PILOT OR FIELD TEST? AUDIENCE SAMPLE SIZE DATE
ADMINISTERED RESULTS
47
PHASE 2: IMPLEMENT—ADMINISTER
A. Describe participant recruitment efforts.
B. Document your data collection efforts:
PHASE 3: SHARE—ANALYZE AND INTERPRET
Make a copy of the original raw data and a working file of the data.
DATA COLLECTION METHOD AUDIENCE SAMPLE SIZE DATE
ADMINISTERED RESULTS
Master file name:
Master file location:
Working file name:
Working file location:
48
QUANTITATIVE DATA (NUMERICALLY-BASED DATA)
qA. Create a codebook for organizing all your data
qB. Determine software to use and types of statistical procedures to employ
qC. Summarize the data using descriptive statistics
QUALITATIVE DATA (TEXT AND IMAGE-BASED DATA)
qD. Determine the procedure for data analysis
qE. Determine what type of software to use
qF. Employ data reduction techniques
MIXED METHODS DATA
qG. Compare and contrast qualitative and quantitative data
qH. Synthesize mixed methods data
qI. Analyze separately
PHASE 3: SHARE—REPORT
qA. Executive Summary
qB. Program Description
qC. Evaluation Methodology
qD. Findings and Results
qE. Discussion/Interpretation
qF. Recommendations
qG. References
qH. Appendices
PHASE 3: SHARE—DISSEMINATE
qA. Share with stakeholders
qB. Consider publishing
qC. Inform your program
49
APPENDIX I: GLOSSARY OF TERMS
Activities—Tasks described in a logic model that use in-puts (resources) and directly relate to outputs and out-comes.
Bias—Systematic errors that can negatively influence research results such as measurement or sampling-related errors.
Coding—A procedure to transform raw data into a form that can facilitate data analysis; used often to categorize text-based, qualitative data into common themes, con-cepts, or phrases.
Construct—A psychological attribute or latent variable that cannot be measured directly, such as happiness or interest, but only through a set of measurable indicator variables.
Convenience sample—A sample acquired based on who is available or where they are located.
Data management plan—A document that outlines the processes for collecting, storing, and analyzing data.
Descriptive statistics—Methods used to describe basic features of a particular set of data including the mean, median, mode, range, and standard deviation.
Evaluation—The systematic collection of information to de-termine strengths and weaknesses of programs, projects, and products so as to improve their overall effectiveness.
Executive summary—A very brief overview and descrip-tion of a longer report, such as a final report. The execu-tive summary typically describes the program structure, purpose, and results.
Formative evaluation—A type of evaluation that occurs during project development and provides direction for improving implementation and operation. Findings may result in changes to project structure and/or implementa-tion (also called process or implementation evaluation).
Front-end evaluation—A type of evaluation that occurs during the defining phase of a project to obtain baseline information about an audience. Findings help to inform project goals and objectives that can be aligned with au-dience needs/interests (also called needs or feasibility as-sessment).
Generalizability—The extent to which research results from a sample can be applied to the larger population, sometimes referred to as “ecological validity.”
Goals—Broad and abstract statements describing a de-sired result, e.g., “appreciation for science” or “increase interest in technology.”
Impacts—Long-term outcomes that are broad in scope, aimed at expanding knowledge and capacity for a particu-lar field of study, and meant to provide benefits to society.
Indicators—Specific criteria for measuring success. Indica-tors should articulate how you will define and measure success in reaching your outcomes.
Individual learning outcomes (ILOs)—Measurable chang-es to project participants, including “cognitive outcomes” (the things people know), “affective outcomes” (how peo-ple feel), and “behavioral outcomes” (what people do).
Inferential statistics—Methods of analysis that allow re-searchers to make inferences and test hypotheses about relationships in a sample that are likely to occur in a popula-tion.
Informed consent—A procedure for obtaining permission for voluntary participation in a research study, usually by way of a signed form that clearly describes the study and its risks and benefits.
Inputs—Resources dedicated to or consumed by a proj-ect; typically things like funding agencies, scientists, staff, volunteers, and technology infrastructure.
Institutional Review Board (IRB)—A committee charged with protecting the rights and welfare of people involved in research. Associated with biomedical service, but be-havioral and survey research also fall under the category of research involving human subjects.
Instrument—In evaluation research, a tool used to collect and organize information either through self reports or observation. Examples include survey questionnaires, behavioral rating scales, tests, checklists and inventories, psychometric instruments, and rating scales.
50
Likert-type scale—Used to ascribe quantitative value to qualitative data, this is a type of psychometric response scale commonly used in surveys to obtain a participant’s preferences or degree of agreement with a statement or set of statements.
Logic model—A graphical representation of a project that shows the relationships between each project compo-nent and the expected outcomes; helps to articulate pro-grammatic objectives and strategies; and focuses atten-tion on key interventions and intended outcomes. Usually presented as inputs, activities, outputs, outcomes, and impacts.
Outcomes—The changes that a project is intended to pro-duce in individuals, groups, or communities as a result of participation. Targeted and more specific than goals, out-comes refer to concrete and measurable statements and are used to determine if goals were met.
Outputs—Direct products, or by-products, of the stated activities that demonstrate immediate results of activities. Easy to quantify and focus on things done by participants.
Population—The entire target group under consideration that has specified criteria or properties. Entire popula-tions are often impossible to study, so most researchers draw a sample from the population at large.
PPSR—(Public Participation in Scientific Research) Scientific investigation that engages the general public in asking questions, developing research projects, collect-ing/analyzing data, and presenting findings.
Purposeful sample—A type of sampling method that does not rely on randomness or representativeness, aimed at obtaining information from a specific group.
Qualitative data—Non-numerical data collected in the form of text and images.
Quantitative data—Information that is collected in numer-ical form and can be analyzed using statistical methods.
Questionnaire—A type of data collection instrument pre-sented as part of a useful set of questions in a survey.
Reliability—Describes the overall consistency of a mea-sure or instrument; reliability is high if similar results are produced across time and across similar groups.
Sample—The subset of a larger group or population that is considered representative of the population.
Sampling—The process of selecting a subgroup that rep-resents the population from which it is drawn. Sampling varieties where there is an equal probability for selection include: simple random sampling, systematic sampling, and cluster sampling. Non-probability sampling tech-niques include: convenience sampling, quota sampling, and snowball sampling.
Scale—In survey research, a set of questions that attempt to measure different levels of a single construct (or in the case of subscales, multiple related constructs) within a population.
Stakeholders—Persons or organizations with an interest in the project; e.g. funding sources and employers.
Stratified sample—A sample that illustrates particular char-acteristics of a subgroup; can be random or purposeful.
Summative evaluations—A type of evaluation that occurs once a project has been established. Used to describe project value, outcomes, and to determine effectiveness. Findings help to determine if the project’s stated goals and target outcomes have been accomplished (also known as outcome or impact evaluation).
Survey—A methodological process that involves sample design, data collection, and data analysis and interpre-tation that is aimed at gathering systematic information about a defined population, typically through interviews or questionnaires.
Theory of Change—A technique for outlining how project activities will lead to desired outcomes by formulating “if…then” statements. Theory of Change should describe the target population, desired results, activities, context, and assumptions.
Validity—The extent to which a concept, conclusion, or measurement is well-founded and corresponds accurate-ly to the real world; i.e., an instrument correctly measures what it is supposed to. There are many types of validity including face, content, criterion-related, construct, inter-nal, and external validity.
51
APPENDIX j: REFERENCES
American Evaluation Association. (2011). American Evaluation Association Public Statement on Cultural Competence in Evaluation. Fairhaven, MA: Author. Retrieved from www.eval.org.
Bhattacharjee, Y. (2005). Citizen scientists supplement work of Cornell researchers. Science, 308(1402-1403).
Bonney, R., Ballard, H., Jordan, R., McCallie, E., Phillips, T., Shirk, J., Wilderman, C. (2009). Public Participation in Scientific Research: Defining the Field and Assessing Its Potential for Informal Science Education. Washington, D.C.: Center for Advancement of Informal Science Education (CAISE).
Campbell, D., & Stanley, J. (1963). Experimental and quasi-experimental designs for research. In D. Campbell & J. Stanley (Eds.), Handbook of Research on Teaching. Boston: Houghton Mifflin Co.
Christie, C. A., & Fleischer, D. N. (2010). Insight into evaluation practice: A content analysis of designs and methods used in evaluation studies published in North American evaluation-focused journals. American Journal of Evaluation, 31(3), 326-346.
Creswell, J. W. (2003). Research Design: Qualitative, Quantitative and Mixed Methods Approaches (2nd ed., p. 246). Thousand Oaks, CA.: Sage Publications.
Diamond, J. (2009). Practical evaluation guide: tool for museums and other informal educational settings (2nd ed.). Lanham Md.: AltaMira Press. Retrieved from http://cornell.worldcat.org/title/practical-evaluation-guide-tool-for-museums-and-other-informal-educational-settings/oclc/318534281&referer=brief_results
Dickinson, J. L., & Bonney, R. E. (2012). Introduction: Why Citizen Science? In J. L. Dickinson & R. E. Bonney (Eds.), Citizen Science: Public Collaboration in Scientific Research. Ithaca: NY: Cornell University Press.
Doran, G. T., Miller, A. F., & Cunningham, J. A. (1981). How to avoid costly job mismatches. Management Review, 70(11).
Fitz-Gibbons, C. T., & Morris, L. L. (1987). Program Evaluation Kit, No.3 - How to Design a Program Evaluation. Newbury Park, CA: Sage Publications.
Friedman, A. (2008). Framework for Evaluating Impacts of Informal Science Education Projects; Retrieved from http://caise. insci.org/uploads/Eval_Framework.pdf.
Greenwood, J. J. (2007). Citizens, science and bird conservation. Journal of Ornithology, 148(77-124).
Kellogg, W. (1998). Foundation Evaluation Handbook. W. K. Kellogg Foundation, Battle Creek, Michigan. Retrieved from http://scholar.google.com/scholar?q=w.K.+kellogg+foundation+1998&btnG=&hl=en&as_sdt=0,33#1
Marcussen, M. (2012). Choosing an Evaluator in Principle Investigator’s Guide to Managing Evaluation in Informal Science Education Projects (R. Bonney, L. Goodyear, K. Ellenbogen, Eds.). Visitor Studies Association.
National Research Council. (2009). Learning Science in Informal Environments: People, Places, and Pursuits. Washington, D. C.: National Academies Press.
National Science Foundation (NSF). (2010). The User-Friendly Handbook for Project Evaluation. Retrieved from http://www.westat.com/Westat/pdf/news/UFHB.pdf
Rossi H. P., Lipsey M. W., Freeman H. E. 2004. Evaluation: A Systematic Approach, Seventh Edition. California: SAGE Publications.
Salant, P. and Dillman, D. A. (1994). How to Conduct Your Own Survey. New York, NY: John Wiley and Sons, Inc.
W. K. Kellogg Foundation. (2004). Logic model development guide. Battle Creek, MI: W. K. Kellogg Foundation.
Wilderman, C. C., Barron, A., & Imgrund, L. (2005). Top Down or Bottom Up? ALLARM’s Experience with Two Operational Models for Community Science. Paper presented at the 4th National Water Quality Monitoring Council Conference.
52
APPENDIX K: ADDITIONAL RESOURCES FOR USE IN PLANNING AND CONDUCTING PROjECT EVALUATION
CHECKLISTS, GLOSSARIES, TIPS, AND WORKSHEETSEvaluation Design Checklists (Western Michigan University)
Study Design and Data Collection Worksheet (CAISE, see page 3)
Research and Evaluation Glossary (Colorado State University)
Quick Tips for Evaluation (University of Wisconsin Cooperative Extension)
CULTURALLY RESPONSIVE EVALUATIONNavigating the Complexities of Research on Human Subjects in Informal Settings (informalscience.org)
Tips for Culturally Sensitive Evaluation (University of Wisconsin Cooperative Extension)
DATA ANALYSIS AND INTERPRETATIONAnalyzing Qualitative Data (University of Wisconsin Cooperative Extension)
Using Excel for Analyzing Survey Data (University of Wisconsin Cooperative Extension)
Analyzing Retrospective Pre Data (University of Wisconsin Cooperative Extension)
Understanding Statistics Tutorial (Education Commission of the States)
DATA COLLECTION AND METHODSData Collection Overview (NOAA “Designing Education Projects,” 2nd ed. 2009, see page 57)
Methods for Collecting Information Tip Sheet (University of Wisconsin Cooperative Extension)
Guide to Sampling (University of Wisconsin Cooperative Extension)
ETHICSAmerican Evaluation Association Guiding Principles for Evaluators (AEA)
Ethics in Research (Research Methods Knowledge Base)
Does Evaluation Require IRB? (Oregon State University)
EVALUATION REPORTINGWriting an Evaluation Report (University of Illinois at Chicago)
Quality Criteria for Reports (Online Evaluation Resource Library)
Evaluation Report Template (South Australian Community Health Research Unit)
GENERAL EVALUATION GUIDANCEThe PI Guide to Managing Evaluation (CAISE)
The 2010 User-Friendly Handbook for Project Evaluation (NSF)
Planning a Program Evaluation (University of Wisconsin Cooperative Extension)
53
Visitor Studies Association “Find an Evaluator” Database (VSA)
LOGIC MODELSDevelopment of Logic Models (W. K. Kellogg Foundation)
Logic Model Worksheets (University of Wisconsin Cooperative Extension)
STUDY DESIGNStudy Designs for Program Evaluation (Project STAR)
Evaluation Designs Common in Measuring Outcomes (University of Wisconsin Cooperative Extension)
National Science Foundation Framework for Evaluating Impacts of ISE Projects (NSF)
Using Comparison Groups (University of Wisconsin Cooperative Extension)
SURVEY DESIGNQuestionnaire Design (University of Wisconsin Cooperative Extension)
Collecting Survey Data (University of Wisconsin Cooperative Extension)
Best Practices for Survey Research (Ithaca College)
Visit www.citizenscience.org/evaluation for tools to measure learning outcomes
from citizen-science projects.

www.birds.cornell.edu