Embed Size (px)
Citation preview
Jurnal Ilmiah Teknik Elektro Komputer dan Informatika (JITEKI)
Vol. 7, No. 1, April 2021, pp. 108-117
ISSN: 2338-3070, DOI: 10.26555/jiteki.v7i1.20213 108
Journal homepage : http://journal.uad.ac.id/index.php/JITEKI Email : [email protected]
Monitoring and Control Food Temperature and Humidity using
Internet of Things Based-on Microcontroller
Imam Riadi 1, Rizal Syaefudin 2 1Department of Information System, Universitas Ahmad Dahlan
2Department of Electrical Engineering, Universitas Ahmad Dahlan
ARTICLE INFO ABSTRACT
Article history:
Received March 04, 2021
Revised March 30, 2021 Accepted April 14, 2021
Tempe is a traditional Indonesian food that uses tempeh mushrooms
(Rhizopuz Oryzae) to make it. Tempeh fungus on soybeans requires a certain
temperature and humidity in order to grow properly. In this study, a tool was
built to monitor and control temperature and humidity with an online system
using the ESP8266 WiFi Module with the ESP8266-01 series, which then the
data will be sent to Thingspeak and Thingsview. The method used in this study
through several stages, including Hardware Design, Internet of Things (IoT)
Design or Network Architecture, Testing, and Measuring temperature and
humidity values. The hardware design includes Microcontroller-based system
hardware to help control temperature and humidity. IoT design or network
architecture steps to make connections between hardware and software, while
the last stage is testing and measuring the temperature and humidity values to
determine the accuracy of the system being made. The Temperature and
Humidity settings are carried out automatically using the Arduino Board to
control Heater and Fan. The average temperature and humidity values
generated in the measurement were 33.11 C and 87.74%. This tool has a
measurement accuracy compared to other measuring instruments with a
standard deviation of temperature error of 0.8708 and humidity 1.1254 for 180
data samples for 3 days. In this study, the system functions properly with the
control system functioning properly, and the reading of the value produces a
good standard deviation.
Keywords:
Internet of Things;
IoT; Temperature;
Monitoring;
Humidity
This work is licensed under a Creative Commons Attribution-Share Alike 4.0
Imam Riadi,
Department of Information System, Universitas Ahmad Dahlan, Ringroad Selatan, Tamanan, Bantul, Yogyakarta,
55191, Indonesia.
Email: [email protected]
1. INTRODUCTION
Tempe is one of the promising food commodities for entrepreneurship. Quality and food safety has
received a lot of attention, raising the level of awareness of consumer health [1]. Lots of people take advantage
of these opportunities. However, many manufacturers still use manual methods in the production process.
Tempe Procer cannot know about the level of humidity and temperature in the fermentation process. Knowing
temperature and humidity is very important in the process of making tempe. The fermentation process in tempe
where the fermentation process can take 36 - 47 hours. The growth of Rhizopus Oligosporus fungi in soybean
tempeh was very good at an incubation space of 30-37ºC [2]. From the above problems, in the processing of
tempe, a monitoring system is needed to determine the value of temperature and humidity. In adjusting the
temperature and humidity levels, it is also necessary to add a control section.
Technology will increasingly develop, especially the internet. Many users are using the internet as a need.
Along with the development of technology, we need to know that it has brought the industrial area towards the
industrial revolution 4.0. technological developments that are increasingly developing to facilitate temperature
and humidity measurements using the Arduino-based DHT22 sensor where the industry now uses internet
connections and exchanges or transfers data so as to create a smart industry. A microcontroller board is used
ISSN 2338-3070 Jurnal Ilmiah Teknik Elektro Komputer dan Informatika (JITEKI) 109 Vol. 7, No. 1, April 2021, pp. 108-117
Monitoring and Control Food Temperature and Humidity using Internet of Things Based-on Microcontroller (Imam
Riadi)
to connect all sensors and modules programmed with commands to integrate and run the device [3]. At this
time, the internet network is also growing, which has reached rural areas. Take advantage of internet
connectivity that is always connected at any time and can be easily accessed wherever you are or what is now
better known as the Internet of Things [4]. For the sake of support of the industrial revolution 4.0, the
information system needs to be upgraded to the online oriented system [5]. Online services are often used in
the education, government, and E-Commerce sectors [6]. It makes it easy for users to explore data, such as
displaying test data to web applications or android mobile applications [7]. Overall, this IoT-based system
helps decrease human interaction intervention and involvement [8][9][10].
Automatic Room Temperature Regulator for Making Tempe Based on Arduino. Tests were carried out
on the fermentation process of tempeh in miniature rooms without using a room temperature control system,
with detected indoor temperatures ranging from 30-31o C, requiring 33 hours of fermentation to produce good
tempe [11]. The automatic monitoring system works by using DHT22 as an input sensor for cultivation. If the
internet is connected, then nodes will send the information to the server as well as LCD Display [12]. DHT
uses a capacitive humidity sensor and a thermistor to measure the surrounding air and spits out a digital signal
on the data pin. Single-bus data format is used for communication and synchronization between microcontroller
and DHT sensor [13]. A Library <DHT11> was needed for the two devices to communicate in C language,
the Arduino programming language, by connecting between the predetermined Arduino Uno connected to the
other side of the Jumper cable to DHT [14]. The study was initiated in one environment, and the logged data
was tabulated and graphs generated from it [15].
2. RESEARCH METHOD
The system design in this research is generally divided into two stages, namely designing the hardware
to build control Temperature and Humidity system and then designing the software and network architecture
to send data monitoring. To obtain ideal results and in accordance with what is expected, designing this system
refers to the theories and datasheets of components that have been obtained from various reliable sources. The
first stage is a design stage, such as device architecture, and also imagine how to connect the system for data
transmission using the internet. We know The internet opens a new dimension in the development of various
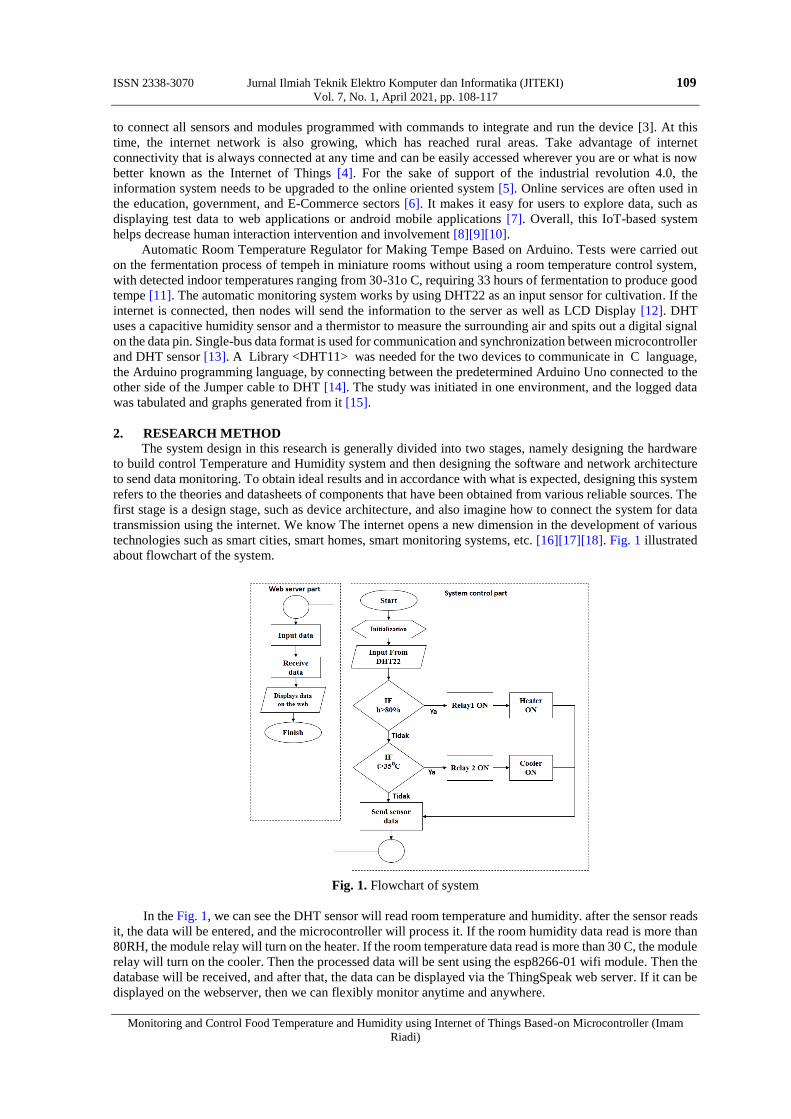
technologies such as smart cities, smart homes, smart monitoring systems, etc. [16][17][18]. Fig. 1 illustrated
about flowchart of the system.
Fig. 1. Flowchart of system
In the Fig. 1, we can see the DHT sensor will read room temperature and humidity. after the sensor reads
it, the data will be entered, and the microcontroller will process it. If the room humidity data read is more than
80RH, the module relay will turn on the heater. If the room temperature data read is more than 30 C, the module
relay will turn on the cooler. Then the processed data will be sent using the esp8266-01 wifi module. Then the
database will be received, and after that, the data can be displayed via the ThingSpeak web server. If it can be
displayed on the webserver, then we can flexibly monitor anytime and anywhere.
110 Jurnal Ilmiah Teknik Elektro Komputer dan Informatika (JITEKI) ISSN 2338-3070 Vol. 7, No. 1, April 2021, pp. 108-117
Monitoring and Control Food Temperature and Humidity using Internet of Things Based-on Microcontroller (Imam
Riadi)
2.1. Network Architecture
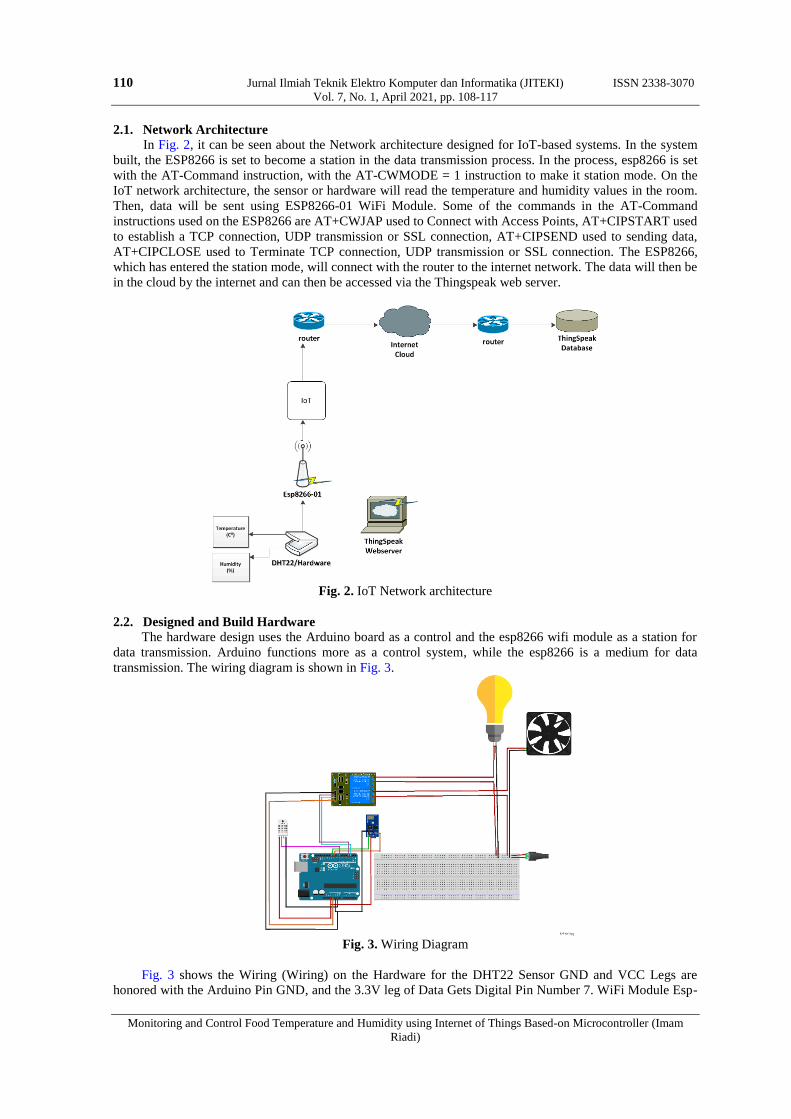
In Fig. 2, it can be seen about the Network architecture designed for IoT-based systems. In the system
built, the ESP8266 is set to become a station in the data transmission process. In the process, esp8266 is set
with the AT-Command instruction, with the AT-CWMODE = 1 instruction to make it station mode. On the
IoT network architecture, the sensor or hardware will read the temperature and humidity values in the room.
Then, data will be sent using ESP8266-01 WiFi Module. Some of the commands in the AT-Command
instructions used on the ESP8266 are AT+CWJAP used to Connect with Access Points, AT+CIPSTART used
to establish a TCP connection, UDP transmission or SSL connection, AT+CIPSEND used to sending data,
AT+CIPCLOSE used to Terminate TCP connection, UDP transmission or SSL connection. The ESP8266,
which has entered the station mode, will connect with the router to the internet network. The data will then be
in the cloud by the internet and can then be accessed via the Thingspeak web server.
Fig. 2. IoT Network architecture
2.2. Designed and Build Hardware
The hardware design uses the Arduino board as a control and the esp8266 wifi module as a station for
data transmission. Arduino functions more as a control system, while the esp8266 is a medium for data
transmission. The wiring diagram is shown in Fig. 3.
Fig. 3. Wiring Diagram
Fig. 3 shows the Wiring (Wiring) on the Hardware for the DHT22 Sensor GND and VCC Legs are
honored with the Arduino Pin GND, and the 3.3V leg of Data Gets Digital Pin Number 7. WiFi Module Esp-
ISSN 2338-3070 Jurnal Ilmiah Teknik Elektro Komputer dan Informatika (JITEKI) 111 Vol. 7, No. 1, April 2021, pp. 108-117
Monitoring and Control Food Temperature and Humidity using Internet of Things Based-on Microcontroller (Imam
Riadi)
01 Gets GND and VCC are also connected to the Arduino 3.3V Pin next because the Arduino program uses
the Serial Software library, the TX on the ESP is connected to the RX on the Arduino, namely Pin ten digital
and RX on the ESP connected to TX on Arduino, namely Pin nine digital. The relay module as a switch is
connected to a cooler and heater that is connected to Arduino Digital Pin 2 and 3.
2.3. Data analysis using standard deviation Furthermore, to make comparisons, repeated measurements were made to the process of making the tool
to determine the accuracy of the measurement by finding the standard deviation value. Standard deviation or
also known as standard deviation symbolized by 𝑆 (read: sigma) in the calculation of uncertainty against
repeated measurements, is different from the uncertainty value in a single measurement whose uncertainty is
obtained from half the value of the smallest scale of the instrument used. While the uncertainty value on
repeated measurements uses the standard deviation value. The formula is
𝑆 = √1
𝑁 − 1 ∑(𝑥𝑖 − 𝑋)
2 (1)
Where S is Standard Deviation, N is the Amount of data, 𝑋𝐼 is Data to (i= 1,2,3…..n), and 𝑋 is Average of
Sample.
Before getting the Standard Deviation value, it is necessary to find the Variant value first with the
equation as
𝑆2 =𝑆1
𝑁 − 1∑(𝑥𝑖 − 𝑋)2 (2)
The value of variance is used in determining the size of the distribution of data that will be compared
with the average value of the data. The greater the variance, the more variation in data values occurs, and there
may be a larger gap between one data value and another. If the data values are all close together, the variance
will be smaller. However, this is more difficult to understand than standard deviation, because variance
represents the result of squared values that may not be represented in the same graphical form as the original
dataset. The standard deviation is usually easier to understand and apply. Standard deviation is expressed in
the same unit of measure as the data, which is not necessarily the same as the variance.
Since Standard Deviation / Standard Deviation is the square root of the Variant, then:
𝑆 = √𝑆2 (3)
So the standard deviation is a reflection of the mean deviation of the data from the resulting mean.
Standard Deviation describes how varied the data obtained. If the Standard Deviation value is much greater
than the average value, then the mean data is an invalid representation of the entire data. Meanwhile, if the
value of Standard Deviation is very small compared to the average value, then the average value is very good
and can be used as a representation or reference of all data.
3. RESULTS AND DISCUSSION
Along with technological developments, a humidity and temperature data acquisition system has been
developed using sensors with the type and Arduino, one of which is based on IoT. IoT devices are electronic
devices in the form of a microcontroller connected to a sensor [19]. There are several devices that are connected
to each other, which in testing requires the following stages.
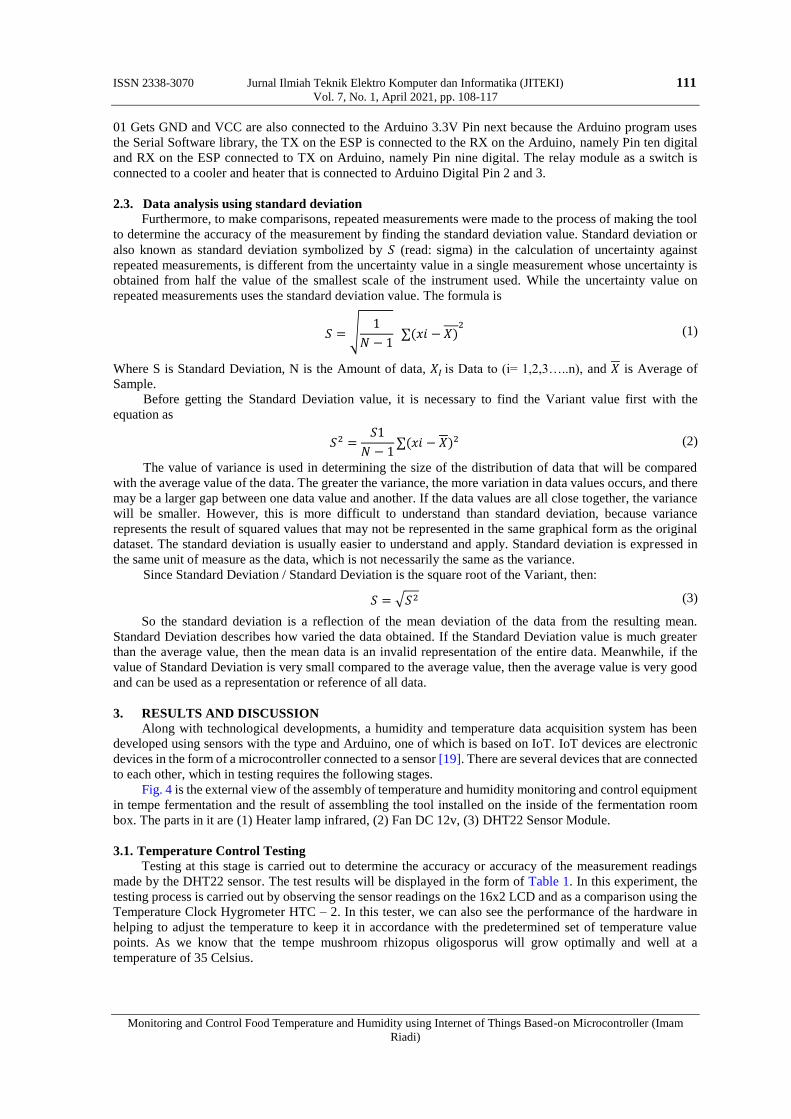
Fig. 4 is the external view of the assembly of temperature and humidity monitoring and control equipment
in tempe fermentation and the result of assembling the tool installed on the inside of the fermentation room
box. The parts in it are (1) Heater lamp infrared, (2) Fan DC 12v, (3) DHT22 Sensor Module.
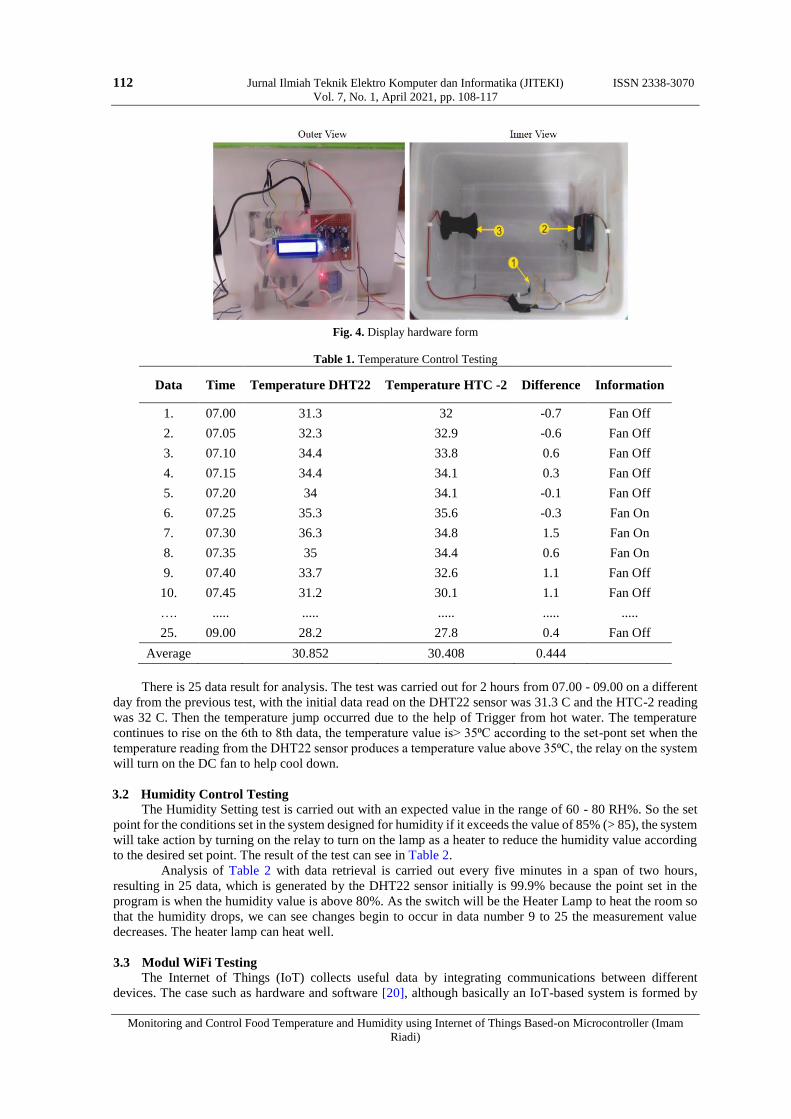
3.1. Temperature Control Testing
Testing at this stage is carried out to determine the accuracy or accuracy of the measurement readings
made by the DHT22 sensor. The test results will be displayed in the form of Table 1. In this experiment, the
testing process is carried out by observing the sensor readings on the 16x2 LCD and as a comparison using the
Temperature Clock Hygrometer HTC – 2. In this tester, we can also see the performance of the hardware in
helping to adjust the temperature to keep it in accordance with the predetermined set of temperature value
points. As we know that the tempe mushroom rhizopus oligosporus will grow optimally and well at a
temperature of 35 Celsius.
112 Jurnal Ilmiah Teknik Elektro Komputer dan Informatika (JITEKI) ISSN 2338-3070 Vol. 7, No. 1, April 2021, pp. 108-117
Monitoring and Control Food Temperature and Humidity using Internet of Things Based-on Microcontroller (Imam
Riadi)
Fig. 4. Display hardware form
Table 1. Temperature Control Testing
Data Time Temperature DHT22 Temperature HTC -2 Difference Information
1. 07.00 31.3 32 -0.7 Fan Off
2. 07.05 32.3 32.9 -0.6 Fan Off
3. 07.10 34.4 33.8 0.6 Fan Off
4. 07.15 34.4 34.1 0.3 Fan Off
5. 07.20 34 34.1 -0.1 Fan Off
6. 07.25 35.3 35.6 -0.3 Fan On
7. 07.30 36.3 34.8 1.5 Fan On
8. 07.35 35 34.4 0.6 Fan On
9. 07.40 33.7 32.6 1.1 Fan Off
10. 07.45 31.2 30.1 1.1 Fan Off
…. ..... ..... ..... ..... .....
25. 09.00 28.2 27.8 0.4 Fan Off
Average 30.852 30.408 0.444
There is 25 data result for analysis. The test was carried out for 2 hours from 07.00 - 09.00 on a different
day from the previous test, with the initial data read on the DHT22 sensor was 31.3 C and the HTC-2 reading
was 32 C. Then the temperature jump occurred due to the help of Trigger from hot water. The temperature
continues to rise on the 6th to 8th data, the temperature value is> 35⁰C according to the set-pont set when the
temperature reading from the DHT22 sensor produces a temperature value above 35⁰C, the relay on the system
will turn on the DC fan to help cool down.
3.2 Humidity Control Testing
The Humidity Setting test is carried out with an expected value in the range of 60 - 80 RH%. So the set
point for the conditions set in the system designed for humidity if it exceeds the value of 85% (> 85), the system
will take action by turning on the relay to turn on the lamp as a heater to reduce the humidity value according
to the desired set point. The result of the test can see in Table 2.
Analysis of Table 2 with data retrieval is carried out every five minutes in a span of two hours,
resulting in 25 data, which is generated by the DHT22 sensor initially is 99.9% because the point set in the
program is when the humidity value is above 80%. As the switch will be the Heater Lamp to heat the room so
that the humidity drops, we can see changes begin to occur in data number 9 to 25 the measurement value
decreases. The heater lamp can heat well.
3.3 Modul WiFi Testing The Internet of Things (IoT) collects useful data by integrating communications between different
devices. The case such as hardware and software [20], although basically an IoT-based system is formed by
ISSN 2338-3070 Jurnal Ilmiah Teknik Elektro Komputer dan Informatika (JITEKI) 113 Vol. 7, No. 1, April 2021, pp. 108-117
Monitoring and Control Food Temperature and Humidity using Internet of Things Based-on Microcontroller (Imam
Riadi)
connecting physical devices [21]. IoT systems have focused on software-defined networking [22]. The result
of this test is the output curve displayed by the ThingSpeak application for monitoring purposes [23]. ESP8266
capabilities inboard processing and storage through integration with sensors and other application-specific
tools via the GPIO with minimal upfront development and minimal loading during processing time testing on
the ESP8266 is carried out to find out that the data that has been read by the DHT22 sensor has been
successfully sent via an internet connection. ESP-01 is run together with Arduino Microntroler on System using
AT-Command Instruction in the programs. In this test, we can also see the success in sending data through the
graphs displayed on Thingspeak.
Table 2. Humidity Control Testing
Data Time Hum DHT22 Information
1. 07.00 99.9 Heater ON
2. 07.05 99.9 Heater ON
3. 07.10 99.9 Heater ON
4. 07.15 99.9 Heater ON
5. 07.20 99.9 Heater ON
.... ....... ...... ................
25. 09.00 96.7 Heater ON
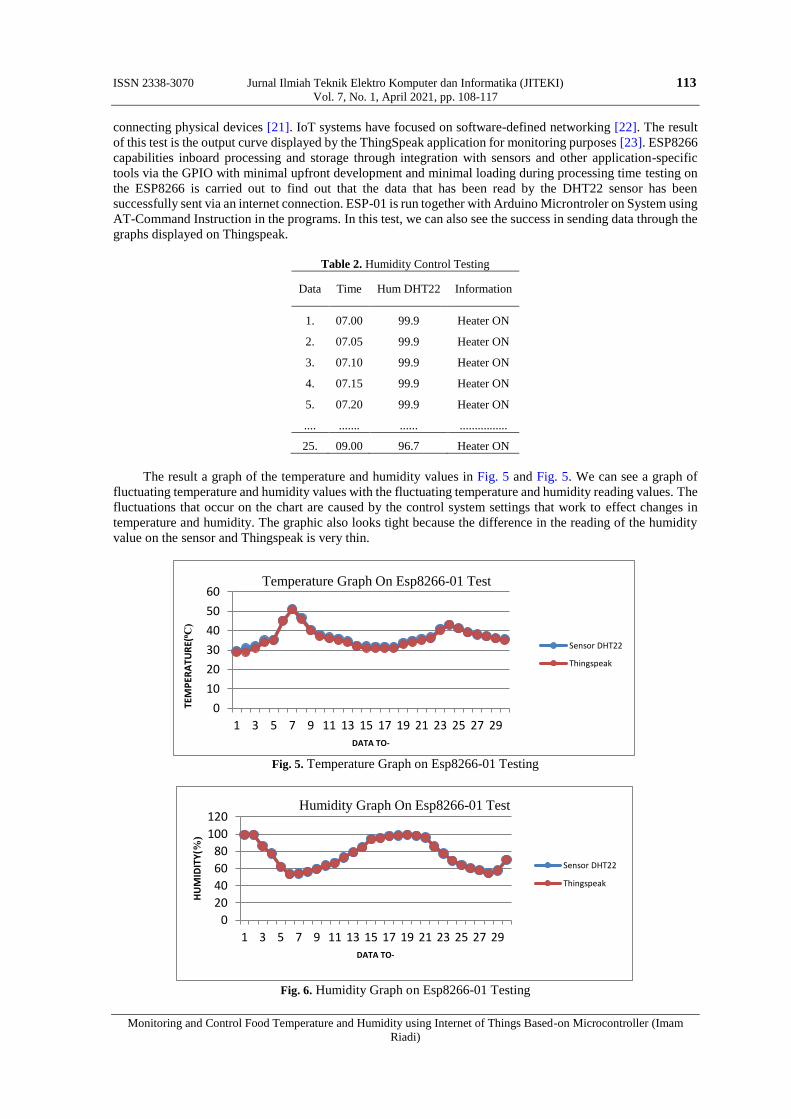
The result a graph of the temperature and humidity values in Fig. 5 and Fig. 5. We can see a graph of
fluctuating temperature and humidity values with the fluctuating temperature and humidity reading values. The
fluctuations that occur on the chart are caused by the control system settings that work to effect changes in
temperature and humidity. The graphic also looks tight because the difference in the reading of the humidity
value on the sensor and Thingspeak is very thin.
Fig. 5. Temperature Graph on Esp8266-01 Testing
Fig. 6. Humidity Graph on Esp8266-01 Testing
0
10
20
30
40
50
60
1 3 5 7 9 11 13 15 17 19 21 23 25 27 29
TEM
PER
ATU
RE(⁰C)
DATA TO-
Temperature Graph On Esp8266-01 Test
Sensor DHT22
Thingspeak
0
20
40
60
80
100
120
1 3 5 7 9 11 13 15 17 19 21 23 25 27 29
HU
MID
ITY
(%)
DATA TO-
Humidity Graph On Esp8266-01 Test
Sensor DHT22
Thingspeak
114 Jurnal Ilmiah Teknik Elektro Komputer dan Informatika (JITEKI) ISSN 2338-3070 Vol. 7, No. 1, April 2021, pp. 108-117
Monitoring and Control Food Temperature and Humidity using Internet of Things Based-on Microcontroller (Imam
Riadi)
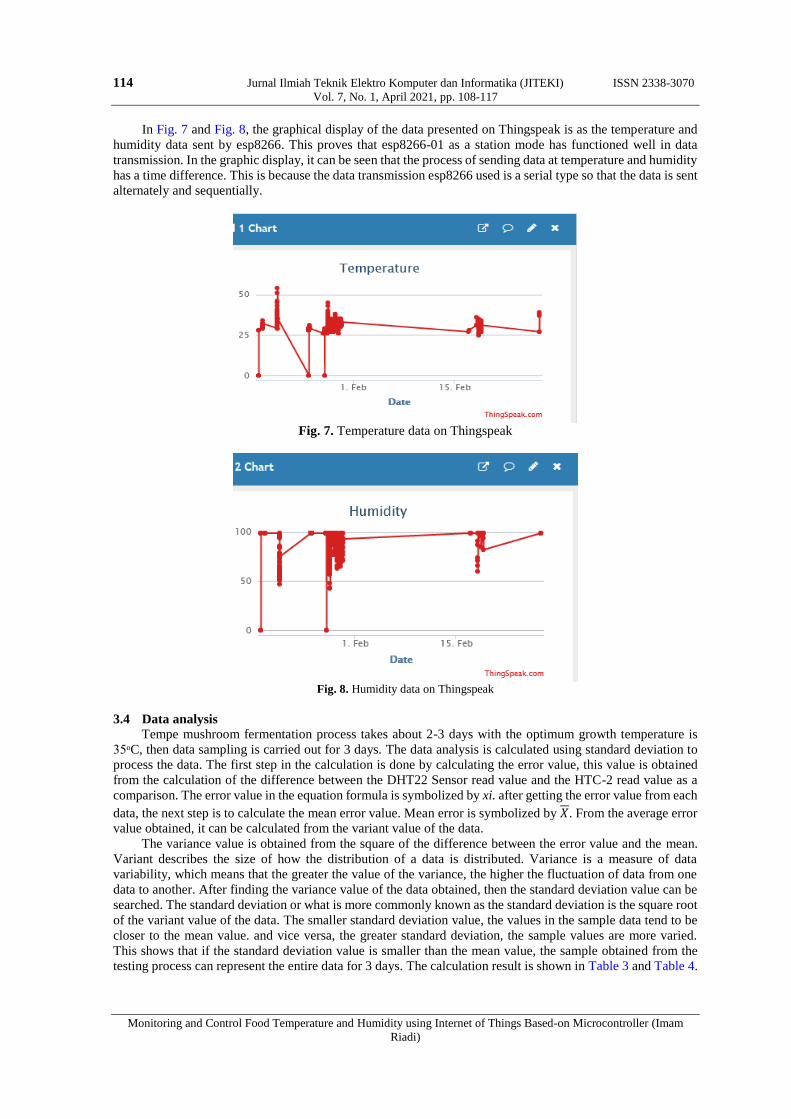
In Fig. 7 and Fig. 8, the graphical display of the data presented on Thingspeak is as the temperature and
humidity data sent by esp8266. This proves that esp8266-01 as a station mode has functioned well in data
transmission. In the graphic display, it can be seen that the process of sending data at temperature and humidity
has a time difference. This is because the data transmission esp8266 used is a serial type so that the data is sent
alternately and sequentially.
Fig. 7. Temperature data on Thingspeak
Fig. 8. Humidity data on Thingspeak
3.4 Data analysis
Tempe mushroom fermentation process takes about 2-3 days with the optimum growth temperature is
35ᵒC, then data sampling is carried out for 3 days. The data analysis is calculated using standard deviation to
process the data. The first step in the calculation is done by calculating the error value, this value is obtained
from the calculation of the difference between the DHT22 Sensor read value and the HTC-2 read value as a
comparison. The error value in the equation formula is symbolized by xi. after getting the error value from each
data, the next step is to calculate the mean error value. Mean error is symbolized by 𝑋. From the average error
value obtained, it can be calculated from the variant value of the data.
The variance value is obtained from the square of the difference between the error value and the mean.
Variant describes the size of how the distribution of a data is distributed. Variance is a measure of data
variability, which means that the greater the value of the variance, the higher the fluctuation of data from one
data to another. After finding the variance value of the data obtained, then the standard deviation value can be
searched. The standard deviation or what is more commonly known as the standard deviation is the square root
of the variant value of the data. The smaller standard deviation value, the values in the sample data tend to be
closer to the mean value. and vice versa, the greater standard deviation, the sample values are more varied.
This shows that if the standard deviation value is smaller than the mean value, the sample obtained from the
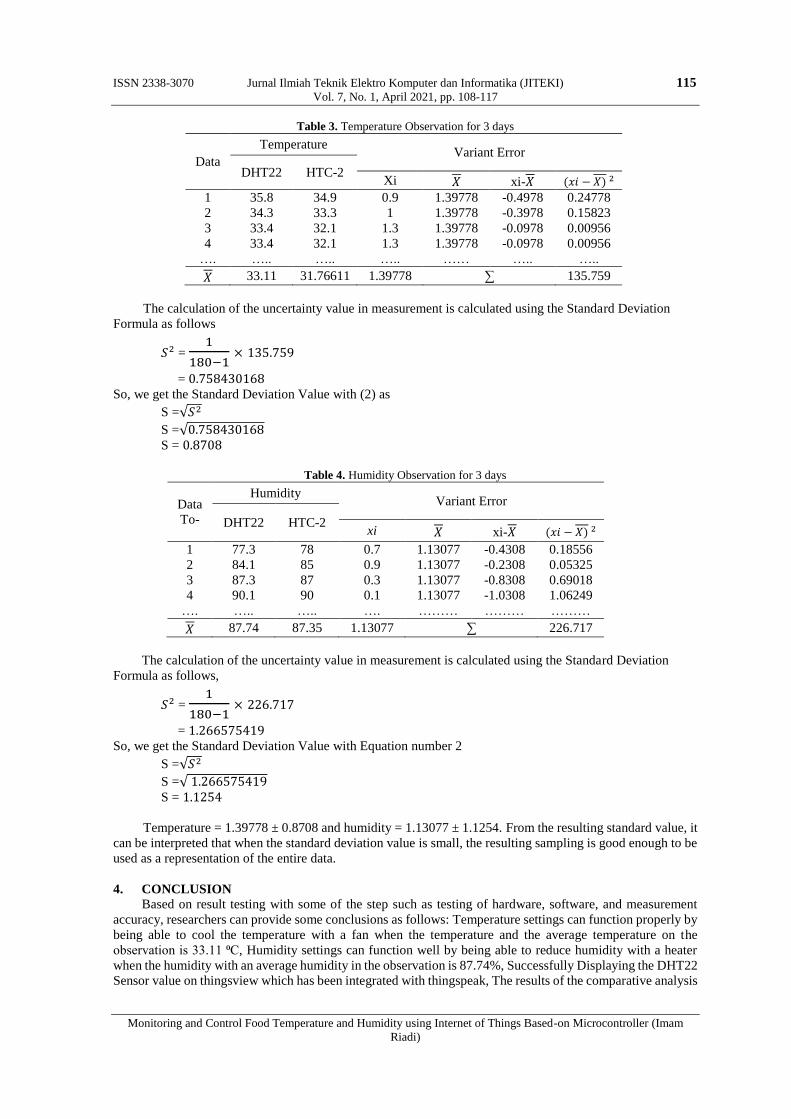
testing process can represent the entire data for 3 days. The calculation result is shown in Table 3 and Table 4.
ISSN 2338-3070 Jurnal Ilmiah Teknik Elektro Komputer dan Informatika (JITEKI) 115 Vol. 7, No. 1, April 2021, pp. 108-117
Monitoring and Control Food Temperature and Humidity using Internet of Things Based-on Microcontroller (Imam
Riadi)
Table 3. Temperature Observation for 3 days
Data
Temperature Variant Error
DHT22 HTC-2 Xi 𝑋 xi-𝑋 (𝑥𝑖 − 𝑋) 2
1 35.8 34.9 0.9 1.39778 -0.4978 0.24778
2 34.3 33.3 1 1.39778 -0.3978 0.15823
3 33.4 32.1 1.3 1.39778 -0.0978 0.00956
4 33.4 32.1 1.3 1.39778 -0.0978 0.00956
…. ….. ….. ….. …… ….. …..
𝑋 33.11 31.76611 1.39778 ∑ 135.759
The calculation of the uncertainty value in measurement is calculated using the Standard Deviation
Formula as follows
𝑆2 = 1
180−1× 135.759
= 0.758430168
So, we get the Standard Deviation Value with (2) as
S =√𝑆2
S =√0.758430168
S = 0.8708
Table 4. Humidity Observation for 3 days
Data
To-
Humidity Variant Error
DHT22 HTC-2 xi 𝑋 xi-𝑋 (𝑥𝑖 − 𝑋) 2
1 77.3 78 0.7 1.13077 -0.4308 0.18556
2 84.1 85 0.9 1.13077 -0.2308 0.05325
3 87.3 87 0.3 1.13077 -0.8308 0.69018
4 90.1 90 0.1 1.13077 -1.0308 1.06249
…. ….. ….. …. ……… ……… ………
𝑋 87.74 87.35 1.13077 ∑ 226.717
The calculation of the uncertainty value in measurement is calculated using the Standard Deviation
Formula as follows,
𝑆2 = 1
180−1× 226.717
= 1.266575419
So, we get the Standard Deviation Value with Equation number 2
S =√𝑆2
S =√ 1.266575419
S = 1.1254
Temperature = 1.39778 ± 0.8708 and humidity = 1.13077 ± 1.1254. From the resulting standard value, it
can be interpreted that when the standard deviation value is small, the resulting sampling is good enough to be
used as a representation of the entire data.
4. CONCLUSION
Based on result testing with some of the step such as testing of hardware, software, and measurement
accuracy, researchers can provide some conclusions as follows: Temperature settings can function properly by
being able to cool the temperature with a fan when the temperature and the average temperature on the
observation is 33.11 ⁰C, Humidity settings can function well by being able to reduce humidity with a heater
when the humidity with an average humidity in the observation is 87.74%, Successfully Displaying the DHT22
Sensor value on thingsview which has been integrated with thingspeak, The results of the comparative analysis
116 Jurnal Ilmiah Teknik Elektro Komputer dan Informatika (JITEKI) ISSN 2338-3070 Vol. 7, No. 1, April 2021, pp. 108-117
Monitoring and Control Food Temperature and Humidity using Internet of Things Based-on Microcontroller (Imam
Riadi)
of temperature and humidity on the DHT22 and HTC-2 sensors obtain a standard deviation value of
temperature and humidity errors of 0.8708 and 1.1254.
REFERENCES [1] G. Alfian, M. Syafrudin, and U. A. Dahlan, “Traceability system using IoT and forecasting model for food supply
chain,” 2020 International Conference on Decision Aid Sciences and Application (DASA), 2020, pp. 903–907.
https://doi.org/10.1109/DASA51403.2020.9317011
[2] A. Tahir, M. Anwar, H. Mubeen, and S. Raza, “Evaluation of Physicochemical and Nutritional Contents in Soybean
Fermented Food Tempeh by Rhizopus oligosporus,” J. Adv. Biol. Biotechnol., vol. 17, no. 1, pp. 1–9, 2018.
https://doi.org/10.9734/JABB/2018/26770
[3] V. Pravalika and C. Rajendra Prasad, “Internet of things based home monitoring and device control using Esp32,” Int.
J. Recent Technol. Eng., vol. 8, no. 1 Special Issue 4, pp. 58–62, 2019.
[4] T. Hidayat, “Internet of Things Smart Agriculture on ZigBee: A Systematic Review,” InComTech: Jurnal
Telekomunikasi dan Komputer, Vol 8, No. 1, 2018. https://doi.org/10.22441/incomtech.v8i1.2146
[5] D. Samara and Muslihudin, “Shipping Information System in Distribution Warehouses Using a Web-Based Barcode
System Sistem Informasi Pengiriman Barang di Gudang Distribusi Menggunakan Sistem Barcode Berbasis Web,”
Buletin Ilmiah Sarjana Teknik Elektro, vol. 2, no. 1, pp. 1–13, 2020. https://doi.org/10.12928/biste.v2i1.954
[6] A. Yudhana, I. Riadi, and F. Ridho, “DDoS Classification Using Neural Network and Naïve Bayes Methods for
Network Forensics,” International Journal of Advanced Computer Science and Applications (IJACSA), vol. 9, no. 11,
pp. 177–183, 2018. https://doi.org/10.14569/IJACSA.2018.091125
[7] W. E. Sari, E. Junirianto, and G. F. Rahman, “System of Measuring PH, Humidity, and Temperature Based on Internet
of Things (IoT) Sistem Pengukuran PH, Kelembapan, dan Suhu Berbasis Internet of Things (IoT),” Buletin Ilmiah
Sarjana Teknik Elektro, vol. 3, no. 1, pp. 72–81, 2021. https://doi.org/10.12928/biste.v3i1.3214
[8] A. A. R. Madushanki, M. N. Halgamuge, W. A. H. S. Wirasagoda, and A. Syed, “Adoption of the Internet of Things
(IoT) in Agriculture and Smart Farming towards Urban Greening: A Review,” International Journal of Advanced
Computer Science and Applications (IJACSA), vol. 10, no. 4, pp. 11–28, 2019.
https://doi.org/10.14569/IJACSA.2019.0100402
[9] H. H. Qasim, A. E. Hamza, L. Audah, H. H. Ibrahim, H. A. Saeed, and M. I. Hamzah, “Design and implementation
home security system and monitoring by using wireless sensor networks WSN / internet of things IoT,” International
Journal of Electrical and Computer Engineering (IJECE), vol. 10, no. 3, pp. 2617–2624, 2020.
https://doi.org/10.11591/ijece.v10i3.pp2617-2624
[10] E. Haryanto and I. Riadi, “Forensik Internet of Things Pada Device Level Berbasis Embedded System Device Level
Forensic on Internet of Things Devices,” Jurnal Teknologi Informasi dan Ilmu Komputer (JTIIK), vol. 6, no. 6, 2019.
https://doi.org/10.25126/jtiik.2019661828
[11] M. Hidayah, E. Prihartono, and B. Santoso, “Automatic Room Temperature Regulator for Making Tempe Based on
Arduino with Fuzzy Logic Method,” J. Inf., vol. 5, no. 1, p. 39, 2020. https://doi.org/10.25139/inform.v3i2.1053
[12] W. Adhiwibowo, A. F. Daru, and A. M. Hirzan, “Temperature and Humidity Monitoring Using DHT22 Sensor and
Cayenne API,” J. Transform., vol. 17, no. 2, p. 209, 2020. https://doi.org/10.26623/transformatika.v17i2.1820
[13] D. E. Minda Gilces, “Design of a monitoring system for the cultivation of garden tomato in greenhouse,” J. Sci. Res.
Rev. Cienc. e Investig., vol. 2, no. 7, p. 30, 2017. https://doi.org/10.26910/issn.2528-8083vol2iss7pp30-36
[14] M. W. Hariyanto, A. H. Hendrawan, and R. Ritzkal, “Monitoring the Environmental Temperature of the Arduino
Assistance Engineering Faculty Using Telegram,” J. Robot. Control, vol. 1, no. 3, pp. 96–101, 2020.
https://doi.org/10.18196/jrc.1321
[15] K. P. Kuria, “Monitoring Temperature and Humidity using Arduino Nano and Module-DHT11 Sensor with Real Time
DS3231 Data Logger and LCD Display,” International Journal of Engineering Research & Technology (IJERT), Vol.
9, No. 12, December, 2020.
[16] B. H. Malik, M. Khalid, M. Maryam, M. N. Ali, S. Yousaf, and M. Mehmood, “IoT Testing-as-a-Service: A New
Dimension of Automation,” International Journal of Advanced Computer Science and Applications (IJACSA), vol.
10, no. 5, pp. 364–371, 2020. https://doi.org/10.14569/IJACSA.2019.0100545
[17] F. Alshohoumi, M. Sarrab, A. Alhamadani, and D. Al-abri, “Systematic Review of Existing IoT Architectures Security
and Privacy Issues and Concerns,” International Journal of Advanced Computer Science and Applications (IJACSA),
vol. 10, no. 7, pp. 232–251, 2019. https://doi.org/10.14569/IJACSA.2019.0100733
[18] R. Rizal, I. Riadi, and Y. Prayudi, “Network Forensics for Detecting Flooding Attack on Internet of Things (IoT)
Device,” Int. J. Cyber-Security Digit. Forensics, vol. 7, no. 4, pp. 382–390, 2018.
[19] F. F. Asman, E. Permata, and M. Fatkhurrokhman, “A Prototype of Smart Lock Based on Internet of Things (IoT)
with,” Jurnal Ilmiah Teknik Elektro Komputer dan Informatika, vol. 5, no. 2, pp. 101–111, 2020.
https://doi.org/10.26555/jiteki.v5i2.15317
[20] K. Luechaphonthara and A. Vijayalakshmi, “IOT based application for monitoring electricity power consumption in
home appliances,” International Journal of Electrical and Computer Engineering (IJECE), vol. 9, no. 6, pp. 4988–
4992, 2019. https://doi.org/10.11591/ijece.v9i6.pp4988-4992
[21] A. Wani and S. Revathi, “Ransomware protection in loT using software defined networking,” International Journal
of Electrical and Computer Engineering (IJECE), vol. 10, no. 3, pp. 3166–3175, 2020.
https://doi.org/10.11591/ijece.v10i3.pp3166-3175
ISSN 2338-3070 Jurnal Ilmiah Teknik Elektro Komputer dan Informatika (JITEKI) 117 Vol. 7, No. 1, April 2021, pp. 108-117
Monitoring and Control Food Temperature and Humidity using Internet of Things Based-on Microcontroller (Imam
Riadi)
[22] Y. Saleem, N. Crespi, M. H. Rehmani, and R. Copeland, “Internet of things-aided smart grid: Technologies,
architectures, applications, prototypes, and future research directions,” IEEE Access, vol. 7, 2017.
https://doi.org/10.1109/ACCESS.2019.2913984
[23] A. H. Miry and G. A. Aramice, “Water monitoring and analytic based ThingSpeak,” International Journal of
Electrical and Computer Engineering (IJECE), vol. 10, no. 4, pp. 3588–3595, 2020.
https://doi.org/10.11591/ijece.v10i4.pp3588-3595
BIOGRAPHY OF AUTHORS
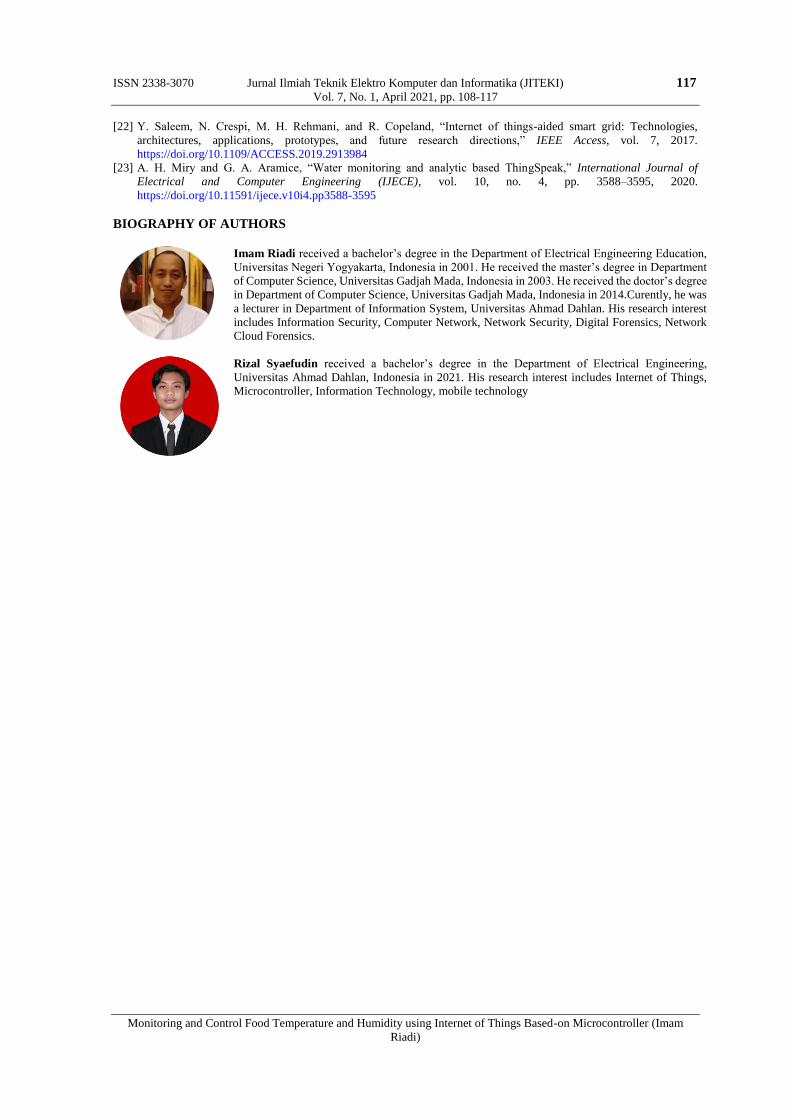
Imam Riadi received a bachelor’s degree in the Department of Electrical Engineering Education,
Universitas Negeri Yogyakarta, Indonesia in 2001. He received the master’s degree in Department
of Computer Science, Universitas Gadjah Mada, Indonesia in 2003. He received the doctor’s degree
in Department of Computer Science, Universitas Gadjah Mada, Indonesia in 2014.Curently, he was
a lecturer in Department of Information System, Universitas Ahmad Dahlan. His research interest
includes Information Security, Computer Network, Network Security, Digital Forensics, Network
Cloud Forensics.
Rizal Syaefudin received a bachelor’s degree in the Department of Electrical Engineering,
Universitas Ahmad Dahlan, Indonesia in 2021. His research interest includes Internet of Things,
Microcontroller, Information Technology, mobile technology