Embed Size (px)
Citation preview

Kumar: Monitoring and assessment of land use and land cover changes
- 221 -
APPLIED ECOLOGY AND ENVIRONMENTAL RESEARCH 15(3):221-239.
http://www.aloki.hu ● ISSN 1589 1623 (Print) ● ISSN 1785 0037 (Online)
DOI: http://dx.doi.org/10.15666/aeer/1503_221239
2017, ALÖKI Kft., Budapest, Hungary
MONITORING AND ASSESSMENT OF LAND USE AND LAND
COVER CHANGES (1977 - 2010) IN KAMRUP DISTRICT OF
ASSAM, INDIA USING REMOTE SENSING AND GIS
TECHNIQUES
KUMAR, D.
G.B. Pant National Institute of Himalayan Environment & Sustainable Development, Sikkim
Unit, Pangthang, Gangtok 737 101, Sikkim, India
e-mail: [email protected]
(Received 13th Oct 2016; accepted 3rd Mar 2017)
Abstract. Land use and land cover (LULC) has been changed significantly due to rapid urbanization at
alarming rate in the Kamrup district of Assam state of north-eastern region of India. The LULC of
Kamrup (covering 4591.79 km² geographical area) were mapped using Landsat MSS, TM and ETM+
remotely sensed images to focus on spatial and temporal changes in between 1977-2010. The LULC
maps with six major categories viz., dense forest, open forest, agriculture land, urban settlement, water
body and sand of the study site were generated using supervised classification approach. The result
interpreted that the initial dense forest cover in 1977 was approximately 29.08% (1335.42 km²) of the
total mapped area which has been decreased up to 23.83% (1094.16 km²) in 1987 and 22.34% (1025.81
km²) in 2010. Normalized Difference Vegetation Index (NDVI) of non-vegetative area is in increasing
similarly with urban settlement and open forest. The overall classification accuracy reached 76.34% in
1977, 89.56% in 1987 and 92.34 % in 2010. The extent of deforestation, change in LULC, expansion of
agriculture area, population pressure, forest clearance for agriculture practices has been studied using
remote-sensing coupled with field survey and the emphasis is given on the indictors of changes that has
been derived using temporal analysis.
Keywords: Landsat; LULC; NDVI; urbanization; forest cover
Introduction
Forests provide several ecologically, economically and socially perspective functions
to life viz., water supplies, soil conservation, nutrient cycling, species and genetic
diversity and green house gases regulation (Rao and Pand, 2001). Increasing
anthropogenic pressure such as land use/land cover changes, air, water, and soil
pollution (Fearnside, 2001; Sherbinin et al., 2007), degradation of soil quality and losses
in biological diversity causes the threatening of the overall productivity of ecosystem
functioning at regional as well as global scales (Noss, 2001; Kilic et al., 2004; Kumar,
2011). It is also concluded as vulnerability of places and people to climatic, economic
or sociopolitical perturbations (Kasperson et al., 1995; Turner et al., 2003; Lambin et
al., 2003). Agricultural practices have been the important factor for land transformation
in this world and nearly one third of the earth’s land surface is currently being used for
growing crops (FAO, 2004). Much of this agriculture land has been created at the
expense of natural forests, grassland and wetlands that provide valuable habitats for
species (MEA, 2003).
From last few years remote sensing has been widely used for several studies
including assessment of deforestation and forest cover changes (Hall et al., 1988;
Roughgarden et al., 1991; Wood and Skole, 1998; Kumar, 2011). Similarly, satellite
image classification, change analysis (Armenteras et al., 2006; Kumar, 2011) and
econometric modeling are also being used to identify the rates and drivers of

Kumar: Monitoring and assessment of land use and land cover changes
- 222 -
APPLIED ECOLOGY AND ENVIRONMENTAL RESEARCH 15(3):221-239.
http://www.aloki.hu ● ISSN 1589 1623 (Print) ● ISSN 1785 0037 (Online)
DOI: http://dx.doi.org/10.15666/aeer/1503_221239
2017, ALÖKI Kft., Budapest, Hungary
deforestation in global hotspots of biodiversity and tropical ecosystems. Several studies
showed the utility of satellite remote sensing to monitoring the changes in LULC on the
basis of spatial and temporal remote sensed data (Wood and Skole, 1998; Lele and
Joshi, 2009; Malaviya et al., 2009). Fine resolutions with spatially explicit data on
landscape fragmentation are required to understand the impact of land use changes on
biological diversity (Liu et al., 2003). Satellites data have became a major application in
change detection because of the repetitive coverage of the satellites at short time
intervals (Mas, 1999). Using remote sensing, spatially explicit time series of
environmental data can be quickly obtained and updated (Dewan and Yamaguchi,
2009). In addition, GIS (Geographical Information System) technique provides the
software’s to spatial analysis, model and map environmental changes. Therefore, remote
sensing coupled with GIS recognized as a powerful and effective tool to monitor
environmental changes at broad scale especially in detecting the LULC change (Samant
and Subramanyam, 1998; Mas, 1999; Weng, 2002; Herold et al., 2003; Chauhan and
Nayak, 2005; Shamsudheen et al., 2005; Güler et al., 2007; Fan et al., 2007; Yu et al.,
2007; Boakye et al., 2008; Coskun et al., 2008; Hu et al., 2008; Granados-Ramirez et
al., 2008; Ardi and Wolff, 2009; Dewan and Yamaguchi, 2009; Malaviya et al., 2009;
Kamusoko and Aniya, 2009; Onur et al., 2009; Dong et al., 2010; Kumar, 2011).
Remotely sensed data for image analysis have been explored the various alterations
of the earth resources including forest cover and water bodies in common (Hashiba et
al., 2000; Giriraj et al., 2008). Remote sensing provides synoptic view of forest cover
and condition on real-time basis (Lillesand and Kiefer, 1999). Multi-temporal different
time scale data were used currently for the change detection of various landscapes
(Iverson et al., 1989; Lausia and Antonio, 2001). Therefore, this technique has attracted
the attentions of several investigators worldwide to use satellite multi-temporal different
time scale data in change detections of land cover (Chauhan and Nayak, 2005; Güler et
al., 2007; Granados-Ramirez et al., 2008; Ardi and Wolff, 2009; Dewan and
Yamaguchi, 2009; Malaviya et al., 2009; Onur et al., 2009; Dong et al., 2010). A field
survey combined with satellite remote sensing is useful which provides thematic maps
for vegetation types and floral/faunal distribution in certain define areas (Fuller et al.,
1998). Heterogeneous forest cover some time creates troubles to classify forest cover on
the basis of species composition (Boyd and Danson, 2005).
The forests are exploited for various purpose as timber, slash and burn cultivation
(shifting cultivation; jhum) and pasture development (De Moraes et al., 1998; Jha et al.,
2006; Giriraj et al., 2008), because of these anthropogenic activity natural LULC has
modified in to man-made LULC with poor species composition (Behera et al., 2005).
Deforestation has impacted on biogeochemical cycles and causes soil erosion, surface
runoff and water scarcity not only in the region, but also in the reasonably distant area
(Hill, 1999). Remotely sensed data are now available to map and monitor changes from
continental and local scales as well as over temporal scale (Rogan and Chen, 2004) such
as different period of Landsat satellite data are adequate for mapping land cover and
land use changes (Fuller et al., 1998; Srivastava et al., 2002; Fan et al., 2007; Merem
and Twumasi, 2007; Yu et al., 2007; Boakye et al., 2008; Coskun et al., 2008; Malaviya
et al., 2009). Hybrid approach of classification for urban LULC has been mapped for
Atlanta metropolitan area is to improve the accuracy of classification from Landsat 7
ETM+ images (Lo and Choi, 2004). Currently, the focus on LULC changes includes the
monitoring and mapping of land use change, the analyzing of driving forces, the

Kumar: Monitoring and assessment of land use and land cover changes
- 223 -
APPLIED ECOLOGY AND ENVIRONMENTAL RESEARCH 15(3):221-239.
http://www.aloki.hu ● ISSN 1589 1623 (Print) ● ISSN 1785 0037 (Online)
DOI: http://dx.doi.org/10.15666/aeer/1503_221239
2017, ALÖKI Kft., Budapest, Hungary
modeling and predicting of land use change with different scenarios, and the assessing
ecological effects associated with land use change.
In India, several works have been carried out to study the deforestation rates and
changes in LULC (Prakash and Gupta, 1998; Samant and Subramanyam, 1998; Fazal,
2000; Srivastava et al., 2002; Chauhan and Nayak, 2005; Shamsudheen et al., 2005; Jat
et al., 2008; Lele and Joshi, 2009; Malaviya et al., 2009). Interestingly, most of the
works of LULC change has been carried out in biological species rich areas of India
(IIRS, 2002; Prasad et al., 2010). Notably, Assam states of north-eastern region of India
comprising of two mega biodiversity hotspots i.e. Himalayan and Indo-Burma, are
undergoing rapid changes in LULC over the last three decades (Lele and Joshi, 2009).
Keeping these perspectives in view, an attempt was made to provide opportunities to
realize a strategic assessment to determine the LULC change during the past years
(1977-2010), assessment of the impact on forest cover by using integrate field and
image analysis. This study has been undertaken with a hope to meet the challenges in
planning and management especially to control the deforestation of Kamrup district of
Assam.
Materials and Methods
Study area
Kamrup district in Assam state, India extends between 25°46’ to 26°49’ N latitudes
and 90°48’ to 91°50’ E longitudes, covering an area of about 4591.79 km² (Fig. 1). The
Guwahati city is located at the southern bank of mighty river Brahmaputra which is one
of the geometric centers of the study site. Guwahati, one of the most important cities of
the north eastern part of India, located in Kamrup district of Assam which is growing
hastily in size, diversity and population. In Kamrup, rapid urbanization is a result of the
unprecedented population growth. The city of Guwahati in north-eastern region of India
provides a typical case of haphazard and impromptu urbanization. Due to the rapid
growth of the city, the anthropogenic activities have been increasing since the last few
decades. There is a rapid growth of population in the city from 2,92,029 to 27,77,621
persons within a period of 40 years from 1971 to 2011 (Census of India, 1991 and
2011). Secondly, due to the unplanned growth of the city, the LULC has changed day
by day and therefore, a need for proper planning for the careful handling of this
alarming situation is warranted.
The altitude of the study area ranges from 78 to 321 m above mean sea level,
harboring a mosaic of land use types. The geological, geo-morphological and climatic
conditions give rise to younger alluvial soil that mainly Udifluvents (at Brahmaputra
river basin) and Haplastalfs to Rhodustalfs (at the boundary of Meghalaya). The
Alluvial soils are deposited in the site mainly by the flood of the rivers carrying silt and
mostly found in the flood plain tract of the river Brahmaputra (SOE, 2004; IUSS
Working Group WRB, 2014). The textures of the soil are usually sandy, silty, clayey-
loam. The region is characterized by hot sub-humid (moist) to humid (inclusion of per-
humid) climate with alluvium dried soil and growing period of approximately 210+
days. Mean daily temperature ranges from 7.0 to 39.5 °C, and precipitation average
2200 mm year-1
.
The district falls within 9A and 9B biogeographic zones, i.e. north-east Brahmaputra
valley and northeast hills (Rodgers and Panwar, 1988). The region is very rich in floral
and faunal resources, encompasses two protected area of Assam i.e. Deepor Beel and

Kumar: Monitoring and assessment of land use and land cover changes
- 224 -
APPLIED ECOLOGY AND ENVIRONMENTAL RESEARCH 15(3):221-239.
http://www.aloki.hu ● ISSN 1589 1623 (Print) ● ISSN 1785 0037 (Online)
DOI: http://dx.doi.org/10.15666/aeer/1503_221239
2017, ALÖKI Kft., Budapest, Hungary
Amchang Wildlife Sanctuary. Deepor Beel is located about 10 km south western part of
Guwahati city and it is considered as one of the large and important wetlands in
Brahmaputra valley. This sanctuary has been recognized as a wetland under the Ramsar
Convention, which has listed the lake in November 2002, as a Ramsar site for
undertaking conservation measures on the basis of its rich biological and environmental
importance. It is also categorized of the wetland type under the Burma Monsoon Forest
biogeographic region. Deepor Beel is a natural habitat for approximately 219 species of
birds, including 70 migratory species and some are globally threatened viz., Spotbilled
Pelican (Pelecanus philippensis), Lesser Adjutant Stork (Leptoptilos javanicus) and
Bare’s Pochard (Aythya baeri). Amchang Wildlife Sanctuary located eastern fringe of
the Guwahati city cover 78.64 km² area. Different kinds of mammals, birds and
butterfly are found in this sanctuary. Some species of mammals recorded so far in this
sanctuary are Chinese Pangolin (Manis pentadactyla), Flying Fox (Pteropus giganteus),
Asian Elephant (Elephas maximus), Wild Pig (Sus scrofa), Capped Langur
(Trachypithecus pileatus), Assamese Macaque (Macaca assamensis) and Leopard Cat
(Prionailurus bengalensis). Most of these preferred the habitat of semi-evergreen to
moist-deciduous forest. Land use pattern in the Kamrup district is divided primarily
among tropical semi-evergreen, moist deciduous, dry deciduous, degraded bamboo
forest, sal forest, tea plantation, agriculture and urban land. Unplanned growth of the
Guwahati city, deforestation, timber harvestation, expansion of agricultural land and
encroachment are some major threats for changes the land covers of the Kamrup district
of Assam (India).
Figure 1. Location of the study area Kamrup District of Assam, India.

Kumar: Monitoring and assessment of land use and land cover changes
- 225 -
APPLIED ECOLOGY AND ENVIRONMENTAL RESEARCH 15(3):221-239.
http://www.aloki.hu ● ISSN 1589 1623 (Print) ● ISSN 1785 0037 (Online)
DOI: http://dx.doi.org/10.15666/aeer/1503_221239
2017, ALÖKI Kft., Budapest, Hungary
Data
This study aims to detect LULC with visual interpretation and supervised
classification, then analyses of changes over the different time periods. The present data
analysis was carried out using six cloud free Landsat remote sensed images viz., two
Multispectral Scanner (MSS) of 1977 covering path and row 029/155 and 029/174 (Fig.
2), two Landsat Thematic Mapper (TM) of 1987 covering path and row of 029/745 and
028/756 (Fig. 2) and two Landsat Enhanced Thematic Mapper plus (ETM+) of 2010
covering path row 218/249 and 218/278 (Fig. 2). The orthorectified Landsat data was
downloaded from GLCF (Global Land Cover Facilities) websites
(http://glcf.umiacs.umd.edu/) at EROS data center, University of Maryland served as
the primary data source to evaluate LULC. The images were downloaded as separate
bands 1-5 and 7 and then stacked in ERDAS Imagine 2010 to give the multispectral
images. Landsat orbits the earth at an altitude of circa 705 km, according to Sun-
synchronous, near-polar orbit with an inclination angle of 98.22 with respect to the
equator. This orbital pattern provides the opportunity to collect imagery at high latitude
regions. The revisit time and hence maximal temporal resolution of the sensor is 16 day.
The ETM+ sensor is an imaging radiometer collecting reflected and emitted energy
from the earth’s surface in eight bands of the electromagnetic spectrum. The ETM+ is
designed to collect, filter and detect radiation from the earth in a swath 185 km wide as
it passes over head and provides the necessary cross-track scanning motion while the
spacecraft orbital motion provides motion an along-track scan. Landsat data contains
different spatial and the spectral wavelength analyzed for the study of LULC changes in
different years (Table 1). Apart from the Landsat satellite data Survey of India (SOI)
topographical maps of 1:50,000 scale was used as a baseline map for the Area of
Interest (AOI), ERDAS Imagine for image processing and analysis and Arc GIS for
further calculation and generation of maps.
Table 1. Spatial and spectral behavior of different series of Landsat satellite sensors.
Resolution Landsat MSS Landsat TM Lamdsat ETM+
Spatial (m) 80 30 30
Spectral (µm)
Band 1 0.50-0.60 (Green) 0.45-0.52 (Blue) 0.45-0.52 (Blue)
Band 2 0.60-0.70 (Red) 0.52-0.60 (Green) 0.53-0.61 (Green)
Band 3 0.70-0.80 (Blue) 0.63-0.69 (Red) 0.63-0.69 (Red)
Band 4 0.80-1.10 (IR) 0.79-0.90 (NIR) 0.75-0.90 (NIR)
Band 5 1.55-1.75 (SWIR) 1.55-1.75 (SWIR)
Band 6 10.4-12.5 (TIR) 10.40-12.50 (TIR)
Band 7 2.08-2.35 (SWIR) 2.1-2.35 (SWIR)
Band 8 0.52-0.90 (PAN)
IR: Infrared, NIR: Near Infrared, SWIR: Short Wavelength Infrared, TIR: (Thermal Infrared), SWIR:
Short Wavelength Infrared, PAN: Panchromatic.

Kumar: Monitoring and assessment of land use and land cover changes
- 226 -
APPLIED ECOLOGY AND ENVIRONMENTAL RESEARCH 15(3):221-239.
http://www.aloki.hu ● ISSN 1589 1623 (Print) ● ISSN 1785 0037 (Online)
DOI: http://dx.doi.org/10.15666/aeer/1503_221239
2017, ALÖKI Kft., Budapest, Hungary
Figure 2. False color composites (FCC) for the study area between 1977 to 2010 (Landsat
MSS, February 1977; Landsat TM, November 1987; Landsat ETM+, February 2010.) showing
difference in forest cover, and also the variation in color tone and texture.
Different Images of Landsat data pre-processed, in this study image enhancement
and georeferencing has been done. Georeferencing performed by registered Landsat
images geometrically using topographical map of Survey of India (SOI) on 1:50,000
scale in ERDAS Imagine. The common uniformly distributed GCPs (Ground Control
Points) were marked with root mean square of one pixel and the image was re-sampled
at nearest neighbor method. After that the study area (AOI) extracted from georefrence
images of different year by overlaying the boundary data provided by SOI
topographical maps.
Vegetation indices
Normalized Difference Vegetation Index (NDVI) is a ratio that uses the near infrared
and red bands to distinguish the differences between vegetated and non vegetated area
or it measures the abundance and growth condition of vegetation. The value of NDVI
ranges between -1 to +1 means, higher the value of NDVI means vegetated area and
lower value non-vegetated area. The development of vegetation indices from satellite
images facilitated the process of differentiating and mapping vegetation by providing
valuable information about structure and composition. In tropical forests, the NDVI
from Landsat has demonstrated to be an indicator of overall canopy structure,
vegetation cover, tree density and species diversity (Oza et al., 1996; Sanchez-Azofeia
et al., 2003; Krishnaswamy et al., 2004; Feeley et al., 2005). The NDVI of different
time period of Landsat images of Kamrup district was calculated following Equations 1
and 2, using ERDAS Imagine 2010 (Fig. 3).
Figure 3. NDVI map for the Kamrup district between 1977 to 2010 showing changes in NDVI
value with increases the area of contrast color.

Kumar: Monitoring and assessment of land use and land cover changes
- 227 -
APPLIED ECOLOGY AND ENVIRONMENTAL RESEARCH 15(3):221-239.
http://www.aloki.hu ● ISSN 1589 1623 (Print) ● ISSN 1785 0037 (Online)
DOI: http://dx.doi.org/10.15666/aeer/1503_221239
2017, ALÖKI Kft., Budapest, Hungary
NDVI (MSS) = NIR (Band 4)-Red (Band 2)/NIR (Band 4) +Red (Band 2) (Eq. 1)
NDVI (TM and ETM+) = (Band 4)-Red (Band 3)/NIR (Band 4) +Red (Band 3) (Eq. 2)
Species composition under different land cover
In the present study, major forest cover types were classified into two categories viz.,
dense forest and open forest on the basis of percentage of canopy cover. Forests with
>40-80% and >20-40% canopy cover were classified in the dense forest and open forest
respectively. Further dense and open forests were analyzed on the basis of species
composition.
Land use and land cover classification
Supervised classification method was used for mapping of LULC of the study area.
This has been frequently used in image classification. In supervised classification, the
area of known identity was used to classify pixels of unknown area and training sites is
closely controlled by analyst. The spectral behavior of training sites gives information
of the classes of land cover such as dense forest, open forest, degraded forest,
agriculture pasture, scrub and water bodies in the images. The selection of training sites
and classification of different classes of land cover of study area were done using
ERDAS Imagine software under the process of maximum likelihood classifier for the
recent remote sensed data (Landsat ETM+).
Accuracy assessment
Accuracy assessment for the LULC maps of the Kamrup district was based on the
ground truth points recorded during field survey. These points were collected in
stratified random manner using a GPS. Error matrices were used to calculate user’s and
producer’s accuracies for the forests cover class, over all accuracies and Kappa
Coefficient for each image individually as well as collectively.
Change detection
To quantitatively describe the LULC change, a Net Change Ratio (NCR) is used to
enable the compression between the extents of LULC change between two land covers
(Dong et al., 2010):
NCR = (Aie – Ais)/Ais × 100% (Eq. 3)
where Ais is the area of ith
land cover type in the first year and Aie is the area of ith
land
cover type in the last year.
In addition, to analysing and understanding the characteristics patterns in a region,
many landscape matrices were computed. The Shannon-Weaver diversity index (H) is
widely used in landscape ecology. It is defined as follows (Derry et al., 1998):
H= -∑ pi × ln (pi) (Eq. 4)
where pi is the ratio of land use and land cover type i with respect to that to the total
area and m is the total number of land cover types.

Kumar: Monitoring and assessment of land use and land cover changes
- 228 -
APPLIED ECOLOGY AND ENVIRONMENTAL RESEARCH 15(3):221-239.
http://www.aloki.hu ● ISSN 1589 1623 (Print) ● ISSN 1785 0037 (Online)
DOI: http://dx.doi.org/10.15666/aeer/1503_221239
2017, ALÖKI Kft., Budapest, Hungary
H is a unit-less measure that increases with increasing heterogeneity of the sample unit
of the landscape. This index is based on determining the uncertainty in a randomly
selected land cover types of the landscape.
Analysis of the rate of land use change
Two kinds of land use change rate were focused on in this case study, i.e. the
changes rate of single land use, and the integrated land use change for the whole region
(Zhu et al., 2001).
Change rate of single land use as a dynamic degree can be quantitatively measure the
change of a certain land use type. This index is recognized as one of the most widely
used indices for detecting the land use change rate. It is mostly calculated according to
equation (5):
K= (Ub-Ua)/Ua × 1/T ×100 (Eq. 5)
where K is land use dynamic degree, measuring the change rate of the target land use
type; Ua and Ub are the area of the target land use type at the beginning and end of the
study period respectively; and T is the study period, which is usually measured with the
unit of year.
Results
Land use and land cover
Six major LULC categories were delineated using Landsat data and field
investigation viz., dense forest, open forest, agriculture land, settlement, water bodies
and sand (Fig. 4). In the year of 1977, dense forest cover was accounted about 29.08%
(1335.42 km²) that has been decreased on 23.83% (1094.16 km²) in 1987 and only
22.34% (1025.80 km²) in 2010 respectively in the entire study area of 4,591.79 km²
(Table 2 and 3). Dominated tree species composition of different LULC is summarized
in Table 4. The total dense forests of the Kamrup district was degraded (6.47%) within
last three decades (1977-2010), in the form of selective logging, fire, grazing, fuel and
timber wood collection, leading to growth of secondary successional stage. The study
also emphasis that, the dense forest cover area (309.62 km²) is transformed in to another
category of land cover, indicated that high anthropogenic pressure in the district. The
result (Fig. 4 and Fig. 5) also suggested that the surface area of dense forest, agriculture
land and water bodies were decreased as a result of LULC changed.
Land use change
The land uses have changed significantly during the period of 1977 to 1987 in
Kamrup district of Assam (Table 2 and 3). Agriculture land decreased more than as
much as dense forest and water bodies classes; whereas urban settlement, sand and open
forest cover classes areas increased during 1977 to 1987. From 1987 to 2010 the
changes in LULC classes is much lower than the previous changes and during this
agriculture, dense forest and sand cover class area was decreased.

Kumar: Monitoring and assessment of land use and land cover changes
- 229 -
APPLIED ECOLOGY AND ENVIRONMENTAL RESEARCH 15(3):221-239.
http://www.aloki.hu ● ISSN 1589 1623 (Print) ● ISSN 1785 0037 (Online)
DOI: http://dx.doi.org/10.15666/aeer/1503_221239
2017, ALÖKI Kft., Budapest, Hungary
Figure 4. Class map of Vegetation and land cover of the study area in 1977 to 2010.
Figure 5. Changes in LULC (1977 to 2010) in different land use (1: Dense forest, 2: Open
forest, 3: Agriculture land, 4: Urban settlement, 5: Sand, 6: Water bodies).
Table 2. Land use and land cover change of Kamrup, Assam, India.
Class Dense
Forest
Open
Forest
Agriculture
land Settlement Sand
Water
bodies Year
1977 (km²) 1335.42 677.21 1479.81 559.41 101.90 438.04
1987 (km²) 1094.16 891.91 1107.88 986.43 162.71 348.69
2010 (km²) 1025.80 920.98 995.72 1128.30 148.18 372.84
Net Change Ratio
(%) 1977/1987 -18.07 31.70 -25.10 76.33 59.68 -20.40
Net Change Ratio
(%) 1987/2010 -6.20 3.26 -10.00 14.40 -8.90 6.93
Total Net Change Ratio
(%) 1977/2010 -23.20 36.00 -32.70 101.70 45.41 -14.90

Kumar: Monitoring and assessment of land use and land cover changes
- 230 -
APPLIED ECOLOGY AND ENVIRONMENTAL RESEARCH 15(3):221-239.
http://www.aloki.hu ● ISSN 1589 1623 (Print) ● ISSN 1785 0037 (Online)
DOI: http://dx.doi.org/10.15666/aeer/1503_221239
2017, ALÖKI Kft., Budapest, Hungary
Table 3. Percentage area covered in different land use categories and SHDI during 1977-
2010.
Year Area covered (%)
SHDI Dense
Forest
Open
Forest
Agriculture
Land
Urban Settlement Sand Water
bodies
1977 29.08 14.75 32.23 12.18 2.22 9.54 1.571
1987 23.83 19.42 24.13 21.48 3.54 8.37 1.640
2010 22.34 20.06 21.68 24.57 3.23 8.11 1.658
Table 4. Species composition in different land use categories.
Sl.
No.
Classification and species composition in different land use and land cover classes
1. Dense Forest
1.1 Semi-evergreen Forest
Alstonia scholaris, Antidesma ghaesembilla, Artocarpus chama, Bauhinia purpurea, Bridelia
stipularis, Dillenia indica, Duabanga grandiflora, Engelhardtia spicata, Gmelina arborea,
Lagerstroemia parviflora, Litsea salicifolia, Mallotus philippensis, Schima wallichii, Protium
serratum, Frmiana simplex, Syzygium cumini, Stereospermum tetragonum, Terminalia chebula,
Magnolia champaca, Toona ciliata
1.2 Moist-deciduous Forest
1.2.1 Sal Forest
Dominated by Shorea robusta, Schima wallichii
1.2.2 Wet Hill Sal Forest
Shorea robusta is usually associated with Lagerstroemia parviflora, Lagerstroemia speciosa,
Schima wallichii, Stereospermum tetragonum, besides these species other common tree species
of this forest are; Artocarpus chama, Bauhinia variegata, Bischofia javanica, Bridelia retusa,
Careya arborea, Callicarpa arborea, Derris indica, Dillenia pentagyna, Gmelina arborea,
Balakata baccata, Erminalia bellirica, Mallotus philippensis, Vitex peduncularis, Ziziphus
jujuba
1.2.3 Moist Sal Forest
Artocarpus chama, Careya arborea, Derris indica, Dillenia pentagyna, Rhus sp., Schima
wallichii, Ficus hispida, Kydia calycina, Balakata baccata, Holarrhena pubescens, Wrightia
arborea.
2. Open Forest
2.1 Dry-deciduous Forest
Aegle marmelos, Albizia procera, Bombax ceiba, Callicarpa arborea, Cassia fistula,
Dalbergia sp., Dalbergia pinnata, Gmelina arborea, Kydia calycina, Litsea monopetala,
Mallotus philippensis, Melia azedarach, Oroxylum indicum, Shorea robusta, Catunaregam
spinosa, Phyllanthus emblica, Tectona grandis, Wrightia arborea, Streblus asper, Semecarpus
anacardium, Ziziphus jujuba.
2.2 Degraded and Shrub land
Bombax cebia, Cassia fistula, Ficus hispida, Phyllanthus emblica, Spondias pinnata, Streblus
asper, Oroxylum indicum.
3. Agriculture land
Mostly rice dominated agricultural land with side by side several tree sps. and bamboo are such
as Trewia nudiflora, Bombax ceiba, Cassia fistula, Termenallia bellirica, Ficus hispida, Toona
ciliata, Dendrocalamus hamiltonii, Bambusa tulda, Bambusa balcooa.
4. Water bodies/ Wetlands
The wetland are mostly dominated by several hydrophytes species such as Eichhornia
crassipes, Lemna perpusilla, Pistia stratiotes, Salvinia aucullata, Ceratophyllum demersum,
Utricularia aurea, Nymphea nouchali, Ipomea aquatica, Limnophila sp., Polygonum glabrum

Kumar: Monitoring and assessment of land use and land cover changes
- 231 -
APPLIED ECOLOGY AND ENVIRONMENTAL RESEARCH 15(3):221-239.
http://www.aloki.hu ● ISSN 1589 1623 (Print) ● ISSN 1785 0037 (Online)
DOI: http://dx.doi.org/10.15666/aeer/1503_221239
2017, ALÖKI Kft., Budapest, Hungary
Change detection and landscape indices
The Shannon-Weaver Diversity index (SHDI) of landscape increase significantly
during the year of 1977-1987. Higher the value of SHDI in a landscape refers to more
landscape elements. The value of the SHDI during the year 1987-2010 was little low
with some increase from 1.640 to 1.658 (Table 3).
Accuracy assessment
The accuracy assessment is conceded out to evaluate the quality of thematic maps
revealed from remote sensed data in a consequential way. The overall accuracy of
classification was 76.34% for the 1977 MSS, 89.56% for the 1987 TM image, and
92.34% for the 2010 ETM+ images and the Kappa Coefficients was 0.84, 0.89 and 0.92
respectively (Table 5).
Table 5. Accuracy assessment evaluation in different classify images of different time scale.
Sl. No. Classes
1977 1987 2010
UA* PA** UA* PA** UA* PA**
1 Dense forest 69.5 70.2 72.5 92.5 87.3 94.6
2 Open forest 71.5 83.5 85.5 96.3 89.5 96.4
3 Agriculture land 81.3 94.6 91.0 93.4 92.5 100
4 Urban settlement 70.5 92.5 92.5 97.8 94.0 98.9
5 Sand 70.2 90.5 90.5 96.3 91.0 96.4
6 Water bodies 96 100 100 100 100 100
7 Overall accuracy 76.34 89.56 92.34
8 Kappa statistics 0.84 0.89 0.92
*UA: User’s accuracy (%); **PA: Producer’s accuracy (%).
Discussion
Satellite remote sensed dataset facilitates monitoring of LULC implementation. In
Kamrup district of Assam province of north-eastern region of India, Landsat images
have been used for study the land cover changes during last few decades. In India, the
forests are being disturbed from pre-independence period until today for various
rationales (Stebbing, 1992; Bhat et al., 2000; Jayakumar et al., 2009). Zeng et al. (2000)
reported the usefulness of NDVI to assess the percentage of vegetation cover and
opined that higher the NDVI value indicates the rich vegetation density. This technique
has also being assisted with Landsat ETM+ data vis-à-vis analysis of other satellite
images for digital mapping of forest density (Kumar et al., 2007), soil mapping and
different LULC (Boettinger et al., 2008). Primary feature of vegetation viz., light, water
and soil conditions are also being affected due to additional deforestation and clear-cut
timber harvestation (Kumar et al., 2007; Boettinger et al., 2008). The present study
showed positive discrimination of gradual increment of NDVI value, indicates that
anthropogenic pressure increase in time dependent manner, which is reflected at our

Kumar: Monitoring and assessment of land use and land cover changes
- 232 -
APPLIED ECOLOGY AND ENVIRONMENTAL RESEARCH 15(3):221-239.
http://www.aloki.hu ● ISSN 1589 1623 (Print) ● ISSN 1785 0037 (Online)
DOI: http://dx.doi.org/10.15666/aeer/1503_221239
2017, ALÖKI Kft., Budapest, Hungary
investigation during last few decades (1977 to 2010) in Kamrup district of Assam (Fig.
3).
A significant declination of about 56 % (> 2.9 million ha) in lowland protected forest
of Kalimantan’s has been assessed and monitored by Landsat temporal data (Curran et
al., 2004). By using a similar approach, Srivastava et al. (2002) reported increased
insurgency problem and constant increase in the anthropogenic pressure in Sonitpur
district of Assam, resulted maximum loss of forest cover about 229.64 km². Present
investigation showed massive reduction in forest and agriculture land in time dependent
manner importantly in different LULC classes from 1977 to 2010 and has positive
correlation with study of Ardi and Wolff, (2009) who reported the significant loss of
woodland area in Bindura district of Zimbabwe 17% (380.1 km2) and 11% (304.8 km
2)
during 1973-1989 and 1989-2000 respectively using the same approach.
Various dilemmas are also persists for image enhancement procedures and its
inability to differentiate accurate variation of soil moisture and vegetation phenology
moved toward land cover changes. The use of classification techniques avoided this
problem. When carried out independent supervised classification, classes which present
very different spectral signatures at different dates can be classified in to the same land
cover. In the present study, spectral classes corresponded to different classes of changes,
and multi-date unsupervised classification did not allow the accurate identification of
the land cover changes. Results suggest that the principal land cover changes in the
Kamrup (Assam, India) such as, deforestation, timber harvestation and conversion of
agriculture land to buildup area can be monitored accurately by temporally remote
sensed images (Fig. 4).
Comprehensive analysis revealed that in the year 1977, agriculture land cover was
32.23% of the total study area, which can be considered as the majority of the land
cover. The land cover was remained a major part despite the diminishment of land cover
as 24.13% to 21.68% from the year 1987-2010 (Table 3). Same pattern of declination
was observed in land cover area constituting dense forest and water bodies from 1977 to
1987, with a net change ratio of -18.08%, and -20.40% respectively. In contrast, open
forest, urban settlement and sand land surface area increases gradually over 1977 to
1987, with a net change ratio of 31.70%, 76.33% and 59.68% respectively (Table 2).
The annual rate of land use change (K) was measured as highest for urban settelement
class (7.63%), whereas dense forest, agriculture land and water bodies did reveal the
lowest values i.e. -18.0%, -25.1% and -20.3% respectively during the 1977 to 1987
(Fig. 6). An inclusive comparison of land use area revealed the loss of dense forest,
agriculture land and sand area during 1987-2010 with the net change ratio of -6.20%, -
10.0% and -8.90% and the rate of land use change -0.32%, -0.53% and -0.46%
respectively. These data are in favor of the study of Yu et al. (2007), who reported the
overall open forests, grassland and river-bed area loss as 69.6 ha (3.4 %), 16.6 ha (2%)
and 20.9 ha (15%) between 1976-2005 in Briahi Ganga Sub-watershed of Garhwal
Himalaya, Uttrakhand using Landsat MSS, TM and IRS 1D LISS III images. This
change detection techniques may be described as a reason of increasing anthropogenic
activity such as mining (Srivastava et al., 2002), deforestation, urbanization, causes
increased diversity indices (SHDI) during 1977 to 2010 with increased in the
fragmentation of forest, scrub and agriculture land cover in to different new land use
classes such as mine-water and waste land.

Kumar: Monitoring and assessment of land use and land cover changes
- 233 -
APPLIED ECOLOGY AND ENVIRONMENTAL RESEARCH 15(3):221-239.
http://www.aloki.hu ● ISSN 1589 1623 (Print) ● ISSN 1785 0037 (Online)
DOI: http://dx.doi.org/10.15666/aeer/1503_221239
2017, ALÖKI Kft., Budapest, Hungary
Figure 6. Change rate of single land use type in study area during 1977 to 1987 and 1987-2010
(1: Dense forest, 2: Open forest, 3: Agriculture land, 4: Urban settle, 5: Sand, 6: Water bodies).
Another important factor which gets consideration is the policy of Indian government
after independence which enables the migration of people from neighboring countries
without any predicament and subsequently facilitate inhabit in this particular region.
The fact gets support from data of drastic increase in population of Assam province and
Kamrup district in particular with 53.26 and 65.72 respectively during 1971/1999
(Table 6) and population statistics (SOE, 2004) of this district from 1901 to 2011
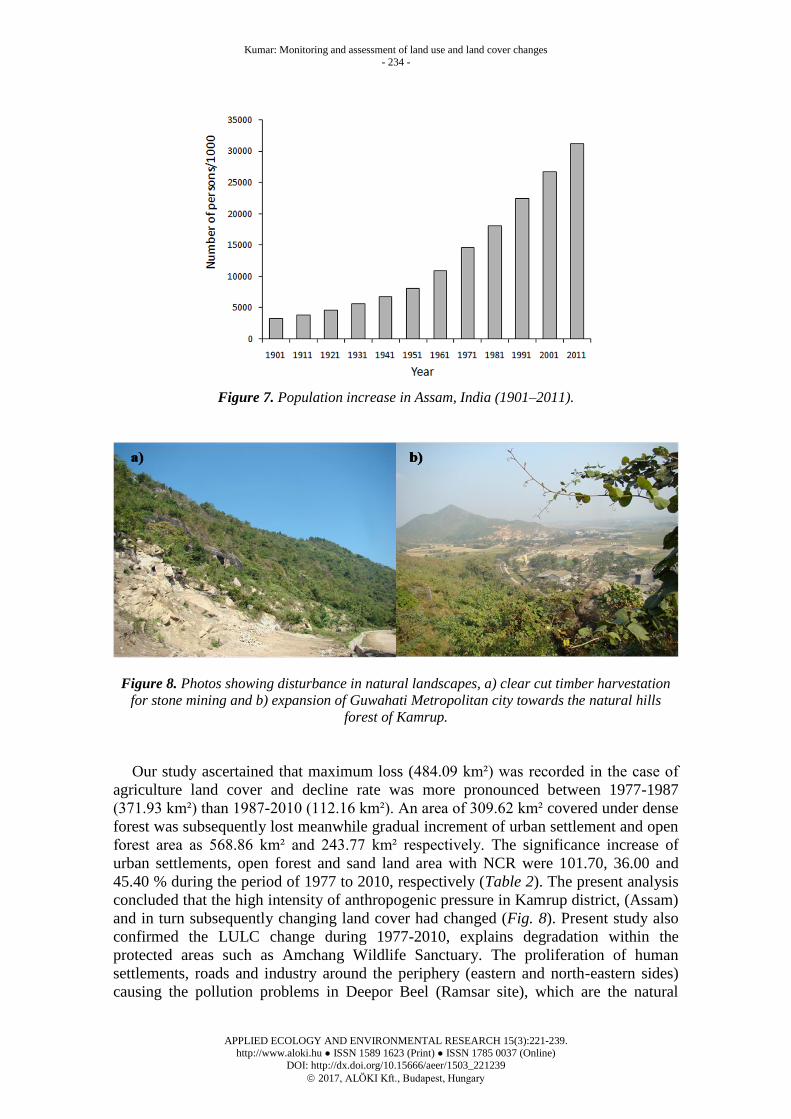
showed continuous increase (Fig. 7). This rapid immigration in Kamrup district resulted
in the rapid loss of dense forest area to cope up with the demand for basic needs of the
expanding population. Initially people cleared the forest for settlement and other
purpose, and in recently started expanding the area for agriculture purpose too. Overall
the settlement and open forest areas increased 568.89 km2 and 243.77 km
2 from 1977
to 2010, with corresponding decrease in dense forest and agriculture area 309.62 km2
and 484.09 km2 respectively. The 2011 year census of this district reported a hike
density of population from 460 (person per km2) in 1991 to 604 in 2011. The rise in
population density led to higher consumption of resources per capita and the increased
need for built environment (Rajesh and Prasad, 2005; Prasad et al., 2010).
Table 6. Comparison of Decadal percentage variation of population in different year
(Source: Census of India, 2011)
Decadal Percentage Variation of Population in different year
1901/11 1911/21 1921/31 1931/41 1941/51 1951/61 1961/71 1971/99 1999/2001 2001/11
Assam 16.99 20.48 19.91 20.40 19.93 34.98 34.95 53.26 18.92 16.93
Kamrup 11.10 7.06 9.38 19.21 17.17 37.73 38.80 65.72 26.11 17.13
Kumar: Monitoring and assessment of land use and land cover changes
- 234 -
APPLIED ECOLOGY AND ENVIRONMENTAL RESEARCH 15(3):221-239.
http://www.aloki.hu ● ISSN 1589 1623 (Print) ● ISSN 1785 0037 (Online)
DOI: http://dx.doi.org/10.15666/aeer/1503_221239
2017, ALÖKI Kft., Budapest, Hungary
Figure 7. Population increase in Assam, India (1901–2011).
Figure 8. Photos showing disturbance in natural landscapes, a) clear cut timber harvestation
for stone mining and b) expansion of Guwahati Metropolitan city towards the natural hills
forest of Kamrup.
Our study ascertained that maximum loss (484.09 km²) was recorded in the case of
agriculture land cover and decline rate was more pronounced between 1977-1987
(371.93 km²) than 1987-2010 (112.16 km²). An area of 309.62 km² covered under dense
forest was subsequently lost meanwhile gradual increment of urban settlement and open
forest area as 568.86 km² and 243.77 km² respectively. The significance increase of
urban settlements, open forest and sand land area with NCR were 101.70, 36.00 and
45.40 % during the period of 1977 to 2010, respectively (Table 2). The present analysis
concluded that the high intensity of anthropogenic pressure in Kamrup district, (Assam)
and in turn subsequently changing land cover had changed (Fig. 8). Present study also
confirmed the LULC change during 1977-2010, explains degradation within the
protected areas such as Amchang Wildlife Sanctuary. The proliferation of human
settlements, roads and industry around the periphery (eastern and north-eastern sides)
causing the pollution problems in Deepor Beel (Ramsar site), which are the natural

Kumar: Monitoring and assessment of land use and land cover changes
- 235 -
APPLIED ECOLOGY AND ENVIRONMENTAL RESEARCH 15(3):221-239.
http://www.aloki.hu ● ISSN 1589 1623 (Print) ● ISSN 1785 0037 (Online)
DOI: http://dx.doi.org/10.15666/aeer/1503_221239
2017, ALÖKI Kft., Budapest, Hungary
inhabitant of many important birds species and Asian elephants. A present trend of
deforestation and anthropogenic activities has been reached at alarming condition and
there by leading to the losses of forest cover. Near issues suggests the urgent need of
monitoring the change of vegetation, land use and current status of all forest in
protected areas of India to met the challenge for effective management and implication
of refined conservation strategies.
Conclusions
The present study highlights the changes in LULC, based on the Landsat temporal
remote sensed images of the year 1977, 1987 and 2010, using remote sensing and GIS
techniques. During the span of 34 years, dense forest and agriculture land acreage
decreased notably. Open forest and urban settlement land acreage however increased
significantly. The changes in area of dense forest in different LULC categories viz.,
open forest and settlement in a form of lesser vegetation caused degradation of natural
forests. The Shannon-Weaver diversity index and the extent of landscape heterogeneity
have changed significantly. Anthropogenic impact factors, such as excessive
deforestation, encroachment, human settlement, grazing, timber harvestation and
overexploitation of natural resources accelerated the deterioration of local environment
in the Kamrup district of Assam, India. Therefore, a perspective measure has to be taken
and future research work is required to avoid the loss of forest area in future.
Acknowledgements. The facilities provided by the Director, G.B. Pant National Institute of Himalayan
Environment and Sustainable Development, Almora, Uttarakhand are gratefully acknowledged. The
author would like to also thank the Assam Forest Department, Government of Assam, Guwahati for
providing permission to access the site.
REFERENCES
[1] Ardi, E.R., Wolff, M. (2009): Land use and land cover change affecting habitat
distribution in the Segara Anakan Lagoon, Java, Indonesia. - Regional Environmental
Change 9: 235-243.
[2] Armenteras, D., Rudas, G., Rodriguez, N., Sua, S., Romero, M. (2006): Pattern and cause
of deforestation in Colmbian Amazon. - Ecological Indicator 6: 353-368.
[3] Behera, M.D., Kushwaha, S.P.S., Roy, P.S. (2005): Rapid assessment of biological
richness in a part of Eastern Himalaya: An integrated three-tier approach. - Forest
Ecology and Management 207: 363-384.
[4] Bhat, D.M., Naik, M.B., Patagar, S.G. (2000): Forest dynamics in tropical rain forests of
Uttara Kannda district in Western Ghats, India. - Current Science 79: 975-985.
[5] Boakye, E., Odai, S.N., Adjei, K.A., Annor, F.O. (2008): Landsat images for assessment
of the impact of Land use changes on the Barekese catchment in Ghana. - European
Journal of Scientific Research 22: 269-278.
[6] Boettinger, J.L., Ramsey, R.D., Bodily, J.M., Cole, N.J., Kienast-Brown, S., Nield, S.J.,
Saunders, A.M., Stum, A.K. (2008): Landsat Spectral Data for Digital Soil Mapping.
pp.193-202. In: Hartemink, A.E., McBratney, A.B., Mendonca Santos, M.L. (eds.)
Digital Soil Mapping with Limited Data.,. Springer, Netherlands.
[7] Boyd, D.S., Danson, F.M. (2005): Satellite remote sensing of forest resources: three
decades of research development. - Progress in Physical Geography 29: 1-26.

Kumar: Monitoring and assessment of land use and land cover changes
- 236 -
APPLIED ECOLOGY AND ENVIRONMENTAL RESEARCH 15(3):221-239.
http://www.aloki.hu ● ISSN 1589 1623 (Print) ● ISSN 1785 0037 (Online)
DOI: http://dx.doi.org/10.15666/aeer/1503_221239
2017, ALÖKI Kft., Budapest, Hungary
[8] Chauhan, H.B., Nayak, S. (2005): Land use/landcover change near Hazaria region,
Gujarat using remote sensing satellite data. - Journal of the Indian Society of Remote
Sensing 33: 413-420.
[9] Coskun, G.H., Alganci, U., Usta, G. (2008): Analysis of land use change and urbanization
in the Kucukcekmece Water basin (Istanbul, Turkey) with temporal satellite data using
remote sensing and GIS. - Sensors 8: 7213-7223.
[10] Curran, L., Trigg, S.N., McDonald, A.K., Astiani, D., Hardiono, Y.M., Siregar, P.,
Caniago, I., Kasiscke, E. (2004): Lowland forest loss in protected areas of Indonesian
Borneo. - Science 303: 1000-1003.
[11] De Moraes, J.F.L., Seyler, F., Cerri, C.C., Volkoff, B. (1998): Land cover mapping and
carbon pool estimates in Rondonia, Brazil. - International Journal of Remote Sensing 19:
921-934.
[12] DeFries, R.S., Hansen, A., Newton, A.C., Hansen, M.C. (2004): Global land cover
classifications at 8 km spatial resolution: the use of training data derived from Landsat
Imagery in decision tree classifier. - International Journal of Remote Sensing 19: 3141-
3168.
[13] Derry, A.M., Staddon, W.J. and Trevores, J.T. (1998): Functional diversity and
community structure of microorganisms in uncontaminated and creosote-contaminated
soils as determined by sole-carbon-source utilization. - World Journal of Microbiology
& Biotechnology 14: 571-578.
[14] Dewan, A.M., Yamaguchi, Y. (2009): Using remote sensing and GIS to detect and
monitor land use and land cover change in Dhaka metropolitan of Bangladesh during
1960-2005. - Environmental Monitoring and Assessment 150: 237-249.
[15] Dong, L., Wang, W., Ma, M., Kong, J., Veroustraete, F. (2010): The change of land cover
and land use and its impact factor in upriver key regions of the Yellow river. -
International Journal of Remote Sensing 30: 1251-1265.
[16] Fan, F., Weng, Q., Wang, Y. (2007): Land use and land cover changes in Guangzhou,
China, from1998 to 2003, based on Landsat TM /ETM+ Imagery. - Sensors 7: 1323-
1342.
[17] FAO. (2004): FAOSTAT Database Results. - Food and Agriculture Organization of the
United Nations, Rome, Italy.
[18] Fazal, S. (2000): Urban expansion and loss of agricultural land - a GIS based study of
Saharanpur City, India. - Environmental Urbanization 12: 133-149.
[19] Fearnside, P.M. (2001): Global warming and tropical land-use change: Greenhouse gas
emissions from biomass burning, decomposition and soils in forest conversion, shifting
cultivation and secondary vegetation. - Climate Change 46: 115-158.
[20] Feeley, K.J., Gillespie, T.W., Trborgh, J.W. (2005): The utility of spectral indices from
Landsat ETM+ for Measuring the Structure and Composition of Tropical Dry Forests. -
Biotropica 37: 508-519.
[21] Fuller, R., Groom, G.B., Mugisha, S., Ipulet, P., Pomeror, D., Katende, A., Bailey, R.,
Ogutu-Ohwaya, R. (1998): The integration of field survey and remote sensing for
biodiversity assessment: a case study in the tropical forests and wetlands of Sano Bay,
Uganda. - Biological Conservation 86: 379-391.
[22] Giriraj, A., Irfan-Ullah, M., Murthy, M.S.R., Beierkuhnlein, C. (2008): Modelling spatial
and temporal forest cover change patterns (1973-2020): A case study from south Western
Ghats (India). - Sensor 8: 6132-6153.
[23] Granados-Ramirez, R., Galindo-Mendoza, M.G., Contreras-Servin, C., Hernandez-Cerda,
M.E., Valdez-Medero, G. (2008): Monitoring land cover and land use using NOAA-
AVHRR data in the Husteca Potosina, Mexico. - Gecarto International 23: 273-285.
[24] Güler, M., Yomrahoğlu, T., Reis, S. (2007): Using landsat data to determine land
use/land cover changes in Samsun, Turkey. - Environmental Monitoring and Assessment
127: 155-167.

Kumar: Monitoring and assessment of land use and land cover changes
- 237 -
APPLIED ECOLOGY AND ENVIRONMENTAL RESEARCH 15(3):221-239.
http://www.aloki.hu ● ISSN 1589 1623 (Print) ● ISSN 1785 0037 (Online)
DOI: http://dx.doi.org/10.15666/aeer/1503_221239
2017, ALÖKI Kft., Budapest, Hungary
[25] Hall, G.F., Strebel, D.E., Sellers, P.J. (1988): Linking knowledge among spatial scales:
vegetation, atmosphere, climate and remote sensing. - Landscape Ecology 2: 3-22.
[26] Hashiba, H., Kameda, K., Uesugi, S., Tanaka, S. (2000): Land use change analysis of
Tama River Basin with different spatial resolution sensor data by Landsat MSS and TM. -
Advances in Space Research 26: 1069-1073.
[27] Herold, M., Golstein, N.C., Clarke, K.C. (2003): The satiotemporal form of urban
growth: measurement, analysis and modeling. - Remote Sensing of Environment 86:
286-302.
[28] Hill, R.A. (1999): Image segmentation for humid tropical forest classification in Landsat
TM data. - International Journal of Remote Sensing 20: 1039-1044.
[29] Hu, D., Yang, G., Wu, Q., Li, H., Liu, X., Niu, X., Wang, Z., Wang, Q. (2008):
Analyzing land use changes in the Meteropolitan city of Northeastern China using remote
sensing and GIS. - Sensors 8: 5449-5465.
[30] IIRS. (2002): Biodiversity characterization at landscape level in eastern Himalayas using
remote sensing and geographical information system. - Indian Institute of Remote
sensing, National Remote Sensing Agency, Department of Space, Government of India,
Dehra Dun. Pp. 296.
[31] IUSS Working Group WRB. (2014): World Reference Base for soil resources
2014. International soil classification system for naming soils and creating legends for
soil maps. - World Soil Resources Reports, (106), 191.
[32] Iverson, L.R., Graham, R.L., Cook, E.A. (1989): Application of satellite remote sensing
to forested ecosystems. - Landscape Ecology 3: 131-143.
[33] Jat, M.K., Garg, P.K., Khare, D. (2008): Monitoring and modeling of urban sprawl using
remote sensing and GIS techniques. - International Journal of Applied Earth
Observation and Geoinformation 10: 26-43.
[34] Jayakumar, S., Ramachandram, A., Bhaskaram, G., Heo, J. (2009): Forest dynamics in
Eastern Ghats of Tamilnadu, India. - Environmental Management 43: 326-345.
[35] Jha, C.S., Goparaju, L., Tripathi, A., Gharai, B., Raghubanshi, A.S., Singh, J.S. (2006):
Forest fragmentation and its impact on species diversity: an analysis using remote sensing
and GIS. - Biodiversity and Conservation 14: 1681-1698.
[36] Kamusoko, C., Aniya, M. (2009): Hybrid classification of Landsat data and GIS for land
use/cover change analysis of the Bindura district, Zimbabwe. - International Journal of
Remote Sensing 30: 97-115.
[37] Kasperson, J.W., Kasperson, R.E., Turner, B.L. (1995): Region at risk: Comparisons of
threatened environments. - United Nations University Press, Tokyo.
[38] Kilic, S., Evrendilck, F., Berberoglu, S., Demirkesen, A. (2004): Environment monitoring
of land-use and land-cover changes in Amik Plain, Turkey. - In Geo-Imagery Bridying
Continents XXth ISPRS Congress, Istanbul, Turkey, 2004.
[39] Krishnaswamy, J., Kiran, M.C., Ganeshaiah, K.N. (2004): Tree model based eco-climatic
vegetation classification and fuzzy mapping in diverse tropical deciduous ecosystems
using multi-season NDVI. - Remote Sensing of Environment 25: 1185-1205.
[40] Kumar, A., Uniyal, S.K., Lal, B. (2007): Stratification of forest density and its validation
by NDVI analysis in a part of western Himalaya, India using Remote sensing and GIS
techniques. - International Journal of Remote Sensing 28: 2485-2495.
[41] Kumar, D. (2011): Monitoring Forest Cover Change Using Remote Sensing and GIS: A
Global Prospective. - Research Journal of Environmental Sciences 5: 105-123.
[42] Lambin, E.F., Geist, H.J., Lepers, E. (2003): Dynamics of land use and land cover change
in tropical and subtropical regions. - Annual Review of Environment and Resources
28: 205-241.
[43] Lausia, J.M.J., Antonio, D.G. (2001): Parametric land cover and land use classification as
tools for environmental change detection. - Agriculture, Ecosystems & Environment 91: 89-100.

Kumar: Monitoring and assessment of land use and land cover changes
- 238 -
APPLIED ECOLOGY AND ENVIRONMENTAL RESEARCH 15(3):221-239.
http://www.aloki.hu ● ISSN 1589 1623 (Print) ● ISSN 1785 0037 (Online)
DOI: http://dx.doi.org/10.15666/aeer/1503_221239
2017, ALÖKI Kft., Budapest, Hungary
[44] Lele, N., Joshi, P.K. (2009): Analyzing deforestation rates, spatial forest cover changes
and identifying critical areas of forest cover changes in North-East India during 1972–
1999. - Environmental Monitoring and Assessment 156: 159-170.
[45] Lillesand, T.M., Kiefer, R.W. (1999): Remote sensing and image interpretation. - John
Wiley and Sons, New York.
[46] Liu, J.Y., Liu, M.L., Zhuang, D.F., Zhang, Z.X., Deng, X.Z. (2003): Study on spatial
pattern of land-use change in China during 1995-2000. - Science in China Series D 46:
373-378.
[47] Lo, C.P., Choi, J. (2004): A hybrid approach to urban land use/cover mapping using
Landsat 7 enhanced thematic mapper plus (ETM+) images. - International Journal of
Remote Sensing 25: 2687-2700.
[48] Malaviya, S., Munsi, M., Oinam, G., Joshi, P.K. (2009): Landscape approach for
quantifying land use land cover (1972-2006) and habitat diversity in a mining area in
Central India (Bokaro, Jharkhand). - Environmental Monitoring and Assessment DOI:
10.1007/s10661-009-1227-8.
[49] Mas, J.F. (1999): Monitoring land-cover changes: a comparison of change detection
techniques. - International Journal of Remote Sensing 20: 139-152.
[50] MEA. (2003): Ecosystem and human well-being: A framework for assessment.
Millennium Ecosystem Assessment. - Island Press, Washington D.C. pp. 245.
[51] Merem, E.C., Twumasi, Y.A. (2007): Using GIS and Remote Sensing in the analysis of
the ecosystem decline along the river Niger Basin: The case of the Mali and Niger. -
International Journal of Environmental Research and Public Health 4(2): 173-184.
[52] Noss, R.F. (2001): Beyond Kyto: Forest management in a time of rapid climate change. -
Conservation Biology 15: 578-590.
[53] Onur, I., Maktav, D., Sari, M., Sonmez, N.K. (2009): Change detection of land cover and
land use using remote sensing and GIS: a case study in Kemer, Turkey. - International
Journal of Remote Sensing 30: 1749-1757.
[54] Oza, M.P., Srivastava, V.K., Devaiah, P.K. (1996): Estimating tree volume in tropical dry
deciduous forest from Landsat TM data. - Geocarto International 11: 33-39.
[55] Prakash, A., Gupta, R.P. (1998): Land-use mapping and change detection in a coal
mining area, a case study in the Jharia coalfield, India. - International Journal of Remote
Sensing 19: 391-410.
[56] Prasad, P.R.C., Rajan, K.S., Dutt, C.B.S., Roy, P.S. (2010): A conceptual framework to
analyse the land-use/ land-cover changes and its impact on phytodiversity: a case study of
North Andaman Islands, India. - Biodiversity and Conservation DOI 10.1007/s10531-
010-9880-3.
[57] Rajesh, P., Prasad, B.V.R. (2005): Built environment in the Andaman and Nicobar
Islands: a tradition on the brink of disappearance. - Anthropologist 7: 205–207.
[58] Rao, K.S., Pand, R. (2001): Land use dynamics and landscape change pattern in a typical
micro watershed in the mid elevation zone of central Himalaya, India. - Agriculture,
Ecosystems & Environment 86: 113-123.
[59] Rodgers, W.A., Panwar, H.S. (1988): Biogeographical classification of India. Wildlife
Institute of India, Dehradun.
[60] Rogan, J., Chen, D. (2004): Remote sensing technology for mapping and monitoring land
cover and land-use change. - Progressive Planning 61: 301-325.
[61] Roughgarden, J., Running, S.W., Matson, P.A. (1991): What does remote sensing do for
ecology?. - Ecology 72: 1981-1922.
[62] Samant, H.P., Subramanyam, V. (1998): Landuse/land cover changes in Mumbabi-Navi
Mumbai cities and its effect on the drainage basins and channels-a case using GIS. -
Journal of the Indian Society of Remote Sensing 26: 1-6.
[63] Sanchez-Azofeia, G.A., Castro, K.L., Rivard, B., Kalascka, M.R., Harris, R.C. (2003):
Remote sensing priorities in tropical dry forest environments. - Biotropica 35: 134-142.

Kumar: Monitoring and assessment of land use and land cover changes
- 239 -
APPLIED ECOLOGY AND ENVIRONMENTAL RESEARCH 15(3):221-239.
http://www.aloki.hu ● ISSN 1589 1623 (Print) ● ISSN 1785 0037 (Online)
DOI: http://dx.doi.org/10.15666/aeer/1503_221239
2017, ALÖKI Kft., Budapest, Hungary
[64] Shamsudheen, M., Dasog, G.S., Tejaswini, N.B. (2005): Land use/land cover mapping in
the coastal area of north Karnataka using remote sensing data. - Journal of the Indian
Society of Remote Sensing 33: 253-257.
[65] Sherbinin, A., Carr, D., Cassels, S., Jiang, L. (2007): Population and environment. -
Annual Review of Environment and Resources 32: 5.1-5.29.
[66] SOE. (2004): State of Environment Assam-2004. State of Environment. - Assam Science
Technology and Environment Council, Guwahati, India.
[67] Srivastava, S., Singh, T.P., Singh, H., Kushwaha, S.P.S., Roy, P.S. (2002): Assessment of
large-scale deforestation in Sonitpur district of Assam. - Current Science 82: 1497-1484.
[68] Stebbing, E.P. 1992. The Forests of India (Vol. I). - John Lane/The Bodley Head Limited,
London.
[69] Turner, B.L., Kasperson, R.E., Matson, P.A., McCarthy, J.J., Corell, R.W., Christensen,
L., Eckley, N., Kasperson, J.X., Luers, A., Martello, M.L., Polsky, C., Pulsipher, A.,
Schiller, A. (2003): A framework for vulnerability analysis in sustainability science. -
Proceedings of the National Academy of Sciences USA 100(14): 8074-8079.
[70] Weng, Q.H. (2002): Land use changes analysis in the Zhujiang Delta of China using
satellite remote sensing, GIS and stochastic modeling. - Journal of Environmental
Management 64: 273-284.
[71] Wood, C.H., Skole, D.L. (1998): Linking satellite census, and survey data to study
deforestation in the Brazilian Amazon. pp.70-93. In: Liverman, D., Moran, E. F.,
Rindfuss, R.R. and Stern, P.C. (eds.) People and pixel: Linking remote sensing and social
science., National Academy Press, Wasington, D.C.
[72] Yu, H., Joshi, P.K., Das, K.K., Chauniyal, D.D., Melick, D.R., Yang, X., Xu, J. (2007):
Land use/cover change and environmental vulnerability analysis in Birahi Ganga sub-
watershed of the Garhwal Himalaya, India. - Tropical Ecology 48: 241-250.
[73] Zeng, X., Dickinson, R.E., Walker, A., Shaikh, M., DeFries, R.S., Qi, J. (2000):
Derivation and evaluation of global 1-km fractional vegetation cover data for land
modeling. - Journal of Applied Meteorology 39: 826-839.
[74] Zhu, H.Y., Li, X.B., He, S.J., Zhang, M. (2001): Land use change in Bohai Rim: a
spatial-temporal analysis. - Journal of Geographical Sciences 11: 305-312.