Embed Size (px)
Citation preview
Monetary Policy Update
September 2012
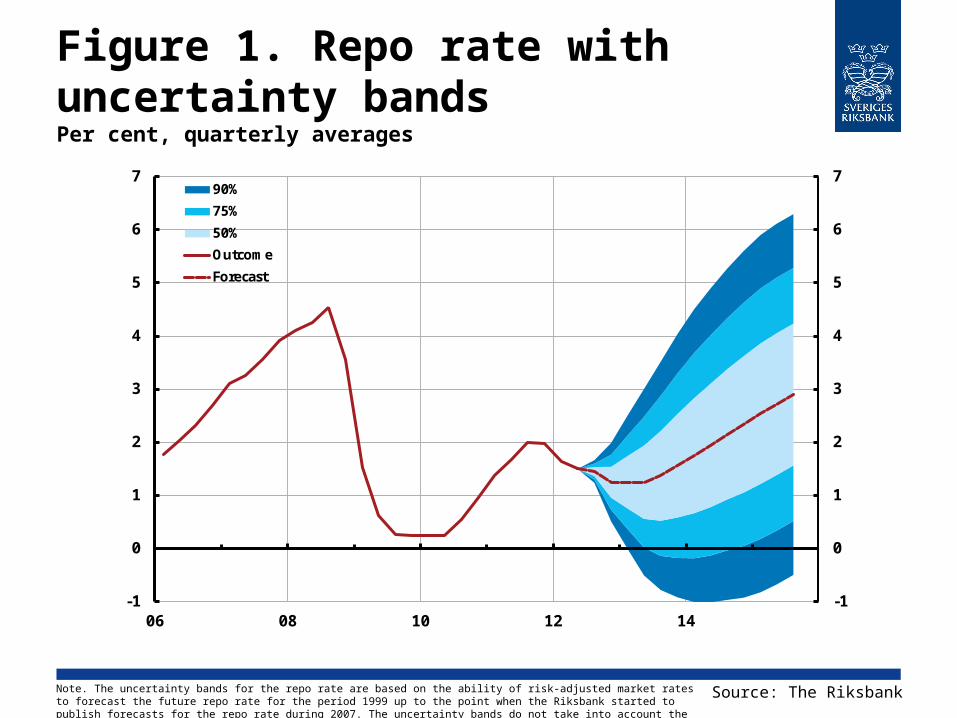
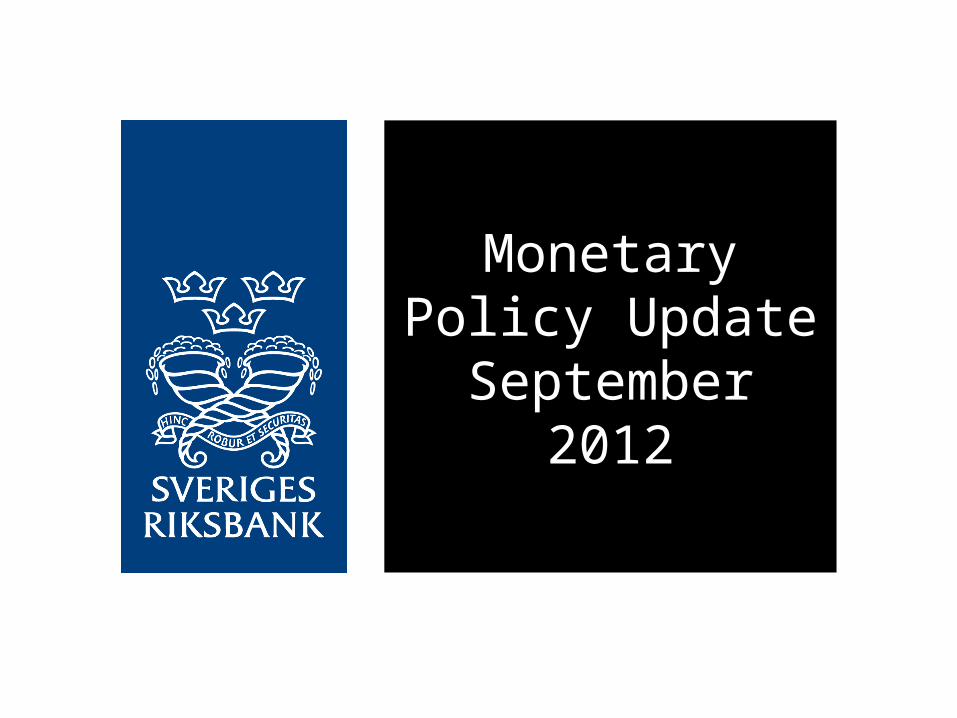
Figure 1. Repo rate with uncertainty bandsPer cent, quarterly averages
Source: The RiksbankNote. The uncertainty bands for the repo rate are based on the ability of risk-adjusted market rates to forecast the future repo rate for the period 1999 up to the point when the Riksbank started to publish forecasts for the repo rate during 2007. The uncertainty bands do not take into account the fact that there may be a lower bound for the repo rate.
-1
0
1
2
3
4
5
6
7
-1
0
1
2
3
4
5
6
7
06 08 10 12 14
90%
75%
50%
Outcome
Forecast
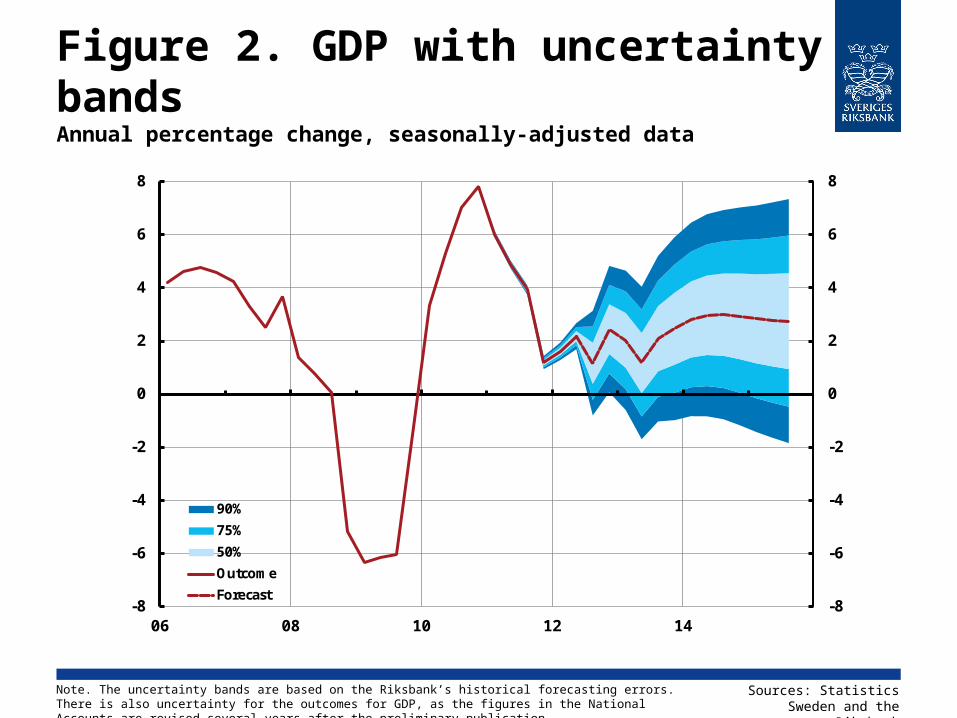
Figure 2. GDP with uncertainty bandsAnnual percentage change, seasonally-adjusted data
Sources: Statistics Sweden and the
Riksbank
Note. The uncertainty bands are based on the Riksbank’s historical forecasting errors. There is also uncertainty for the outcomes for GDP, as the figures in the National Accounts are revised several years after the preliminary publication.
-8
-6
-4
-2
0
2
4
6
8
-8
-6
-4
-2
0
2
4
6
8
06 08 10 12 14
90%
75%
50%
Outcome
Forecast

Figure 3. CPI with uncertainty bandsAnnual percentage change
Sources: Statistics Sweden and the Riksbank
Note. The uncertainty bands are based on the Riksbank’s historical forecasting errors.
-2
-1
0
1
2
3
4
5
6
-2
-1
0
1
2
3
4
5
6
06 08 10 12 14
90%
75%
50%
Outcome
Forecast
Figure 4. CPIF with uncertainty bandsAnnual percentage change
Sources: Statistics Sweden and the Riksbank
Note. The uncertainty bands are based on the Riksbank’s historical forecasting errors. The CPIF is the CPI with a fixed mortgage rate.
0
1
2
3
4
0
1
2
3
4
06 08 10 12 14
90%
75%
50%
Outcome
Forecast

Figure 5. Repo ratePer cent, quarterly averages
0
1
2
3
4
5
0
1
2
3
4
5
06 08 10 12 14
July
September
Source: The Riksbank
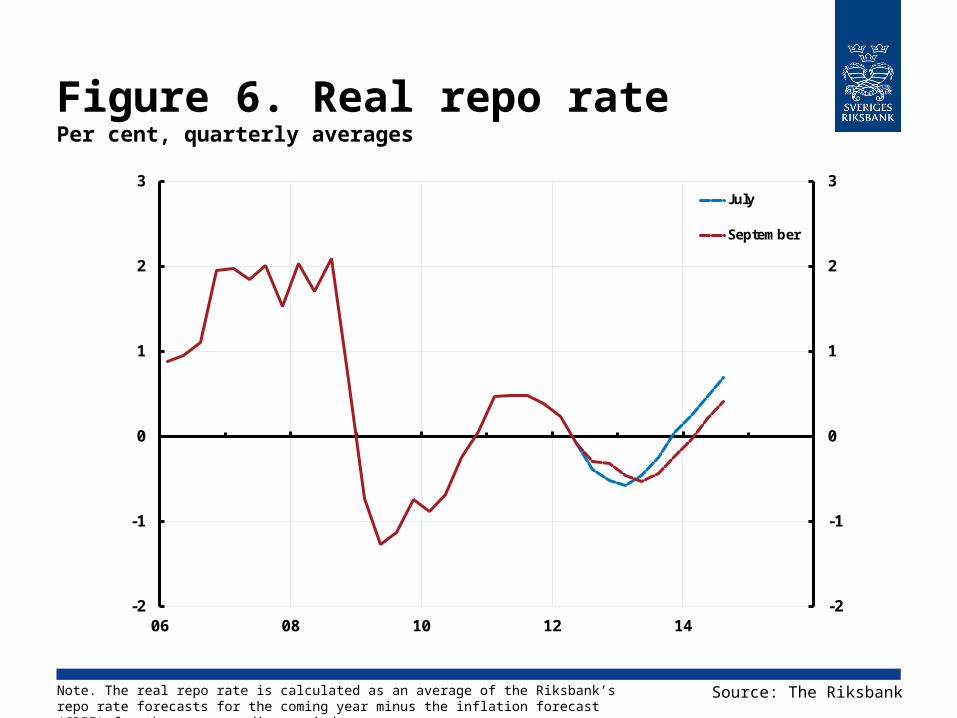
Figure 6. Real repo ratePer cent, quarterly averages
-2
-1
0
1
2
3
-2
-1
0
1
2
3
06 08 10 12 14
July
September
Source: The RiksbankNote. The real repo rate is calculated as an average of the Riksbank’s repo rate forecasts for the coming year minus the inflation forecast (CPIF) for the corresponding period.

Figure 7. GDPQuarterly changes in per cent calculated in annualised terms, seasonally-adjusted data
-16
-12
-8
-4
0
4
8
12
-16
-12
-8
-4
0
4
8
12
06 08 10 12 14
July
September
Sources: Statistics Sweden and the Riksbank
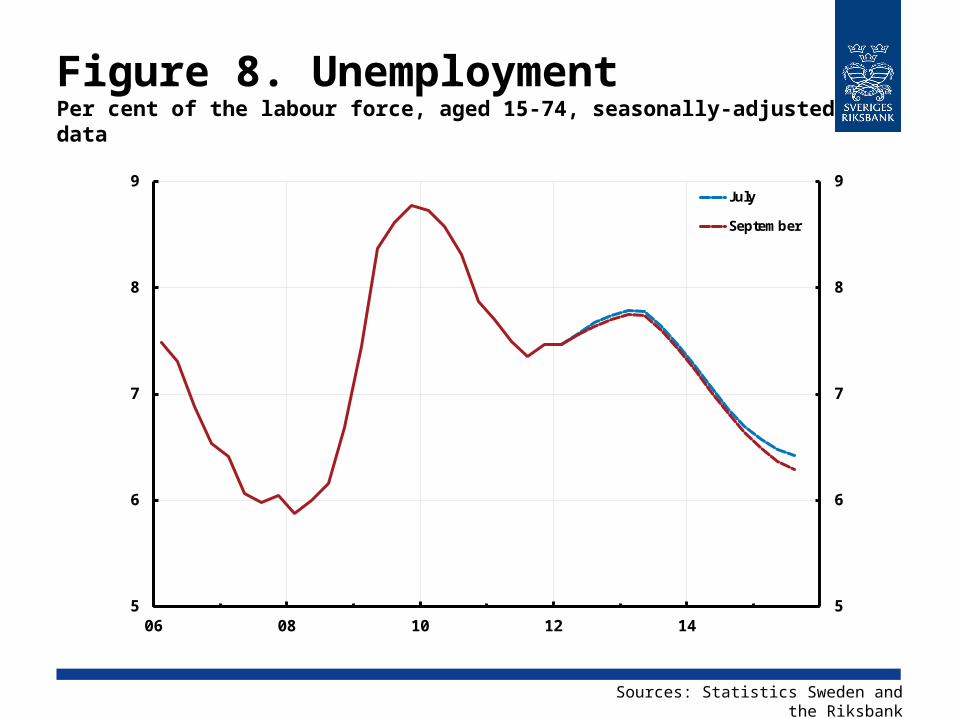
Figure 8. UnemploymentPer cent of the labour force, aged 15-74, seasonally-adjusted data
5
6
7
8
9
5
6
7
8
9
06 08 10 12 14
July
September
Sources: Statistics Sweden and the Riksbank
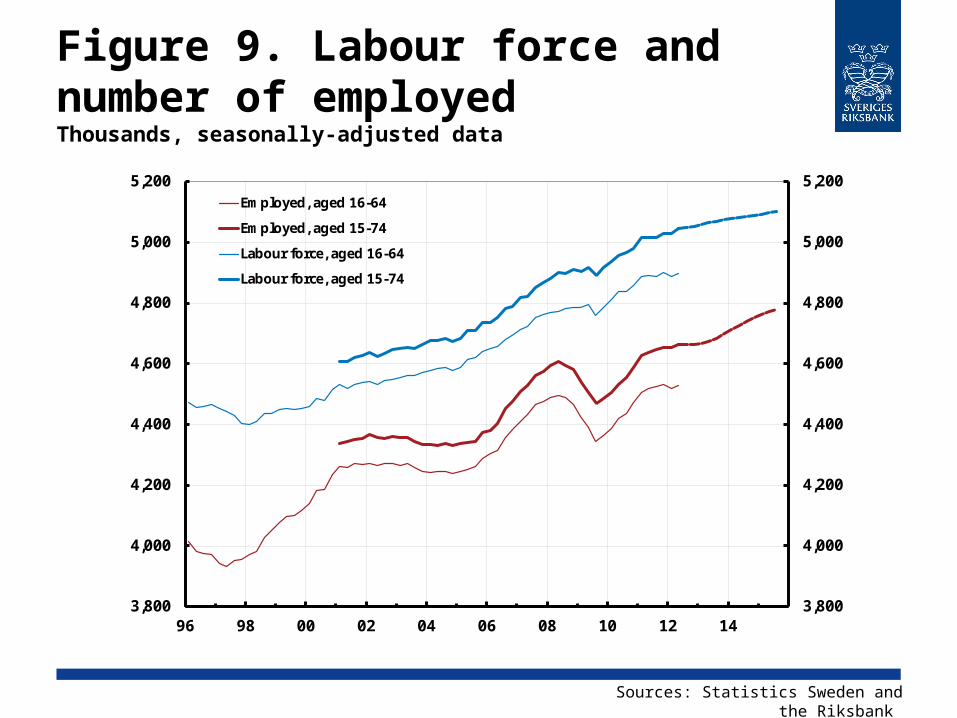
Figure 9. Labour force and number of employedThousands, seasonally-adjusted data
Sources: Statistics Sweden and the Riksbank
3,800
4,000
4,200
4,400
4,600
4,800
5,000
5,200
3,800
4,000
4,200
4,400
4,600
4,800
5,000
5,200
96 98 00 02 04 06 08 10 12 14
Employed, aged 16-64
Employed, aged 15-74
Labour force, aged 16-64
Labour force, aged 15-74
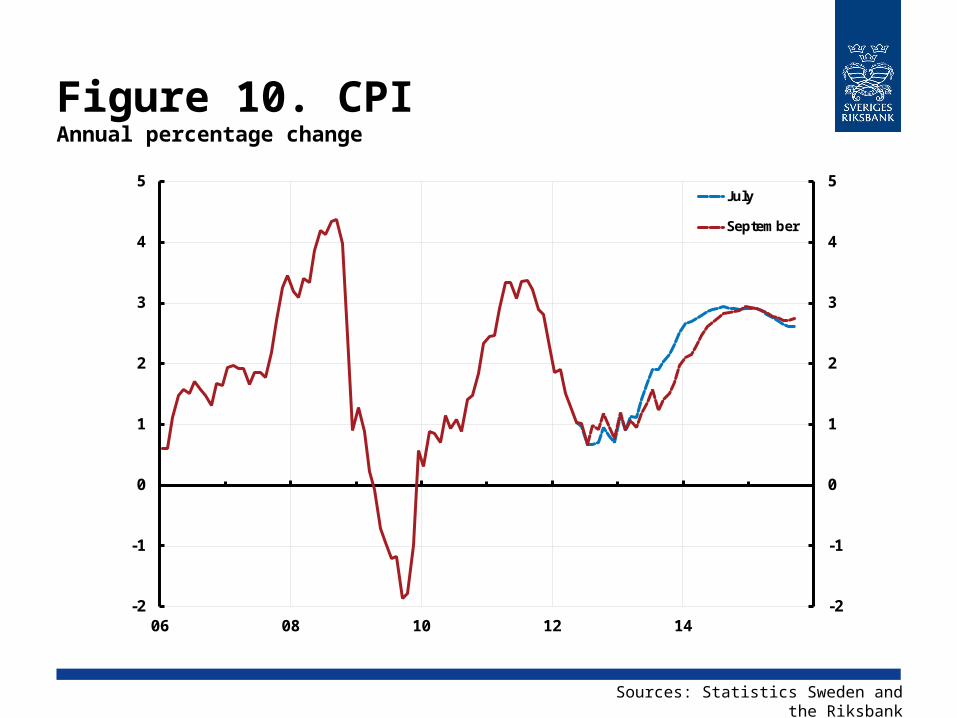
Figure 10. CPIAnnual percentage change
-2
-1
0
1
2
3
4
5
-2
-1
0
1
2
3
4
5
06 08 10 12 14
July
September
Sources: Statistics Sweden and the Riksbank

Figure 11. CPIFAnnual percentage change
Sources: Statistics Sweden and the Riksbank
Note. The CPIF is the CPI with a fixed mortgage rate.
0
1
2
3
4
0
1
2
3
4
06 08 10 12 14
July
September

Figure 12. CPIF excluding energyAnnual percentage change
Sources: Statistics Sweden and the Riksbank
Note. The CPIF is the CPI with a fixed mortgage rate.
0
1
2
3
0
1
2
3
06 08 10 12 14
July
September
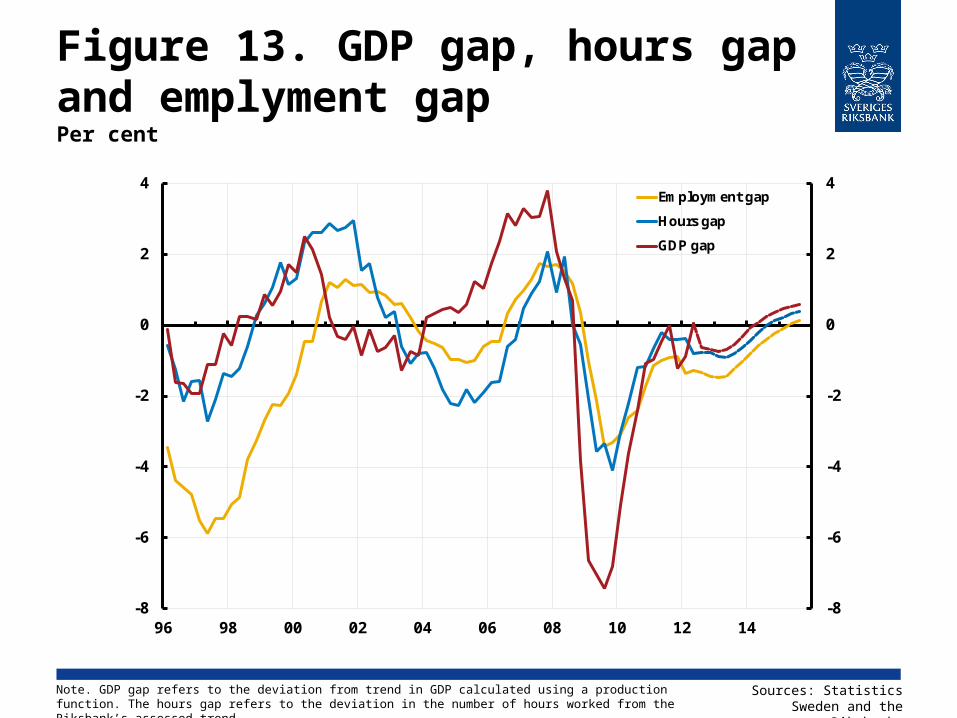
Figure 13. GDP gap, hours gap and emplyment gapPer cent
-8
-6
-4
-2
0
2
4
-8
-6
-4
-2
0
2
4
96 98 00 02 04 06 08 10 12 14
Employment gap
Hours gap
GDP gap
Sources: Statistics Sweden and the
Riksbank
Note. GDP gap refers to the deviation from trend in GDP calculated using a production function. The hours gap refers to the deviation in the number of hours worked from the Riksbank’s assessed trend.
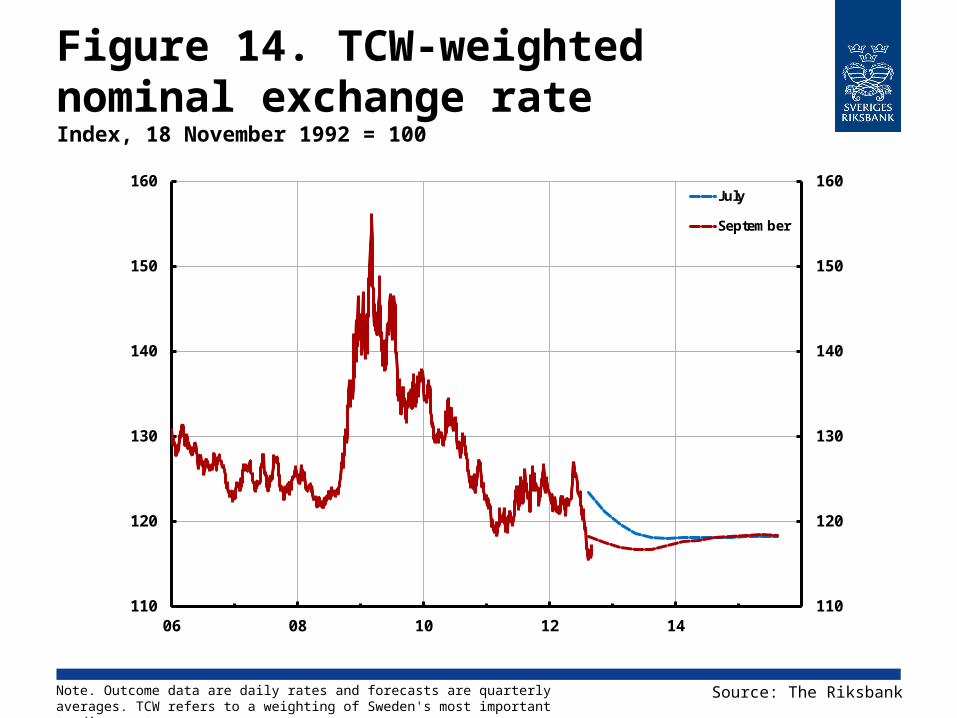
Figure 14. TCW-weighted nominal exchange rate Index, 18 November 1992 = 100
110
120
130
140
150
160
110
120
130
140
150
160
06 08 10 12 14
July
September
Source: The RiksbankNote. Outcome data are daily rates and forecasts are quarterly averages. TCW refers to a weighting of Sweden's most important trading partners.

Figure 15. Oil price, Brent crudeUSD per barrel
40
60
80
100
120
140
40
60
80
100
120
140
06 08 10 12 14
Outcome
Futures, average up to and including 3 July 2012
Futures, average up to and including 31 August 2012
Sources: Intercontinental Exchange and the Riksbank
Note. Futures are calculated as a 15-day average. Outcomes represent monthly averages of spot prices.
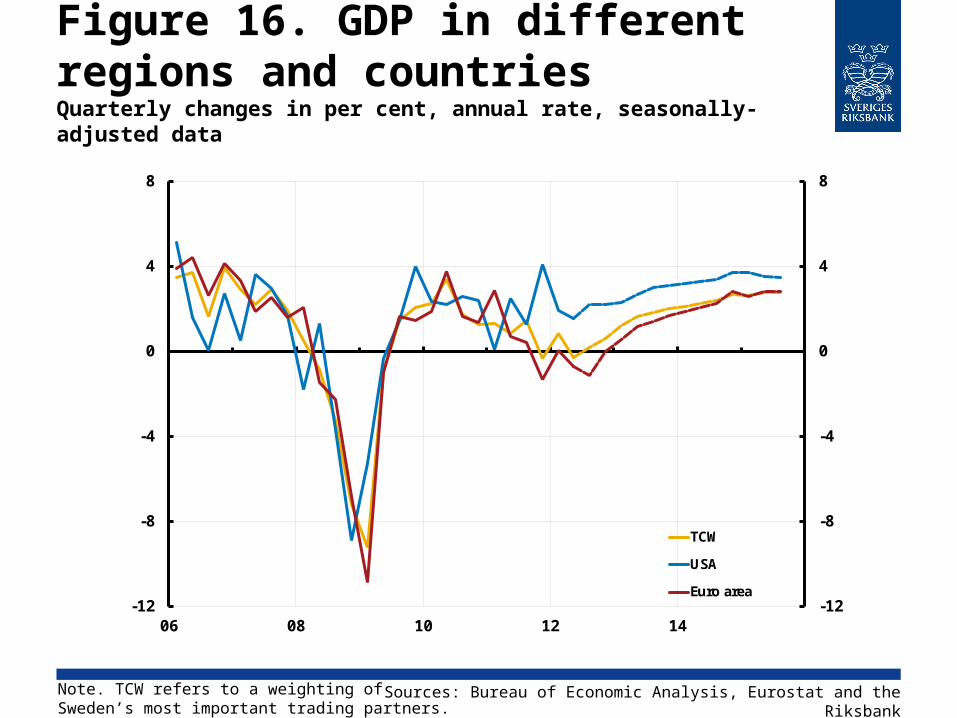
Figure 16. GDP in different regions and countriesQuarterly changes in per cent, annual rate, seasonally-adjusted data
-12
-8
-4
0
4
8
-12
-8
-4
0
4
8
06 08 10 12 14
TCW
USA
Euro area
Sources: Bureau of Economic Analysis, Eurostat and the Riksbank
Note. TCW refers to a weighting of Sweden’s most important trading partners.
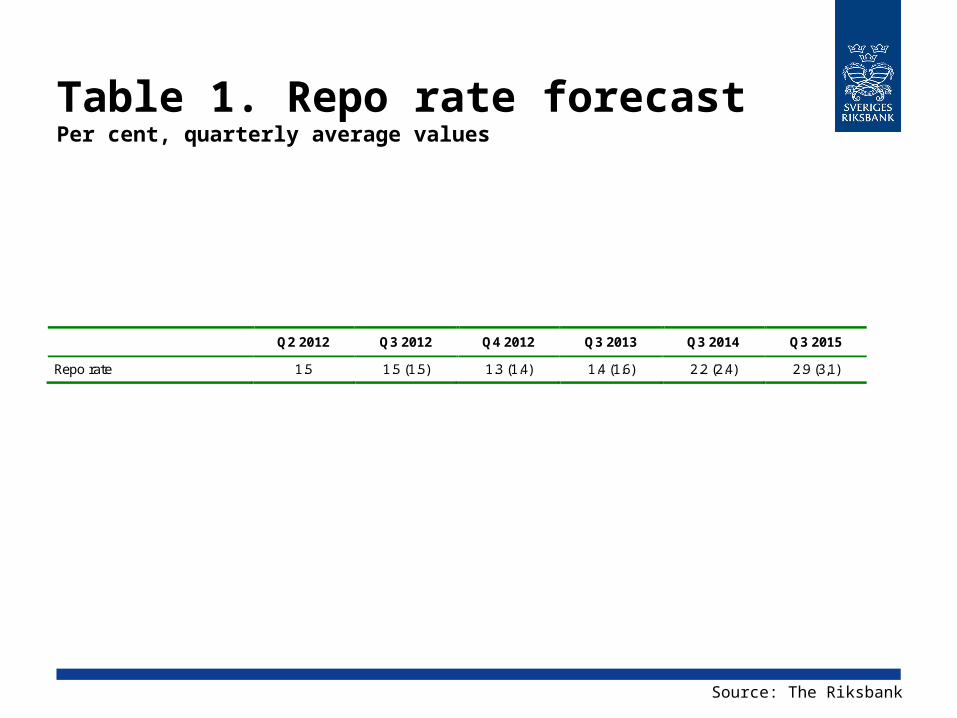
Table 1. Repo rate forecastPer cent, quarterly average values
Source: The Riksbank
Q2 2012 Q3 2012 Q4 2012 Q3 2013 Q3 2014 Q3 2015
Repo rate 1.5 1.5 (1.5) 1.3 (1.4) 1.4 (1.6) 2.2 (2.4) 2.9 (3,1)
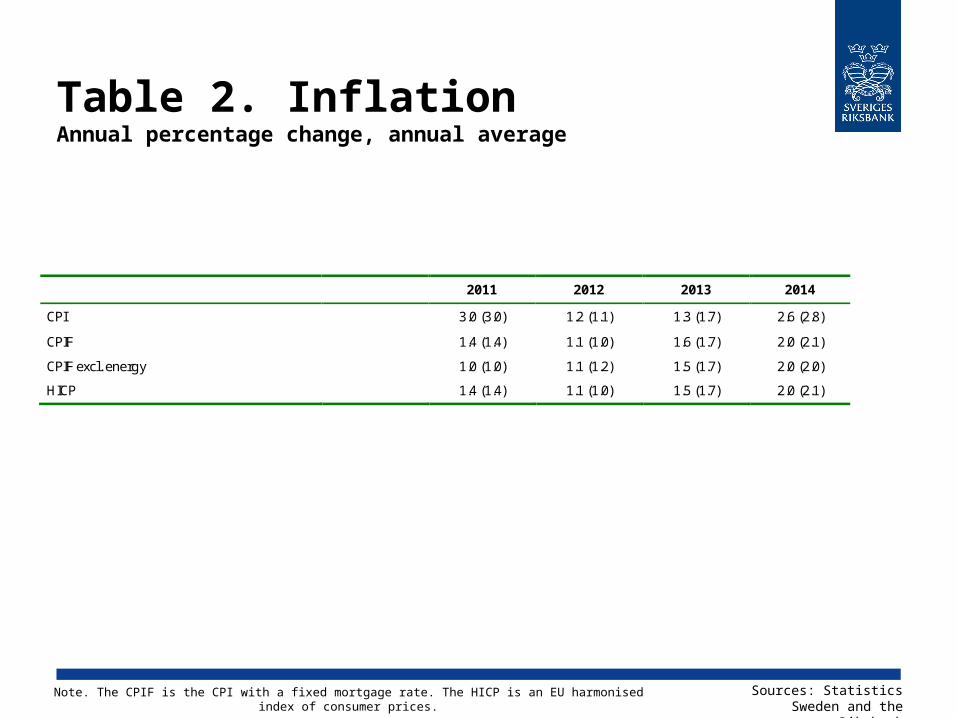
Table 2. InflationAnnual percentage change, annual average
Sources: Statistics Sweden and the
Riksbank
Note. The CPIF is the CPI with a fixed mortgage rate. The HICP is an EU harmonised index of consumer prices.
2011 2012 2013 2014
CPI 3.0 (3.0) 1.2 (1.1) 1.3 (1.7) 2.6 (2.8)
CPIF 1.4 (1.4) 1.1 (1.0) 1.6 (1.7) 2.0 (2.1)
CPIF excl. energy 1.0 (1.0) 1.1 (1.2) 1.5 (1.7) 2.0 (2.0)
HICP 1.4 (1.4) 1.1 (1.0) 1.5 (1.7) 2.0 (2.1)
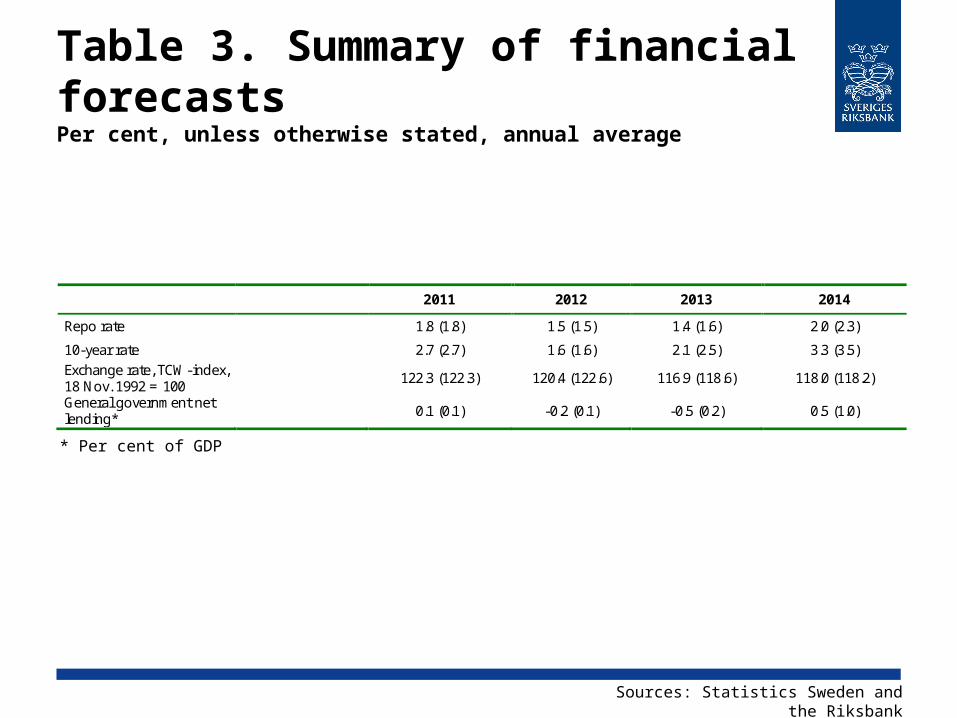
Table 3. Summary of financial forecastsPer cent, unless otherwise stated, annual average
Sources: Statistics Sweden and the Riksbank
* Per cent of GDP
2011 2012 2013 2014
Repo rate 1.8 (1.8) 1.5 (1.5) 1.4 (1.6) 2.0 (2.3)
10-year rate 2.7 (2.7) 1.6 (1.6) 2.1 (2.5) 3.3 (3.5) Exchange rate, TCW-index, 18 Nov. 1992 = 100
122.3 (122.3) 120.4 (122.6) 116.9 (118.6) 118.0 (118.2)
General government net lending* 0.1 (0.1) -0.2 (0.1) -0.5 (0.2) 0.5 (1.0)
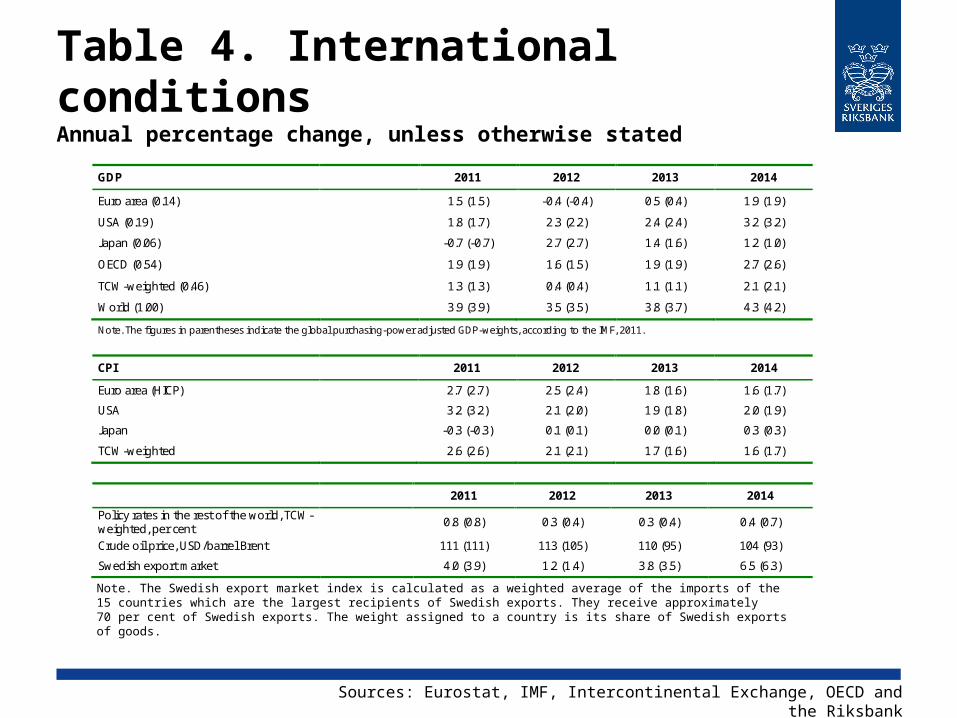
Table 4. International conditions Annual percentage change, unless otherwise stated
Sources: Eurostat, IMF, Intercontinental Exchange, OECD and the Riksbank
Note. The Swedish export market index is calculated as a weighted average of the imports of the 15 countries which are the largest recipients of Swedish exports. They receive approximately 70 per cent of Swedish exports. The weight assigned to a country is its share of Swedish exports of goods.
GDP 2011 2012 2013 2014
Euro area (0.14) 1.5 (1.5) -0.4 (-0.4) 0.5 (0.4) 1.9 (1.9)
USA (0.19) 1.8 (1.7) 2.3 (2.2) 2.4 (2.4) 3.2 (3.2)
Japan (0.06) -0.7 (-0.7) 2.7 (2.7) 1.4 (1.6) 1.2 (1.0)
OECD (0.54) 1.9 (1.9) 1.6 (1.5) 1.9 (1.9) 2.7 (2.6)
TCW-weighted (0.46) 1.3 (1.3) 0.4 (0.4) 1.1 (1.1) 2.1 (2.1)
World (1.00) 3.9 (3.9) 3.5 (3.5) 3.8 (3.7) 4.3 (4.2)
Note. The figures in parentheses indicate the global purchasing-power adjusted GDP-weights, according to the IMF, 2011.
CPI 2011 2012 2013 2014
Euro area (HICP) 2.7 (2.7) 2.5 (2.4) 1.8 (1.6) 1.6 (1.7)
USA 3.2 (3.2) 2.1 (2.0) 1.9 (1.8) 2.0 (1.9)
Japan -0.3 (-0.3) 0.1 (0.1) 0.0 (0.1) 0.3 (0.3)
TCW-weighted 2.6 (2.6) 2.1 (2.1) 1.7 (1.6) 1.6 (1.7)
2011 2012 2013 2014
Policy rates in the rest of the world, TCW-weighted, per cent
0.8 (0.8) 0.3 (0.4) 0.3 (0.4) 0.4 (0.7)
Crude oil price, USD/barrel Brent 111 (111) 113 (105) 110 (95) 104 (93)
Swedish export market 4.0 (3.9) 1.2 (1.4) 3.8 (3.5) 6.5 (6.3)
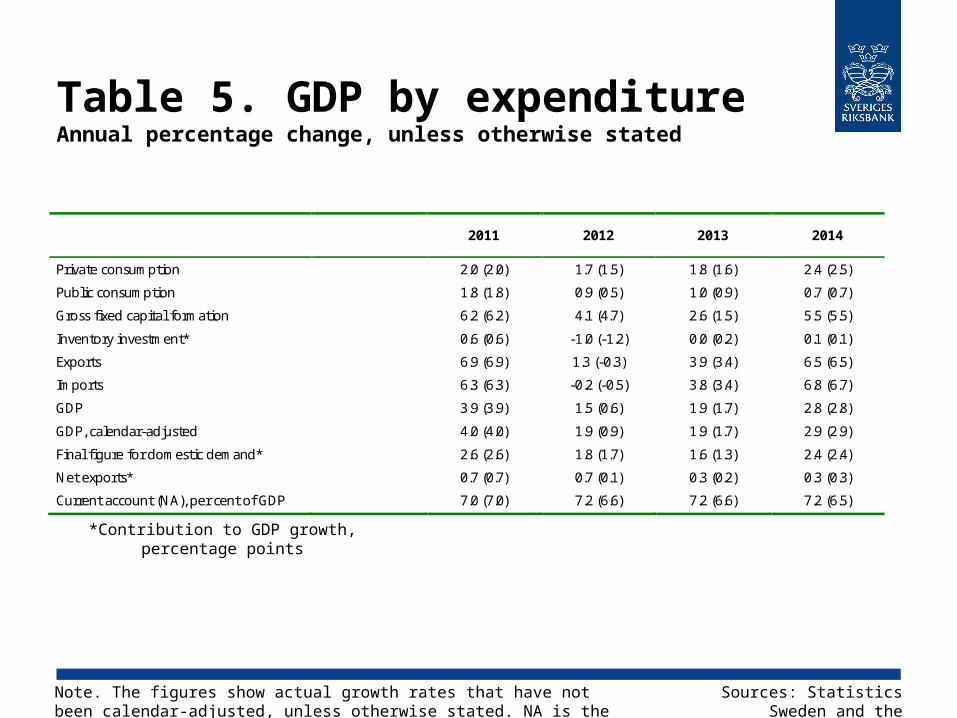
Table 5. GDP by expenditureAnnual percentage change, unless otherwise stated
Sources: Statistics Sweden and the
Riksbank
Note. The figures show actual growth rates that have not been calendar-adjusted, unless otherwise stated. NA is the National Accounts.
*Contribution to GDP growth, percentage points
2011 2012 2013 2014
Private consumption 2.0 (2.0) 1.7 (1.5) 1.8 (1.6) 2.4 (2.5)
Public consumption 1.8 (1.8) 0.9 (0.5) 1.0 (0.9) 0.7 (0.7)
Gross fixed capital formation 6.2 (6.2) 4.1 (4.7) 2.6 (1.5) 5.5 (5.5)
Inventory investment* 0.6 (0.6) -1.0 (-1.2) 0.0 (0.2) 0.1 (0.1)
Exports 6.9 (6.9) 1.3 (-0.3) 3.9 (3.4) 6.5 (6.5)
Imports 6.3 (6.3) -0.2 (-0.5) 3.8 (3.4) 6.8 (6.7)
GDP 3.9 (3.9) 1.5 (0.6) 1.9 (1.7) 2.8 (2.8)
GDP, calendar-adjusted 4.0 (4.0) 1.9 (0.9) 1.9 (1.7) 2.9 (2.9)
Final figure for domestic demand* 2.6 (2.6) 1.8 (1.7) 1.6 (1.3) 2.4 (2.4)
Net exports* 0.7 (0.7) 0.7 (0.1) 0.3 (0.2) 0.3 (0.3)
Current account (NA), per cent of GDP 7.0 (7.0) 7.2 (6.6) 7.2 (6.6) 7.2 (6.5)
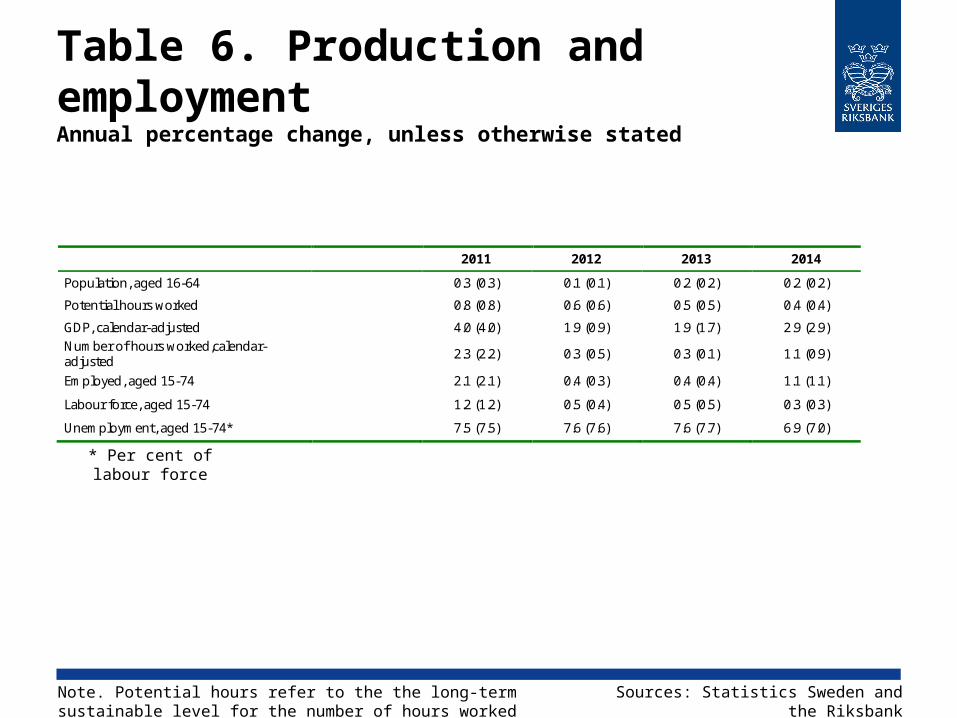
Table 6. Production and employmentAnnual percentage change, unless otherwise stated
Sources: Statistics Sweden and the Riksbank
Note. Potential hours refer to the the long-term sustainable level for the number of hours worked according to the Riksbank’s assessment.
* Per cent of labour force
2011 2012 2013 2014
Population, aged 16-64 0.3 (0.3) 0.1 (0.1) 0.2 (0.2) 0.2 (0.2)
Potential hours worked 0.8 (0.8) 0.6 (0.6) 0.5 (0.5) 0.4 (0.4)
GDP, calendar-adjusted 4.0 (4.0) 1.9 (0.9) 1.9 (1.7) 2.9 (2.9) Number of hours worked,calendar-adjusted 2.3 (2.2) 0.3 (0.5) 0.3 (0.1) 1.1 (0.9)
Employed, aged 15-74 2.1 (2.1) 0.4 (0.3) 0.4 (0.4) 1.1 (1.1)
Labour force, aged 15-74 1.2 (1.2) 0.5 (0.4) 0.5 (0.5) 0.3 (0.3)
Unemployment, aged 15-74* 7.5 (7.5) 7.6 (7.6) 7.6 (7.7) 6.9 (7.0)
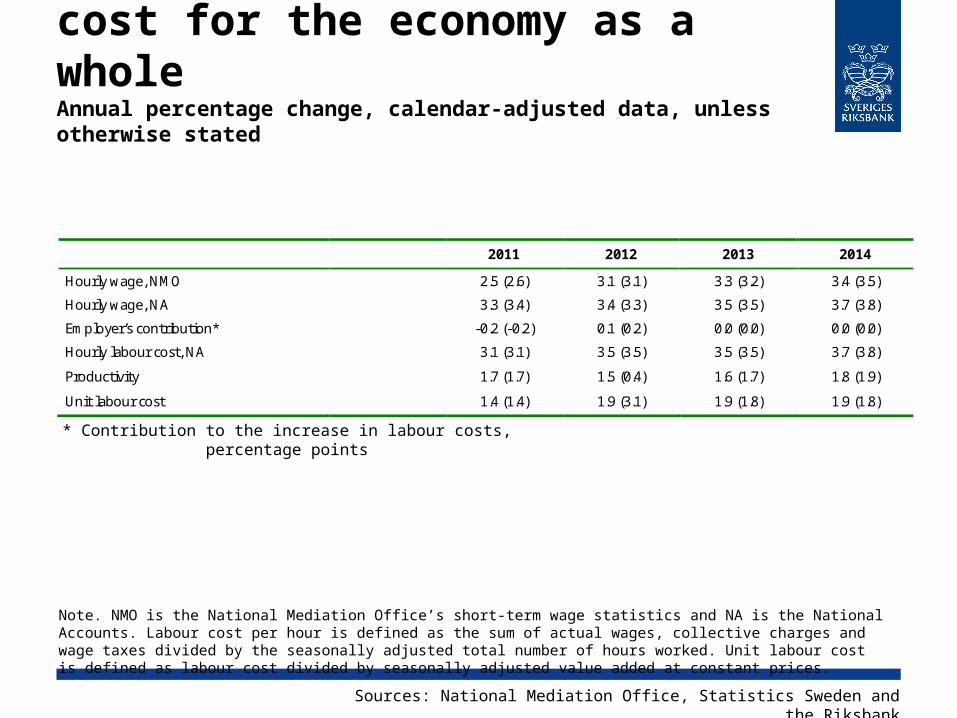
Table 7. Wages and unit labour cost for the economy as a wholeAnnual percentage change, calendar-adjusted data, unless otherwise stated
Sources: National Mediation Office, Statistics Sweden and the Riksbank
Note. NMO is the National Mediation Office’s short-term wage statistics and NA is the National Accounts. Labour cost per hour is defined as the sum of actual wages, collective charges and wage taxes divided by the seasonally adjusted total number of hours worked. Unit labour cost is defined as labour cost divided by seasonally adjusted value added at constant prices.
* Contribution to the increase in labour costs, percentage points
2011 2012 2013 2014
Hourly wage, NMO 2.5 (2.6) 3.1 (3.1) 3.3 (3.2) 3.4 (3.5)
Hourly wage, NA 3.3 (3.4) 3.4 (3.3) 3.5 (3.5) 3.7 (3.8)
Employer’s contribution* -0.2 (-0.2) 0.1 (0.2) 0.0 (0.0) 0.0 (0.0)
Hourly labour cost, NA 3.1 (3.1) 3.5 (3.5) 3.5 (3.5) 3.7 (3.8)
Productivity 1.7 (1.7) 1.5 (0.4) 1.6 (1.7) 1.8 (1.9)
Unit labour cost 1.4 (1.4) 1.9 (3.1) 1.9 (1.8) 1.9 (1.8)


![Cecilia Skingsley: Should the Riksbank issue e-krona? · 1 [10] Should the Riksbank issue e-krona?1 Should the Riksbank issue electronic means of payment in the same way as we now](https://img.pdfslide.us/doc/110x75/5ec82f088662860afc5de461/cecilia-skingsley-should-the-riksbank-issue-e-krona-1-10-should-the-riksbank.jpg)