Embed Size (px)
Citation preview
WELCOME to
OfficialIGHC2017Opening
JosephSuidanHeadofGroundOperations,IATA

WelcomefromourHosts
Arkhom TermpittayapaisithMinisterofTransport,Thailand
WelcomefromourHostsArun MishraRegionalDirector,ICAOAsiaandPacificOffice
OpeningRemarksfromIATA
NickCareenSeniorVicePresident,Airport,Passenger,CargoandSecurity,IATA
MasterofCeremony
JohnBaileyPartner,ManagingDirector,KetchumSingapore
Track BUSINESS, ENGAGEMENT, DEVELOPMENT
ThankyoutoourMorningSessions’Sponsor


10
DOWNLOADTHENETWORKINGTOOL
www.ighc.marcom-connect.com
ConferenceDeskintheNetworkingArea,behindtheExhibition
ASKYOURQUESTIONSBEFORETHESESSIONSORINREALTIME!
11
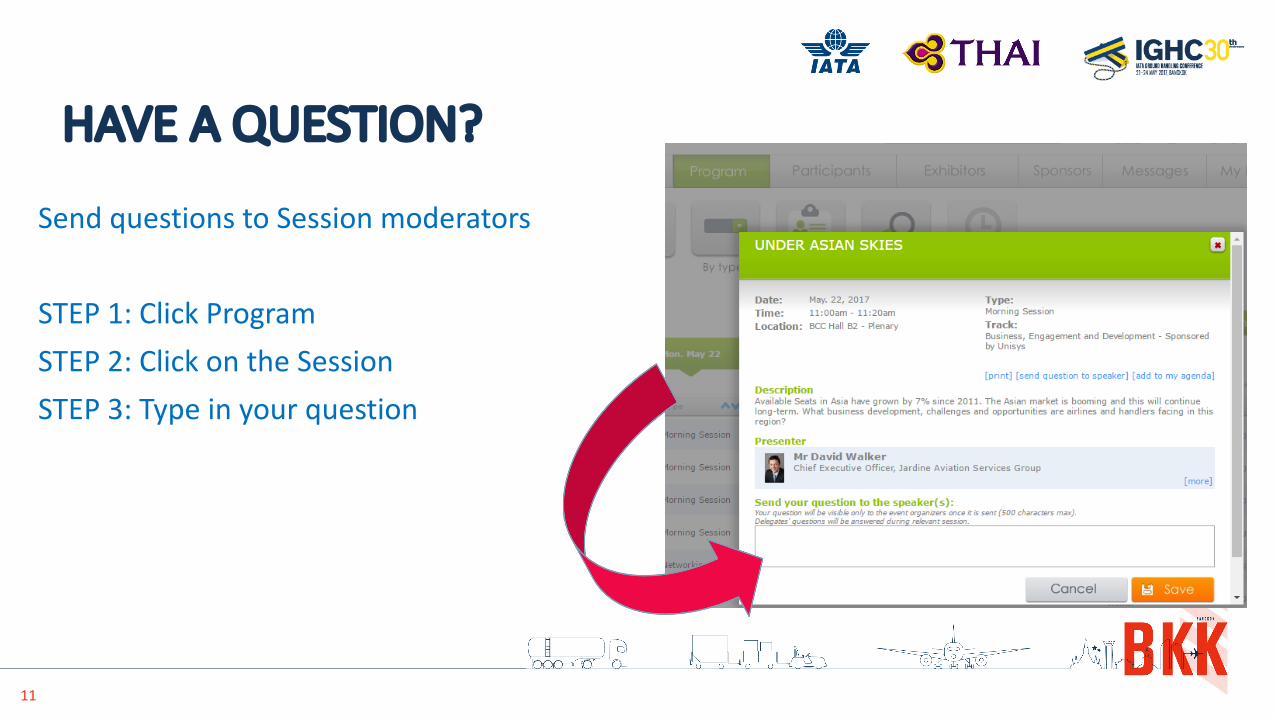
HAVEAQUESTION?
SendquestionstoSessionmoderators
STEP1:ClickProgramSTEP2:ClickontheSessionSTEP3:Typeinyourquestion
12
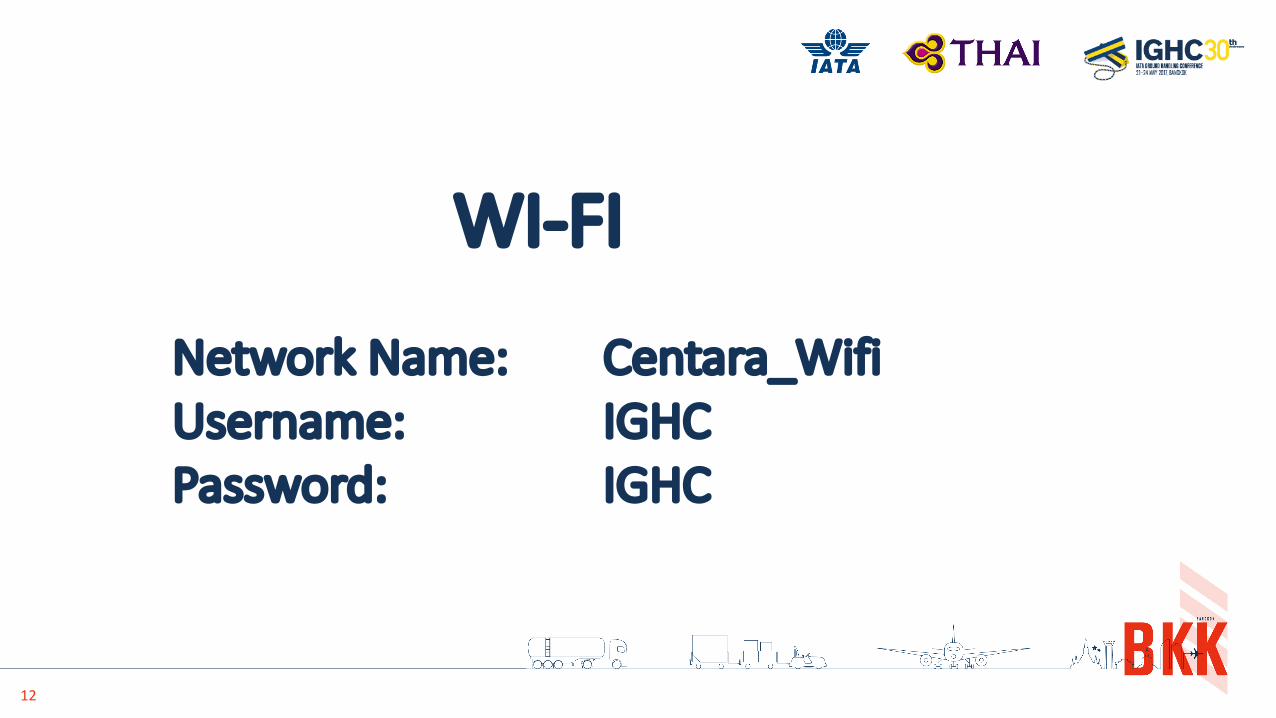
WI-FI
NetworkName: Centara_WifiUsername: IGHCPassword: IGHC
EyeontheFuture
Phakkhra RuangsiradechoExecutiveVicePresident,AviationBusinessUnit,ThaiAirways

EconomicStateoftheAirlineIndustry
ConradCliffordRegionalVicePresident,IATAAsiaPacific
16
IN 2016…
17
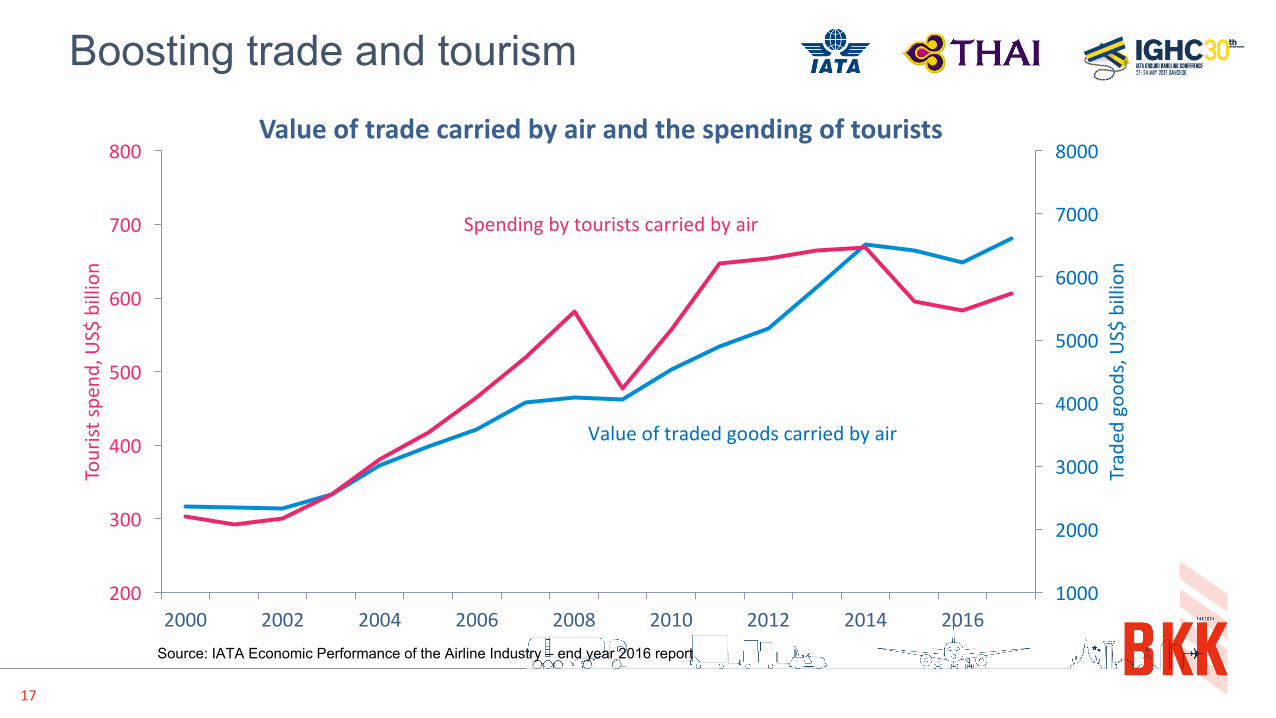
Boosting trade and tourism
1000
2000
3000
4000
5000
6000
7000
8000
200
300
400
500
600
700
800
2000 2002 2004 2006 2008 2010 2012 2014 2016
Traded
goo
ds,U
S$billion
Touristsp
end,US$billion
Valueoftradecarriedbyairandthespendingoftourists
Valueoftradedgoodscarriedbyair
Spendingbytouristscarriedbyair
Source: IATA Economic Performance of the Airline Industry – end year 2016 report
18
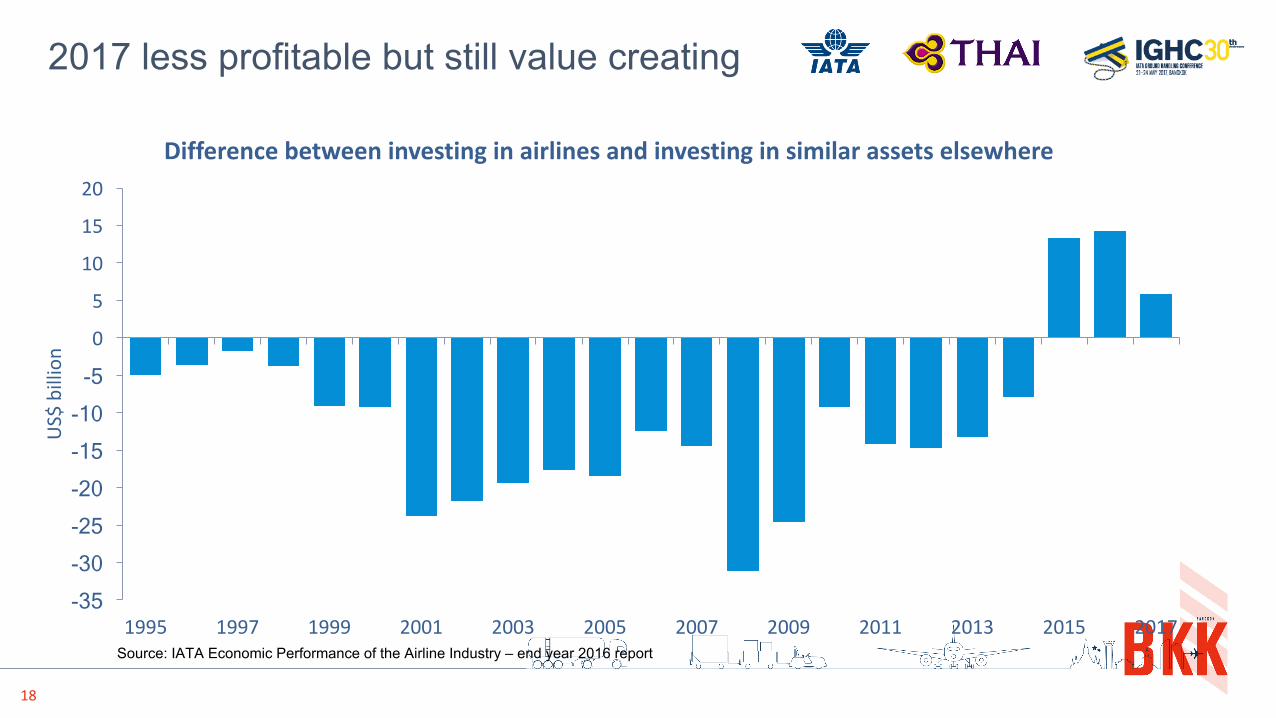
2017 less profitable but still value creating
-35 -30 -25 -20 -15 -10 -5 0
5
10
15
20
1995 1997 1999 2001 2003 2005 2007 2009 2011 2013 2015 2017
US$billion
Differencebetweeninvestinginairlinesandinvestinginsimilarassetselsewhere
Source: IATA Economic Performance of the Airline Industry – end year 2016 report
19
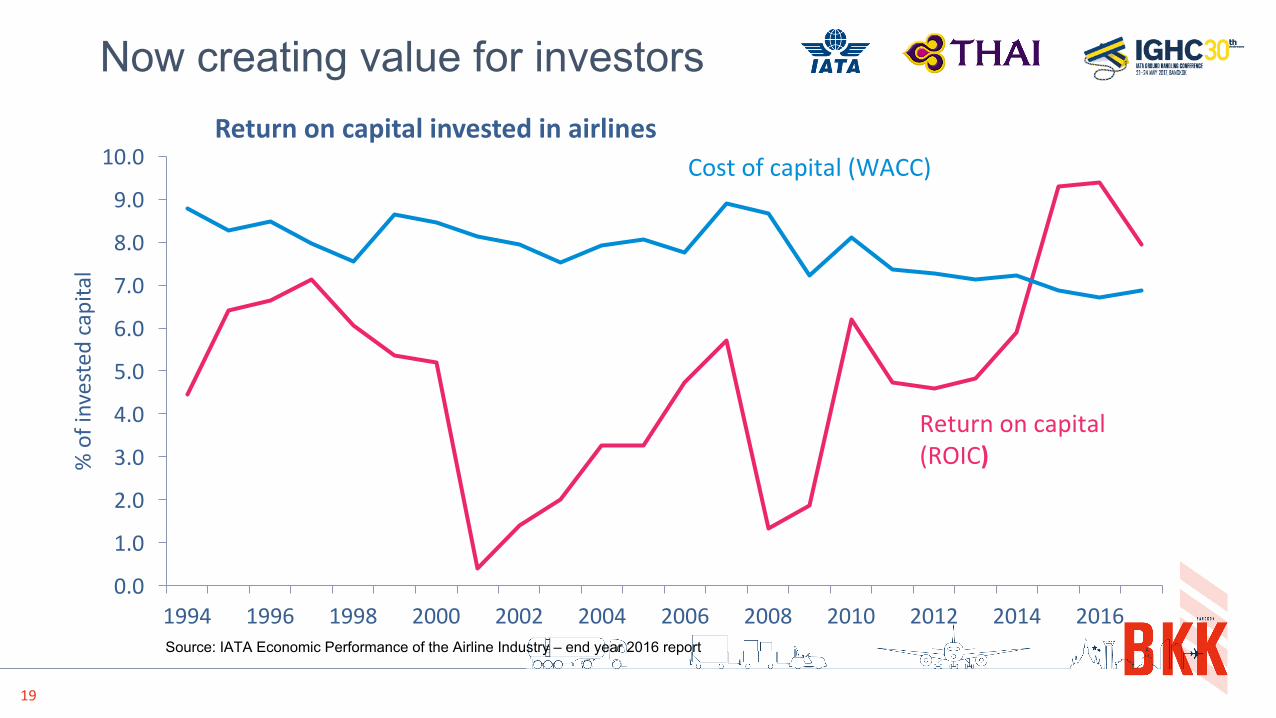
Now creating value for investors
0.0
1.0
2.0
3.0
4.0
5.0
6.0
7.0
8.0
9.0
10.0
1994 1996 1998 2000 2002 2004 2006 2008 2010 2012 2014 2016
%ofinvestedcapital
ReturnoncapitalinvestedinairlinesCostofcapital(WACC)
Returnoncapital(ROIC)
Source: IATA Economic Performance of the Airline Industry – end year 2016 report
20
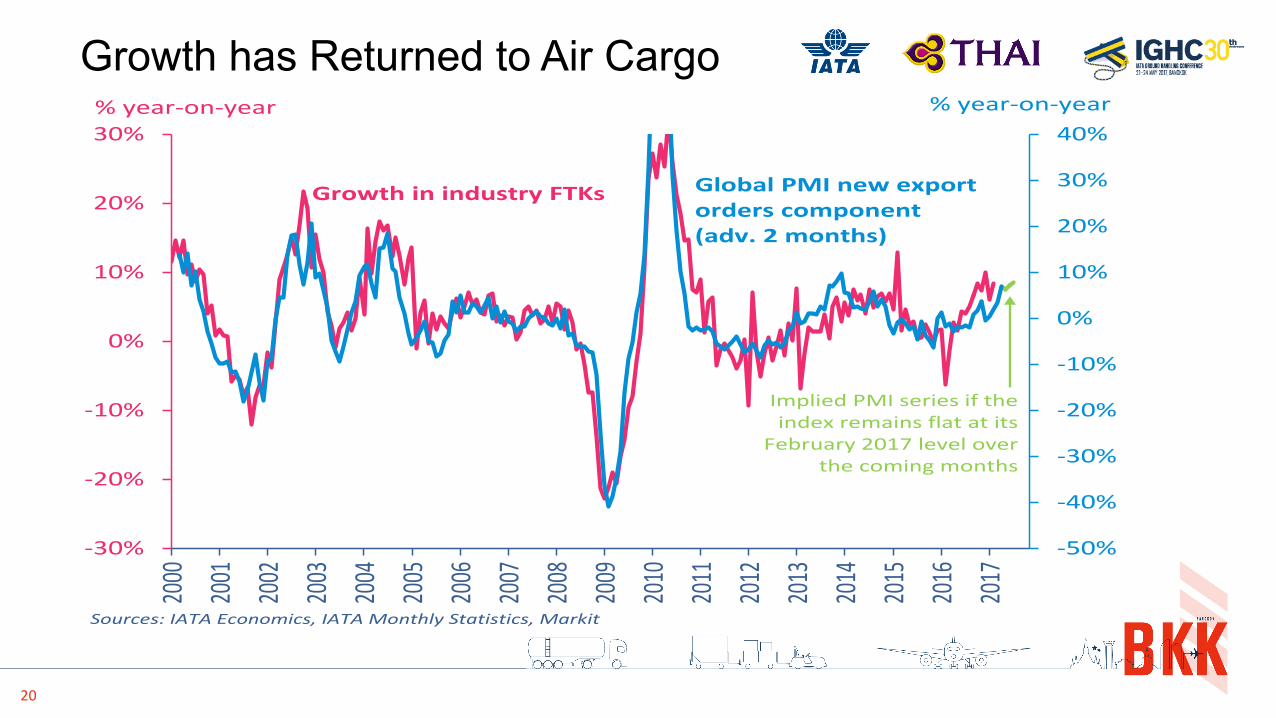
-50%
-40%
-30%
-20%
-10%
0%
10%
20%
30%
40%
-30%
-20%
-10%
0%
10%
20%
30%
2000
2001
2002
2003
2004
2005
2006
2007
2008
2009
2010
2011
2012
2013
2014
2015
2016
2017
%year-on-year %year-on-year
GrowthinindustryFTKs GlobalPMInewexportorders component(adv.2months)
Sources:IATAEconomics,IATAMonthlyStatistics,Markit
ImpliedPMIseriesiftheindexremainsflatatits
February2017leveloverthecomingmonths
Growth has Returned to Air Cargo
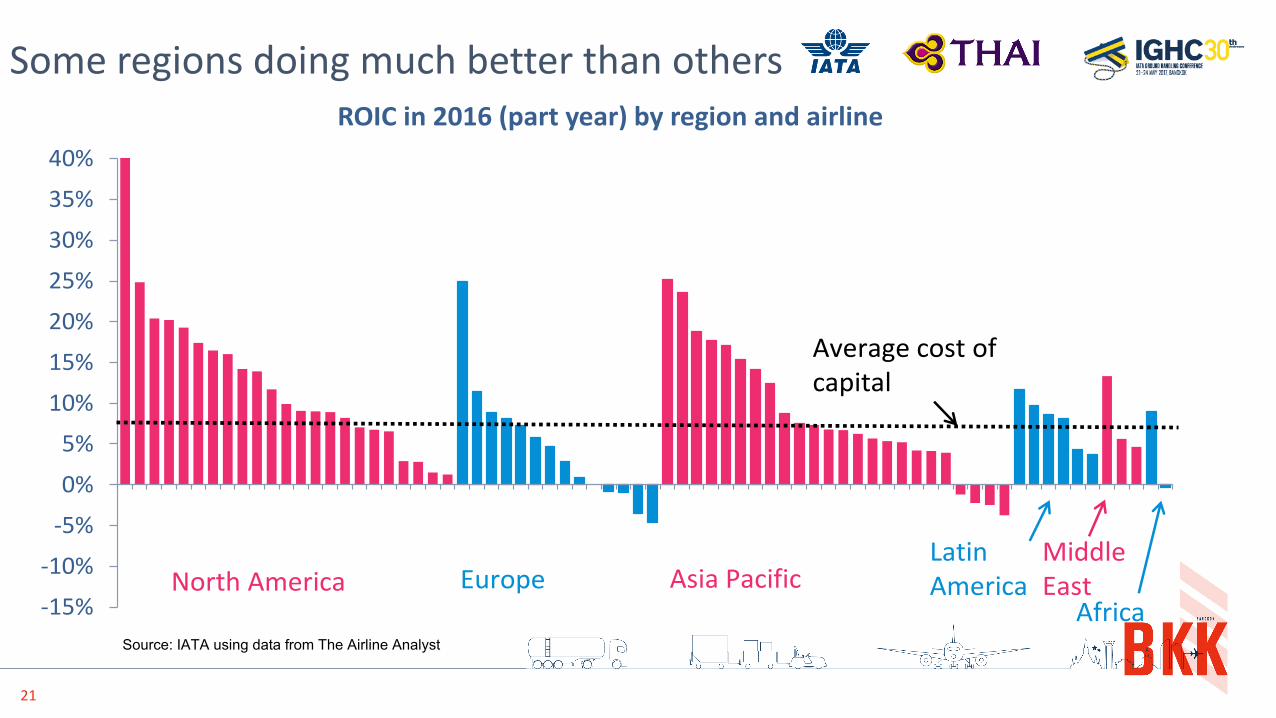
21
Someregionsdoingmuchbetterthanothers
Source: IATA using data from The Airline Analyst
-15%-10%-5%0%
5%10%15%20%25%30%35%
40%ROICin2016(partyear)byregionandairline
NorthAmerica Europe Asia PacificLatinAmerica
MiddleEast
Africa
Averagecostofcapital
22
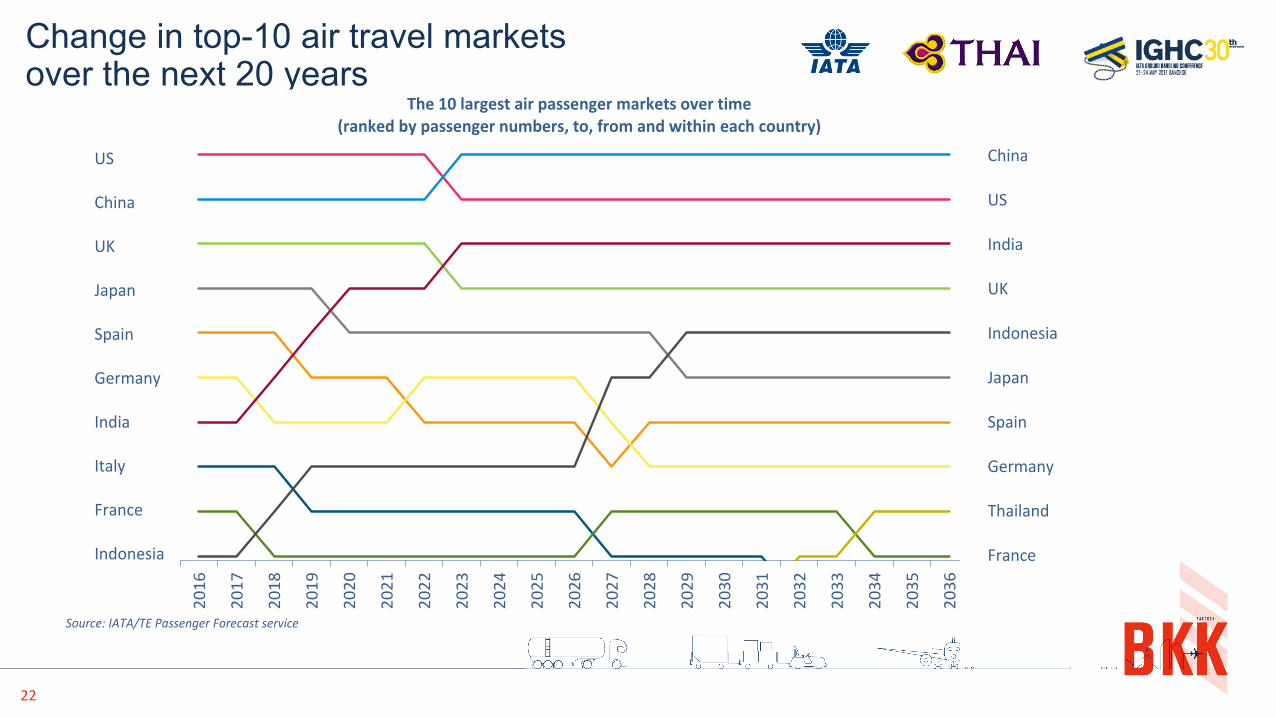
Change in top-10 air travel markets over the next 20 years
0.9
1.9
2.9
3.9
4.9
5.9
6.9
7.9
8.9
9.9
2016
2017
2018
2019
2020
2021
2022
2023
2024
2025
2026
2027
2028
2029
2030
2031
2032
2033
2034
2035
2036
Source:IATA/TEPassengerForecastservice
The10largestairpassengermarketsovertime(rankedbypassengernumbers,to,fromandwithineachcountry)
0
2
4
6
8
10
12
1
US
China
UK
Japan
Spain
Germany
India
Italy
France
Indonesia
0
2
4
6
8
10
12
1
China
US
India
UK
Indonesia
Japan
Spain
Germany
Thailand
France
23
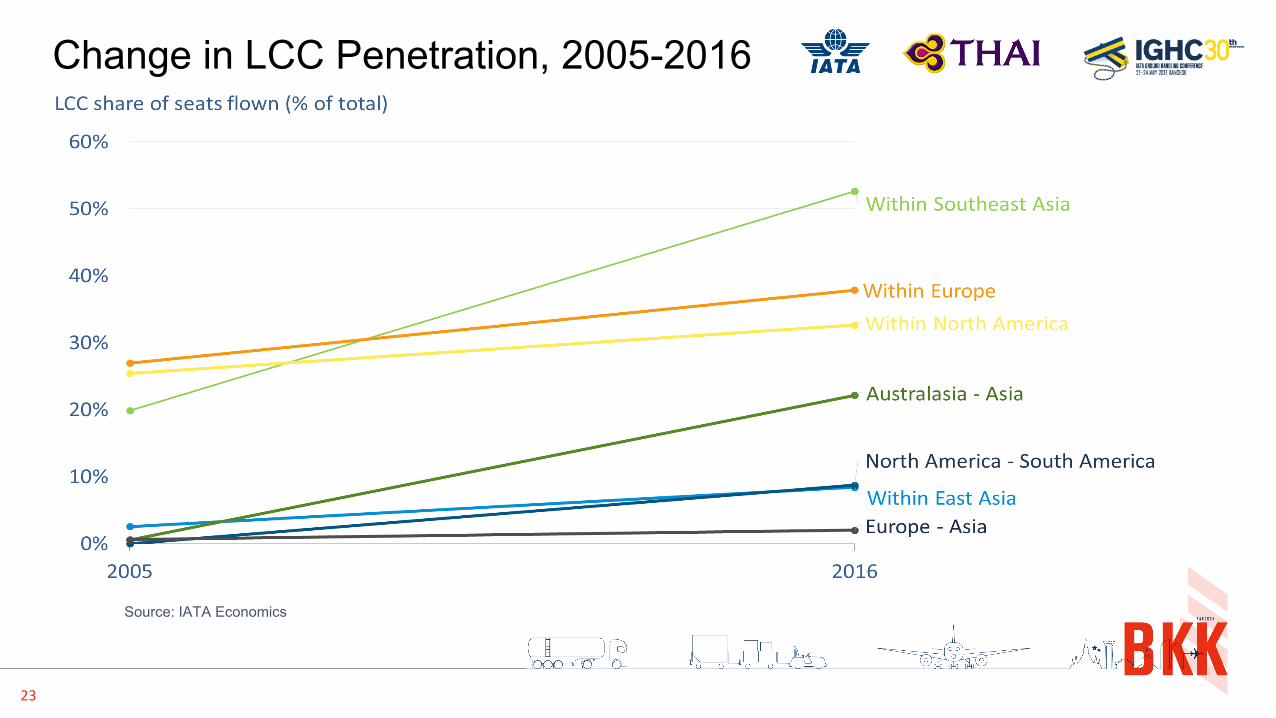
Source: IATA Economics
Change in LCC Penetration, 2005-2016
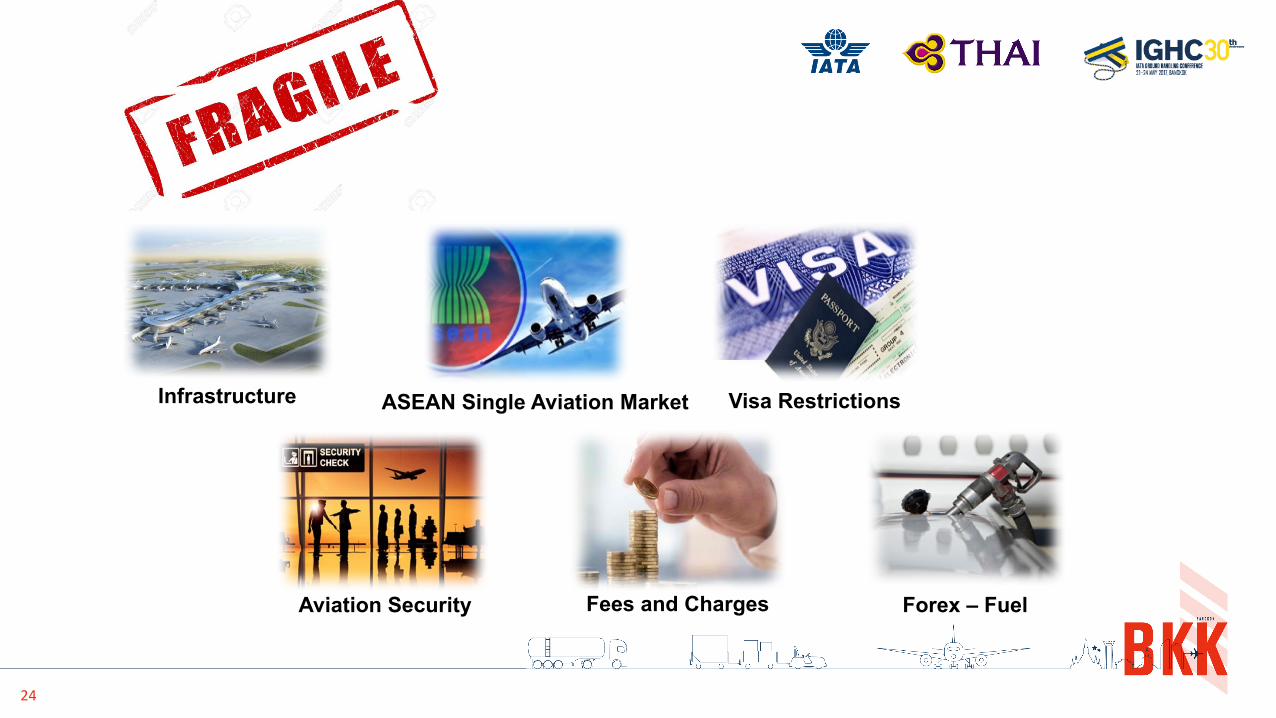
24
ASEAN Single Aviation Market Visa Restrictions
Aviation Security Fees and Charges
Infrastructure
Forex – Fuel
25
THANK YOU
WELCOME toNetworkingBreakExhibitionHall10:30– 11:00