Embed Size (px)
Citation preview
This article was downloaded by: [Mount Allison University 0Libraries]On: 05 May 2013, At: 05:33Publisher: Taylor & FrancisInforma Ltd Registered in England and Wales Registered Number: 1072954 Registered office: Mortimer House,37-41 Mortimer Street, London W1T 3JH, UK
Molecular SimulationPublication details, including instructions for authors and subscription information:http://www.tandfonline.com/loi/gmos20
Molecular simulation study of the assembly of DNA-functionalised nanoparticles: Effect of DNA strandsequence and compositionArezou Seifpour a , Steven R. Dahl a , Brandon Lin a & Arthi Jayaraman aa Department of Chemical and Biological Engineering, University of Colorado, Jennie SmolyCaruthers Biotechnology Building, 596 UCB, Boulder, CO, 80309-0596, USAPublished online: 14 Mar 2013.
To cite this article: Arezou Seifpour , Steven R. Dahl , Brandon Lin & Arthi Jayaraman (2013): Molecular simulation study ofthe assembly of DNA-functionalised nanoparticles: Effect of DNA strand sequence and composition, Molecular Simulation,DOI:10.1080/08927022.2013.765569
To link to this article: http://dx.doi.org/10.1080/08927022.2013.765569
PLEASE SCROLL DOWN FOR ARTICLE
Full terms and conditions of use: http://www.tandfonline.com/page/terms-and-conditions
This article may be used for research, teaching, and private study purposes. Any substantial or systematicreproduction, redistribution, reselling, loan, sub-licensing, systematic supply, or distribution in any form toanyone is expressly forbidden.
The publisher does not give any warranty express or implied or make any representation that the contentswill be complete or accurate or up to date. The accuracy of any instructions, formulae, and drug doses shouldbe independently verified with primary sources. The publisher shall not be liable for any loss, actions, claims,proceedings, demand, or costs or damages whatsoever or howsoever caused arising directly or indirectly inconnection with or arising out of the use of this material.

Molecular simulation study of the assembly of DNA-functionalised nanoparticles: Effect of DNAstrand sequence and composition
Arezou Seifpour, Steven R. Dahl, Brandon Lin and Arthi Jayaraman*
Department of Chemical and Biological Engineering, University of Colorado, Jennie Smoly Caruthers Biotechnology Building, 596UCB, Boulder, CO 80309-0596, USA
(Received 16 September 2012; final version received 7 January 2013)
DNA functionalisation is a proven route to program an assembly of nanoparticles into a vast array of nanostructures. In thispaper, we used coarse-grained molecular dynamics simulations to study DNA-functionalised nanoparticles and demonstratethe effect of grafted DNA strand composition, specifically the placement and number of contiguous G/C bases in the graftedDNA single strands, on the thermodynamics and structure of nanoparticle assembly at varying grafting densities and particlesizes. At a constant G/C content, nanoparticles assemble more readily when the G/C bases are placed on the outer or middleportions of the strands than on the inner portion. In addition, the number of neighbours within the assembled clusterdecreases as the placement of the G/C bases goes from the outer to middle to inner sections of the strand. As the G/C contentdecreases, the cluster dissociation temperature, Td, decreases, as the enthalpic drive to assemble decreases. At a high G/Ccontent (number of grafts and G/C placement are held constant), as particle size decreases, Td increases. This is because thesmaller particles experience a lower entropic loss than do larger particles upon assembly. On the other hand, at a low G/Ccontent, small changes in particle size lead to negligible changes in Td.
Keywords: DNA-grafted nanoparticle; assembly; molecular simulation
1. Introduction
DNA functionalisation is an attractive route to program an
assembly of nanoparticles into target nanostructures
because of the specificity and reversibility of DNA
hybridisation. A single DNA strand consists of nucleo-
tides, each of which has a sugar, a phosphate group and a
nitrogenous base (adenine (A), guanine (G), cytosine (C)
or thymine (T)). According to the Watson–Crick base
pairing, complementary bases specifically form hydrogen
bonds with each other (A with T and G with C). It is
through this Watson–Crick base pairing that a sequence of
nucleotides in a single-stranded DNA (ssDNA) hybridises
specifically with another ssDNA with a complementary
sequence of nucleotides. This hybridisation leads to a
double-stranded DNA (dsDNA) whose stability at a given
temperature is known to be strongly dependent on the
strand length and sequence. As the temperature increases
above the melting temperature, the dsDNA separates into
the two-constituent ssDNA. Using this thermoreversible
and specific nature of hybridisation of the ssDNA grafted
on nanoparticles, one can assemble DNA-grafted nano-
particles into nanoclusters. Strands grafted on one particle
hybridise with complementary strands on another particle
either in a binary system in which one set of particles is
grafted with strands that are complementary to the strands
grafted on another set of nanoparticles [1–11] or in a
single population of particles in which the ssDNA
sequence is self-complementary (e.g. ACGT) [12,13].
Alternatively, strands on two or more particles hybridise
via free linker strands which when added to the system of
DNA-grafted particles induce nanoparticle assembly [14–
22]. Current synthetic capabilities allow for designing
DNA-functionalised nanoparticles [19,23–25] and col-
loids [17,26,27] with a desired ssDNA sequence, length
and composition to tailor nanoparticle/colloid assembly
into target nano/microstructures. Many computational and
experimental studies provide a fundamental understanding
of the effect of various parameters (ssDNA length,
sequence, grafting density, G/C content) on the thermo-
dynamics and kinetics of colloidal and nanoparticle
assembly. For example, past studies have established that
as the length of the grafted ssDNA increases, the
hybridisation/melting temperature (Tm) of dsDNA
increases and the assembly/dissociation transition tem-
perature of nanoparticles (Td) increases [15,22]. As ssDNA
strand length increases, the number of base pairs in the
dsDNA increases, and in turn, the higher enthalpic gain
from the larger number of base pairs drives Tm and Td to
shift to higher temperatures. Structurally, increasing the
length of the grafted ssDNA increases the inter-particle
spacing within the assembled structure. As grafting
density, defined as the number of grafted strands per unit
particle surface area, increases, Td increases because the
large enthalpic gain upon hybridisation from an increased
number of complementary bases easily overcomes the loss
in translational entropy of particles and conformational
q 2013 Taylor & Francis
*Corresponding author. Email: [email protected]
Molecular Simulation, 2013
http://dx.doi.org/10.1080/08927022.2013.765569
Dow
nloa
ded
by [
Mou
nt A
lliso
n U
nive
rsity
0L
ibra
ries
] at
05:
33 0
5 M
ay 2
013

entropy of the densely grafted DNA strands upon
hybridisation. Similarly, as the particle size increases at
constant grafting density, the number of grafted strands
increases, and as a result the Td increases and melting
transition sharpens [5,22,28,29].
With regard to strand content or composition, defined
as the percentage of strand that contains G or C bases, it is
well understood that the higher the percentage of G/C
bases in the strand, the stronger the drive for hybridisation
between the complementary strands. This is because of the
three hydrogen bonds in a G–C base pair in contrast to two
hydrogen bonds in an A–T base pair. This increased
enthalpic gain from G–C base pairing leads to higher Tmbetween the complementary single strands, and as a result
higher Td of the nanocluster assembled through hybridis-
ation of strands containing higher G/C content [29]. One
could tune the strength of binding between two
oligonucleotide strands by varying the G/C content or by
incorporating ‘non-hybridising’ spacer bases in the strand
between the G/C bases. It is important to find the optimal
G/C content which is sufficient to drive nanoparticles to
assemble, yet not too high leading to metastable structures
[30]. The optimal G/C content is not easy to predict a priori
as it depends in a complex manner on the nanoparticle
shape and size, grafting density, nanoparticle concen-
tration, etc. In addition to the G/C content, the placement
of G/C bases in the strand, i.e. the length of contiguous
G/C bases or sequence of G/C with respect to other bases
in the strand, also affects the structure of the nanoparticle
assembly and cluster dissociation temperature, primarily
by affecting the entropy losses term in the free energy of
cluster formation. This aspect of G/C placement along the
strand, and how it affects the assembly at varying particle
sizes, grafting densities and G/C content has not been
studied well in the past [21].
In this paper, we used coarse-grained molecular
dynamics simulations to study a system of a single
population of DNA-functionalised nanoparticles that
assemble (without linkers) through hybridisation of
complementary grafted strands in an implicit solvent.
Our goal is to understand the effect of G/C content and
placement within the grafted strands on the structure and
thermodynamics of the assembly at varying grafting
densities and particle sizes. We first validated our coarse-
grained model by qualitatively replicating experimentally
observed trends using increasing grafting densities.
Consistent with experimental trends [14], at a constant
G/C content and G/C placement, as grafting density
increased, we observed that the melting temperature Tmand cluster dissociation temperature Td of the assembly
increased because the total number of G–C base pairs
between particles increased. Structurally, an increase in
grafting density, within the low grafting density regime
(s ¼ 0.01–0.10 chains/nm2), leads to an increase in the
average number of neighbours within the final cluster or
the ‘valency’ of the DNA-grafted nanoparticle. At a
constant grafting density and G/C content, nanoparticles
assembled more readily when the G/C bases were placed
on the outer (far from the particle surface) or middle
portions of the strands than in the inner portion (closest to
the particle surface) because of entropic frustration in the
latter case. Moreover, at a constant G/C content, as the G/C
placement along the strand shifted closer to the particle
surface, the ‘valency’ of the particle decreased. As particle
size decreased at constant grafting density and G/C
placement, the minimum G/C content needed for assembly
increased. Alternatively, when the G/C content (or the
enthalpic contribution to hybridisation) is constant,
smaller particles have a higher Td than larger particles
because the smaller particles experience a lower transla-
tional entropic loss upon assembly. Although much of the
study was conducted at a constant dilute concentration of
1025 particles/nm3, as particle concentration increased at
100% G/C content, the number of neighbours or ‘valency’
increased at first and then plateaued. As particle
concentration increased at a lower G/C content, the higher
concentration drove further assembly of the particles.
The paper is organised as follows: in Section 2, we
provide details of our model and the simulation method as
well as analysis techniques we used and parameters we
studied. In Section 3, we present the results of the
assembly of DNA-functionalised nanoparticles as a
function of G/C content and placement within the grafted
strands at varying grafting densities and particle sizes. In
Section 4, we conclude with the key observed results,
limitations of this work and future directions.
2. Methods
2.1 Model and simulation
We modelled a system of DNA-functionalised nanopar-
ticles in an implicit solvent using a coarse-grain model
(Figure 1). This coarse-grained model is capable of
capturing the timescale and length scale of DNA
hybridisation-driven assembly of many nanoparticles
[12,13] that atomistically detailed models would not be
able to capture. In our model, hard spherical nanoparticles
of diameter D were grafted with ssDNA strands at fixed
locations and symmetrically on the nanoparticle surface.
The strands were modelled as semi-flexible chains
composed of Nbases number of ‘monomer’ beads of
diameter smon, where smon,1 nm because each monomer
bead represents a complete nucleotide (sugar, phosphate
and A, C, G or T base). Each monomer bead contains an
attractive site that mimics hydrogen bonding. This
attractive hydrogen bonding site is restricted to interact
with another hydrogen bonding site on a complementary
monomer bead, thus mimicking the Watson–Crick base
pairing. This model of DNA-functionalised nanoparticles
A. Seifpour et al.2
Dow
nloa
ded
by [
Mou
nt A
lliso
n U
nive
rsity
0L
ibra
ries
] at
05:
33 0
5 M
ay 2
013

is adapted from a recent simulation study on DNA
dendrimers [12,13]. We note that although in those studies
the DNA dendrimers are modelled with a tetrahedral hub
to which ssDNA are bound, we modelled the nanoparticle
as a hard core of a given diameter.
All non-bonded pair-wise interactions (nanoparticle–
nanoparticle, nanoparticle–monomer, monomer–mono-
mer, hydrogen bonding site–monomer, hydrogen bonding
site–nanoparticle and hydrogen bonding site–hydrogen
bonding site) were modelled using a truncated and shifted
Lennard-Jones (LJ) potential:
UðrÞ ¼ ULJðrÞ2 ULJðrcÞ2 ðr 2 rcÞdULJðrÞ
dr
����r¼rc
; ð1Þ
where ULJ ¼ 41 ðs=rÞ12 2 ðs=rÞ6� �
; s is the sum of the
radii of the interacting spheres, 1 is the energetic well
depth, rc is the distance where the potential is truncated
and r represents the centre-to-centre distance between the
coarse-grained beads of interest. All pair-wise interactions
involving nanoparticle–nanoparticle, nanoparticle–
monomer, monomer–monomer, hydrogen bonding site–
monomer, hydrogen bonding site–nanoparticle and non-
complementary hydrogen bonding site–non-complemen-
tary hydrogen bonding site were modelled as repulsive
interactions with rc ¼ 21/6 £ s. The pair-wise interactions
between complementary hydrogen bonding sites included
both the repulsive and attractive portion of the potential,
with rc ¼ 2.5 £ s. The reduced value of 1 in Equation (1)
is assigned as follows: 1nanoparticle ¼ 1, 1monomer ¼ 1,
1hydrogenbondingsite ¼ 1 for hydrogen bonding sites on
monomer beads representing A or T nucleotides and
1hydrogenbondingsite ¼ 1.5 for hydrogen bonding sites on
monomer beads representing G or C nucleotides. All
energies are represented in terms of 1mon (LJ energy
parameter for the monomer spheres), where 1mon , 8 kT.
The value of pair-wise interactions between two sites is the
geometric average of the individuals forming the pair,
1 ¼ (1112)1/2. The value of s in Equation (1) is assigned as
follows: snanoparticle ¼ 2 £ smon or 5 £ smon, smonomer ¼ 1
and shydrogenbondingsite ¼ 0.35 £ smon, where smon is the
diameter of the monomer spheres and smon ,1 nm.
Bonded interactions between various beads were
simulated using a finitely extensible nonlinear elastic
(FENE) potential:
UFENE ¼ 2KR2
0
2ln 12
r
R0
� �2" #
; ð2Þ
where K ¼ (30 £ 1FENE)/s2 and R0 ¼ 1.5 £ s, K is the
force constant, R0 is the maximum extension of the bond,
1FENE is an energy parameter equal to 1mon, and the values
of s and r depend on the type of beads involved in the
bond. For a bond between a nanoparticle and the first
monomer of a DNA strand, s is defined as the radius of the
monomer and r is defined as the distance between the
centre of the monomer and the surface of the nanoparticle.
For a bond between two monomers, s is defined as the sum
of the two monomer radii and r is defined as the distance
between the monomer centres. Finally, a pseudo-bond
between a hydrogen bonding site and the host monomer
uses the s equivalent to the diameter of the hydrogen
bonding site, and r is defined as the centre-to-centre
distance of the hydrogen bonding site and the host
monomer. The equilibrium position of the hydrogen
bonding sites is such that the surface of the hydrogen
bonding site protrudes 0.02 £ smon from the surface of the
host monomer.
A three-body potential between bonded monomer
beads along the ssDNA regulates the characteristic
stiffness of the DNA strands:
U32body ¼1
2Kðu2 u0Þ
2; ð3Þ
where K is a stiffness factor equal to 213-body, 13-body is 10
times 1mon, u is the angle made by the three adjacent
monomer beads and u0 is the ideal angle equal to 1808 for
the preferred linear orientation of DNA. Hydrogen
bonding sites are not subject to three-body interactions.
A three-body interaction was also applied between the
nanoparticle and the first two monomers of each chain to
keep the monomer chains oriented perpendicular to the
surface of the nanoparticle. Lastly, a three-body inter-
action was applied between the first monomer of each
DNA graft, the nanoparticle and the first monomer of
every other DNA strand on the same nanoparticle, and the
u0 value for this three-body interaction was set to force the
Figure 1. Schematic of our coarse grained model. In this model,a nucleotide on each strand is represented with one coarse-grained bead, and the hydrogen bonding sites on the bases arerepresented with sticky patches on the coarse-grained beads.Each nanoparticle is grafted with Ng number of DNA strands(Ng ¼ 6 in this figure) of a given length, Nbases (Nbases ¼ 6 in thisfigure).
Molecular Simulation 3
Dow
nloa
ded
by [
Mou
nt A
lliso
n U
nive
rsity
0L
ibra
ries
] at
05:
33 0
5 M
ay 2
013

DNA grafts to the desired relative positions on the surface
of the nanoparticle which allowed us to ensure the grafts
were placed symmetrically on the particle surface.
The above model was incorporated into a locally
authored molecular dynamics simulation code in the
canonical ensemble, in which the temperature is controlled
via the Nose–Hoover thermostat [31,32]. We refer the
reader to the supplementary information for other details
of the reduced model parameters and validation of the
code.
2.2 Analysis
2.2.1 Thermodynamics
We characterised the thermodynamics of the DNA-
functionalised nanoparticle assembly by calculating the
hybridisation/melting curves of the grafted strands and the
assembly/dissociation transition of the nanoparticles as a
function of reduced temperature.
To calculate the hybridisation/melting of the grafted
strands, at each temperature and each time step, we track
the fraction of strands with 0–100% of G/C hybridised.
Then, at each temperature, we calculated the average
fraction of strands that have at least half the G/C in the
strand hybridised ( f50%). We then normalised f50% by the
maximum value of f50%, usually observed at the lowest
temperature we simulated at, and denoted this as fN,50%.
The melting curve is a plot of average fN,50% as a function
of temperature. We defined the melting point, Tm, as the
temperature at which fN,50% ¼ 0.5. We had an additional
measure for determining Tm from computing the heat
capacity at constant volume:
CV ¼dE
dT
� �V
¼1
kT 2kðE2 kElÞ2l; ð4Þ
where T is the temperature, E is the total energy of the
system and k is the Boltzmann constant. We identified Tmby locating a sharp increase in the plot of the heat capacity
versus temperature. We found melting temperatures in
each simulation trial and reported an average Tm as a mean
of the Tm from these trials.
As the temperature was lowered, the strands hybridised
and the functionalised particles assemble into a cluster. We
defined a cluster as a collection of two or more particles
with minimum of one base pair hybridised between DNA
strands of adjacent nanoparticles. Free nanoparticles are
those whose grafted ssDNA have not hybridised with any
strand on another particle at that time step. We tracked the
average number of free nanoparticles as a function of
temperature. We defined the assembly/dissociation tran-
sition temperature, Td, as the temperature at which the
number of free nanoparticles was half the total number of
particles.
2.2.2 Structure
For each nanoparticle, we calculated a coordination
number, Z, defined as the average number of particle
neighbours the nanoparticle has within the cluster. Two
particles are neighbours if they have at least one base pair
hybridised between their DNA strands. The coordination
number curve at each temperature is the distribution of the
number of neighbours each nanoparticle has in a given
system at that temperature. We averaged the coordination
number distribution to obtain kZl of the system at a specific
temperature. To understand whether the average number of
neighbours arises from multiple strands partially hybridis-
ing or a few strands completely hybridising, we calculated
the average number of strands per particle which were
(partially or fully) hybridised at each temperature by
multiplying the f50% with the total number of strands on
each particle for that system. We also calculated the
nanoparticle–nanoparticle radial distribution function g(r)
and nanoparticle–nanoparticle number profile N(r) in the
simulation box. We calculated the average shape of the
cluster at varying temperatures using the relative shape
anisotropy (RSA) parameter [33]. The RSA of a cluster is
0 when the particles are arranged perfectly isotropic (i.e.
spherical symmetry), and is 1 when the particles are
perfectly anisotropic (i.e. rod like) in their arrangement.
We applied the RSA calculation to the coordinates of the
particles of a cluster and not on the monomer beads of the
DNA. We first translated the centre of mass of the
particles’ coordinates of a cluster to the origin and
calculated the average radius of gyration tensor for a
cluster containing N particles:
S ¼1
N
XNi¼1
rirTi ; ð5Þ
where ri is the translated coordinate vector of particle i,
and riT is the transpose of this coordinate vector. Then S is
diagonalised as
S ¼ V TSV; ð6Þ
where V is a 3 £ 3 matrix with columns that correspond to
the three eigenvectors of S. The traceless part of S is then
calculated:
S ¼ S21
3trðSÞI; ð7Þ
where I is the 3 £ 3 identity matrix and tr(S) is the trace ofS. The RSA of the cluster of particles is then defined as
RSA ¼3trðSSÞ
2trðSÞ2: ð8Þ
We note that because our systems were at significantly low
concentrations, these RSA calculations were conducted on
A. Seifpour et al.4
Dow
nloa
ded
by [
Mou
nt A
lliso
n U
nive
rsity
0L
ibra
ries
] at
05:
33 0
5 M
ay 2
013

small values of N ( ¼ 10–20 particles). RSA calculations
are significantly more reliable when applied to systems
with large N. Therefore, we restricted our RSA analysis to
trends within a system with changing temperatures, rather
than placing quantitative emphasis on RSA variation
between systems with varying parameters.
We also calculated the mean square displacement of
the nanoparticle centres (not the strands) in each system at
each temperature to understand the relative mobility of the
particles in the system before and after cluster formation.
2.2.3 Parameters
We varied the G/C content of strands from 100%, 83%,
67%, 50%, 33% to 17% in strands of length Nbases ¼ 12, as
shown in Table 1. For a G/C content ,100%, the
remaining bases are Adenine (A), serving as spacers. We
also varied the G/C placement along the strand to the outer
(away from the particle surface), middle or inner portion of
the strand relative to the particle surface shown in Figure 2
and Table 1. We studied two particle diameters,
D ¼ 2 £ smon and 5 £ smon, with smon , 1 nm as
described in the model section. We also varied the number
of grafts on the particle surface and the concentration of
DNA-functionalised nanoparticles (Table 2).
3. Results
3.1 Effect of number of grafted DNA strands at 100%G/C content
Figure 3 shows the effect of varying the number of DNA
strands (while maintaining low grafting density) on the
thermodynamics and cluster structure for 10 particles in a
(100 nm)3 simulation box, with particles of diameter
D ¼ 5 nm each with Ng ¼ 4, 6 or 8 number of strands of
length Nbases ¼ 12 with 100% G/C content arranged in a
diblock (G6C6) sequence. For all systems, as the
temperature decreased, the DNA-grafted nanoparticles
assembled into a cluster. The normalised melting curves in
Figure 3(a) show that as grafting density increases, the
melting curves and Tm (identified by the vertical dashed
lines in Figure 3(a)) shift to higher temperatures. In the
supplementary information (Table S1), we tabulated the
Tm determined from heat capacity data, and they showed
agreement with the Tm in Figure 3(a). The shift to higher
temperatures with increasing the number of strands has
been observed experimentally before (although at
relatively higher grafting densities) [14] and can be
explained as follows. As the number of strands increase,
there is a higher enthalpic gain from hybridisation of
complementary bases and a lower entropic loss from
hybridisation due to higher crowding between the higher
number of strands in the unhybridised state. The plot of the
number of free nanoparticles as a function of temperature
in Figure 3(b) shows that the temperature by which the
number of free nanoparticles decreases abruptly, defined
as the cluster assembly/dissociation transition temperature,
Td, corresponds to the Tm in these systems as expected
because the hybridisation of the grafted strands leads to an
assembly of particles.
Next, we characterised the structure within the
assembled nanocluster as a function of the number of
strands. Figure 3(c) shows the average coordination
number, kZl, within the system at each temperature. At a
constant temperature below the Td, the average number of
neighbours for every particle, kZl, in the cluster increases
with increasing grafting density. A neighbour to a particle
Table 1. Grafted strand sequences with the left-most base grafted to the particle surface.
Sequence
G/C content (%) Outer block G/C Middle block G/C Inner block G/C
100 GGGGGGCCCCCC – –67 AAAAGGGGCCCC AAGGGGCCCCAA GGGGCCCCAAAA50 AAAAAAGGGCCC AAAGGGCCCAAA GGGCCCAAAAAA33 AAAAAAAAGGCC AAAAGGCCAAAA GGCCAAAAAAAA17 AAAAAAAAAAGC AAAAAGCAAAAA GCAAAAAAAAAA
Figure 2. Schematic of oligonucleotide sequences with varyingG/C placement indicated by a grey-dashed box. We show only asingle strand per particle for clarity.
Molecular Simulation 5
Dow
nloa
ded
by [
Mou
nt A
lliso
n U
nive
rsity
0L
ibra
ries
] at
05:
33 0
5 M
ay 2
013

is defined as another particle with minimum one base pair
hybridised between their DNA strands. One could consider
the number of neighbours of a particle as its effective
‘valency’. Thus, there is an increase in ‘valency’ with
increasing the number of strands as one would expect;
however, the ‘valency’ is not equal to the number of
strands even at these low grafting densities. The inset in
Figure 3(c) shows that the average number of strands
hybridised (at least 50%) per particle, ksbl, correlates withkZl, confirming that the number of strands that hybridise
dictate the number of neighbours in a cluster. The number
of strands hybridised is less than the number of grafts
available; the average number of strands hybridised per
particle at Tlow ¼ 0.08 for Ng ¼ 4, 6 and 8 strands are
2.2 ^ 0.1, 2.9 ^ 0.1 and 4.1 ^ 0.2 strands, respectively.
This is because as the number of strands increases, so does
the crowding, thus making it more difficult for a particle to
have all Ng strands hybridise to form Ng neighbours.
As the temperature is reduced and as more particles
join the clusters, the shape of the clusters shifts from
anisotropic (high kRSAl at low kNl) to isotropic (low
kRSAl at high kNl) (see supplementary information). We
observed that as number of strands increased, the shift in
clusters from high to low temperature followed a similar
path for kRSAl and kNl, resulting in clusters at Tlowgenerally composed of all of the nanoparticles and at a low
kRSAl (relatively isotropic).
At Tlow ¼ 0.08 (Figure 3(d)), for all three number of
strands, the first peak in r 2g(r) occurs at r–D ,11 nm.
This means particles that hybridise with each others’
strands are spaced at approximately the length of the
strands for strands with 100% G/C composition and
diblock sequence (G6C6) because of the complete
hybridisation between surface-G6C6 and complementary
strand C6G6-surface. Additional results in supplementary
information further confirmed that the strand length
determines the inter-particle spacing within the clusters as
Table 2. Parameters varied: (a) number of grafts, Ng, and corresponding grafting density s (chains/nm2) for each particle size and (b andc) concentration of DNA-functionalised nanoparticles.
(a) Number of grafts (Ng) Grafting density, s (chains/nm2)D ¼ 2 nm D ¼ 5 nm
1 0.08 0.014 – 0.056 – 0.088 0.64 0.10
(b) Concentration, c (particles/nm3) for Ng . 1 Number of nanoparticles Simulation box0.00001 10 (100 nm)3
0.00002 20 (100 nm)3
0.00016 20 (50 nm)3
0.00032 40 (50 nm)3
(c) Concentration, c (particles/nm3) for Ng ¼ 1 Number of nanoparticles Simulation box0.00013 2 (25 nm)3
0.00064 10 (25 nm)3
Figure 3. (a) Normalised melting curves, (b) number of freenanoparticles, (c) average coordination number, kZl, and (inset)average number of strands bonded per particle, ksbl, as a functionof reduced temperature, T*, for 10 particles, in a (100 nm)3 box,each of diameter D ¼ 5 nm and grafted with Ng ¼ 4 (red triangle,dotted line), 6 (blue circle, dashed line) and 8 (black square, solidline) strands of 12 bases each with a diblock (G6C6) sequence.Vertical dashed lines in (a) indicate the Tm for each system. (d)Radial distribution function at Tlow ¼ 0.08, r 2g(r) for Ng ¼ 6 and8 is shifted by 5000 and 10,000 units on the y-axis from r 2g(r) forNg ¼ 4 for clarity (Colour online).
A. Seifpour et al.6
Dow
nloa
ded
by [
Mou
nt A
lliso
n U
nive
rsity
0L
ibra
ries
] at
05:
33 0
5 M
ay 2
013

expected which is in agreement with some past work [23].
We have studied other G/C arrangements – (G1C1) and
(G2C2) – in strands with 100% G/C content and show their
effect on inter-particle distances (see supplementary
Figure S6); however, for the remainder of this paper we
focused only on diblock sequence.
3.2 Effect of G/C content and particle size
We next determined at a constant number of strands, the
effect of the G/C content (100%, 67%, 50%, 33% and 17%
G/C) arranged in a diblock fashion with the G/C bases
placed in the outermost section of the strand (Figure 2(a)).
The remaining spacer portion of the strand made of
Adenine nucleotides did not hybridise during assembly.
We studied 10 particles of diameter D ¼ 5 nm, Nbases ¼ 12
and Ng ¼ 8 (s ¼ 0.10 chains/nm2) in a (100 nm)3 simu-
lation box. From the normalised melting curve (Figure
4(a)) and the plot of the number of free nanoparticles
versus temperature (Figure 4(b)), we found that as the G/C
content increased, the melting temperature, Tm, and cluster
dissociation temperature, Td, increased. This was expected
because as G/C content increases, there is a higher
enthalpic drive for hybridisation and assembly. The trend
in Figure 4(a) and (b) also suggests that at each
temperature, there is a minimum G/C content needed for
assembly and cluster formation. For example, at
T* ¼ 0.10, particles of size D ¼ 5 nm with 8 strands of
length 12 bases require .33% G/C content for cluster
formation. Past experimental work has also shown that
there is a minimum G/C base pairing necessary to induce
clustering [30]. At a temperature, the enthalpic gain
(dependent on G/C content) has to overcome the entropic
loss upon hybridisation and assembly for assembly to
occur. Because the entropic losses are dependent on
particle size, strand length, G/C placement in the strand
and grafting density, the enthalpic gain needed for
assembly is also expected to depend on the above
parameters.
Next, we looked at the effect of G/C content as a
function of particle size by comparing results from
D ¼ 5 nm (Figure 4) and D ¼ 2 nm (Figure 5). First, the
melting temperature increased on going from D ¼ 5 nm
(Figure 4(a)) to D ¼ 2 nm (Figure 5(a)) at higher G/C
contents. Similar trends were observed in the number of
free particles plot (Figures 4(b) and 5(b)). At a lower G/C
content (e.g. 17% and 33% G/C content), we did not
observe much difference between the two particle sizes.
The fact that most of the differences are evident only at
higher G/C contents can be explained as follows: at a high
G/C content, strands hybridise completely, and as a result,
the particles in the cluster are tightly packed (lower inter-
particle distances in Figure 6 and supplementary Tables
S3–S4 and supplementary Figures S7 and S8) in the
assembled state. In such conditions, the differences in
translational entropy loss with varying particle size are
significant. At a low G/C content, the hybridised portion of
the strands is small leading to larger spacing between
particles (Figure 6(a) and (b)), and as a result, the particles
have greater mobility within clusters and within the system
(see supplementary information). In such conditions, the
differences in translational entropy loss with varying
particle size are negligible, leading to negligible
differences in cluster dissociation temperature between
the two particle sizes.
In the above discussion by keeping the number of
strands the same and changing the particle size, we were
also changing the grafting density. To eliminate the effect
Figure 4. (a) Normalised melting curves and (b) number of freenanoparticles as a function of reduced temperature, T*, for 10particles in a (100 nm)3 box, each of diameter D ¼ 5 nm andgrafted with Ng ¼ 8 strands of 12 bases each with a sequence asshown in the legend. Error bars are calculated from the average ofthree trials.
Molecular Simulation 7
Dow
nloa
ded
by [
Mou
nt A
lliso
n U
nive
rsity
0L
ibra
ries
] at
05:
33 0
5 M
ay 2
013

of grafting density and isolate the role of particle diameter
on the G/C content effects, we investigated hybridisation
in systems with the same number of particles as above
(10 particles in the same simulation box size), but with
only a single strand. In Table 3 for 10 particles with a
single DNA strand, at 100% GC, we observed an increase
in Td or Tm with decreasing particle size, indicating that the
entropic loss upon hybridisation is lower for smaller
particles. When the G/C content decreased, the increase in
Table 3. Melting temperatures determined from the melting curves for the systems described in the first two rows.
D ¼ 5 nm D ¼ 2 nm
10 NP, Ng ¼ 8 10 NP, Ng ¼ 1 2 NP, Ng ¼ 1 10 NP, Ng ¼ 8 10 NP, Ng ¼ 1 2 NP, Ng ¼ 1
100% 0.107 ^ 0.002 0.125 ^ 0.001 0.125 ^ 0.003 0.115 ^ 0.001 0.130 ^ 0.001 0.131 ^ 0.00367% 0.105 ^ 0.001 0.120 ^ 0.001 0.120 ^ 0.003 0.109 ^ 0.000 0.120 ^ 0.002 0.127 ^ 0.00550% 0.101 ^ 0.001 0.112 ^ 0.001 0.111 ^ 0.002 0.102 ^ 0.001 0.113 ^ 0.001 0.122 ^ 0.00633% 0.093 ^ 0.001 0.100 ^ 0.002 0.098 ^ 0.003 0.093 ^ 0.001 0.101 ^ 0.001 0.112 ^ 0.00717% 0.078 ^ 0.001 0.081 ^ 0.001 0.082 ^ 0.001 0.078 ^ 0.000 0.082 ^ 0.001 0.090 ^ 0.004
Notes: For Ng ¼ 8 systems, the number of particles is 10, particle diameter isD ¼ 5 nm orD ¼ 2 nm, each grafted withNg ¼ 8 strands of 12 bases with G/Ccontent shown in the first column. Error bars are calculated from the average of three trials. For Ng ¼ 1 systems, the number of particles is shown in thesecond row each grafted with Ng ¼ 1 strand of 12 bases with G/C content shown in the first column. Error bars are calculated from the average of 25 trials.Simulation box sizes are listed in supplementary information.
Figure 5. (a) Normalised melting curves and (b) number of freenanoparticles as a function of reduced temperature, T*, for 10particles in a (100 nm)3 box, each of diameterD ¼ 2nmand graftedwith Ng ¼ 8 strands of 12 bases each with a sequence as shown inthe legend. Error bars are calculated from the average of three trials.
Figure 6. Radial distribution function at T* ¼ 0.07 for 10particles in a (100 nm)3 box, each of diameter (a) D ¼ 5 nm and(b) D ¼ 2 nm and grafted with Ng ¼ 8 strands of 12 bases withthe following G/C contents: 100% (particle-G6C6) (purple opencircles, dashed line), 67% ( particle-A4G4C4) (green opensquares, solid line), 50% ( particle-A6G3C3) (red-filledtriangles, dotted line), 33% ( particle-A8G2C2) (blue-filledcircle, dashed line) and 17% ( particle-A10GC) (black-filledsquare, solid line). Error bars are calculated from the average ofthree trials (Colour online).
A. Seifpour et al.8
Dow
nloa
ded
by [
Mou
nt A
lliso
n U
nive
rsity
0L
ibra
ries
] at
05:
33 0
5 M
ay 2
013

Td or Tm became negligible. This agreed with the trends
discussed above for systems with 10 particles, but with
higher number of grafted strands.
If we decreased the number of particles to two particles
with one DNA strand grafted on each particle (Table 3 and
Figure 7) as particle size decreased, Td or Tm increased for
all G/C contents. We noted that in this system, the two
particles hybridised to form dimers. At this low particle
limit, the differences in entropy loss upon dimer
formation, are significant for the two particle sizes, with
the smaller particle losing less translational entropy upon
dimer formation, and as a result having higher Td or Tm
than the larger particle.
3.3 Effect of G/C placement along the strand
For G/C content below 100%, the placement of the G/C
bases along the strands can affect the thermodynamics and
structural aspects of the assembly. The G/C diblock can be
placed in three different ways (see Figure 2 and Table 1):
inner block where G/C bases are placed closest to the
particle surface ( particle-GGGCCCA6), middle block
where the G/C bases are in the centre of the strand
( particle-A3GGGCCCA3) and outer block where the G/C
bases are placed farthest from the particle surface
( particle-A6GGGCCC). Figure 8 shows the effect of G/
C placement in a system of 10 particles of diameter
D ¼ 5 nm with 8 grafts each of length 12 bases with 50%
G/C content. Supplementary figures show the correspond-
ing results for 67%, 33% and 17% G/C content. We
observed similar trends for other G/C content as discussed
below, with the nanoparticles having a decreasing
propensity for cluster formation with decreasing G/C
content and the effect being enhanced as G/C placement is
moved inward along a strand. For 50% G/C content, as we
Figure 7. Melting curves as a function of reduced temperature,T*, for two particles, each of diameter (a) D ¼ 5 nm and(b) D ¼ 2 nm, grafted with Ng ¼ 1 strand of 12 bases each with asequence as shown in the legend. Simulation box is (25 nm)3 forall G/C contents except for 17% in which the simulation box is(50 nm)3. Vertical dashed lines indicate Tm for each system. Errorbars are calculated from the average of 25 trials.
Figure 8. (a) Number of free nanoparticles and (b) averagecoordination number, kZl, as a function of reduced temperaturefor 10 particles in a (100 nm)3 box, each of diameter D ¼ 5 nmand grafted with Ng ¼ 8 strands of 12 bases with 50% G/Ccontent placed in the outer block ( particle-A6G3C3) (red-filledtriangles, dashed line), middle block ( particle-A3G3C3A3) (blue-filled circle, dashed line) or inner block ( particle-G3C3A6) (blacksolid square, solid line). (c) Radial distribution function atTlow ¼ 0.07. Error bars are calculated from the average of threetrials (Colour online).
Molecular Simulation 9
Dow
nloa
ded
by [
Mou
nt A
lliso
n U
nive
rsity
0L
ibra
ries
] at
05:
33 0
5 M
ay 2
013

moved the G/C bases from the outer to middle to inner
placement, we observed a decrease in propensity for
cluster formation. This is seen in Figure 8(a) where for the
inner-most placement, the number of free nanoparticles is
non-zero at the lowest temperature (and melting
temperature not observed in the temperature range we
studied, Table 4). This is because when the G/C bases are
placed close to the particle surface (inner placement), the
hybridisation to a complementary inner block on another
particle is sterically hindered by the outer spacer
nucleotides of the strands. In contrast, the middle and
outer placements have significantly lower steric hindrance
to cluster formation. In addition, in case of inner
placement, the clusters that do form have kZl ,1 (Figure
8(b)) in contrast to outer and middle block strands where
the G/C bases’ placement favours hybridisation with
multiple neighbours. The radial distribution function in
Figure 8(c) shows that the inter-particle distances between
nearest neighbours in the cluster increase as the G/C
placement moves outward along the strand as expected. In
the few cases in which the inner G/C placement forms
clusters, the particles are spaced almost at contact, with
inter-particle distances,1 nm. The middle G/C placement
leads to the inter-particle distances of ,11 nm (base
pairing 6 nucleotides þ6 nucleotides long spacer).
Similarly, outer G/C placement leads to an inter-particle
spacing of ,16 nm (base pairing 6 nucleotides þ12
nucleotide long spacer).
Clearly, the inner G/C placement and 50% G/C content
showed the lowest propensity for assembly in Figure 8.
Next, in Figure 9, we observed how this behaviour
changed for other G/C contents for the inner placement.
We found that melting temperature decreased as G/C
content decreased (Figure 9(a)), because the enthalpic
drive for assembly decreases with decreasing G/C content.
From the number of free nanoparticles at lowest T* (Figure
9(b)) we observed that the systems with G/C
content . 50% have higher propensity to form clusters,
with cluster formation being minimal for 33–50% and
absent entirely for 17%. As for the structure, we observed
that at higher G/C contents, clusters have a higher number
of neighbours (despite the same number of grafted strands
in all systems) (Figure 9(c)) and clearly defined inter-
particle distances (Figure 9(d)), whereas the lower G/C
contents were not able to form clusters (low or 0 number of
neighbours in Figure 9(c)) and exhibited lack of order in
nanoparticle organisation as shown in Figure 9(d).
So far, we have discussed the effect of the G/C
placement when the G and C nucleotides are positioned
contiguously in the strand. Next, we present results in
which the G bases and the C bases are placed apart in the
strand. The sequence ( particle-G3A6C3), in which the G
and C bases are placed at the extremes of the strand, has
decreased propensity for cluster formation compared with
outer block placement ( particle-A6G3C3) (supplementary
Figure S12). In contrast, the system where the G3C3
contiguous block is in the middle of the strand ( particle-
A3G3C3A3) and the system where G and C bases are at the
extremes of the strand ( particle-G3A6C3) hybridise
similarly because both sequences require full alignment
of strands for complete hybridisation of the G and C
nucleotides (see supplementary Figure S13). But the
middle block G/C sequences have a higher cluster
dissociation temperature than the G/C at the extremes of
strands because the extremes of strands sequences undergo
a greater entropic loss upon hybridisation. The fact that the
placement of the hybridising bases, together or apart,
affects the cluster formation suggests that a minimum
contiguous block of hybridising bases is necessary to
favour strand hybridisation, and as a result nanoparticle
assembly.
3.4 Effect of particle concentration
Although all of the above results are at one dilute
concentration, c ¼ 0.00001 particles/nm3 (10 particles in a
(100 nm)3 simulation box), to examine how the above
results are affected by changing the dilute concentrations,
we also simulated at c ¼ 0.00002, c ¼ 0.00016 and
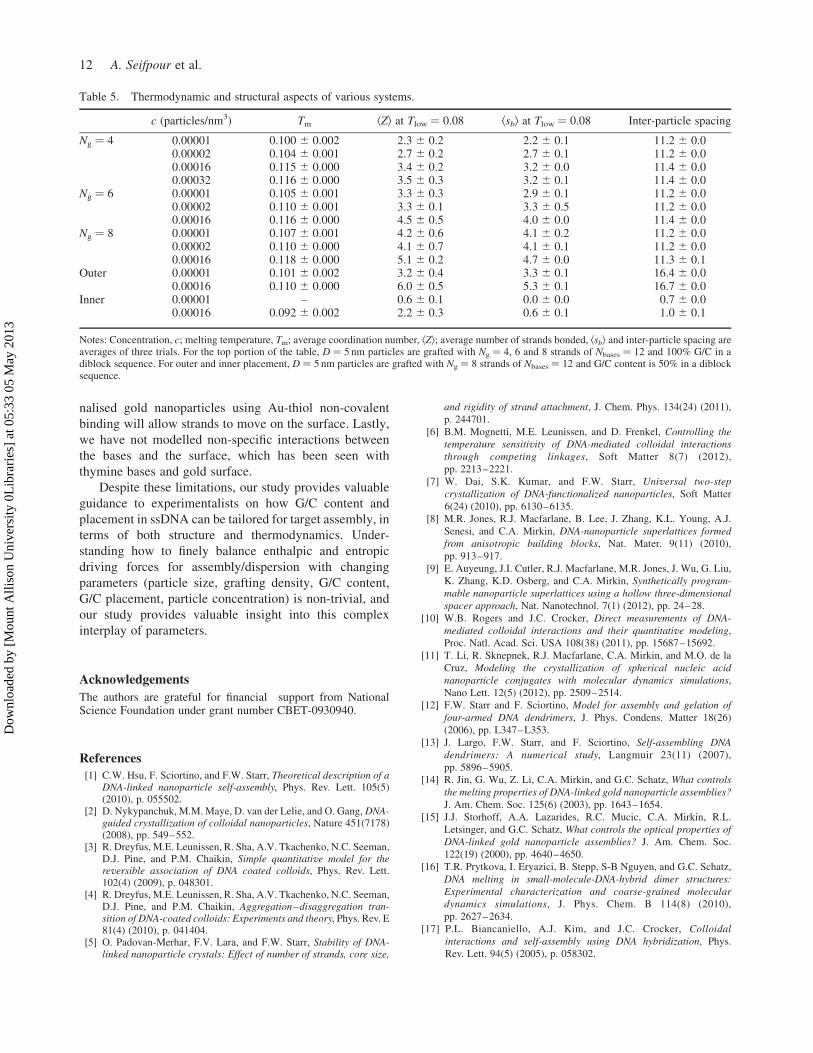
c ¼ 0.00032 particles/nm3 (see Table 2). Table 5 shows
that as concentration increases, Tm and Td increase. As
concentration increased, the number of bases that can
hybridise increased (higher enthalpic gain upon assembly)
and the crowding increased (lower entropic loss upon
assembly). The average number of neighbours and the
Table 4. Melting temperatures determined from the melting curves for the systems described in the first two rows.
D ¼ 5 nm D ¼ 2 nm
10 NP, Ng ¼ 8 10 NP, Ng ¼ 1 2 NP, Ng ¼ 1 10 NP, Ng ¼ 8 10 NP, Ng ¼ 1 2 NP, Ng ¼ 1
Outer 0.101 ^ 0.001 0.112 ^ 0.001 0.111 ^ 0.002 0.102 ^ 0.001 0.113 ^ 0.001 0.122 ^ 0.006Middle 0.096 ^ 0.001 0.109 ^ 0.001 0.115 ^ 0.015 0.099 ^ 0.001 0.110 ^ 0.001 0.109 ^ 0.002Inner – – – – – –
Notes: For Ng ¼ 8 systems, the number of particles is 10, particle diameter is D ¼ 5 nm or D ¼ 2 nm, each grafted with Ng ¼ 8 strands of 12 bases of 50%G/C content with G/C placement shown in the first column. Error bars are calculated from the average of three trials. For Ng ¼ 1 systems, the number ofparticles is shown in the second row, each grafted with Ng ¼ 1 strand of 12 bases of 50% G/C content and G/C placement shown in the first column. Errorbars are calculated from the average of 25 trials. Simulation box sizes are listed in supplementary information.
A. Seifpour et al.10
Dow
nloa
ded
by [
Mou
nt A
lliso
n U
nive
rsity
0L
ibra
ries
] at
05:
33 0
5 M
ay 2
013

average number of strands hybridised, however, appeared
to reach a maximum (confirmed in the Ng ¼ 4 system at
the two highest concentrations). As one would expect, the
inter-particle spacing is invariant with increasing concen-
tration for all systems because the strand design, not how
many particles are present, dictates how far nanoparticles
are spaced in a cluster. For 50% G/C content and outer
block placement, as concentration increased, the number
of strands hybridised and nanoparticle neighbours
increased. Placing the hybridising bases on the outer
portion of the strand for a system with higher
concentration increased the likelihood of bonding because
enthalpically favourable contacts can form with minimal
steric hindrance to the strands. For inner block placement
of G/Cs, although the lowest concentration led to minimal
cluster formation, an increase in concentration helped
strands overcome the entropic loss of close packing by the
enthalpic gain of hybridisation (see Table 5 and
supplementary Figure S14).
4. Conclusion
We have studied using molecular dynamics simulations
systems of DNA-functionalised nanoparticles that assem-
ble through hybridisation of the grafted DNA strands and
demonstrated how the composition of the grafted DNA
strand (G/C content and placement of the G/C along the
strand) affects assembly thermodynamics and structure as
a function of ssDNA grafting density and particle size.
Given a particle diameter and grafting density, the
following design rules can be observed to obtain a target
cluster structure or target cluster association/dissociation
temperature. To increase the inter-particle spacing within
an assembled cluster: (i) at constant strand length,
decrease the G/C content and place the G/C on the part
of the strand farthest from the surface of the particle or (ii)
at constant G/C content and outer most placement of G/C
bases, increase the strand length. To reduce the sizes of the
cluster or the propensity of cluster formation, one could
reduce the G/C content and shift the G/C bases closer to
the particle surface, placing the spacers on the outside
portion of the strand. To increase the cluster dissociation
temperature, one could increase the G/C content of the
strands, or at a constant G/C content, shift the G/C bases to
the outer portion of the strand.
We noted a few limitations of the model used in this
study. One limitation is that these systems mimic cases in
which the electrostatic interactions are completely
screened, making it difficult for us to replicate
experimental findings on the effect of salt concentration
on the assembly. Furthermore, strand flexibility should
increase in the presence of higher salt concentration
affecting how the ssDNA facilitates assembly, a feature we
were not able to capture with this model. Following the
model proposed by Sciortino and colleagues [12,13], we
expected to capture the essential equilibrium features of
DNA hybridisation-directed nanoparticle assembly in
conditions in which electrostatic interactions are com-
pletely screened [34]. Another limitation is that the DNA
strands in our model are fixed at specific locations on the
nanoparticle surface, whereas synthesis of DNA-functio-
Figure 9. (a) Melting curves (not normalised), (b) number offree nanoparticles and (c) average coordination number as afunction of reduced temperature, T*, for 10 particles in a(100 nm)3 box, each of diameter D ¼ 5 nm and grafted withNg ¼ 8 strands of 12 bases each with a sequence as shown in thelegend. (d) Radial distribution function at Tlow ¼ 0.07. Error barsare calculated from the average of three trials.
Molecular Simulation 11
Dow
nloa
ded
by [
Mou
nt A
lliso
n U
nive
rsity
0L
ibra
ries
] at
05:
33 0
5 M
ay 2
013
nalised gold nanoparticles using Au-thiol non-covalent
binding will allow strands to move on the surface. Lastly,
we have not modelled non-specific interactions between
the bases and the surface, which has been seen with
thymine bases and gold surface.
Despite these limitations, our study provides valuable
guidance to experimentalists on how G/C content and
placement in ssDNA can be tailored for target assembly, in
terms of both structure and thermodynamics. Under-
standing how to finely balance enthalpic and entropic
driving forces for assembly/dispersion with changing
parameters (particle size, grafting density, G/C content,
G/C placement, particle concentration) is non-trivial, and
our study provides valuable insight into this complex
interplay of parameters.
Acknowledgements
The authors are grateful for financial support from NationalScience Foundation under grant number CBET-0930940.
References
[1] C.W. Hsu, F. Sciortino, and F.W. Starr, Theoretical description of aDNA-linked nanoparticle self-assembly, Phys. Rev. Lett. 105(5)(2010), p. 055502.
[2] D. Nykypanchuk, M.M. Maye, D. van der Lelie, and O. Gang, DNA-guided crystallization of colloidal nanoparticles, Nature 451(7178)(2008), pp. 549–552.
[3] R. Dreyfus, M.E. Leunissen, R. Sha, A.V. Tkachenko, N.C. Seeman,D.J. Pine, and P.M. Chaikin, Simple quantitative model for thereversible association of DNA coated colloids, Phys. Rev. Lett.102(4) (2009), p. 048301.
[4] R. Dreyfus, M.E. Leunissen, R. Sha, A.V. Tkachenko, N.C. Seeman,D.J. Pine, and P.M. Chaikin, Aggregation–disaggregation tran-sition of DNA-coated colloids: Experiments and theory, Phys. Rev. E81(4) (2010), p. 041404.
[5] O. Padovan-Merhar, F.V. Lara, and F.W. Starr, Stability of DNA-linked nanoparticle crystals: Effect of number of strands, core size,
and rigidity of strand attachment, J. Chem. Phys. 134(24) (2011),
p. 244701.
[6] B.M. Mognetti, M.E. Leunissen, and D. Frenkel, Controlling thetemperature sensitivity of DNA-mediated colloidal interactions
through competing linkages, Soft Matter 8(7) (2012),
pp. 2213–2221.
[7] W. Dai, S.K. Kumar, and F.W. Starr, Universal two-step
crystallization of DNA-functionalized nanoparticles, Soft Matter
6(24) (2010), pp. 6130–6135.[8] M.R. Jones, R.J. Macfarlane, B. Lee, J. Zhang, K.L. Young, A.J.
Senesi, and C.A. Mirkin, DNA-nanoparticle superlattices formed
from anisotropic building blocks, Nat. Mater. 9(11) (2010),
pp. 913–917.
[9] E. Auyeung, J.I. Cutler, R.J. Macfarlane, M.R. Jones, J. Wu, G. Liu,K. Zhang, K.D. Osberg, and C.A. Mirkin, Synthetically program-
mable nanoparticle superlattices using a hollow three-dimensional
spacer approach, Nat. Nanotechnol. 7(1) (2012), pp. 24–28.
[10] W.B. Rogers and J.C. Crocker, Direct measurements of DNA-
mediated colloidal interactions and their quantitative modeling,Proc. Natl. Acad. Sci. USA 108(38) (2011), pp. 15687–15692.
[11] T. Li, R. Sknepnek, R.J. Macfarlane, C.A. Mirkin, and M.O. de la
Cruz, Modeling the crystallization of spherical nucleic acid
nanoparticle conjugates with molecular dynamics simulations,
Nano Lett. 12(5) (2012), pp. 2509–2514.[12] F.W. Starr and F. Sciortino, Model for assembly and gelation of
four-armed DNA dendrimers, J. Phys. Condens. Matter 18(26)
(2006), pp. L347–L353.
[13] J. Largo, F.W. Starr, and F. Sciortino, Self-assembling DNA
dendrimers: A numerical study, Langmuir 23(11) (2007),
pp. 5896–5905.[14] R. Jin, G. Wu, Z. Li, C.A. Mirkin, and G.C. Schatz, What controls
the melting properties of DNA-linked gold nanoparticle assemblies?
J. Am. Chem. Soc. 125(6) (2003), pp. 1643–1654.
[15] J.J. Storhoff, A.A. Lazarides, R.C. Mucic, C.A. Mirkin, R.L.
Letsinger, and G.C. Schatz, What controls the optical properties ofDNA-linked gold nanoparticle assemblies? J. Am. Chem. Soc.
122(19) (2000), pp. 4640–4650.
[16] T.R. Prytkova, I. Eryazici, B. Stepp, S-B Nguyen, and G.C. Schatz,
DNA melting in small-molecule-DNA-hybrid dimer structures:
Experimental characterization and coarse-grained moleculardynamics simulations, J. Phys. Chem. B 114(8) (2010),
pp. 2627–2634.
[17] P.L. Biancaniello, A.J. Kim, and J.C. Crocker, Colloidal
interactions and self-assembly using DNA hybridization, Phys.
Rev. Lett. 94(5) (2005), p. 058302.
Table 5. Thermodynamic and structural aspects of various systems.
c (particles/nm3) Tm kZl at Tlow ¼ 0.08 ksbl at Tlow ¼ 0.08 Inter-particle spacing
Ng ¼ 4 0.00001 0.100 ^ 0.002 2.3 ^ 0.2 2.2 ^ 0.1 11.2 ^ 0.00.00002 0.104 ^ 0.001 2.7 ^ 0.2 2.7 ^ 0.1 11.2 ^ 0.00.00016 0.115 ^ 0.000 3.4 ^ 0.2 3.2 ^ 0.0 11.4 ^ 0.00.00032 0.116 ^ 0.000 3.5 ^ 0.3 3.2 ^ 0.1 11.4 ^ 0.0
Ng ¼ 6 0.00001 0.105 ^ 0.001 3.3 ^ 0.3 2.9 ^ 0.1 11.2 ^ 0.00.00002 0.110 ^ 0.001 3.3 ^ 0.1 3.3 ^ 0.5 11.2 ^ 0.00.00016 0.116 ^ 0.000 4.5 ^ 0.5 4.0 ^ 0.0 11.4 ^ 0.0
Ng ¼ 8 0.00001 0.107 ^ 0.001 4.2 ^ 0.6 4.1 ^ 0.2 11.2 ^ 0.00.00002 0.110 ^ 0.000 4.1 ^ 0.7 4.1 ^ 0.1 11.2 ^ 0.00.00016 0.118 ^ 0.000 5.1 ^ 0.2 4.7 ^ 0.0 11.3 ^ 0.1
Outer 0.00001 0.101 ^ 0.002 3.2 ^ 0.4 3.3 ^ 0.1 16.4 ^ 0.00.00016 0.110 ^ 0.000 6.0 ^ 0.5 5.3 ^ 0.1 16.7 ^ 0.0
Inner 0.00001 – 0.6 ^ 0.1 0.0 ^ 0.0 0.7 ^ 0.00.00016 0.092 ^ 0.002 2.2 ^ 0.3 0.6 ^ 0.1 1.0 ^ 0.1
Notes: Concentration, c; melting temperature, Tm; average coordination number, kZl; average number of strands bonded, ksbl and inter-particle spacing areaverages of three trials. For the top portion of the table, D ¼ 5 nm particles are grafted with Ng ¼ 4, 6 and 8 strands of Nbases ¼ 12 and 100% G/C in adiblock sequence. For outer and inner placement, D ¼ 5 nm particles are grafted with Ng ¼ 8 strands of Nbases ¼ 12 and G/C content is 50% in a diblocksequence.
A. Seifpour et al.12
Dow
nloa
ded
by [
Mou
nt A
lliso
n U
nive
rsity
0L
ibra
ries
] at
05:
33 0
5 M
ay 2
013

[18] R.T. Scarlett, M.T. Ung, J.C. Crocker, and T. Sinno, A mechanisticview of binary colloidal superlattice formation using DNA-directedinteractions, Soft Matter 7(5) (2011), pp. 1912–1925.
[19] S.Y. Park, A.K.R. Lytton-Jean, B. Lee, S. Weigand, G.C. Schatz,and C.A. Mirkin, DNA-programmable nanoparticle crystallization,Nature 451(7178) (2008), pp. 553–556.
[20] C.H. Kiang, Phase transition of DNA-linked gold nanoparticles,Phys. A: Stat. Mech. Appl. 321(1–2) (2003), pp. 164–169.
[21] B.D. Smith, N. Dave, P.J.J. Huang, and J. Liu, Assembly of DNA-functionalized gold nanoparticles with gaps and overhangs in linkerDNA, J. Phys. Chem. C 115(16) (2011), pp. 7851–7857.
[22] Y. Sun, N.C. Harris, and C.H. Kiang, The reversible phasetransition of DNA-linked colloidal gold assemblies, Phys. A: Stat.Mech. Appl. 354 (2005), pp. 1–9.
[23] C.A. Mirkin, R.L. Letsinger, R.C. Mucic, and J.J. Storhoff, A DNA-based method for rationally assembling nanoparticles intomacroscopic materials, Nature 382(6592) (1996), pp. 607–609.
[24] A.P. Alivisatos, K.P. Johnsson, X. Peng, T.E. Wilson, C.J. Loweth,M.P. Bruchez, and P.G. Schultz, Organization of ‘nanocrystalmolecules’ using DNA, Nature 382(6592) (1996), pp. 609–611.
[25] D. Nykypanchuk, M.M. Maye, D. van der Lelie, and O. Gang, DNA-based approach for interparticle interaction control, Langmuir23(11) (2007), pp. 6305–6314.
[26] A.J. Kim, R. Scarlett, P.L. Biancaniello, T. Sinno, and J.C. Crocker,Probing interfacial equilibration in microsphere crystals formed byDNA-directed assembly, Nat. Mater. 8(1) (2009), pp. 52–55.
[27] V.T. Milam, A.L. Hiddessen, J.C. Crocker, D.J. Graves, and D.A.
Hammer, DNA-driven assembly of bidisperse, micron-sized
colloids, Langmuir 19(24) (2003), pp. 10317–10323.
[28] D.B. Lukatsky and D. Frenkel, Surface and bulk dissolution
properties, and selectivity of DNA-linked nanoparticle assemblies,
J. Chem. Phys. 122(21) (2005), p. 214904.
[29] N. Geerts and E. Eiser, DNA-functionalized colloids: Physical
properties and applications, Soft Matter 6(19) (2010),
pp. 4647–4660.
[30] S.J. Hurst, H.D. Hill, and C.A. Mirkin, ‘Three-dimensional
hybridization’ with polyvalent DNA-gold nanoparticle conjugates,
J. Am. Chem. Soc. 130(36) (2008), pp. 12192–12200.
[31] D. Frenkel and B. Smit, Understanding molecular simulation: From
algorithms to applications, Academic Press, San Diego, CA, 2002.
[32] G.J. Martyna, D.J. Tobias, and M.L. Klein, Constant pressure
molecular dynamics algorithms, J. Chem. Phys. 101(5) (1994),
pp. 4177–4189.
[33] D.N. Theodorou and U.W. Suter, Shape of unperturbed linear
polymers: polypropylene, Macromolecules 18(6) (1985),
pp. 1206–1214.
[34] J.C. Araque, A.Z. Panagiotopoulos, and M.A. Robert, Lattice model
of oligonucleotide hybridization in solution. I. Model and
thermodynamics, J. Chem. Phys. 134(16) (2011), p. 165103.
Molecular Simulation 13
Dow
nloa
ded
by [
Mou
nt A
lliso
n U
nive
rsity
0L
ibra
ries
] at
05:
33 0
5 M
ay 2
013