Embed Size (px)
Citation preview
Molecular Evolutionary Characterization of a V1R Subfamily
Unique to Strepsirrhine Primates
Anne D. Yoder1,*, Lauren M. Chan1,y, Mario dos Reis2,y, Peter A. Larsen1,y, C. Ryan Campbell1,Rodin Rasoloarison3,4, Meredith Barrett5, Christian Roos4, Peter Kappeler6, Joseph Bielawski7, andZiheng Yang2
1Department of Biology, Duke University2Department of Genetics, Evolution and Environment, University College London, London, United Kingdom3Departement de Biologie Animale, Universite d’Antananarivo, Antananarivo, Madagascar4Gene Bank of Primates and Primate Genetics Laboratory, German Primate Center (DPZ), Gottingen, Germany5UCSF Center for Health & Community6Behavioral Ecology and Sociobiology Unit, German Primate Center (DPZ), Gottingen, Germany7Department of Biology, Dalhousie University, Halifax, Nova Scotia, Canada
*Corresponding author: E-mail: [email protected] authors contributed equally to this work.
Accepted: December 29, 2013
Data deposition: The sequence data from this study have been deposited at GenBank under the accession KF271799–KF272802.
Abstract
Vomeronasal receptor genes have frequently been invoked as integral to the establishment and maintenance of species boundaries
among mammals due to the elaborate one-to-one correspondence between semiochemical signals and neuronal sensory inputs.
Here, we report the most extensive sample of vomeronasal receptor class 1 (V1R) sequences ever generated for a diverse yet
phylogenetically coherent group of mammals, the tooth-combed primates (suborder Strepsirrhini). Phylogenetic analysis confirms
our intensive sampling from a single V1R subfamily, apparently unique to the strepsirrhine primates. We designate this subfamily as
V1Rstrep. The subfamily retains extensive repertoires of gene copies that descend from an ancestral gene duplication that appears to
have occurred prior to the diversification of all lemuriform primates excluding the basal genus Daubentonia (the aye-aye). We refer to
the descendent clades as V1Rstrep-a and V1Rstrep-b. Comparison of the two clades reveals different amino acid compositions
corresponding to the predicted ligand-binding site and thus potentially to altered functional profiles between the two. In agreement
with previous studies of the mouse lemur (genus, Microcebus), the majority of V1Rstrep gene copies appear to be intact and under
strong positive selection, particularly within transmembrane regions. Finally, despite the surprisingly high number of gene copies
identified in this study, it is nonetheless probable that V1R diversity remains underestimated in these nonmodel primates and that
complete characterization will be limited until high-coverage assembled genomes are available.
Key words: G-protein-coupled receptors, lemurs, positive selection, olfaction, chemosensory genes, gene family evolution.
Introduction
The vomeronasal organ (VNO) is an ancient structure that
functions in chemosensation and was almost certainly present
in the ancestral tetrapod (Grus and Zhang 2009; Ubeda-
Banon et al. 2011; Brykczynska et al. 2013). Although the
morphological components of the vomeronasal system are
found only in tetrapods, genes encoding V1Rs are present in
the lamprey genome where they are expressed in the olfactory
organ, thus demonstrating their presence in the common
ancestor of all extant vertebrates (Grus and Zhang 2009). In
placental mammals, the VNO epithelium is dense with recep-
tor neurons that express genes sensitive to the detection of
pheromones and chemosignals from other species (Leinders-
Zufall et al. 2000; Zufall et al. 2002; Grus and Zhang 2004;
Tirindelli et al. 2009), which impact behavior and reproductive
status (Guzzo et al. 2010; Haga et al. 2010). The VNO system
in rodents confers the ability to recognize subtleties of sex,
strain, health, social, and reproductive status in conspecifics
GBE
� The Author(s) 2014. Published by Oxford University Press on behalf of the Society for Molecular Biology and Evolution.
This is an Open Access article distributed under the terms of the Creative Commons Attribution License (http://creativecommons.org/licenses/by/3.0/), which permits unrestricted reuse,
distribution, and reproduction in any medium, provided the original work is properly cited.
Genome Biol. Evol. 6(1):213–227. doi:10.1093/gbe/evu006 Advance Access publication January 6, 2014 213
by guest on March 11, 2014
http://gbe.oxfordjournals.org/D
ownloaded from
(Hurst 2009; Tirindelli et al. 2009; Silvotti et al. 2011).
Vomeronasal receptor genes are classified into two unrelated
gene families, the V1R and V2R receptors (Dulac and Axel
1995; Karunadasa et al. 2006; Grus and Zhang 2008), with
the identification of a potentially functional primate V1R first
made by Rodriguez et al. (2000). Along with other olfactory
system chemosensory genes, vomeronasal receptor genes are
classed as G protein-coupled receptors (Mombaerts 2004).
Hypotheses relating genotype to phenotype have recently
been tested in vivo (He et al. 2008; Isogai et al. 2011).
Investigators were able to create a neural map of the VNO
receptors in mouse, identifying the one-to-one correspon-
dence between chemosignal (ligand) and receptor response
for nearly one hundred VNO receptors (Isogai et al. 2011).
The Isogai et al. (2011) study confirmed the association of
large subsets of VNO receptors with recognition patterns of
genetic relatedness, physiological state, and reproductive
status in Mus.
The extent and complexity of the V1R gene family shows
extraordinary variation across the mammalian phylogenetic
tree, especially with regard to the proportion of intact (and
presumably functional) copies to pseudogenes (Young et al.
2010). For example, there are more than 200 intact V1R
copies in the mouse genome, but there appear to be none
in the macaque. The platypus (Ornithorhynchus anatinus)
shows an even greater repertoire of V1Rs, with more than
1,400 copies (Grus et al. 2007), though fewer than 20% of
these appear to be functional (Grus et al. 2007; Young
et al. 2010). Conversely, of the slightly more than 200
V1R copies observed in the mouse lemur genome (genus
Microcebus), nearly all appear to be intact (Young et al.
2010). Patterns of gene loss tightly correspond to morpho-
logical and behavioral indications of diminished or lost VNO
sensitivity. Mammals with elaborate and obviously functional
VNO morphologies tend to show large repertoires of VIR
genes with the converse also being true (Smith et al.
2002; Ohara et al. 2009; Young et al. 2010; Frasnelli
et al. 2011; Zhao et al. 2011).
The molecular evolutionary mechanisms driving this com-
plex pattern of interspecific variability in V1R and other che-
mosensory genes are believed to differentially combine rapid
rates of gene duplication, gene conversion, lineage-specific
expansions, deletions, and/or pseudogenization (Rodriguez
et al. 2002; Grus and Zhang 2004, 2008; Horth 2007;
Nozawa and Nei 2008; Kurzweil et al. 2009; Young et al.
2010). As a result, the distribution of V1Rs across mammals
indicates a remarkable pattern of “semi-private” alleles
wherein species-specific V1R subfamilies are common.
Indeed, Young et al. (2010) found that approximately 80%
of V1R clades are species specific. The mouse shows the larg-
est documented subfamily clade (Rodriguez et al. 2002) with
nearly 90 intact V1R loci that appear to have arisen via local
duplication events since the mouse diverged from rat, more
than 12 Ma (Lane et al. 2002; Shi et al. 2005).
Numerous ecological and evolutionary hypotheses have
been proposed to explain the interplay among pheromone
signal, genotypic diversity, and behavior. It has been hypoth-
esized that V1R complexity relates to activity pattern, with
nonvolant nocturnal mammals (i.e., nocturnal mammals ex-
cluding bats) presumed to have more ornate V1R repertoires
than diurnal mammals (Wang, Zhu, et al. 2010). Various
investigators have postulated that the relative diminishment
of the V1R complex in anthropoid primates results from the
acquisition of trichromatic color vision (Young et al. 2005;
Swaney and Keverne 2009), though this view has been
overturned with the accumulation of genomic data for a
more phylogenetically complete sample of mammals
(Young et al. 2010). Others have speculated that loss of
VNO function in numerous mammalian clades relates to
the acquisition of sexual dimorphism (Suarez et al. 2011),
whereas another study found that mammals with the most
diverse V1R repertoires shared behavioral characteristics that
include nest dwelling and nocturnality (Wang, Shi, et al. 2010).
An overriding hypothesis that continues to gain momentum is
the idea that V1R and other pheromone receptors play a key
role in the maintenance of species boundaries via the mecha-
nism of intraspecific mate recognition and premating repro-
ductive isolation (Lane et al. 2004; Horth 2007; Hurst 2009;
Guzzo et al. 2010; Haga et al. 2010; Isogai et al. 2011; Silvotti
et al. 2011), a view supported by tests for positive selection
at the DNA level (Shi et al. 2005).
Here, we examine patterns of molecular evolution within
the V1R gene family in the strepsirrhine primates (i.e., lemurs
and lorises). These primates are exceptionally diverse both eco-
logically and behaviorally (fig. 1), with lemurs having evolved
in isolation on the island of Madagascar for most of the
Cenozoic (Yoder et al. 1996; Yoder and Yang 2004). Mouse
lemurs have been of particular interest given their cryptic
morphological variation associated with high levels of ge-
netic diversity (Yoder et al. 2000; Weisrock et al. 2010).
Given that levels of species diversity in the strepsirrhines
have been increasingly appreciated based on ecological,
behavioral, morphological, and genetic evidence
(Andriaholinirina et al. 2006; Craul et al. 2007; Olivieri
et al. 2007; Mittermeier et al. 2008; Vences et al. 2009;
Groeneveld et al. 2010), primatologists are correspondingly
interested in discovering the mechanisms by which this di-
versity has been generated and maintained. The molecular
evolutionary properties of the V1R gene family may offer
insight into the role that chemosignaling plays in the main-
tenance of species boundaries in these diverse primates.
Materials and Methods
DNA Sequences
To facilitate polymerase chain reaction (PCR) primer design,
we first aligned translated amino acids of intact V1R, identified
Yoder et al. GBE
214 Genome Biol. Evol. 6(1):213–227. doi:10.1093/gbe/evu006 Advance Access publication January 6, 2014
by guest on March 11, 2014
http://gbe.oxfordjournals.org/D
ownloaded from
by Blast searches of the Microcebus murinus and Otolemur
garnettii draft genomes, to published Mus musculus V1R se-
quences. From this amino acid alignment, we constructed a
neighbor-joining tree rooted with taste receptor T2R se-
quences (Shi et al. 2005) and divided the M. murinus and
O. garnettii V1R genes into putative subfamilies based on
their relationship to previously defined V1R subfamilies in
the Mus genome (Rodriguez et al. 2002). Because the
untranslated regions flanking V1R have greater sequence di-
vergence than the coding regions (Young et al. 2003), we
designed PCR primers to anneal to conserved portions of
the second and seventh transmembrane (TM) regions to am-
plify an approximately 750 bp fragment (primers are V1RG1F
50-CTC AAC CAG CTG GTC TTA GCY AAC-30 and V1RG1R
50-GAC AAT GAA CAC AAA GGG GCT GAA-30) in a V1R
subfamily apparently sister to the G subfamily in Mus.
For each of 21 strepsirrhine samples, representing 19 spe-
cies or subspecies (supplementary table S1, Supplementary
Material online), we amplified V1R genes using Taq and proof-
reading polymerase mix. PCRs were conducted in 25ml reac-
tions with 1� buffer, 2.0 mM MgSO4, 0.2 mM dNTPs, 0.8mM
of each primer, and 0.625 U Platinum HiFi Taq (Invitrogen, Life
Technologies), and 1ml template DNA. The thermocycler pro-
file consisted of an initial denaturation at 94 �C for 3 min,
followed by 35 cycles of 94 �C for 60 s, 45 �C for 60 s, and
72 �C for 75 s, followed by a final extension at 72 �C for
10 min. The band of interest, at 750 bp, was excised from
agarose gels and purified using the MolBio Ultraspin Kit.
Purified gel products were TA cloned using the TopoTA kit.
For each individual, a minimum of 100 colonies were ampli-
fied and sequenced using modified M13 primers (LJM13.F 50-
CCC AGT CAC GAC GTT GTA AAA CG-30, LJM13.R 50- AGC
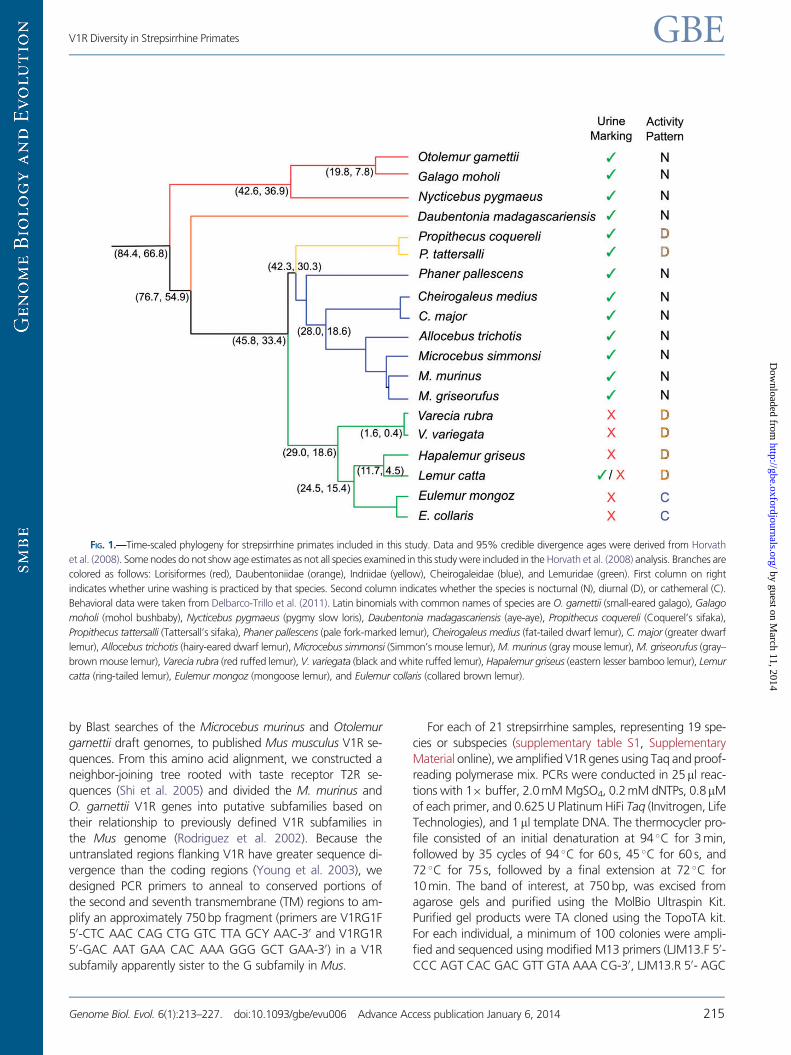
FIG. 1.—Time-scaled phylogeny for strepsirrhine primates included in this study. Data and 95% credible divergence ages were derived from Horvath
et al. (2008). Some nodes do not show age estimates as not all species examined in this study were included in the Horvath et al. (2008) analysis. Branches are
colored as follows: Lorisiformes (red), Daubentoniidae (orange), Indriidae (yellow), Cheirogaleidae (blue), and Lemuridae (green). First column on right
indicates whether urine washing is practiced by that species. Second column indicates whether the species is nocturnal (N), diurnal (D), or cathemeral (C).
Behavioral data were taken from Delbarco-Trillo et al. (2011). Latin binomials with common names of species are O. garnettii (small-eared galago), Galago
moholi (mohol bushbaby), Nycticebus pygmaeus (pygmy slow loris), Daubentonia madagascariensis (aye-aye), Propithecus coquereli (Coquerel’s sifaka),
Propithecus tattersalli (Tattersall’s sifaka), Phaner pallescens (pale fork-marked lemur), Cheirogaleus medius (fat-tailed dwarf lemur), C. major (greater dwarf
lemur), Allocebus trichotis (hairy-eared dwarf lemur), Microcebus simmonsi (Simmon’s mouse lemur), M. murinus (gray mouse lemur), M. griseorufus (gray–
brown mouse lemur), Varecia rubra (red ruffed lemur), V. variegata (black and white ruffed lemur), Hapalemur griseus (eastern lesser bamboo lemur), Lemur
catta (ring-tailed lemur), Eulemur mongoz (mongoose lemur), and Eulemur collaris (collared brown lemur).
V1R Diversity in Strepsirrhine Primates GBE
Genome Biol. Evol. 6(1):213–227. doi:10.1093/gbe/evu006 Advance Access publication January 6, 2014 215
by guest on March 11, 2014
http://gbe.oxfordjournals.org/D
ownloaded from
GGA TAA CAA TTT CAC ACA GG-30). Sequences were
cleaned and assembled in DNAstar (SeqMan or SeqBuilder)
and Sequencher (version 5.0; Gene Codes Corporation) and
checked for codon position. We targeted at least 75 se-
quenced clones with full ORFs for each individual. The 50-
end of the resulting fragment begins in the middle of the
2nd TM helix and terminates on the 30-end in the 7th TM
helix. We employed the visualization program RbDe
(Skrabanek et al. 2003) to identify and illustrate the TM, ex-
tracellular, and intracellular regions of several representative
sequences from our data set. The results were cross-validated
by the G protein-coupled receptor database.
Sequence Alignment
We downloaded full sequences from Young et al. (2010; sup-
plementary data) for all primates included in that study
(human, gorilla, chimpanzee, orangutan, gibbon, baboon,
macaque, marmoset, tarsier, mouse lemur, and bushbaby)
as well as dog, cow, treeshrew, platypus, mouse, and rat.
Given unknown sequence homologies, taxon-specific data
files were created and aligned by employing the MAFFT
(Katoh et al. 2002) alignment tool executed in SeaView ver-
sion 4.3.5 (Gouy et al. 2010). These taxon-specific files were
iteratively aligned to remove highly noisy sequences. After a
given round of alignment, those sequences that most obvi-
ously caused regions of problematic alignment were progres-
sively removed until remaining sequences could be aligned
without large indels. This method is in contrast to the more
typical approach wherein problematic regions of the align-
ment are deleted. With our approach, instead of removing
residues of the alignment, entire sequences were removed
when they imposed large gaps in the alignment. As a result,
all sequences remaining in the alignment are complete. These
sequences were combined with the V1R sequences generated
by our study and trimmed to match their approximate
sequence length to construct a large data set with a total of
2,809 sequences. Redundant sequences and sequences with
premature stop codons were removed. In the process of
this manual alignment, we removed hundreds of obvious
pseudogenes from outgroup sequences. The remaining data
were aligned with ClustalW (version 2.1) using the default
settings (supplementary data file 1, Supplementary Material
online).
Phylogenetic Analysis
The program RAxML (v 7.26; Stamatakis 2006) was then used
to estimate the maximum likelihood tree for all the sequences
(supplementary data file 1, Supplementary Material online),
using the GTR + Gamma substitution model. To determine
the relative phylogenetic position of our sequences with re-
spect to the Mus V1R subfamilies, we analyzed a subset of the
sequences generated by this study plus Mus V1R sequences
available in National Center for Biotechnology Information.
The resulting data set contains 133 strepsirrhine sequences
and 160 Mus sequences (supplementary data file 2,
Supplementary Material online). The strepsirrhine sequences
were subsampled with two considerations in mind: first, to
balance the number of sequences from Mus with a similar
number from the strepsirrhines and second, to provide uni-
form coverage across the strepsirrhine phylogeny. For further
phylogenetic analysis and for tests of positive selection, we
built a data matrix containing only the strepsirrhine sequences
generated by this study (supplementary data file 3,
Supplementary Material online). For clustered subsets of the
data (described immediately below; supplementary data files
4–6, Supplementary Material online), tree estimation was con-
ducted using the programs RAxML v7.7.7 (Stamatakis 2006),
PhyML v3.0 (Guindon et al. 2010), and MrBayes v3.2.2
(Ronquist et al. 2012). We used Modeltest v2.1 to select the
best model of evolution based on Akaike and Bayesian infor-
mation criteria. The GTR + Gamma substitution model was
used for all phylogenetic analyses. RAxML analyses were per-
formed using RAxML-HPC-PTHREADS with 500 rapid boot-
strap iterations and an estimated alpha parameter. PhyML
analyses were performed using both NNI and SPR tree topol-
ogy searches, with estimated Gamma shape parameters, and
500 bootstrap iterations. Bayesian analyses were performed
using 2 million generations (one cold and three incrementally
heated Markov chains, random starting trees for each chain),
and trees were sampled every 100 generations with a final
25% burn-in (convergence was confirmed using Tracer v1.5
software; Drummond and Rambaut 2007). Finally, we built a
data matrix to include strepsirrhine V1R sequences analyzed
by Hohenbrink et al. (2012) along with a subset of the se-
quences generated by our study (supplementary data file 7,
Supplementary Material online). Pairwise distances were cal-
culated with BASEML and CODEML (PAML 4.6). For the nu-
cleotide sequences, the F84 + Gamma substitution model was
employed and for the amino acid sequences, the
LG + F + Gamma substitution model. In both cases, the
alpha shape parameter for the gamma model was fixed at
0.5.
Sequence Clustering
To facilitate further phylogenetic analyses, and also, to take a
conservative approach with respect to number of gene copies
identified, a minimum number of V1R loci per individual was
estimated following the method of Rodriguez et al. (2002),
whereby sequences sharing greater than 98% nucleotide ho-
mology were considered redundant and/or their identity un-
certain. Sequence clustering was performed using the
USEARCH software package with the -cluster_fast option
and an identity threshold of 0.98. Resulting centroid se-
quences were used for downstream phylogenetic analyses
based on sequences specific to the lemuriform families
Yoder et al. GBE
216 Genome Biol. Evol. 6(1):213–227. doi:10.1093/gbe/evu006 Advance Access publication January 6, 2014
by guest on March 11, 2014
http://gbe.oxfordjournals.org/D
ownloaded from
Cheirogaleidae (the dwarf and mouse lemurs) and Lemuridae
(the true lemurs).
Tests for Gene Conversion
Silent sites were used to test for gene conversion using the
program GENCONV (Sawyer 1989). The use of silent sites is
preferable to the use of whole genes since selection on
nonsynonymous sites may mislead the detection methods.
GENCONV uses pairwise comparisons among sequences to
detect recombination, and a multiple test correction is then
applied to account for the large number of pairwise compar-
isons in a typical data set. The correction is known to be con-
servative, so we also performed the tests on culled data sets in
which highly similar sequences were removed to increase the
power of the test.
Tests for Positive Selection
Likelihood ratio tests (LRTs) of positive selection under the site
and branch-site models were carried out with the program
CODEML in the PAML package (Yang 2007). The site models
allow o to vary across sites and presence of sites with o is
tested with a LRT (Yang et al. 2000). In the branch-site models,
o is allowed to vary both across sites and lineages (Yang and
Nielsen 2002; Zhang et al. 2005). Positive selection is detected
if the estimate of o is greater than 1 for particular lineages
(called foreground branches). We also apply the clade model
(Bielawski and Yang 2003), which allows different groups of
branches (clades) to have different o’s.
Structural Predictions for V1R
Our PCR amplification and sequencing strategy yielded se-
quences that span the region between the 2nd and 7th TM
loops of the V1R gene family, thus yielding sequences that
lack the 50- and 30-ends of the complete gene. To visualize
predictions of the complete V1R protein structure, we ap-
pended amino acid residues from the 50- and 30-ends of a
representative Microcebus V1R sequence (micMurV1R6101
of Young et al. 2010). The complete (though chimeric) se-
quence allowed us to predict the location of TM helices and
extracellular and intercellular loops within a subset of our
translated data using both the Residue-based Diagram
editor (Skrabanek et al. 2003) and the I-TASSER web server
for protein structure and function prediction (Roy et al. 2010).
Results and Discussion
General Approach
Our aim was to examine V1R diversity among strepsirrhine
primates, particularly within the mouse lemurs and other
lemuriforms (see supplementary table S1, Supplementary
Material online, for taxa and associated metadata), with spe-
cial attention to the relative abundance of intact and pseudo-
gene copies of representative V1R genes. As described earlier,
previous molecular evolutionary studies within mammals have
suggested that V1R diversity and function may correlate with
life history and ecological characteristics. Given that strepsir-
rhine primates show diverse patterns of circadian activity
cycles and olfactory-driven communication (e.g., urine wash-
ing; fig. 1), we were interested in possible correlations among
patterns of behavior and diversity and function of V1R gene
copies. As assembled and annotated genomes do not as yet
exist for any of the target species, we adopted a PCR approach
for targeting V1R genes for subsequent cloning and Sanger
sequencing. Our findings are therefore subject to possible
biases in the amplification and cloning stages of data gener-
ation and consequently, should be viewed as an approxima-
tion of relative diversity within the targeted V1R subclade
rather than an absolute measure. Moreover, because of the
constraints of primer design, we did not sequence the geno-
mic regions flanking the coding region of the targeted locus
and are thus unable to distinguish allelic diversity (i.e., the
detection of heterozygotes) from independent loci (i.e., para-
logs from orthologs). For example, in a case wherein 60
unique sequences are identified within a species representa-
tive, this may potentially represent as few as 30 distinct loci if
that individual is heterozygous at all loci. Moreover, the use of
conserved primers may bias the data by differentially capturing
functional copies and failing to amplify pseudogenes. Finally,
the majority of V1R gene copies reported here were se-
quenced only once. Though some gene copies were se-
quenced from numerous independent clones (as many as
23, in one case), the majority were sequenced from single
clones (supplementary table S2, Supplementary Material
online). Thus, numeric comparisons between intact and pseu-
dogene copies (supplementary table S3, Supplementary
Material online) must be considered tentative.
Measures of Intact versus Pseudogene Sequences
A subset of sequences from the Young et al. (2010) study was
combined with those generated in this study to comprise a
single data matrix. All redundant sequences were removed
leaving only unique sequences. The resulting matrix consists of
2,809 sequences (supplementary data file 1, Supplementary
Material online). Of these, 1,004 are unique to this study. Not
included in this matrix are 303 strepsirrhine sequences that
were identified as pseudogenes (or possibly, artifacts) due to
their improper sequence length and/or presence of stop
codons (supplementary table S3, Supplementary Material
online). When comparing the proportion of these sequences
to the intact sequences, comparisons among the Strepsirrhini
show a wide range of putative pseudogenes, from 6% to
60%. In all cases, however, the proportion of pseudogene
sequences within the strepsirrhine primates is markedly
lower than those for the haplorrhine primates (anthropoids
plus tarsiers), as would be expected of the greater reliance
on olfactory communication in strepsirrhine primates. This
V1R Diversity in Strepsirrhine Primates GBE
Genome Biol. Evol. 6(1):213–227. doi:10.1093/gbe/evu006 Advance Access publication January 6, 2014 217
by guest on March 11, 2014
http://gbe.oxfordjournals.org/D
ownloaded from
comparison reveals that the intact-to-pseudogene counts for
mouse lemurs (Microcebus), noted for their extraordinarily
high proportion of intact sequences by Young et al. (2010),
appear instead to be rather typical for strepsirrhines generally.
These observations must be considered as approximate,
however, given the technical difficulties surrounding molecu-
lar characterization of complex regions of the genome (Alkan
et al. 2011) such as is the case here. Although our results are in
general agreement with those of Young et al. (2010), that
mouse lemurs show the highest proportion of intact V1R se-
quences of any mammal yet characterized, their assessments
are based on analysis of a low-coverage (2�) unassembled
genome. Such draft genomes are known to be problematic
for characterizing areas of high genomic complexity such as
those associated with gene family expansions (Nagy et al.
2008; Zhang et al. 2012). Nonetheless, the general agreement
between our observations and those of Young et al. (2010)
should be considered supportive of the overall finding that
V1R sequences in mouse lemurs and other strepsirrhine pri-
mates retain a strong signal of intact gene function.
Patterns of Genetic Distance across Taxonomic Levels
Supplementary table S4, Supplementary Material online, pre-
sents measures of V1R sequence divergence across a broad
phylogenetic scope within the Strepsirrhini, from within indi-
vidual genomes to interfamily levels. In all comparisons, se-
quence divergence is relatively high across all taxa (>7%),
with the notable exception of species within the Lemuridae
(the true lemurs). In this case, pairwise distances are consider-
ably lower, particularly for the ring-tailed lemur (Lemur catta)
wherein measures average around 2%. It is also notable that
for all comparisons, amino acid distances are considerably
higher than nucleotide distances due to a high rate of non-
synonymous substitutions (table 1).
We obtained sequences for two L. catta individuals (the
ring-tailed lemur) and two M. murinus individuals (mouse
lemurs; highlighted in supplementary table S4,
Supplementary Material online). In the case of L. catta, both
individuals come from a captive colony held at the Duke
Lemur Center (DLC) and are thus presumably closely related
through recent ancestry. Potentially, they share 3rd-genera-
tion ancestry through the paternal line, though there is uncer-
tainty in patrilineal relationships due to husbandry practices at
the DLC. In the case of M. murinus, on the other hand, one
individual is wild caught, whereas the other comes from the
captive colony of the DLC. Therefore, in our M. murinus
sample, it seems likely that common ancestry would be
much more remote than that for L. catta. Even so, intraindi-
vidual genetic variation for both species is roughly equivalent
to interindividual distances. This observation of high levels of
intraindividual variation (i.e., variation within a single genome)
potentially corresponds to previous reports of high levels of
individual copy number variation among chemosensory genes
in general (Nozawa and Nei 2008), though complete charac-
terization of orthologs and paralogs will be necessary to make
these comparisons.
Discovery of a Unique V1R Subfamily
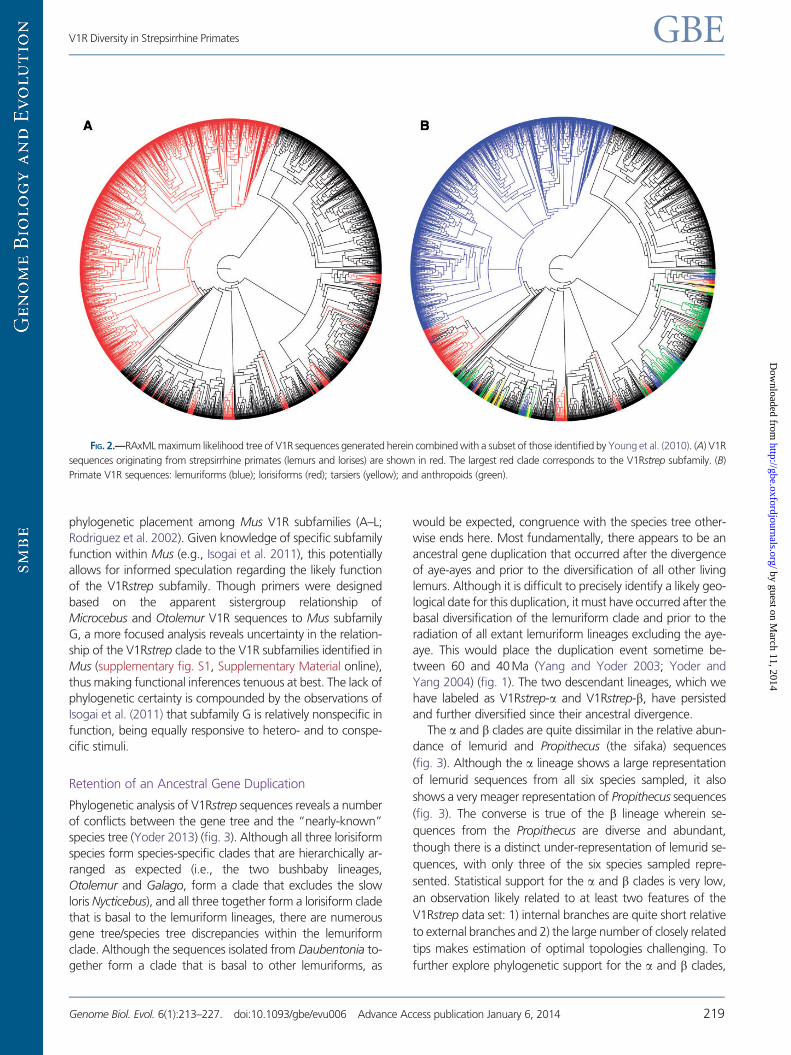
A maximum-likelihood phylogeny (fig. 2) shows that the ma-
jority of sequences generated by this study form a large clade
that is distinct from those taken from Young et al. (2010)
(fig. 2a). The appearance of several mouse lemur sequences
from the study by Young et al. (2010) within the large clade of
sequences generated by this study and results from Blast
searches verify the identity of our sequences as representative
of the V1R gene family. Although a few sequences from our
study fall within the outgroup sequences, the results other-
wise indicate that our sequences are novel and form a coher-
ent cluster that is apparently specific to the strepsirrhine
primates. This indicates that we have sampled intensively
within what is evidently a unique subfamily of V1R genes,
which we designate as V1Rstrep. Our analysis is congruent
with results found in Young et al. (2010) (their supplementary
fig. 3). In our analysis, all nonstrepsirrhine primate sequences
from that study (colored as described in the fig. 2 legend) are
dispersed throughout several sequence clusters that also in-
clude cow, dog, rat, mouse, and platypus (fig. 2b).
A recent study by Hohenbrink et al. (2012) generated novel
V1R sequences for M. murinus and for 10 additional mouse
lemur species. Using phylogenetic methods, that study
analyzed 105 of 107 sequences previously published by
Young et al. (2010). Hohenbrink et al. (2012) identified nine
distinct clades of gray mouse lemur V1R sequences, one of
which they hypothesize to be specific to the genus Microcebus
(“Cluster 1” in their fig. 1). Maximum likelihood analysis of
the V1R sequences generated by our study, along with those
analyzed by Hohenbrink et al. (2012) reveals that their Cluster
I sequences belong to the diverse clade that we have identified
as V1Rstrep (supplementary fig. S2, Supplementary Material
online).
We also analyzed a subset of our sequences along with
V1R sequences from Mus to determine their relative
Table 1
Average Pairwise Genetic Distances within and between Alpha and
Beta Lineages of Cheirogaleidae and Lemuridae
Alpha (%) Beta (%) Alpha vs.
Beta (%)
Average nucleotide pairwise genetic distances
Cheirogaleidae 11.0 8.6 13.8
Lemuridae 5.0 1.7 13.6
Average amino acid pairwise genetic distances
Cheirogaleidae 20.5 16.0 26.7
Lemuridae 9.3 3.3 23.7
NOTE.—Pairwise distances were calculated with BASEML and CODEML (PAML4.6). Nucleotide sequences were corrected with the F84 + Gamma substitutionmodel; amino acid sequences were corrected with the LG + F + Gamma substitu-tion model. Alpha was fixed at 0.5 in both cases.
Yoder et al. GBE
218 Genome Biol. Evol. 6(1):213–227. doi:10.1093/gbe/evu006 Advance Access publication January 6, 2014
by guest on March 11, 2014
http://gbe.oxfordjournals.org/D
ownloaded from
phylogenetic placement among Mus V1R subfamilies (A–L;
Rodriguez et al. 2002). Given knowledge of specific subfamily
function within Mus (e.g., Isogai et al. 2011), this potentially
allows for informed speculation regarding the likely function
of the V1Rstrep subfamily. Though primers were designed
based on the apparent sistergroup relationship of
Microcebus and Otolemur V1R sequences to Mus subfamily
G, a more focused analysis reveals uncertainty in the relation-
ship of the V1Rstrep clade to the V1R subfamilies identified in
Mus (supplementary fig. S1, Supplementary Material online),
thus making functional inferences tenuous at best. The lack of
phylogenetic certainty is compounded by the observations of
Isogai et al. (2011) that subfamily G is relatively nonspecific in
function, being equally responsive to hetero- and to conspe-
cific stimuli.
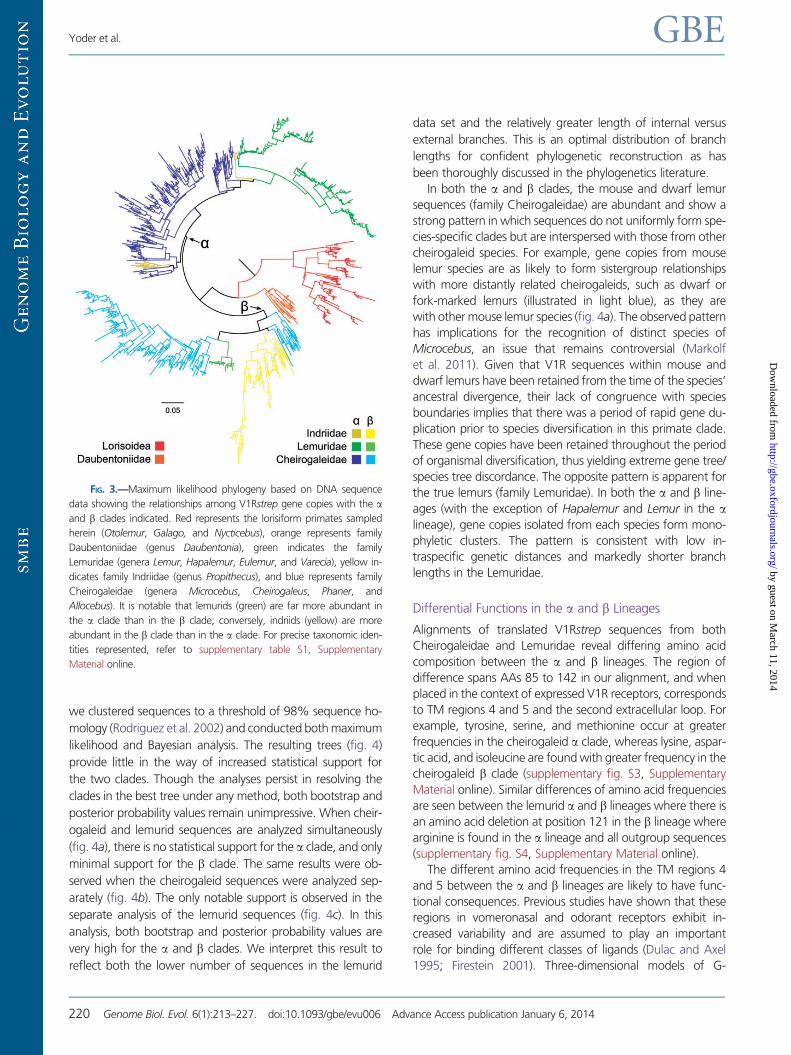
Retention of an Ancestral Gene Duplication
Phylogenetic analysis of V1Rstrep sequences reveals a number
of conflicts between the gene tree and the “nearly-known”
species tree (Yoder 2013) (fig. 3). Although all three lorisiform
species form species-specific clades that are hierarchically ar-
ranged as expected (i.e., the two bushbaby lineages,
Otolemur and Galago, form a clade that excludes the slow
loris Nycticebus), and all three together form a lorisiform clade
that is basal to the lemuriform lineages, there are numerous
gene tree/species tree discrepancies within the lemuriform
clade. Although the sequences isolated from Daubentonia to-
gether form a clade that is basal to other lemuriforms, as
would be expected, congruence with the species tree other-
wise ends here. Most fundamentally, there appears to be an
ancestral gene duplication that occurred after the divergence
of aye-ayes and prior to the diversification of all other living
lemurs. Although it is difficult to precisely identify a likely geo-
logical date for this duplication, it must have occurred after the
basal diversification of the lemuriform clade and prior to the
radiation of all extant lemuriform lineages excluding the aye-
aye. This would place the duplication event sometime be-
tween 60 and 40 Ma (Yang and Yoder 2003; Yoder and
Yang 2004) (fig. 1). The two descendant lineages, which we
have labeled as V1Rstrep-a and V1Rstrep-b, have persisted
and further diversified since their ancestral divergence.
The a and b clades are quite dissimilar in the relative abun-
dance of lemurid and Propithecus (the sifaka) sequences
(fig. 3). Although the a lineage shows a large representation
of lemurid sequences from all six species sampled, it also
shows a very meager representation of Propithecus sequences
(fig. 3). The converse is true of the b lineage wherein se-
quences from the Propithecus are diverse and abundant,
though there is a distinct under-representation of lemurid se-
quences, with only three of the six species sampled repre-
sented. Statistical support for the a and b clades is very low,
an observation likely related to at least two features of the
V1Rstrep data set: 1) internal branches are quite short relative
to external branches and 2) the large number of closely related
tips makes estimation of optimal topologies challenging. To
further explore phylogenetic support for the a and b clades,
FIG. 2.—RAxML maximum likelihood tree of V1R sequences generated herein combined with a subset of those identified by Young et al. (2010). (A) V1R
sequences originating from strepsirrhine primates (lemurs and lorises) are shown in red. The largest red clade corresponds to the V1Rstrep subfamily. (B)
Primate V1R sequences: lemuriforms (blue); lorisiforms (red); tarsiers (yellow); and anthropoids (green).
V1R Diversity in Strepsirrhine Primates GBE
Genome Biol. Evol. 6(1):213–227. doi:10.1093/gbe/evu006 Advance Access publication January 6, 2014 219
by guest on March 11, 2014
http://gbe.oxfordjournals.org/D
ownloaded from
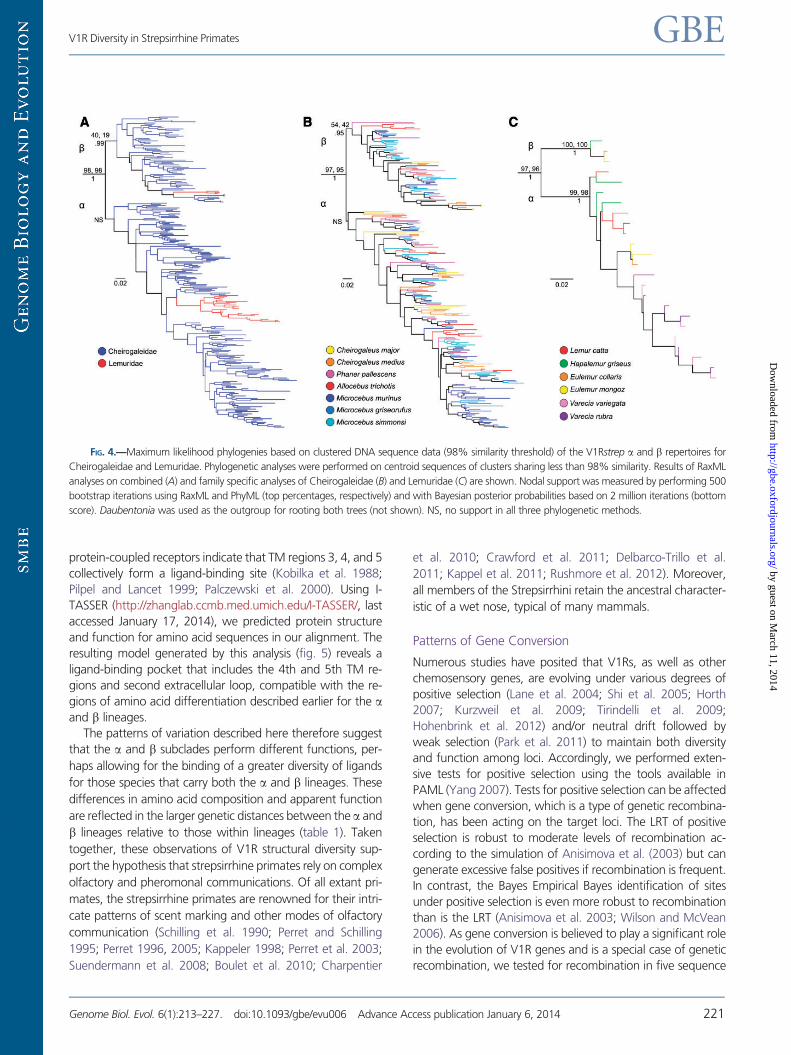
we clustered sequences to a threshold of 98% sequence ho-
mology (Rodriguez et al. 2002) and conducted both maximum
likelihood and Bayesian analysis. The resulting trees (fig. 4)
provide little in the way of increased statistical support for
the two clades. Though the analyses persist in resolving the
clades in the best tree under any method, both bootstrap and
posterior probability values remain unimpressive. When cheir-
ogaleid and lemurid sequences are analyzed simultaneously
(fig. 4a), there is no statistical support for the a clade, and only
minimal support for the b clade. The same results were ob-
served when the cheirogaleid sequences were analyzed sep-
arately (fig. 4b). The only notable support is observed in the
separate analysis of the lemurid sequences (fig. 4c). In this
analysis, both bootstrap and posterior probability values are
very high for the a and b clades. We interpret this result to
reflect both the lower number of sequences in the lemurid
data set and the relatively greater length of internal versus
external branches. This is an optimal distribution of branch
lengths for confident phylogenetic reconstruction as has
been thoroughly discussed in the phylogenetics literature.
In both the a and b clades, the mouse and dwarf lemur
sequences (family Cheirogaleidae) are abundant and show a
strong pattern in which sequences do not uniformly form spe-
cies-specific clades but are interspersed with those from other
cheirogaleid species. For example, gene copies from mouse
lemur species are as likely to form sistergroup relationships
with more distantly related cheirogaleids, such as dwarf or
fork-marked lemurs (illustrated in light blue), as they are
with other mouse lemur species (fig. 4a). The observed pattern
has implications for the recognition of distinct species of
Microcebus, an issue that remains controversial (Markolf
et al. 2011). Given that V1R sequences within mouse and
dwarf lemurs have been retained from the time of the species’
ancestral divergence, their lack of congruence with species
boundaries implies that there was a period of rapid gene du-
plication prior to species diversification in this primate clade.
These gene copies have been retained throughout the period
of organismal diversification, thus yielding extreme gene tree/
species tree discordance. The opposite pattern is apparent for
the true lemurs (family Lemuridae). In both the a and b line-
ages (with the exception of Hapalemur and Lemur in the alineage), gene copies isolated from each species form mono-
phyletic clusters. The pattern is consistent with low in-
traspecific genetic distances and markedly shorter branch
lengths in the Lemuridae.
Differential Functions in the a and b Lineages
Alignments of translated V1Rstrep sequences from both
Cheirogaleidae and Lemuridae reveal differing amino acid
composition between the a and b lineages. The region of
difference spans AAs 85 to 142 in our alignment, and when
placed in the context of expressed V1R receptors, corresponds
to TM regions 4 and 5 and the second extracellular loop. For
example, tyrosine, serine, and methionine occur at greater
frequencies in the cheirogaleid a clade, whereas lysine, aspar-
tic acid, and isoleucine are found with greater frequency in the
cheirogaleid b clade (supplementary fig. S3, Supplementary
Material online). Similar differences of amino acid frequencies
are seen between the lemurid a and b lineages where there is
an amino acid deletion at position 121 in the b lineage where
arginine is found in the a lineage and all outgroup sequences
(supplementary fig. S4, Supplementary Material online).
The different amino acid frequencies in the TM regions 4
and 5 between the a and b lineages are likely to have func-
tional consequences. Previous studies have shown that these
regions in vomeronasal and odorant receptors exhibit in-
creased variability and are assumed to play an important
role for binding different classes of ligands (Dulac and Axel
1995; Firestein 2001). Three-dimensional models of G-
FIG. 3.—Maximum likelihood phylogeny based on DNA sequence
data showing the relationships among V1Rstrep gene copies with the aand b clades indicated. Red represents the lorisiform primates sampled
herein (Otolemur, Galago, and Nycticebus), orange represents family
Daubentoniidae (genus Daubentonia), green indicates the family
Lemuridae (genera Lemur, Hapalemur, Eulemur, and Varecia), yellow in-
dicates family Indriidae (genus Propithecus), and blue represents family
Cheirogaleidae (genera Microcebus, Cheirogaleus, Phaner, and
Allocebus). It is notable that lemurids (green) are far more abundant in
the a clade than in the b clade; conversely, indriids (yellow) are more
abundant in the b clade than in the a clade. For precise taxonomic iden-
tities represented, refer to supplementary table S1, Supplementary
Material online.
Yoder et al. GBE
220 Genome Biol. Evol. 6(1):213–227. doi:10.1093/gbe/evu006 Advance Access publication January 6, 2014
by guest on March 11, 2014
http://gbe.oxfordjournals.org/D
ownloaded from
protein-coupled receptors indicate that TM regions 3, 4, and 5
collectively form a ligand-binding site (Kobilka et al. 1988;
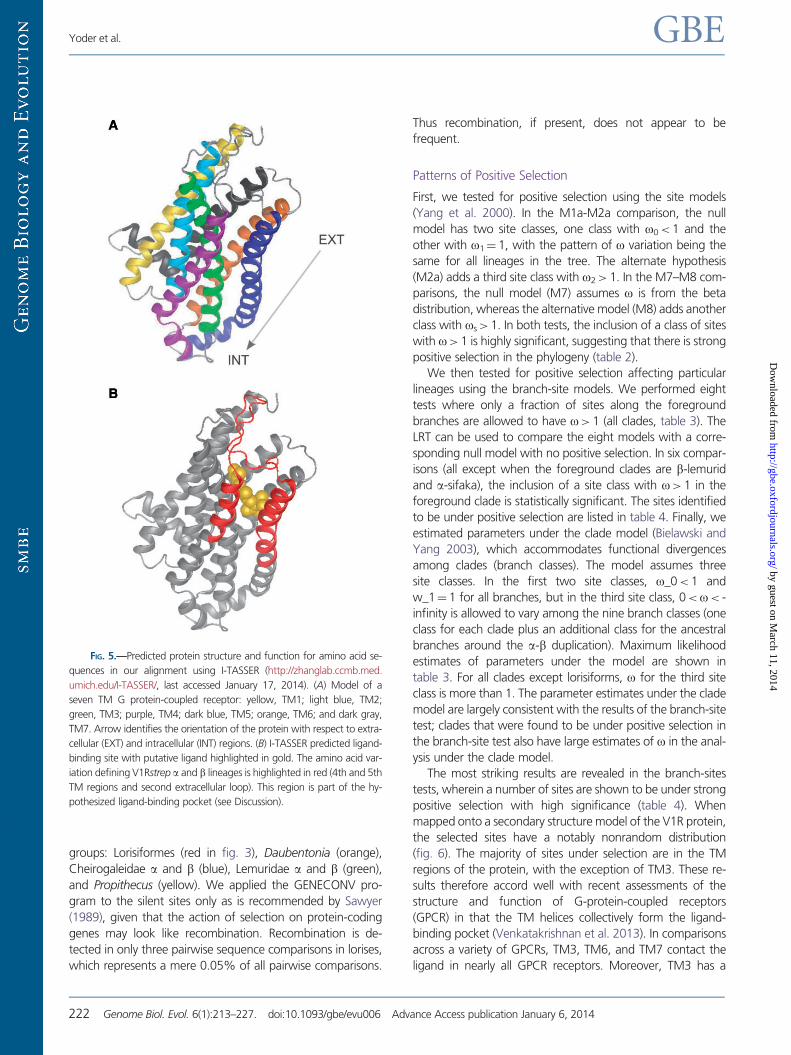
Pilpel and Lancet 1999; Palczewski et al. 2000). Using I-
TASSER (http://zhanglab.ccmb.med.umich.edu/I-TASSER/, last
accessed January 17, 2014), we predicted protein structure
and function for amino acid sequences in our alignment. The
resulting model generated by this analysis (fig. 5) reveals a
ligand-binding pocket that includes the 4th and 5th TM re-
gions and second extracellular loop, compatible with the re-
gions of amino acid differentiation described earlier for the aand b lineages.
The patterns of variation described here therefore suggest
that the a and b subclades perform different functions, per-
haps allowing for the binding of a greater diversity of ligands
for those species that carry both the a and b lineages. These
differences in amino acid composition and apparent function
are reflected in the larger genetic distances between the a and
b lineages relative to those within lineages (table 1). Taken
together, these observations of V1R structural diversity sup-
port the hypothesis that strepsirrhine primates rely on complex
olfactory and pheromonal communications. Of all extant pri-
mates, the strepsirrhine primates are renowned for their intri-
cate patterns of scent marking and other modes of olfactory
communication (Schilling et al. 1990; Perret and Schilling
1995; Perret 1996, 2005; Kappeler 1998; Perret et al. 2003;
Suendermann et al. 2008; Boulet et al. 2010; Charpentier
et al. 2010; Crawford et al. 2011; Delbarco-Trillo et al.
2011; Kappel et al. 2011; Rushmore et al. 2012). Moreover,
all members of the Strepsirrhini retain the ancestral character-
istic of a wet nose, typical of many mammals.
Patterns of Gene Conversion
Numerous studies have posited that V1Rs, as well as other
chemosensory genes, are evolving under various degrees of
positive selection (Lane et al. 2004; Shi et al. 2005; Horth
2007; Kurzweil et al. 2009; Tirindelli et al. 2009;
Hohenbrink et al. 2012) and/or neutral drift followed by
weak selection (Park et al. 2011) to maintain both diversity
and function among loci. Accordingly, we performed exten-
sive tests for positive selection using the tools available in
PAML (Yang 2007). Tests for positive selection can be affected
when gene conversion, which is a type of genetic recombina-
tion, has been acting on the target loci. The LRT of positive
selection is robust to moderate levels of recombination ac-
cording to the simulation of Anisimova et al. (2003) but can
generate excessive false positives if recombination is frequent.
In contrast, the Bayes Empirical Bayes identification of sites
under positive selection is even more robust to recombination
than is the LRT (Anisimova et al. 2003; Wilson and McVean
2006). As gene conversion is believed to play a significant role
in the evolution of V1R genes and is a special case of genetic
recombination, we tested for recombination in five sequence
FIG. 4.—Maximum likelihood phylogenies based on clustered DNA sequence data (98% similarity threshold) of the V1Rstrep a and b repertoires for
Cheirogaleidae and Lemuridae. Phylogenetic analyses were performed on centroid sequences of clusters sharing less than 98% similarity. Results of RaxML
analyses on combined (A) and family specific analyses of Cheirogaleidae (B) and Lemuridae (C) are shown. Nodal support was measured by performing 500
bootstrap iterations using RaxML and PhyML (top percentages, respectively) and with Bayesian posterior probabilities based on 2 million iterations (bottom
score). Daubentonia was used as the outgroup for rooting both trees (not shown). NS, no support in all three phylogenetic methods.
V1R Diversity in Strepsirrhine Primates GBE
Genome Biol. Evol. 6(1):213–227. doi:10.1093/gbe/evu006 Advance Access publication January 6, 2014 221
by guest on March 11, 2014
http://gbe.oxfordjournals.org/D
ownloaded from
groups: Lorisiformes (red in fig. 3), Daubentonia (orange),
Cheirogaleidae a and b (blue), Lemuridae a and b (green),
and Propithecus (yellow). We applied the GENECONV pro-
gram to the silent sites only as is recommended by Sawyer
(1989), given that the action of selection on protein-coding
genes may look like recombination. Recombination is de-
tected in only three pairwise sequence comparisons in lorises,
which represents a mere 0.05% of all pairwise comparisons.
Thus recombination, if present, does not appear to be
frequent.
Patterns of Positive Selection
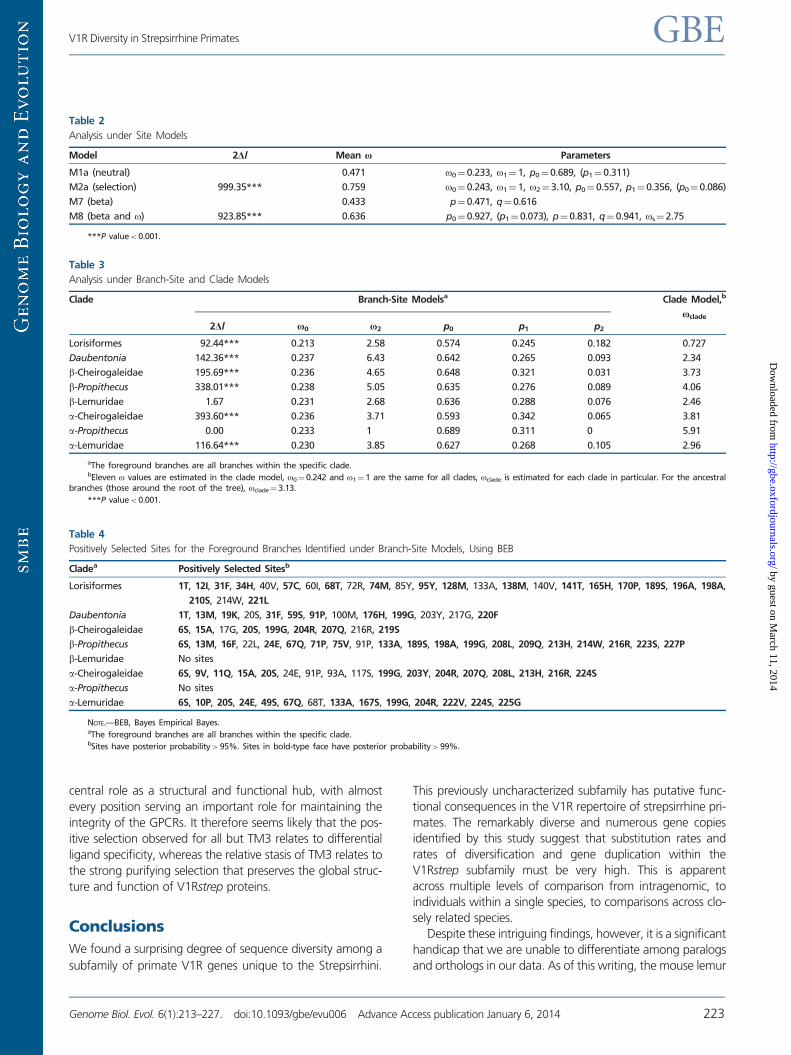
First, we tested for positive selection using the site models
(Yang et al. 2000). In the M1a-M2a comparison, the null
model has two site classes, one class with o0<1 and the
other with o1¼ 1, with the pattern of o variation being the
same for all lineages in the tree. The alternate hypothesis
(M2a) adds a third site class with o2> 1. In the M7–M8 com-
parisons, the null model (M7) assumes o is from the beta
distribution, whereas the alternative model (M8) adds another
class with os>1. In both tests, the inclusion of a class of sites
with o>1 is highly significant, suggesting that there is strong
positive selection in the phylogeny (table 2).
We then tested for positive selection affecting particular
lineages using the branch-site models. We performed eight
tests where only a fraction of sites along the foreground
branches are allowed to have o> 1 (all clades, table 3). The
LRT can be used to compare the eight models with a corre-
sponding null model with no positive selection. In six compar-
isons (all except when the foreground clades are b-lemurid
and a-sifaka), the inclusion of a site class with o> 1 in the
foreground clade is statistically significant. The sites identified
to be under positive selection are listed in table 4. Finally, we
estimated parameters under the clade model (Bielawski and
Yang 2003), which accommodates functional divergences
among clades (branch classes). The model assumes three
site classes. In the first two site classes, o_0<1 and
w_1¼ 1 for all branches, but in the third site class, 0<o< -
infinity is allowed to vary among the nine branch classes (one
class for each clade plus an additional class for the ancestral
branches around the a-b duplication). Maximum likelihood
estimates of parameters under the model are shown in
table 3. For all clades except lorisiforms, o for the third site
class is more than 1. The parameter estimates under the clade
model are largely consistent with the results of the branch-site
test; clades that were found to be under positive selection in
the branch-site test also have large estimates of o in the anal-
ysis under the clade model.
The most striking results are revealed in the branch-sites
tests, wherein a number of sites are shown to be under strong
positive selection with high significance (table 4). When
mapped onto a secondary structure model of the V1R protein,
the selected sites have a notably nonrandom distribution
(fig. 6). The majority of sites under selection are in the TM
regions of the protein, with the exception of TM3. These re-
sults therefore accord well with recent assessments of the
structure and function of G-protein-coupled receptors
(GPCR) in that the TM helices collectively form the ligand-
binding pocket (Venkatakrishnan et al. 2013). In comparisons
across a variety of GPCRs, TM3, TM6, and TM7 contact the
ligand in nearly all GPCR receptors. Moreover, TM3 has a
FIG. 5.—Predicted protein structure and function for amino acid se-
quences in our alignment using I-TASSER (http://zhanglab.ccmb.med.
umich.edu/I-TASSER/, last accessed January 17, 2014). (A) Model of a
seven TM G protein-coupled receptor: yellow, TM1; light blue, TM2;
green, TM3; purple, TM4; dark blue, TM5; orange, TM6; and dark gray,
TM7. Arrow identifies the orientation of the protein with respect to extra-
cellular (EXT) and intracellular (INT) regions. (B) I-TASSER predicted ligand-
binding site with putative ligand highlighted in gold. The amino acid var-
iation defining V1Rstrep a and b lineages is highlighted in red (4th and 5th
TM regions and second extracellular loop). This region is part of the hy-
pothesized ligand-binding pocket (see Discussion).
Yoder et al. GBE
222 Genome Biol. Evol. 6(1):213–227. doi:10.1093/gbe/evu006 Advance Access publication January 6, 2014
by guest on March 11, 2014
http://gbe.oxfordjournals.org/D
ownloaded from
central role as a structural and functional hub, with almost
every position serving an important role for maintaining the
integrity of the GPCRs. It therefore seems likely that the pos-
itive selection observed for all but TM3 relates to differential
ligand specificity, whereas the relative stasis of TM3 relates to
the strong purifying selection that preserves the global struc-
ture and function of V1Rstrep proteins.
Conclusions
We found a surprising degree of sequence diversity among a
subfamily of primate V1R genes unique to the Strepsirrhini.
This previously uncharacterized subfamily has putative func-
tional consequences in the V1R repertoire of strepsirrhine pri-
mates. The remarkably diverse and numerous gene copies
identified by this study suggest that substitution rates and
rates of diversification and gene duplication within the
V1Rstrep subfamily must be very high. This is apparent
across multiple levels of comparison from intragenomic, to
individuals within a single species, to comparisons across clo-
sely related species.
Despite these intriguing findings, however, it is a significant
handicap that we are unable to differentiate among paralogs
and orthologs in our data. As of this writing, the mouse lemur
Table 3
Analysis under Branch-Site and Clade Models
Clade Branch-Site Modelsa Clade Model,b
uclade
2"l u0 u2 p0 p1 p2
Lorisiformes 92.44*** 0.213 2.58 0.574 0.245 0.182 0.727
Daubentonia 142.36*** 0.237 6.43 0.642 0.265 0.093 2.34
b-Cheirogaleidae 195.69*** 0.236 4.65 0.648 0.321 0.031 3.73
b-Propithecus 338.01*** 0.238 5.05 0.635 0.276 0.089 4.06
b-Lemuridae 1.67 0.231 2.68 0.636 0.288 0.076 2.46
a-Cheirogaleidae 393.60*** 0.236 3.71 0.593 0.342 0.065 3.81
a-Propithecus 0.00 0.233 1 0.689 0.311 0 5.91
a-Lemuridae 116.64*** 0.230 3.85 0.627 0.268 0.105 2.96
aThe foreground branches are all branches within the specific clade.bEleven o values are estimated in the clade model, o0¼ 0.242 and o1¼ 1 are the same for all clades, oclade is estimated for each clade in particular. For the ancestral
branches (those around the root of the tree), oclade¼ 3.13.
***P value< 0.001.
Table 4
Positively Selected Sites for the Foreground Branches Identified under Branch-Site Models, Using BEB
Cladea Positively Selected Sitesb
Lorisiformes 1T, 12I, 31F, 34H, 40V, 57C, 60I, 68T, 72R, 74M, 85Y, 95Y, 128M, 133A, 138M, 140V, 141T, 165H, 170P, 189S, 196A, 198A,
210S, 214W, 221L
Daubentonia 1T, 13M, 19K, 20S, 31F, 59S, 91P, 100M, 176H, 199G, 203Y, 217G, 220F
b-Cheirogaleidae 6S, 15A, 17G, 20S, 199G, 204R, 207Q, 216R, 219S
b-Propithecus 6S, 13M, 16F, 22L, 24E, 67Q, 71P, 75V, 91P, 133A, 189S, 198A, 199G, 208L, 209Q, 213H, 214W, 216R, 223S, 227P
b-Lemuridae No sites
a-Cheirogaleidae 6S, 9V, 11Q, 15A, 20S, 24E, 91P, 93A, 117S, 199G, 203Y, 204R, 207Q, 208L, 213H, 216R, 224S
a-Propithecus No sites
a-Lemuridae 6S, 10P, 20S, 24E, 49S, 67Q, 68T, 133A, 167S, 199G, 204R, 222V, 224S, 225G
NOTE.—BEB, Bayes Empirical Bayes.aThe foreground branches are all branches within the specific clade.bSites have posterior probability> 95%. Sites in bold-type face have posterior probability> 99%.
Table 2
Analysis under Site Models
Model 2"l Mean u Parameters
M1a (neutral) 0.471 o0¼0.233, o1¼ 1, p0¼ 0.689, (p1¼0.311)
M2a (selection) 999.35*** 0.759 o0¼0.243, o1¼ 1, o2¼3.10, p0¼ 0.557, p1¼0.356, (p0¼0.086)
M7 (beta) 0.433 p¼0.471, q¼ 0.616
M8 (beta and o) 923.85*** 0.636 p0¼0.927, (p1¼ 0.073), p¼ 0.831, q¼0.941, os¼2.75
***P value< 0.001.
V1R Diversity in Strepsirrhine Primates GBE
Genome Biol. Evol. 6(1):213–227. doi:10.1093/gbe/evu006 Advance Access publication January 6, 2014 223
by guest on March 11, 2014
http://gbe.oxfordjournals.org/D
ownloaded from
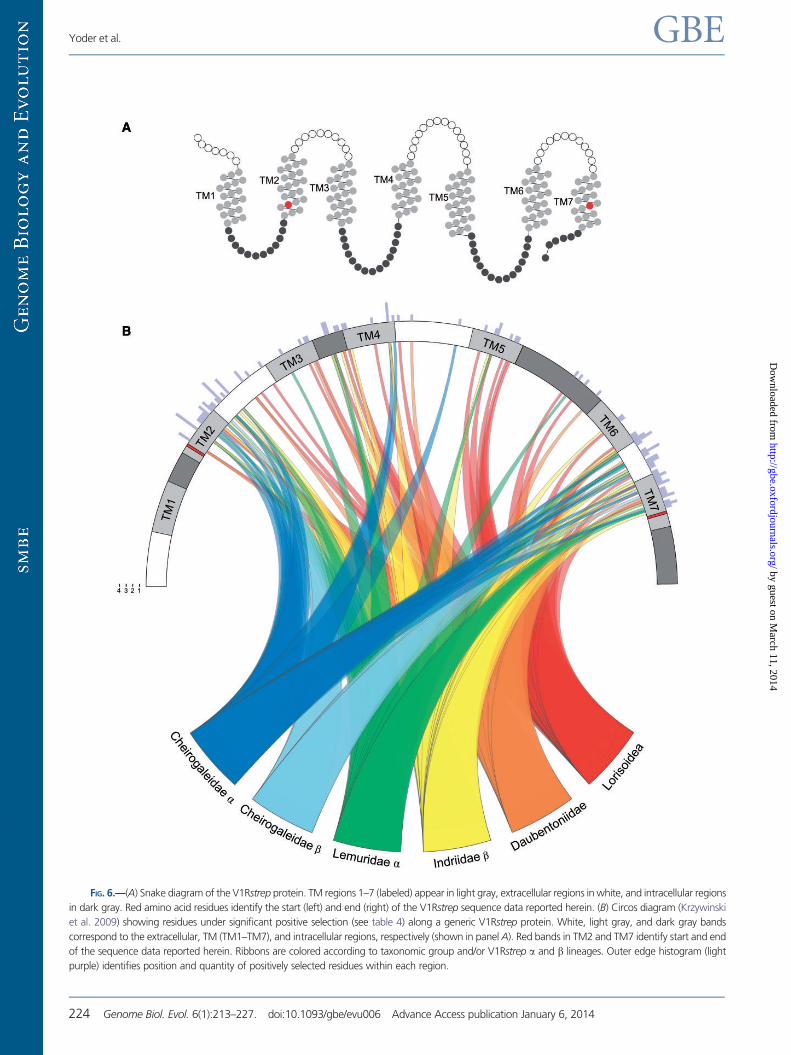
FIG. 6.—(A) Snake diagram of the V1Rstrep protein. TM regions 1–7 (labeled) appear in light gray, extracellular regions in white, and intracellular regions
in dark gray. Red amino acid residues identify the start (left) and end (right) of the V1Rstrep sequence data reported herein. (B) Circos diagram (Krzywinski
et al. 2009) showing residues under significant positive selection (see table 4) along a generic V1Rstrep protein. White, light gray, and dark gray bands
correspond to the extracellular, TM (TM1–TM7), and intracellular regions, respectively (shown in panel A). Red bands in TM2 and TM7 identify start and end
of the sequence data reported herein. Ribbons are colored according to taxonomic group and/or V1Rstrep a and b lineages. Outer edge histogram (light
purple) identifies position and quantity of positively selected residues within each region.
Yoder et al. GBE
224 Genome Biol. Evol. 6(1):213–227. doi:10.1093/gbe/evu006 Advance Access publication January 6, 2014
by guest on March 11, 2014
http://gbe.oxfordjournals.org/D
ownloaded from
genome has been sequenced to approximately 150� cover-
age at the Baylor College of Medicine genome center, using
Illumina Hi-Seq and Pacific Biosciences RS platforms (Rogers J,
personal communication). The fully assembled and annotated
genome will be among the highest quality whole genome
sequences available for any mammal and will allow us to char-
acterize the genomic positions and copy numbers of V1R loci
in Microcebus, and by extension, other lemurs and the closely
related lorisiforms (bushbabies and slow lorises). Given that
our data show many unique V1Rstrep sequences for
Microcebus, in addition to those culled from the low-coverage
Trace Archive Microcebus genome by Young et al. (2010), it is
likely that V1R repertoire diversity has been significantly under-
estimated. The observations of high sequence diversity, struc-
tural complexity, and a high proportion of intact loci suggest
that V1R genes are of fundamental functional consequence in
strepsirrhine primates. It remains to be seen whether these
functions are most relevant to the maintenance of species
boundaries, to the detection of predators, or to some other
as-yet-unidentified behaviors.
Supplementary Material
Supplementary figures S1–S4, tables S1–S4, and data files 1–7
are available at Genome Biology and Evolution online (http://
www.gbe.oxfordjournals.org/).
Acknowledgments
The authors thank M. Alba, R. Anholt, A. Heilman, H.
Matsunami, I. Rodriguez, and especially J. Young for helpful
comments and critical review. The manuscript was further
improved, thanks to comments from three anonymous re-
viewers. J. Young generously provided complete sequence
data for the V1R-like sequences identified in Young et al.
(2010). G. Vriend of the GPCRDB provided guidance with
the interpretation of V1R secondary structure. A. Wilkins pre-
pared the data for submission to NCBI. This work was sup-
ported by Duke University start-up funds to A.D.Y. and a Duke
Primate Genomics Initiative (PGI) award to L.M.C. and A.D.Y.
This is Duke Lemur Center publication #1261.
Literature CitedAlkan C, Sajjadian S, Eichler EE. 2011. Limitations of next-generation
genome sequence assembly. Nat Methods. 8:61–65.
Andriaholinirina N, et al. 2006. Molecular phylogeny and taxonomic revi-
sion of the sportive lemurs (Lepilemur, Primates). BMC Evol Biol. 6:17.
Anisimova M, Nielsen R, Yang ZH. 2003. Effect of recombination on the
accuracy of the likelihood method for detecting positive selection at
amino acid sites. Genetics 164:1229–1236.
Bielawski JP, Yang Z. 2003. Maximum likelihood methods for detecting
adaptive evolution after gene duplication. J Struct Funct Genomics. 3:
201–212.
Boulet M, Crawford JC, Charpentier MJE, Drea CM. 2010. Honest olfac-
tory ornamentation in a female-dominant primate. J Evol Biol. 23:
1558–1563.
Brykczynska U, Tzika AC, Rodriguez I, Milinkovitch MC. 2013.
Contrasted evolution of the vomeronasal receptor reper-
toires in mammals and squamate reptiles. Genome Biol Evol. 5:
389–401.
Charpentier MJE, Crawford JC, Boulet M, Drea CM. 2010. Message
“scent”: lemurs detect the genetic relatedness and quality of conspe-
cifics via olfactory cues. Anim Behav. 80:101–108.
Craul M, Zimmermann E, Rasoloharijaona S, Randrianambinina B,
Radespiel U. 2007. Unexpected species diversity of Malagasy primates
(Lepilemur spp.) in the same biogeographical zone: a morphological
and molecular approach with the description of two new species.
BMC Evol Biol. 7:83.
Crawford JC, Boulet M, Drea CM. 2011. Smelling wrong: hormonal con-
traception in lemurs alters critical female odour cues. Proc Biol Sci. 278:
122–130.
Delbarco-Trillo J, Burkert BA, Goodwin TE, Drea CM. 2011. Night and
day: the comparative study of strepsirrhine primates reveals socioeco-
logical and phylogenetic patterns in olfactory signals. J Evol Biol. 24:
82–98.
Drummond AJ, Rambaut A. 2007. BEAST: Bayesian evolutionary analysis
by sampling trees. BMC Evol Biol. 7:214.
Dulac C, Axel R. 1995. A novel family of genes encoding putative phero-
mone receptors in mammals. Cell 83:195–206.
Firestein S. 2001. How the olfactory system makes sense of scents. Nature
413:211–218.
Frasnelli J, Lundstrom JN, Boyle JA, Katsarkas A, Jones-Gotman M. 2011.
The vomeronasal organ is not involved in the perception of endoge-
nous odors. Hum Brain Mapp. 32:450–460.
Gouy M, Guindon S, Gascuel O. 2010. SeaView version 4 : a multiplatform
graphical user interface for sequence alignment and phylogenetic tree
building. Mol Biol Evol. 27:221–224.
Groeneveld LF, et al. 2010. MtDNA and nDNA corroborate existence of
sympatric dwarf lemur species at Tsinjoarivo, eastern Madagascar. Mol
Phys Evol. 55:833–845.
Grus WE, Shi P, Zhang J. 2007. Largest vertebrate vomeronasal type 1
receptor gene repertoire in the semiaquatic platypus. Mol Biol Evol. 24:
2153–2157.
Grus WE, Zhang JZ. 2004. Rapid turnover and species-specificity of vom-
eronasal pheromone receptor genes in mice and rats. Gene 340:
303–312.
Grus WE, Zhang JZ. 2008. Distinct evolutionary patterns between chemo-
receptors of 2 vertebrate olfactory systems and the differential tuning
hypothesis. Mol Biol Evol. 25:1593–1601.
Grus WE, Zhang JZ. 2009. Origin of the genetic components of the vom-
eronasal system in the common ancestor of all extant vertebrates. Mol
Biol Evol. 26:407–419.
Guindon S, et al. 2010. New algorithms and methods to estimate
Maximum-Likelihood phylogenies: assessing the performance of
PhyML 3.0. Syst Biol. 59:307–321.
Guzzo AC, Berger RG, deCatanzaro D. 2010. Excretion and binding of
tritium-labelled oestradiol in mice (Mus musculus): implications for the
Bruce effect. Reproduction 139:255–263.
Haga S, et al. 2010. The male mouse pheromone ESP1 enhances female
sexual receptive behaviour through a specific vomeronasal receptor.
Nature 466:118–122.
He J, Ma LM, Kim S, Nakai J, Yu CR. 2008. Encoding gender and individ-
ual information in the mouse vomeronasal organ. Science 320:
535–538.
Hohenbrink P, Radespiel U, Mundy NI. 2012. Pervasive and ongoing pos-
itive selection in the vomeronasal-1 receptor (V1R) repertoire of mouse
lemurs. Mol Biol Evol. 29:3807–3816.
Horth L. 2007. Sensory genes and mate choice: evidence that duplications,
mutations, and adaptive evolution alter variation in mating cue genes
and their receptors. Genomics 90:159–175.
V1R Diversity in Strepsirrhine Primates GBE
Genome Biol. Evol. 6(1):213–227. doi:10.1093/gbe/evu006 Advance Access publication January 6, 2014 225
by guest on March 11, 2014
http://gbe.oxfordjournals.org/D
ownloaded from
Horvath JE, et al. 2008. Development and application of a phylogenomic
toolkit: Resolving the evolutionary history of Madagascar’s lemurs.
Genome Res. 18:489–499.
Hurst JL. 2009. Female recognition and assessment of males through
scent. Behav Brain Res. 200:295–303.
Isogai Y, et al. 2011. Molecular organization of vomeronasal chemorecep-
tion. Nature 478:241–245.
Kappel P, Hohenbrink S, Radespiel U. 2011. Experimental evidence for
olfactory predator recognition in wild mouse lemurs. Am J Primatol.
73:928–938.
Kappeler PM. 1998. To whom it may concern: the transmission and func-
tion of chemical signals in Lemur catta. Behav Ecol Sociobiol. 42:
411–421.
Karunadasa DK, Chapman C, Bicknell JR. 2006. Expression of pheromone
receptor gene families during olfactory development in the mouse:
expression of a V1 receptor in the main olfactory epithelium. Eur J
Neurosci. 23:2563–2572.
Katoh K, Misawa K, Kuma K, Miyata T. 2002. MAFFT: a novel method for
rapid multiple sequence alignment based on fast Fourier transform.
Nucleic Acids Res. 30:3059–3066.
Kobilka BK, et al. 1988. Chimeric alpha-2,beta-2-adrenergic receptors:
delineation of domains involved in effector coupling and ligand bind-
ing specificity. Science 240:1310–1316.
Krzywinski M, et al. 2009. Circos: An information aesthetic for compara-
tive genomics. Genome Res. 19:1639–1645.
Kurzweil VC, Getman M, Green ED, Lane RP, NISC Comparative
Sequencing Program. 2009. Dynamic evolution of V1R putative pher-
omone receptors between Mus musculus and Mus spretus. BMC
Genomics 10:74.
Lane RP, Cutforth T, Axel R, Hood L, Trask BJ. 2002. Sequence analysis of
mouse vomeronasal receptor gene clusters reveals common promoter
motifs and a history of recent expansion. Proc Natl Acad Sci U S A. 99:
291–296.
Lane RP, Young J, Newman T, Trask BJ. 2004. Species specificity in rodent
pheromone receptor repertoires. Genome Res. 14:603–608.
Leinders-Zufall T, et al. 2000. Ultrasensitive pheromone detection by mam-
malian vomeronasal neurons. Nature 405:792–796.
Markolf M, Brameier M, Kappeler PM. 2011. On species delimitation:
yet another lemur species or just genetic variation? BMC Evol Biol.
11:216.
Mittermeier R, et al. 2008. Lemur diversity in Madagascar. Int J Primatol.
29:1607–1656.
Mombaerts P. 2004. Genes and ligands for odorant, vomeronasal, and
taste receptors. Nat Rev Neurosci. 5:263–278.
Nagy A, et al. 2008. Identification and correction of abnormal, incomplete
and mispredicted proteins in public databases. BMC Bioinformatics 9:
353.
Nozawa M, Nei M. 2008. Genomic drift and copy number variation of
chemosensory receptor genes in humans and mice. Cytogenet
Genome Res. 123:263–269.
Ohara H, et al. 2009. Conserved repertoire of orthologous vomeronasal
type 1 receptor genes in ruminant species. BMC Evol Biol. 9:233.
Olivieri G, et al. 2007. The ever-increasing diversity in mouse lemurs: three
new species in north and northwestern Madagascar. Mol Phys Evol.
43:309–327.
Palczewski K, et al. 2000. Crystal structure of rhodopsin: a G protein-
coupled receptor. Science 289:739–745.
Park SH, Podlaha O, Grus WE, Zhang JZ. 2011. The microevolution of V1r
vomeronasal receptor genes in mice. Genome Biol Evol. 3:401–412.
Perret M. 1996. Manipulation of sex ratio at birth by urinary cues in a
prosimian primate. Behav Ecol Sociobiol. 38:259–266.
Perret M. 2005. Relationship between urinary estrogen levels before con-
ception and sex ratio at birth in a primate, the gray mouse lemur. Hum
Reprod. 20:1504–1510.
Perret M, Aujard F, Seguy M, Schilling A. 2003. Olfactory bulbectomy
modifies photic entrainment and circadian rhythms of body tempera-
ture and locomotor activity in a nocturnal primate. J Biol Rhythms. 18:
392–401.
Perret M, Schilling A. 1995. Sexual responses to urinary chemosignals
depend on photoperiod in a male primate. Physiol Behav. 58:633–639.
Pilpel Y, Lancet D. 1999. The variable and conserved interfaces of modeled
olfactory receptor proteins. Protein Sci. 8:969–977.
Rodriguez I, Del Punta K, Rothman A, Ishii T, Mombaerts P. 2002. Multiple
new and isolated families within the mouse superfamily of V1r vom-
eronasal receptors. Nat Neurosci. 5:134–140.
Rodriguez I, Greer CA, Mok MY, Mombaerts P. 2000. A putative phero-
mone receptor gene expressed in human olfactory mucosa. Nat
Genet. 26:18–19.
Ronquist F, et al. 2012. MrBayes 3.2: Efficient bayesian phylogenetic
inference and model choice across a large model space. Syst Biol.
61:539–542.
Roy A, Kucukural A, Zhang Y. 2010. I-TASSER: a unified platform for
automated protein structure and function prediction. Nat Protoc. 5:
725–738.
Rushmore J, Leonhardt SD, Drea CM. 2012. Sight or scent: lemur sensory
reliance in detecting food quality varies with feeding ecology. PLoS
One 7:e41558.
Sawyer SA. 1989. Statistical tests for detecting gene conversion. Mol Biol
Evol. 6:526–538.
Schilling A, Serviere J, Gendrot G, Perret M. 1990. Vomeronasal activation
by urine in the primate Microcebus murinus: a 2 DG study. Exp Brain
Res. 81:609–618.
Shi P, Bielawski JP, Yang H, Zhang YP. 2005. Adaptive diversification of
vomeronasal receptor 1 genes in rodents. J Mol Evol. 60:566–576.
Silvotti L, Cavalca E, Gatti R, Percudani R, Tirindelli R. 2011. A recent class
of chemosensory neurons developed in mouse and rat. PLoS One 6:
e24462.
Skrabanek L, Campagne F, Weinstein H. 2003. Building protein diagrams
on the web with the residue-based diagram editor RbDe. Nucleic Acids
Res. 31:3856–3858.
Smith TD, et al. 2002. Histological definition of the vomeronasal organ in
humans and chimpanzees, with a comparison to other primates. Anat
Rec. 267:166–176.
Stamatakis A. 2006. RAxML-VI-HPC: Maximum likelihood-based phyloge-
netic analyses with thousands of taxa and mixed models.
Bioinformatics 22:2688–2690.
Suarez R, Fernandez-Aburto P, Manger PR, Mpodozis J. 2011.
Deterioration of the G alpha o vomeronasal pathway in sexually di-
morphic mammals. PLoS One 6:e26436.
Suendermann D, Scheumann M, Zimmermann E. 2008. Olfactory preda-
tor recognition in predator-naive gray mouse lemurs (Microcebus mur-
inus). J Comp Psychol. 122:146–155.
Swaney WT, Keverne EB. 2009. The evolution of pheromonal communi-
cation. Behav Brain Res. 200:239–247.
Tirindelli R, Dibattista M, Pifferi S, Menini A. 2009. From pheromones to
behavior. Physiol Rev. 89:921–956.
Ubeda-Banon I, et al. 2011. Cladistic analysis of olfactory and vomeronasal
systems. Front Neuroanat. 5:1–14.
Vences M, Wollenberg KC, Vieites DR, Lees DC. 2009. Madagascar as a
model region of species diversification. Trends Ecol Evol. 24:456–465.
Venkatakrishnan AJ, et al. 2013. Molecular signatures of G-protein-
coupled receptors. Nature 494:185–194.
Wang GD, Shi P, Zhu ZH, Zhang YP. 2010. More functional V1R genes
occur in nest-living and nocturnal terricolous mammals. Genome Biol
Evol. 2:277–283.
Wang GD, Zhu ZH, Shi P, Zhang YP. 2010. Comparative genomic analysis
reveals more functional nasal chemoreceptors in nocturnal mammals
than in diurnal mammals. Chin Sci Bull. 55:3901–3910.
Yoder et al. GBE
226 Genome Biol. Evol. 6(1):213–227. doi:10.1093/gbe/evu006 Advance Access publication January 6, 2014
by guest on March 11, 2014
http://gbe.oxfordjournals.org/D
ownloaded from
Weisrock DW, et al. 2010. Delimiting species without nuclear monophyly
in Madagascar’s mouse lemurs. PLoS One 5:e9883.
Wilson DJ, McVean G. 2006. Estimating diversifying selection and func-
tional constraint in the presence of recombination. Genetics 172:
1411–1425.
Yang Z. 2007. PAML 4: Phylogenetic analysis by maximum likelihood. Mol
Biol Evol. 24:1586–1591.
Yang Z, Nielsen R. 2002. Codon-substitution models for detecting molec-
ular adaptation at individual sites along specific lineages. Mol Biol Evol.
19:908–917.
Yang Z, Nielsen R, Goldman N, Pedersen A-MK. 2000. Codon-substitution
models for heterogeneous selection pressure at amino acid sites.
Genetics 155:431–449.
Yang Z, Yoder AD. 2003. Comparison of likelihood and Bayesian methods
for estimating divergence times using multiple gene loci and calibra-
tion points, with application to a radiation of cute-looking mouse
lemur species. Syst Biol. 52:705–716.
Yoder AD. 2013. The lemur revolution starts now: the genomic coming of
age for a nonmodel organism. Mol Phys Evol. 66:442–452.
Yoder AD, Cartmill M, Ruvolo M, Smith K, Vilgalys R. 1996. Ancient single
origin of Malagasy primates. Proc Natl Acad Sci U S A. 93:5122–5126.
Yoder AD, Yang ZH. 2004. Divergence dates for Malagasy lemurs esti-
mated from multiple gene loci: geological and evolutionary context.
Mol Ecol. 13:757–773.
Yoder AD, et al. 2000. Remarkable species diversity in Malagasy mouse
lemurs (Primates, Microcebus). Proc Natl Acad Sci U S A. 97:
11325–11330.
Young JM, Kambere M, Trask BJ, Lane RP. 2005. Divergent V1R
repertoires in five species: amplification in rodents, decimation in pri-
mates, and a surprisingly small repertoire in dogs. Genome Res. 15:
231–240.
Young JM, Massa HF, Hsu L, Trask BJ. 2010. Extreme variability among
mammalian V1R gene families. Genome Res. 20:10–18.
Young JM, et al. 2003. Odorant receptor expressed sequence tags dem-
onstrate olfactory expression of over 400 genes, extensive alternate
splicing and unequal expression levels. Genome Biol. 4:R71.
Zhang J, Nielsen R, Yang Z. 2005. Evaluation of an improved branch-site
likelihood method for detecting positive selection at the molecular
level. Mol Biol Evol. 22:2472–2479.
Zhang XF, Goodsell J, Norgren RB. 2012. Limitations of the rhesus ma-
caque draft genome assembly and annotation. BMC Genomics 13:
206.
Zhao H, Xu D, Zhang S, Zhang J. 2011. Widespread losses of vomeronasal
signal transduction in bats. Mol Biol Evol. 28:7–12.
Zufall F, Kelliher KR, Leinders-Zufall T. 2002. Pheromone detection by
mammalian vomeronasal neurons. Microsc Res Tech. 58:251–60.
Associate editor: George Zhang
V1R Diversity in Strepsirrhine Primates GBE
Genome Biol. Evol. 6(1):213–227. doi:10.1093/gbe/evu006 Advance Access publication January 6, 2014 227
by guest on March 11, 2014
http://gbe.oxfordjournals.org/D
ownloaded from