Embed Size (px)
Citation preview

Modulation of ATP/ADP Concentration at the Endothelial Cell Surface
by Flow: Effect of Cell Topography
HYO WON CHOI and ABDUL I. BARAKAT
Department of Mechanical and Aeronautical Engineering, University of California, Davis, One Shields Avenue, Davis,CA 95616, USA
(Received 26 January 2009; accepted 31 August 2009; published online 18 September 2009)
Abstract—Determining how flow affects the concentration ofthe adenine nucleotides ATP and ADP at the vascularendothelial cell (EC) surface is essential for understandingflow-induced mobilization of intracellular calcium. Previ-ously, mathematical models were formulated to describe theATP/ADP concentration at the EC surface; however, allprevious models assumed the endothelium to be flat. In thepresent study we investigate the effect of surface undulationson ATP/ADP concentration at the EC surface. The resultsdemonstrate that under certain geometric and flow condi-tions, the ATP + ADP concentration at the EC surface isconsiderably lower for a wavy cell surface than for a flatsurface. Because ECs in regions of disturbed arterial flow areexpected to have larger undulations than cells in non-disturbed flow zones, our findings suggest that ECs inregions of flow disturbance would exhibit lower ATP+ADPconcentrations at their surfaces, which may lead to impairedcalcium signaling. If validated experimentally, the presentresults may contribute to our understanding of endothelialcell dysfunction observed in regions of disturbed flow.
Keywords—Endothelium, Cell waviness, Adenine nucleotides,
Shear stress, Mechanotransduction, Intracellular calcium,
Atherosclerosis.
INTRODUCTION
Blood flow-mediated mechanotransduction in vas-cular endothelial cells (ECs) is essential for normalvascular function,15,26 and abnormalities in EC flowsignaling play a role in the development of athero-sclerosis.2,18,27 A prominent early response to flow inECs is mobilization of intracellular calcium,1,12,13,17,31
an important second messenger that regulates down-stream signaling. It remains unknown, however, howthe flow-induced calcium response is triggered. A keyquestion in this regard, and one that has been the
subject of long-standing controversy, is whetherintracellular calcium changes are induced by a directeffect of the flow force on the EC surface (shear stresseffect), by an indirect effect whereby calcium is mobi-lized due to flow-induced alterations in cell-surfaceconcentration of agonists such as the adenine nucleo-tides ATP and ADP (shear rate effect), or by a com-bination of these processes.12,13,17,31 An importantadditional consideration is that flow induces ATPrelease in ECs.6,16,33
Mathematical models were previously developed toassess the effect of flow on adenine nucleotide con-centration at the EC surface. The earliest modelsfocused exclusively on ATP and on the simple case offlow between two infinitely wide parallel plates.19,20
Because ADP is virtually as potent as ATP inmobilizing EC intracellular calcium,22,24 subsequentmodeling included ADP.30 Experimental data demon-strating that flow elicits ATP release in ECs16 and theunsteady nature of blood flow in large arteries moti-vated incorporation of these effects into the model-ing.14 Most recently, the models have been extended tomore complex flow fields including regions of flowseparation and recirculation as well as arterialbranchings.8,9
Despite previous modeling efforts, it remainsunclear if flow-induced changes in intracellular calciumare mediated entirely by shear stress or if changes inATP/ADP concentration contribute significantly. Onereason for the uncertainty is the incomplete informa-tion on the dependence of flow-induced ATP release,which is a critical parameter for determining cell-sur-face nucleotide concentration,8,14 on shear stress.Another limitation in previous models is that they haveall treated the endothelium as a flat (non-wavy) sur-face. The undulating nature of the endothelium haspreviously been shown to greatly impact the shearstress distribution on the cell surface3,4,28; however, theramifications of these subcellular shear stress varia-tions for adenine nucleotide concentration at the EC
Address correspondence to Abdul I. Barakat, Department of
Mechanical and Aeronautical Engineering, University of California,
Davis, One Shields Avenue, Davis, CA 95616, USA. Electronic mail:
Annals of Biomedical Engineering, Vol. 37, No. 12, December 2009 (� 2009) pp. 2459–2468
DOI: 10.1007/s10439-009-9793-z
0090-6964/09/1200-2459/0 � 2009 The Author(s). This article is published with open access at Springerlink.com
2459

surface remain unexplored. In the present work, weperformed computational simulations to probe theimpact of cell waviness on ATP/ADP concentration atthe EC surface. The results demonstrate that: (1) in theabsence of flow-induced ATP release, EC waviness hasa negligible effect on total nucleotide (ATP + ADP)concentration at the EC surface; (2) in the presence ofrobust flow-induced ATP release, EC waviness signif-icantly alters the ATP + ADP concentration at theEC surface; and (3) the absence of ATP in the perfu-sion media amplifies the effect of cell waviness onnucleotide concentration at the cell surface.
COMPUTATIONAL METHODS
Computational Geometry
Similar to previous models,19,20,30 the simulationsassume fully developed steady flow in a parallel plateflow chamber with ECs fully covering the bottomchamber surface. Unlike previous studies, however, theEC surface is considered to be wavy (Fig. 1). Themodel assumes a flow chamber height, H, of 200 lm, atypical value used in EC experiments and a chamberlength, L, of 1500 lm. h denotes EC height, while kand x denote cell length in the streamwise and span-wise directions respectively. Based on atomic forcemicroscopy (AFM) imaging of live cultured bovineaortic endothelial cells (BAECs),3 we consider therange 0 £ h/k £ 0.15. The wavy EC surface is assumedto be sinusoidal with undulations in both the stream-wise and spanwise directions as follows:
y ¼ h � sin2 px=kð Þ � sin2 pz=xð Þ: ð1Þ
Baseline parameter values for the simulations areprovided in Table 1.
A structured mesh is used (shown for the EC surfacein Fig. 1), and the grid distribution has been verified toyield mesh-independent solutions for both flow andconcentration. More specifically, for the most chal-lenging computational case, increasing mesh density by20% relative to that shown in Fig. 1 (which reduces theminimum mesh size in the y-direction to less than halfof that in Fig. 1) leads to peak wall shear stress andtotal nucleotide concentration values that are within1% of those shown in ‘‘Results.’’ The finer mesh dis-tribution in the vicinity of the walls allows resolutionof the large velocity and concentration gradients inthose regions.
Governing Equations and Numerical Methods
The simulations involve solving the continuity andlinear momentum equations for the flow field and theconvection-diffusion equation for nucleotide concen-tration. Previous modeling has shown that for typicalflow chamber dimensions and a physiological fre-quency of 1 Hz, flow unsteadiness has very littleimpact on the mean (time-average) nucleotide con-centration at the EC surface14; therefore, all presentsimulations assume steady flow. The governing equa-tions are:
Continuity:@ui@xi¼ 0 ð2Þ
Momentum: q@ uiuj� �
@xj¼ �@p
@xiþ l
@
@xj
@ui@xj
� �ð3Þ
Convection-Diffusion: ui@c
@xi¼ D
@
@xi
@c
@xi
� �; ð4Þ
where q is the fluid density, ui is the fluid velocity in thei direction, l is the dynamic viscosity of the fluid, c isthe nucleotide concentration, and D is the nucleo-tide diffusion coefficient in the fluid. The workingfluid is assumed to be cell culture medium with
FIGURE 1. Geometric model used in the numerical simula-tions illustrating the wavy EC surface along the bottom sur-face of a parallel plate flow chamber as well as thecomputational mesh used in the simulations. Note that thedepicted mesh shows only a portion of the entire computa-tional domain.
TABLE 1. Geometric parameters used in the simulations.
Cell
height,
h (lm)
Cell length
in streamwise
direction,
k (lm)
Cell length
in spanwise
direction,
x (lm) h/k
Channel
height,
H (lm)
Channel
length,
L (lm)
0 30 30 0 200 1500
1.5 0.05
3 0.1
4.5 0.15
Cell topography values are based on AFM data by Barbee et al.3
H. W. CHOI AND A. I. BARAKAT2460
q = 1000 kg m�3 and l = 7.77 9 10�4 kg m�1 s�1.Equation (4) applies for both ATP and ADP, exceptthat the value of D is different for the two nucleotides.
A no-slip (zero velocity) boundary condition isapplied at the top wall of the flow chamber and at theEC surface (bottom wall). At the flow inlet (x/k = 0), aparabolic fully developed velocity profile is imposedwith the mean inlet velocity (uo) adjusted to yield wallshear stress levels at the inlet (so) in the physiologicallyrelevant range of 0.5–8 Pa (5–80 dyne cm�2). Fullydeveloped flow (zero velocity gradient in the axialdirection) is specified at the flow outlet (x/k = 50). Aperiodic boundary is assumed along the lateral sides ofthe computational domain, implying that the domainrepeats infinitely in the spanwise direction.
For nucleotide concentration, boundary conditionsare needed for both ATP and ADP. At the flow inlet,most simulations are performed with a constant ATPconcentration co = 0.1 lM, a value that approximatesnormal ATP levels in the bloodstream.5 Limited simu-lations are also performed with a zero ATP concentra-tion at the inlet. ADP concentration at the flow inlet isassumed to be zero in all simulations. At the flow outlet,a zero diffusion flux (D¶c/¶x = 0) is assumed for bothATP and ADP. At the top wall, a zero mass flux isimposed for both ATP and ADP. At the bottom surfaceof the chamber where the ECs are present, ATP andADP hydrolysis follows irreversible Michaelis-Mentenkinetics. For ATP, the net mass flux is given as:
DATP@cATP
@n
����w
¼ Vmax;ATP � cATP
Km;ATP þ cATP� SATP swð Þ; ð5Þ
where n is the unit vector normal to the EC surface,DATP is the ATP diffusion coefficient in cell culturemedium, Vmax,ATP is the maximum enzyme reactionvelocity for ATP hydrolysis, Km,ATP is the Michaelisconstant for the enzyme, and SATP is the source termfor flow-induced ATP release. Similar to our previousstudies,8,14 SATP is assumed to be a sigmoidallyincreasing function of wall shear stress (sw) as follows:
SATP swð Þ ¼ Smax 1� exp � swsref
� �� �3; ð6Þ
where sref is a reference shear stress that regulates therate at whichmaximumATP release is reached and Smax
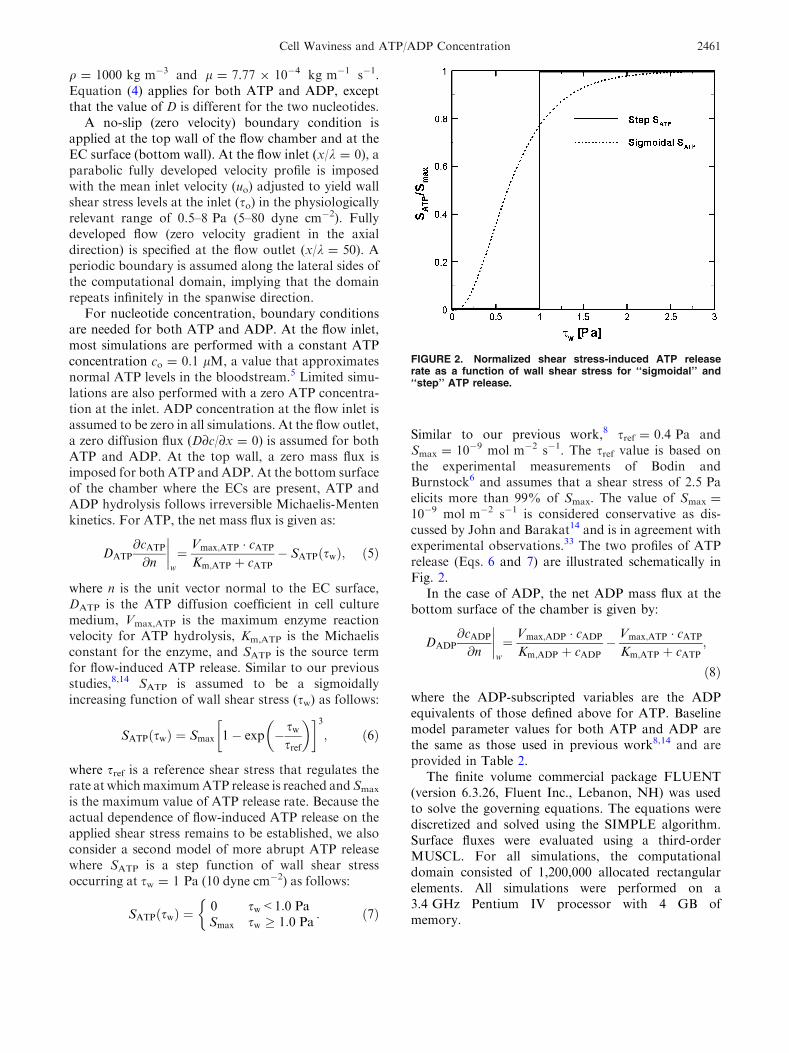
is the maximum value of ATP release rate. Because theactual dependence of flow-induced ATP release on theapplied shear stress remains to be established, we alsoconsider a second model of more abrupt ATP releasewhere SATP is a step function of wall shear stressoccurring at sw = 1 Pa (10 dyne cm�2) as follows:
SATP swð Þ ¼0 sw<1:0 PaSmax sw � 1:0 Pa
�: ð7Þ
Similar to our previous work,8 sref = 0.4 Pa andSmax = 10�9 mol m�2 s�1. The sref value is based onthe experimental measurements of Bodin andBurnstock6 and assumes that a shear stress of 2.5 Paelicits more than 99% of Smax. The value of Smax =
10�9 mol m�2 s�1 is considered conservative as dis-cussed by John and Barakat14 and is in agreement withexperimental observations.33 The two profiles of ATPrelease (Eqs. 6 and 7) are illustrated schematically inFig. 2.
In the case of ADP, the net ADP mass flux at thebottom surface of the chamber is given by:
DADP@cADP
@n
����w
¼ Vmax;ADP � cADP
Km;ADP þ cADP� Vmax;ATP � cATP
Km;ATP þ cATP;
ð8Þ
where the ADP-subscripted variables are the ADPequivalents of those defined above for ATP. Baselinemodel parameter values for both ATP and ADP arethe same as those used in previous work8,14 and areprovided in Table 2.
The finite volume commercial package FLUENT(version 6.3.26, Fluent Inc., Lebanon, NH) was usedto solve the governing equations. The equations werediscretized and solved using the SIMPLE algorithm.Surface fluxes were evaluated using a third-orderMUSCL. For all simulations, the computationaldomain consisted of 1,200,000 allocated rectangularelements. All simulations were performed on a3.4 GHz Pentium IV processor with 4 GB ofmemory.
FIGURE 2. Normalized shear stress-induced ATP releaserate as a function of wall shear stress for ‘‘sigmoidal’’ and‘‘step’’ ATP release.
Cell Waviness and ATP/ADP Concentration 2461

RESULTS
Effect of Cell Waviness on Shear Stress Distributionat the EC Surface
Figure 3 depicts contour plots of normalized wallshear stress on the EC surface (sw/so) for differentdegrees of cell waviness (0 £ h/k £ 0.15). The normal-ization shear stress so is defined as the wall shearstress at the inlet of the flow chamber (x/k = 0 whereh/k = 0). Although Fig. 3 is for so = 1.0 Pa, theresults are virtually identical over a wide range of so(0.5 £ so £ 8 Pa)—the absolute magnitude of sw nat-urally increases with increasing so for all values of h/k;however, the behavior of the normalized wall shearstress (sw/so) is virtually independent of so. In theabsence of cell waviness (h/k = 0; Fig. 3a), the wallshear stress is everywhere so as expected. Consistentwith previous studies,4 the shear stress on the EC sur-face in the presence of waviness (h/k > 0; Figs. 3b–3d)is significantly larger than so in the central portion ofthe cell and significantly smaller than so toward the cellperiphery. The magnitude of these subcellular varia-tions in shear stress increases with increasing cellwaviness.
As apparent from Fig. 3, the magnitude of thepeak shear stress on the EC surface increases withincreasing cell waviness. Figure 4a demonstrates thatthis increase is linear for the range of wavinessstudied (0 £ h/k £ 0.15). The peak wall shear stressfor the most undulating surface (h/k = 0.15) is 127%larger than that for a flat surface. The average shearstress on the cell surface, however, is only weaklydependent on waviness and in fact decreases slightlywith increasing waviness (Fig. 4b); the average wallshear stress for h/k = 0.15 is 7% smaller than that fora flat surface. Because the EC surface area obtainedby surface integration of Eq. (1) along a single ECsurface is virtually the same for all values of h/kstudied (a difference of less than 4% for 0 £h/k £ 0.15), the results of Fig. 4b indicate that thetotal shear force exerted on a single EC remainsvirtually constant or even decreases slightly withincreasing EC waviness.
Effect of Cell Waviness on ATP + ADP Concentrationat the EC Surface
Nucleotide concentration at the EC surface isdetermined by a balance among the rates of convec-tive/diffusive transport to and from the EC surface,flow-induced ATP release, and nucleotide hydrolysis atthe EC surface by the three ectonucleotidases thatcatalyze the reaction sequence ATP fi ADP fiAMP fi adenosine.23 As in previous studies,8,14,30 wefocus in the present study on the ATP + ADP con-centration since both ATP and ADP (but not AMP oradenosine) induce significant mobilization of intracel-lular calcium in endothelium.22,24
Figure 5 depicts contour plots of normalized AT-P + ADP concentration (cATP+ADP/co) on the ECsurface for so = 1.0 Pa and for different degrees of cellwaviness. We consider a group of cells positioned near
TABLE 2. Parameter values for adenine nucleotides used inthe simulations.
ATP ADP
D (m2 s�1) 2.36 9 10�10 2.57 9 10�10
Km (lM) 475 155
Vmax (mol m�2 s�1) 8 9 10�7 1 9 10�7
Values are derived from Cusack et al.10 Maximum reaction velocity
per area assumes a cell area of 1400 lm2.
FIGURE 3. Contours of the normalized wall shear stress(sw/so) on the EC surface for different degrees of cell waviness.(a) h/k 5 0; (b) h/k 5 0.05; (c) h/k 5 0.1; (d) h/k 5 0.15.
H. W. CHOI AND A. I. BARAKAT2462

the flow outlet (45 £ x/k £ 50) and the three cases ofno flow-induced ATP release, sigmoidal release, andstep release (see Fig. 2). In the absence of ATP release(Fig. 5a), the concentration values are not significantlydifferent for the different h/k values and cell wavinessleads to very small subcellular variations in ATP +ADP concentration. In the presence of flow-inducedATP release (Figs. 5b and 5c), on the other hand, theATP + ADP concentration globally decreases as theEC surface becomes more wavy (i.e. h/k increases),reflecting the effect of decreased average wall shearstress (cf. Fig. 4b) which leads to decreased ATPrelease plus increased fluid residence time and henceto increased nucleotide hydrolysis. Increased cell
FIGURE 4. Effect of EC waviness on the ratio of (a) peak wallshear stress on the wavy EC surface to that on a flat surfaceand (b) cell-average wall shear stress on the wavy EC surfaceto that on a flat surface. so 5 1.0 Pa.
FIGURE 5. Contours of the normalized ATP + ADP concen-tration (cATP+ADP/co) on the EC surface for so 5 1.0 Pa and fordifferent degrees of cell waviness (0 £ h/k £ 0.15). (a) No flow-induced ATP release; (b) sigmoidal release; (c) step release.
Cell Waviness and ATP/ADP Concentration 2463

waviness is also accompanied by a significant increasein the amplitude of subcellular variations in concen-tration as a result of the larger subcellular variations inwall shear stress (cf. Fig. 3).
Although the subcellular variations in normalizedATP + ADP concentration, even at their largest level(h/k = 0.15 and step release in Fig. 5), are significantlysmaller than those of wall shear stress (compare toFig. 3), the effect of cell waviness on nucleotide con-centration at the EC surface is significant. Figure 6depicts the ratio of average cATP+ADP at the EC
surface for a wavy cell to that of a flat cell (h/k = 0) asa function of h/k for so = 1.0 Pa and for the cases ofno flow-induced ATP release, sigmoidal release, andstep release. Because nucleotide concentration dependson the axial position within the flow chamber due tothe development of the concentration boundary layer,the results are shown separately for a cell whose centeris positioned toward the inlet of the flow chamber(x/k = 9.5; Fig. 6a) and one whose center is toward theoutlet (x/k = 39.5; Fig. 6b). In the absence of flow-induced ATP release, the cell-average ATP + ADPconcentration on a wavy EC surface exhibits negli-gible deviation from that of a flat EC irrespective ofwhere the EC of interest is located. In the presence offlow-induced ATP release, however, the cell-averageATP + ADP concentration decreases with increasingwaviness. This decrease is more pronounced for steprelease than for sigmoidal release and has a largermagnitude further downstream as the concentrationboundary layer eventually becomes fully developed.
The results thus far were for a nominal wall shearstress so = 1.0 Pa, which corresponds to the step in theATP step release model (cf. Fig. 2). It is importantto establish if the impact of cell waviness on ATP +ADP concentration also occurs at other shear stresslevels. Figure 7 depicts the ratio of cell-average ATP+ADP concentration for a wavy EC (h/k = 0.15) to thatfor a flat cell (h/k = 0) as a function of the appliednominal shear stress for the case of step ATP releaseand at the two axial positions defined previously inFig. 6. The results demonstrate that at both positions,the effect of cell waviness is pronounced for so in therange 1.0–2.0 Pa but is significantly smaller at lower orhigher shear stresses. In light of the finding that flow-induced ATP release is required for cell waviness tohave a significant effect on the ATP + ADP concen-tration at the EC surface (cf. Fig. 5), the behavior inFig. 7 is attributable to the fact that at the low end ofthe shear stress spectrum, the wall shear stresses aretoo low to induce significant ATP release whereas atthe high end of the shear stress spectrum, the release is‘‘saturated’’ such that there is no significant differencein ATP release between the wavy and flat surfaces.
Effect of EC Waviness on ATP + ADP Concentrationfor ATP-Free Perfusion
There has been a long-standing controversy aboutwhether or not the presence of ATP in the perfusionmedium plays an important role in flow-inducedintracellular calcium mobilization in ECs.12,13,17,31
John and Barakat14 demonstrated that if flow-inducedATP release is accounted for and if this release issufficiently robust, then different shear stress levels
FIGURE 6. Effect of EC waviness on the ratio of cell-averageATP + ADP concentration for a wavy EC surface to that for aflat EC surface for the different ATP release profiles andso 5 1.0 Pa. (a) Cell positioned toward the flow inlet (centeredat x/k 5 9.5). (b) Cell positioned towards the flow outlet(centered at x/k 5 39.5).
H. W. CHOI AND A. I. BARAKAT2464

may lead to significantly different nucleotide concen-trations at the EC surface even in the absence ofATP in the perfusion medium. To investigate the effectof EC waviness on nucleotide concentration in theabsence of ATP in the perfusion medium, we per-formed a limited number of simulations for both sig-moidal and step ATP release at so = 1.0 Pa and withco = 0. As illustrated in Fig. 8, the reduction inATP + ADP concentration induced by cell wavinessis amplified in the absence of ATP in the perfusionmedium for both sigmoidal and step ATP release(compare with Fig. 6). Therefore, EC waviness appears
to have a more pronounced effect on adenine nucleo-tide concentration at the EC surface when the perfu-sion medium contains no ATP.
DISCUSSION
The adenine nucleotides ATP and ADP are involvedin regulating nitric oxide release and intracellular cal-cium mobilization in ECs7,24; therefore, establishinghow flow modulates ATP/ADP concentration at theEC surface is important for understanding flow-mediated mechanotransduction. Previous studies hadpresented mathematical models for ATP/ADP con-centration under steady and pulsatile flow within par-allel plate flow chambers as well as geometries thatelicit flow disturbance such as backward facingsteps8,11,14,19,20,25,30 and aortic branchings.9 All previ-ous reports, however, neglected the waviness of the ECsurface. EC surface topography has previously beenshown to have a profound effect on the subcellularwall shear stress distribution.4,28 To our knowledge,the present study is the first to investigate the effect ofEC waviness on nucleotide concentration at the cellsurface.
Similar to findings in other studies,4,28 our resultsdemonstrate significant subcellular variations in wallshear stress with peak levels corresponding to thelocation of maximal cell height. Interestingly, however,we found that the cell-average shear stress is onlyweakly dependent on cell waviness and is in fact
FIGURE 7. Effect of the nominal wall shear stress so on theratio of cell-average ATP + ADP concentration for a wavy ECsurface to that for a flat EC surface. Step ATP release isassumed and h/k 5 0.15. (a) Cell positioned toward the flowinlet (centered at x/k 5 9.5). (b) Cell positioned toward theflow outlet (centered at x/k 5 39.5).
FIGURE 8. Effect of EC waviness on the ratio of cell-averageATP + ADP concentration for a wavy EC surface to that for aflat EC surface for ATP-free perfusion at so 5 1.0 Pa. Shownare the results for a cell toward the flow outlet (centered atx/k 5 39.5). (a) Step ATP release; (b) sigmoidal ATP release.
Cell Waviness and ATP/ADP Concentration 2465

smaller for a very wavy surface than for a flat surfacefor the sinusoidal EC surface topography considered.The implications of these findings for flow-mediatedmechanotransduction in ECs depend on how cellssense shear stress when stimulated by flow. If ECsrespond to the peak shear stress level or to subcellularspatial gradients of wall shear stress, then cell wavinessplays a critical role. If, on the other hand, ECs respondto the average shear stress or the total applied shearforce, then cell waviness would be expected to con-tribute only minimally.
Our simulations have demonstrated that in theabsence of flow-induced ATP release, the wavy natureof the EC surface has virtually no impact on theATP + ADP concentration at the EC surface. Onceflow-induced ATP release is accounted for, however,the undulating EC surface significantly affects theATP + ADP concentration. More specifically, theaverage ATP + ADP surface concentration over asingle EC decreases significantly as cell wavinessincreases, and this decrease is more pronounced for amore developed concentration boundary layer thanwithin the entrance region. We had previously dem-onstrated that the ATP + ADP concentration at theEC surface within flow recirculation zones is signifi-cantly lower than that outside these zones.8 BecauseECs are cuboidal within flow recirculation regions andelongated outside these regions18,21 and because elon-gated ECs are less wavy than cuboidal cells,3 thepresent findings suggest that cell waviness may amplifythe effect of flow recirculation to result in even lowerATP + ADP concentration at the EC surface. In lightof the involvement of adenine nucleotides in the releaseof nitric oxide and the mobilization of intracellularcalcium in ECs and the importance of these responsesfor normal EC signaling, lower ATP + ADP con-centrations within flow recirculation zones might leadto impaired signaling and hence may contribute toendothelial dysfunction within flow recirculationzones. The validity of this conjecture needs to beexperimentally verified.
The effect of cell waviness on ATP + ADP con-centration at the EC surface was determined to bemost pronounced at a nominal wall shear stressso = 1.0 Pa. This finding is not surprising as this levelcorresponds to the ‘‘critical’’ shear stress at which thestep increase in flow-induced ATP release is assumedto occur and hence is the level around which ATPrelease is most sensitive to changes in shear stress. It isnoteworthy, however, that the effect of waviness onnucleotide concentration is not confined to the criticalnominal shear stress but also occurs at other shearstress levels, although the effect vanishes as the nomi-nal shear stress levels become very small or excessivelylarge. Naturally, selecting a different critical shear
stress for the occurrence of the step increase in ATPrelease would lead to a shift in the results; however, thefundamental behavior will not be altered. These resultsunderscore the need for carefully controlled experi-mental measurements of the detailed dependence ofATP release on the applied shear stress in ECs.
Whether or not flow-induced mobilization ofintracellular calcium in ECs requires the presenceof ATP in the perfusion medium has been a matter oflong-standing controversy. Some studies12,17 havesuggested that the calcium response only occurs in thepresence of ATP in the perfusion media while oth-ers13,31 have observed the response even for ATP-feeperfusion. Consistent with our previous studies,8,14
the present simulations have shown that when flow-induced ATP release is accounted for, significantconcentrations of ATP + ADP are attainable withinflow chambers even in the absence of ATP in theperfusion medium. The present simulations have alsodemonstrated that the effects of EC waviness onATP + ADP concentration on the EC surface that areobserved for ATP-containing medium are amplified inthe absence of ATP in the perfusion medium.
In the present study, we investigated the effect ofdifferent levels of cell waviness (0 £ h/k £ 0.15) on theATP/ADP concentration at the cell surface. The pri-mary motivation for considering different levels ofwaviness is the fact that experiments on culturedBAECs have demonstrated a reduction in cell height inresponse to flow. It should be noted, however, that adetailed reading of the literature suggests that theeffect of shear stress on EC waviness remains incom-pletely characterized. Barbee et al.3 reported a signifi-cant reduction in BAEC height following exposure to ashear stress of 1.2 Pa (12 dyne cm�2) for 24 h.Stamatas and McIntire32 reported that BAECsexposed to either venous (1.3 dyne cm�2) or arterial(13 dyne cm�2) levels of shear stress undergo a rapidheight reduction of ~1 lm after 3 min of flow andsuggested that this reduced-height configuration ismaintained thereafter. Conversely, Sato et al.29
reported no significant height reduction in BAECsexposed to a shear stress of 20 dyne cm�2 for 24 h.Reasons for the differences among the various studiesremain to be determined. Furthermore, how thesein vitro observations compare to the situation in vivoremains to be determined.
In light of the data suggesting an effect of shearstress on endothelial cell waviness3,32 and our currentfindings that cell waviness modulates ATP/ADP con-centration at the cell surface, it might appear reason-able for future simulations to investigate the couplingbetween flow-induced changes in waviness and ATP/ADP concentration at the cell surface. Such simula-tions would account for the fluid-structure interaction
H. W. CHOI AND A. I. BARAKAT2466

which determines the effect of shear stress on cellwaviness and then dynamically couple the results toadenine nucleotide concentration at the cell surface.Our present simulations, however, suggest that such anapproach is not necessary. The flow-modulated chan-ges in nucleotide concentration reported here occurmuch more rapidly than flow-induced changes in cellwaviness. More specifically, the nucleotide changesattain their steady-state values within ~10 s of flowonset, whereas changes in cell waviness require at leasta few minutes32 or possibly longer. Given this dis-crepancy in time constants, it is reasonable to assume,as done in the present paper, that ATP/ADP changesfor a given set of flow conditions occur in the presenceof a constant degree of cell waviness (i.e. a constant h/kvalue).
Many of the predictions of the present simulationsawait experimental verification. The rapidly evolvingtechnology of microscale fluidic systems in combina-tion with submicron-scale sensors promises to providethe necessary tools for making measurements ofsubcellular wall shear stress levels and adenine nucle-otide concentrations. The resulting information willundoubtedly enhance our understanding of the fun-damental mechanisms governing flow-mediated cellu-lar mechanotransduction.
OPEN ACCESS
This article is distributed under the terms ofthe Creative Commons Attribution NoncommercialLicense which permits any noncommercial use, distri-bution, and reproduction in any medium, provided theoriginal author(s) and source are credited.
REFERENCES
1Ando, J., A. Ohtsuka, R. Korenaga, and A. Kamiya.Effect of extracellular ATP level on flow-induced Ca++
response in cultured vascular endothelial cells. Biochem.Biophys. Res. Commun. 179:1192–1199, 1991.2Barakat, A. I. Responsiveness of vascular endothelium toshear stress: potential role of ion channels and cellularcytoskeleton (review). Int. J. Mol. Med. 4:323–332, 1999.3Barbee, K. A., P. F. Davies, and R. Lal. Shear stress-induced reorganization of the surface topography of livingendothelial cells imaged by atomic force microscopy. Circ.Res. 74:163–171, 1994.4Barbee, K. A., T. Mundel, R. Lal, and P. F. Davies.Subcellular distribution of shear stress at the surface offlow-aligned and nonaligned endothelial monolayers. Am.J. Physiol. 37:H1765–H1772, 1995.5Bodin, P., and G. Burnstock. ATP-stimulated release ofATP by human endothelial cells. J. Cardiovasc. Pharmacol.27:872–875, 1996.
6Bodin, P., and G. Burnstock. Evidence that release ofadenosine triphosphate from endothelial cells duringincreased shear stress is vesicular. J. Cardiovasc. Pharma-col. 38:900–908, 2001.7Burnstock, G., and C. Kennedy. A dual function foradenosine 5¢-triphosphate in the regulation of vasculartone—excitatory cotransmitter with noradrenaline fromperivascular nerves and locally released inhibitory intra-vascular agent. Circ. Res. 58:319–330, 1986.8Choi, H. W., K. W. Ferrara, and A. I. Barakat. Modula-tion of ATP/ADP concentration at the endothelial surfaceby shear stress: effect of flow recirculation. Ann. Biomed.Eng. 35:505–516, 2007.9Comerford, A., and T. David. Computer model of nucle-otide transport in a realistic porcine aortic trifurcation.Ann. Biomed. Eng. 36:1175–1187, 2008.
10Cusack, N. J., J. D. Pearson, and J. L. Gordon. Stereose-lectivity of ectonucleotidases on vascular endothelial cells.Biochem. J. 214:975–981, 1983.
11David, T. Wall shear stress modulation of ATP/ADPconcentration at the endothelium. Ann. Biomed. Eng.31:1231–1237, 2003.
12Dull, R. O., and P. F. Davies. Flow modulation of agonist(ATP)-response (Ca2+) coupling in vascular endothelialcells. Am. J. Physiol. 261:H149–H154, 1991.
13Geiger, R. V., B. C. Berk, R. W. Alexander, and R. M.Nerem. Flow-induced calcium transients in single endo-thelial cells—spatial and temporal analysis. Am. J. Physiol.262:C1411–C1417, 1992.
14John, K., and A. I. Barakat. Modulation of ATP/ADPconcentration at the endothelial surface by shear stress:effect of flow-induced ATP release. Ann. Biomed. Eng.29:740–751, 2001.
15Langille, B. L., and F. O’Donnell. Reductions in arterialdiameter produced by chronic decreases in blood flow areendothelium-dependent. Science 231:405–407, 1986.
16Milner, P., K. A. Kirkpatrick, V. Ralevic, V. Toothill,J. Pearson, and G. Burnstock. Endothelial cells culturedfrom human umbilical vein release ATP, substance P andacetylcholine in response to increased flow. Proc. R. Soc. B241:245–248, 1990.
17Mo, M., S. G. Eskin, and W. P. Schilling. Flow-Inducedchanges in Ca2+ signaling of vascular endothelial cells—effect of shear stress and ATP. Am. J. Physiol. 260:H1698–H1707, 1991.
18Nerem, R. M. Vascular fluid mechanics, the arterial wall,and atherosclerosis. J. Biomech. Eng. 114:274–282, 1992.
19Nollert, M. U., S. L. Diamond, and L. V. Mcintire.Hydrodynamic shear stress and mass transport modulationof endothelial cell metabolism. Biotechnol. Bioeng. 38:588–602, 1991.
20Nollert, M. U., and L. V. Mcintire. Convective masstransfer effects on the intracellular calcium response ofendothelial cells. J. Biomech. Eng. 114:321–326, 1992.
21Okano, M., and Y. Yoshida. Endothelial cell morphometryof atherosclerotic lesions and flow profiles at aortic bifur-cations in cholesterol-fed rabbits. J. Biomech. Eng.114:301–308, 1992.
22Olsson, R. A., and J. D. Pearson. Cardiovascular purino-ceptors. Physiol. Rev. 70:761–845, 1990.
23Pearson, J. D., and J. L. Gordon. Vascular endothelial andsmooth muscle cells in culture selectively release adeninenucleotides. Nature 281:384–386, 1979.
24Pirotton, S., E. Raspe, D. Demolle, C. Erneux, and J. M.Boeynaems. Involvement of Inositol 1,4,5-trisphosphate
Cell Waviness and ATP/ADP Concentration 2467

and calcium in the action of adenine nucleotides on aorticendothelial cells. J. Biol. Chem. 262:17461–17466, 1987.
25Plank, M. J., A. Comerford, T. David, and D. J. N. Wall.Concentration of blood-borne agonists at the endothelium.Proc. R. Soc. A 462:671–688, 2006.
26Pohl, U., J. Holtz, R. Busse, and E. Bassenge. Crucial roleof endothelium in the vasodilator response to increasedflow in vivo. Hypertension 8:37–44, 1986.
27Ross, R. The pathogenesis of atherosclerosis—a perspec-tive for the 1990s. Nature 362:801–809, 1993.
28Satcher, R. L., S. R. Bussolari, M. A. Gimbrone, and C. F.Dewey. The distribution of fluid forces on model arterialendothelium using computational fluid dynamics. J. Bio-mech. Eng. 114:309–316, 1992.
29Sato, M., K. Nagayama, N. Kataoka, M. Sasaki, andK. Hane. Local mechanical properties measured by atomic
force microscopy for cultured bovine endothelial cellsexposed to shear stress. J. Biomech. 33:127–135, 2000.
30Shen, J., M. A. Gimbrone, F. W. Luscinskas, and C. F.Dewey. Regulation of adenine nucleotide concentration atendothelium fluid interface by viscous shear flow. Biophys.J. 64:1323–1330, 1993.
31Shen, J., F. W. Luscinskas, A. Connolly, C. F. Dewey, andM. A. Gimbrone. Fluid shear stress modulates cytosolicfree calcium in vascular endothelial cells. Am. J. Physiol.262:C384–C390, 1992.
32Stamatas, G. N., and L. V.McIntire. Rapid flow-induced res-ponses in endothelial cells.Biotechnol.Prog.17:383–402, 2001.
33Yamamoto, K., T. Sokabe, N. Ohura, H. Nakatsuka, A.Kamiya, and J. Ando. Endogenously releasedATPmediatesshear stress-induced Ca2+ influx into pulmonary arteryendothelial cells. Am. J. Physiol. 285:H793–H803, 2003.
H. W. CHOI AND A. I. BARAKAT2468