Embed Size (px)
Citation preview

i
The role of Endothelial Cell Specific
Chemotaxis Regulator (ECSCR) in
endothelial cell biology
By Ana Raquel Andrade Veríssimo
A Thesis submitted to The University of Birmingham for the degree of
DOCTOR OF PHILOSOPHY
School of Immunity and Infection
College of Medical and Dental Sciences
The University of Birmingham
September 2012

University of Birmingham Research Archive
e-theses repository This unpublished thesis/dissertation is copyright of the author and/or third parties. The intellectual property rights of the author or third parties in respect of this work are as defined by The Copyright Designs and Patents Act 1988 or as modified by any successor legislation. Any use made of information contained in this thesis/dissertation must be in accordance with that legislation and must be properly acknowledged. Further distribution or reproduction in any format is prohibited without the permission of the copyright holder.

i
ABSTRACT
Angiogenesis, although a natural process, when deregulated can be associated with
many human pathologies, including cancer. The endothelial cells play a crucial role
in the growth and remodelling of the vasculature. A novel unique endothelial
marker, endothelial cell specific chemotaxis regulator (ECSCR), has been identified
and the aim of this project was to characterise its expression patterns and
mechanism of action.
In HUVECs the interaction with filamin A was confirmed and immunoprecipitation
has pulled down several cytoskeletal proteins involved in cell movement, including
moesin, that binds to ECSCR. ECSCR loss causes cytoskeleton to be disorganised
and overexpression induces filopodia in HEK 293T cells, but not M2 cells, that do
not contain filamin A.
In zebrafish ECSCR is restricted to the major trunk and head vasculature, whereas
in mouse it appears to be present also in the intersegmental vessels. Morpholino
mediated knockdown of zebrafish Escr caused disruption of intersegmental vessel
sprouting from the trunk vessels. The original phenotype was successfully rescued.
A null Ecscr knockout mouse has been produced and preliminary data show that
the deletion is not lethal and ECSCR is present in some small vessels, but not all
vasculature. Loss of ECSCR may result in respiratory complications.

ii
ACKNOWLEDGEMENTS
First and foremost, I would like to express my gratitude to my supervisor, Professor
Roy Bicknell. Thank you very much for all your patience, support and advice. It
was a great pleasure and a privilege to be a part of your team.
I thank Rajeeb, my supervisor for a year, who taught me a great deal about fish and
my other fish supervisor, Dr, Ferenc Mueller.
Many thanks to all the Bicknell lab members, past and present, effective and
extended, by neighbouring effect. Life would not have been the same without the
lunchtime daily crosswords.
Thank you to my friends, especially Anabela and Vanessa, for all your friendship
and support.
Finally, I would like to thank my family, especially my parents, for being there,
always.

iii
TABLE OF CONTENTS
Abstract ................................................................................................................................ i
Acknowledgements ............................................................................................................. ii
Table of CONTENTS ............................................................................................................ iii
List of figures ...................................................................................................................... vii
Abbreviations .................................................................................................................... viii
1 General introduction ........................................................................................................ 1
1.1 The role of endothelial cells in angiogenesis ...................................................... 2
1.2 Developmental and pathological angiogenesis .................................................. 2
1.3 Targeting angiogenesis ....................................................................................... 3
1.4 The identification and characterization of endothelial cell specific chemotaxis
regulator (ECSCR) ............................................................................................................ 6
1.5 Cell migration: the fine orchestration between protrusion, retraction and
adhesion ........................................................................................................................ 12
1.5.1 Filopodia and lamellipodia at the leading edge of migrating cells ........... 12
1.5.2 The role of cell-matrix adhesions in cell migration ................................... 16
1.6 Cell-cell adhesion .............................................................................................. 19
1.7 Filamins and cytoskeleton ................................................................................. 19
1.8 Angiogenesis assays and models ...................................................................... 27
1.9 Hypothesis ......................................................................................................... 30
1.10 Aim of the study ................................................................................................ 31
2 Materials and Methods ............................................................................................. 33
2.1 Reagents and equipment .................................................................................. 34
2.1.1 Buffers and solutions ................................................................................ 34
2.1.2 Antibodies ................................................................................................. 37
2.1.3 Cloning vectors .......................................................................................... 39
2.1.4 Oligonucleotides ....................................................................................... 40
2.2 Mammalian cell culture and related techniques .............................................. 43
2.2.1 Mammalian cells ....................................................................................... 43
2.2.2 Cell culture ................................................................................................ 43
2.2.3 siRNA knock down of ECSCR in HUVECs ................................................... 45
iv
2.2.4 Polyethylenimine (PEI) transfection of HEK 293T cells ............................. 45
2.2.5 Scratch wound assay ................................................................................. 46
2.2.6 Immunofluorescent staining ..................................................................... 47
2.3 Protein analyses and assays .............................................................................. 47
2.3.1 Cell lysis and protein extraction ................................................................ 47
2.3.2 Immunoprecipitation using an anti-ECSCR intracellular (icd) domain
antibody 48
2.3.3 SDS-PAGE .................................................................................................. 48
2.3.4 Gel staining of proteins with Coomassie Brilliant Blue ............................. 48
2.3.5 In-gel digestion of proteins separated on SDS-PAGE gel for mass
spectrometry analysis ............................................................................................... 49
2.3.6 Expressing zebrafish Ecscr intracellular domain (icd) fused to MBP ........ 50
2.3.7 GST pull down ........................................................................................... 51
2.3.8 Western Blot ............................................................................................. 51
2.3.9 Yeast-two-hybrid assay ............................................................................. 52
2.3.10 Luciferase complementation assay ........................................................... 54
2.4 Molecular biology methods .............................................................................. 55
2.4.1 Bacterial strains and media ....................................................................... 55
2.4.2 DNA amplification by PCR ......................................................................... 56
2.4.3 DNA digestion using restriction enzymes ................................................. 56
2.4.4 Nucleic acids electrophoresis in agarose gel ............................................ 56
2.4.5 Plasmid ligation and bacterial transformation ......................................... 57
2.4.6 Plasmid preparation and purification ....................................................... 57
2.4.7 Cell lysis and RNA extraction ..................................................................... 58
2.4.8 cDNA synthesis .......................................................................................... 58
2.4.9 Quantitative RT-PCR (qPCR) ...................................................................... 59
2.4.10 Microarray ................................................................................................. 59
2.5 Methods employed for in vivo analyses ........................................................... 60
2.5.1 Species and strains .................................................................................... 60
2.5.2 Zebrafish and mouse whole mount in situ hybridization (WISH) ............. 60
2.5.3 Injection of antisense zebrafish Ecscr morpholino oligonucleotides........ 62
2.6 Statistical analyses ............................................................................................ 63
3 Identification of proteins interacting with ECSCR ..................................................... 65

v
3.1 Introduction ...................................................................................................... 66
3.2 Identification of binding partners for ECSCR .................................................... 66
3.3 The effect of ECSCR on the cytoskeletal arrangement ..................................... 77
3.4 siRNA duplex titration and transfection stability assessment .......................... 82
3.5 Microarray ......................................................................................................... 85
3.6 Discussion .......................................................................................................... 96
3.6.1 Finding binding partners for ECSCR .......................................................... 96
3.6.2 The role of ECSCR in modulating the cytoskeleton ................................. 101
3.6.3 Microarray to test the effect of ECSCR knockdown ................................ 104
3.6.4 siRNA duplexes titration and transfection stability assessment ............. 106
3.6.5 In silico analysis of conserved ECSCR putative functional motifs ........... 106
3.6.6 Glycosylation paterns of ECSCR .............................................................. 109
3.6.7 What regulates ECSCR? ........................................................................... 111
4 The role of ECSCR in developmental angiogenesis of the zebrafish (Danio rerio) . 113
4.1 Introduction .................................................................................................... 114
4.2 Zebrafish Ecscr expression pattern ................................................................. 116
4.3 Raising an antibody against the zebrafish Ecscr intracellular domain (icd) .... 123
4.4 Loss of Ecscr function causes defects in intersegmental vessels sprouting ... 123
4.5 Discussion ........................................................................................................ 134
4.5.1 Spatial and temporal distribution of zebrafish Ecscr .............................. 134
4.5.2 Effects of zebrafish Ecscr loss of function in zebrafish embryos ............ 136
4.5.3 Further directions ................................................................................... 140
5 Production and preliminary characterization of an ECSCR knockout mouse ......... 142
5.1 Introduction .................................................................................................... 143
5.2 Ecscr expression in mouse .............................................................................. 149
5.3 Initial attempt produce a conditional knockout mouse ................................. 149
5.4 Producing a null Ecscr knockout mouse.......................................................... 158
5.5 Genotyping strategy ........................................................................................ 160
5.6 Monitoring and mapping the replacement of Ecscr by beta-galactosidase ... 164
5.7 Monitoring the Ecscr protein and transcript amounts in wild type,
heterozygous and knockout mice ............................................................................... 165
5.8 Discussion ........................................................................................................ 171
vi
5.8.1 Ecscr transcript expression patterns in mouse E9.5 embryos ................ 171
5.8.2 Generation of an Ecscr knockout mouse model ..................................... 172
5.8.3 Preliminary characterisation of the Ecscr null knockout mouse model . 176
5.8.4 Further directions ................................................................................... 179
6 General Conclusions ................................................................................................ 180
APPENDIces ..................................................................................................................... 184
APPENDIX 1: LISTS OF UP AND DOWNREGULATED GENES UPON ECSCR KNOCKDOWN
IN HUVECS ................................................................................................................... 185
APPENDIX 2: TESTING THE EFFECTS OF AN ANGIOGENESIS-BLOCKING ANTIBODY ... 210
APPENDIX 3: RE-PRINT OF THE THESIS-RELATED PUBLICATION ................................. 227
APPENDIX 4: LIST OF PRESENTED ABSTRACTS ................................................................ 228
REFERENCES .................................................................................................................... 229

vii
LIST OF FIGURES
Figure 1.1 – Alignment of ECSCR orthologs. ...................................................................................... 8
Figure 1.2 – Predicted structure for human, zebrafish and mouse ECSCR using SMART................... 9
Figure 1.3 – Proposed models describing the current knowledge of ECSCR signalling in endothelial
cells .................................................................................................................................................. 11
Figure 1.4 - Processes involving the actin cytoskeleton during cell migration ................................ 13
Figure 1.5 - Adhesion structures. ..................................................................................................... 18
Figure 1.6 - Interaction of filamin A with filamentous actin. ........................................................... 21
Figure 1.7 - Structure of filamin A and mapping of binding of some interacting proteins. ............. 22
Figure 1.8 - Interaction of filamin A with filamentous actin. ........................................................... 26
Figure 3.1 - Proteins that co-immunoprecipitate with ECSCR from HUVECs lysate......................... 68
Figure 3.2 - Assessment of the results of mass spectrometry by GST pull down and western blot
analysis ............................................................................................................................................ 70
Figure 3.3 - Yeast-two-hybrid assay to assess protein interactions between ECSCRicd and filamin A
......................................................................................................................................................... 73
Figure 3.4 - Yeast-two-hybrid assay to assess protein interactions between the two halves of
ECSCRicd and filamin A .................................................................................................................... 74
Figure 3.5 - Luciferase complementation assay to assess the interaction between ECSCR and
moesin in HEK 293T cells ................................................................................................................. 76
Figure 4.1 - Zebrafish Ecscr mRNA expression pattern in 24 hpf zebrafish AB* wild type embryos
....................................................................................................................................................... 118
Figure 4.2 - Ecscr transcript levels during zebrafish embryonic development using reverse
transcriptase-PCR .......................................................................................................................... 119
Figure 4.3 – Ecscr transcript levels during zebrafish embryonic development using real time
quantitative PCR. ........................................................................................................................... 120
Figure 4.4 - Alternative splicing of the zebrafish Ecscr transcript ................................................. 121
Figure 5.1 - Targeting trap construct produced by the KOMP, used to make an Ecscr null knockout
mouse. ........................................................................................................................................... 147
Figure 5.2 - Knockout-first allele construct produced by the KOMP, used to make a conditional
knockout mouse. ........................................................................................................................... 148

viii
ABBREVIATIONS
aa – amino acid
APS – ammonium persulfate
BAC – bacterial artificial chromosome
BSA – bovine serum albumin
cDNA – complimentary deoxyribonucleic acid
CKO – conditional knock out
cRNA – complimentary ribonucleic acid
Cy3 – cyanine 3-cytosine triphosphate
Cy5 – cyanine 5-cytosine triphosphate
DEPC – diethylpyrocarbonate
dH2O – distilled water
DNA – deoxyribonucleic acid
DNase – deoxyribonuclease
dNTP – 2'-Deoxyribonucleoside-5'-tri- phosphate
DTT – dithiothreitol
ecd – extracellular domain
ECSCR – (human) endothelial cell specific chemotaxis regulator

ix
EDTA – ethylenediamine tetra-acetic acid
fc – final concentration
FCS – foetal calf serum
HEK – human embryonic kidney
hpf – hours post fertilization
HUVEC – human umbilical vein endothelial cell
icd – intracellular domain
KO – knock out
mECSCR – mouse endothelial cell specific chemotaxis regulator
MMLV-RT – murine Moloney leukaemia virus reverse transcriptase
NCBI – National Center for Biotechnology Information
NTP – nucleoside triphosphate
PEG – polyethylene glycol
PBS – phosphate buffered saline
PBST – phosphate buffered saline with tween
PCR – polymerase chain reaction
PFA – paraformaldehyde
PMSF – phenylmethylsulfonyl fluoride
x
RNA – ribonucleic acid
RNase –ribonuclease
RS – restriction site
TEMED – N,N,N',N'-tetramethylethylenediamine
SDS – sodium dodecyl sulphate
SEND – (mouse) skin endothelial
siRNA – small interference ribonucleic acid
SMART – simple modular architecture research tool
SSC – saline sodium citrate
TBS – tris buffered saline
TBST – tris buffered saline with tween
WISH – Whole-mount in situ hybridization

1
1 GENERAL INTRODUCTION

2
1.1 The role of endothelial cells in angiogenesis
The endothelium is a single layer of simple squamous epithelial cells that line the interior
surface of blood vessels of the entire human vascular system. The development of new blood
vessels from existing vasculature is known as angiogenesis or neovascularisation (Risau,
1997). This complex and organised process comprises vascular initiation, formation,
maturation, remodelling and regression (Gilbert, 2006). The endothelial cells forming new
vessels are stimulated with angiogenic factors which make them more permeable. Then, they
start secreting proteolytic enzymes that breakdown the basement membrane to create space for
the new vessel (Mignatti and Rifkin, 1996). Some cells from the vessel wall start migrating
towards the gradient of angiogenic factors and form a tube, that merges with another vessel
and a lumen is formed. This vessel will then mature and be stabilised by the recruitment of
pericytes (Carmeliet, 2003; Jain, 2003; Adams and Alitalo, 2007).
1.2 Developmental and pathological angiogenesis
Angiogenesis is fundamental for normal development and healing (inflammation, wound
healing), but it also occurs in over 70 different disease states, due to loss of regulation of normal
processes. Diabetic retinopathy, rheumatoid arthritis, psoriasis and cancer are some examples
of these pathologies (Pandya et al., 2006).
For over 30 years researchers have been studying developmental and pathology-associated
vascularisation in quest for angiogenesis-stimulating factors that could be used as targets for
anti-angiogenic therapies (Folkman, 1971; Denekamp, 1982; Folkman and Klagsbrun, 1987;
Kidd and Weinstein, 2003). However, these two kinds of vessel development differ from each
other.

3
Although the heart is the first functional organ of the body, it only begins to beat after the
embryonic first circulatory loops are formed. A primitive vascular plexus is originated by a
process called vasculogenesis when the embryo is still being nourished by diffusion. Therefore,
the embryonic vasculature is different from the adult one, since it must adapt to the changes
occurring in the embryo. This plexus is connected to the heart tube and when this organ starts
to pump, this initial network is irrigated and the first circulation is established. The link between
vasculogenesis and angiogenesis is made by the expression of VEGF receptors by pluripotent
precursors in response to FGF. This is how the pluripotent precursors become hemangioblastic
precursors. After vasculogenesis, the primary capillary networks are remodelled and veins and
arteries are formed, by angiogenesis (Gilbert, 2006; Flamme et al, 1997).
The initial formation of a tumour is not dependent of blood vessels. Only when it reaches a
volume of 2 mm3 neovascularisation occurs in response to the tumour oxygen and nutrient
demands. This vascularisation is called tumour angiogenesis, since it differs from
developmental and normal angiogenesis (Sacewicz et al., 2009). Due to these differences,
tumour vasculature can be described as immature vasculature. The walls are poorly developed,
with few vascular smooth muscle cells and pericytes, which results in higher permeability and
the networks are chaotic and lack a hierarchy (Tozer et al., 2005; Neri and Bicknell, 2005).
Apart from recruiting neighbouring blood vessels and vascular endothelial cells to support their
own nourishment, tumours also have the ability to produce angiogenic factors to mobilise bone
marrow-derived endothelial precursor cells into the developing vasculature (Rafii et al., 2002).
1.3 Targeting angiogenesis
The quest for factors that promote tumour angiogenesis as therapeutic targets for cancer has
begun many decades ago, with the study of vascular endothelial growth factor (VEGF)

4
(Ferrara, 2002). Although VEGF plays a pivotal role in vascular development, it has become
clear that it has a function in other non-vascular processes such as organogenesis and patterning
and therefore new targets are needed without this kind of side effects (Coultas et al., 2005;
Greenberg and Jin, 2005). Additionally, although showing some therapeutic efficacy in mouse
models and some human cancers, relapse and tumour progression follow the transitory positive
effects of anti-VEGF therapies (Bergers and Hanahan, 2008). Free radicals, such as reactive
oxygen species, are created by hypoxic conditions in tumours. These, in combination with
hypoxia- reoxygenation cycling and immune cell infiltration after chemotherapy affect
hypoxia- inducible factor 1 (HIF1) activity, which is implicated in endothelial and tumour cell
survival (Dewhirst et al., 2008). Hypoxic and necrotic regions found in tumours offer the
opportunity for cancer-selective therapy (Brown and Wilson, 2004). Nitric oxide is also a
highly reactive free radical that regulates several physiological functions, such as angiogenesis,
blood flow, vascular permeability, leukocyte-endothelial interaction, platelet aggregation,
microlymphatic flow, as well as neurological and cytotoxic functions (Fukumura et al., 2006).
This molecule is produced by endothelial nitric oxide synthase (eNOS) which is present,
together with other signalling proteins, at the endothelial cell surface in microdomains called
caveolae. Caveolin 1 seems to have the capacity to inactivate eNOS and act as a tumour
suppressor in vitro although in vivo, at later stages, it appears to play a role in cancer
chemoresistance, survival and metastasis (Carver and Schnitzer, 2003). Tumour blood vessels
express markers not present in normal vasculature, but shared by angiogenic vessels in non-
malignant conditions. Thus, a better understanding of tumour cells is needed, as well as caution
regarding normal angiogenesis, when designing anti-angiogenic therapies (Rouslahti, 2002).
Since vascular endothelium is not a homogeneous tissue, Kuzu et al. (1992) reported the
diagnostic usefulness of using a panel of antibodies against vWF, CD31 and CD34 to identify
5
tumours of vascular origin, as they gave reliable immunostaining even for formalin fixed,
paraffin wax embedded sections. Other known endothelial markers are the transcription factor
Fli-1, several receptors including the VEGF receptors (FLT1, KDR) and the angiopoetin
receptors TIE1 and TIE2/TEK (Verissimo et al., 2009).
The advent of modern sequencing and expression analysis combined with advances in
bioinformatics datamining has led to the recent discovery of several novel endothelial genes.
Our group has used a bioinformatics datamining strategy that combined expressed sequence
tags (EST) cluster expression analysis in the human Unigene index and SAGEmap xProfiler to
identify novel endothelial-specific genes. Four novel genes were identified: endothelial cell-
specific molecules (ECSM) 1-3 and magic roundabout (similar to the axon guidance protein
roundabout Robo1). We have also identified endothelial protein-disulfide isomerase
(EndoPDI), highly expressed in endothelial cells. mRNA and protein levels of EndoPDI are
induced by hypoxic conditions and it was shown to have a protective role only in cells exposed
to hypoxia, in contrast to PDI which displayed no differences between cell protection under
hypoxic or normoxic conditions. Furthermore, we showed by in situ hybridization that
EndoPDI expression is very rare in normal tissues, being expressed preferentially in tumour
endothelium and other hypoxia-associated lesions. These data indicate that EndoPDI is a
potential target for tumour endothelial therapies (Verissimo et al., 2009).
On the other hand, pro-angiogenic therapies are also useful in treating diseases such as
ischaemic disorders and some therapies have already been approved for use in several countries
(Ferrara and Kerbel, 2005).

6
1.4 The identification and characterization of endothelial cell
specific chemotaxis regulator (ECSCR)
Expressed sequence tags (EST) of endothelial cell specific chemotaxis regulator (ECSCR –
formerly ECSM2) were found to be enriched in endothelium by bioinformatics datamining
(Huminiecki and Bicknell, 2000). It was described as an endothelial marker for the first time
in a study by Pelosi et al. (2002), where they showed that ECSCR was present in a postnatal
population of CD34+KDR+ cells comprising hemangioblasts and endothelial progenitors. The
endothelial specificity of ECSCR has also been confirmed by quantitative polymerase chain
reaction using a range of endothelial and non-endothelial cell lines (Herbert et al., 2008;
Armstrong et al., 2008), as well as in situ hybridization on a variety of human tissues
(Armstrong et al., 2008). By applying a novel method of differential gene expression analysis
using multiple cDNA libraries, Herbert et al. (2008) have identified ECSCR within the top nine
predicted tumour endothelial markers. More recently, this protein has been found to be
upregulated in another type of disease, colitis, where increased pathological angiogenic activity
plays a role (Fang et al., 2011). ECSCR is a glycosylated type I transmembrane protein, present
especially in spike-like cell protrusions termed filopodia. Reduced chemotaxis and impaired
tube formation on MatrigelTM were observed when ECSCR was knocked down by siRNA.
Filamin A was identified in a yeast-two-hybrid screen as an interacting protein for its
intracellular domain. This was confirmed by GST (glutathione-s-transferase) pull down. Taken
together, these data implicate a role for ECSCR in angiogenesis through modulation of the
actin cytoskeleton. Mouse and zebrafish orthologs were identified (Figure 1.1) (Armstrong et
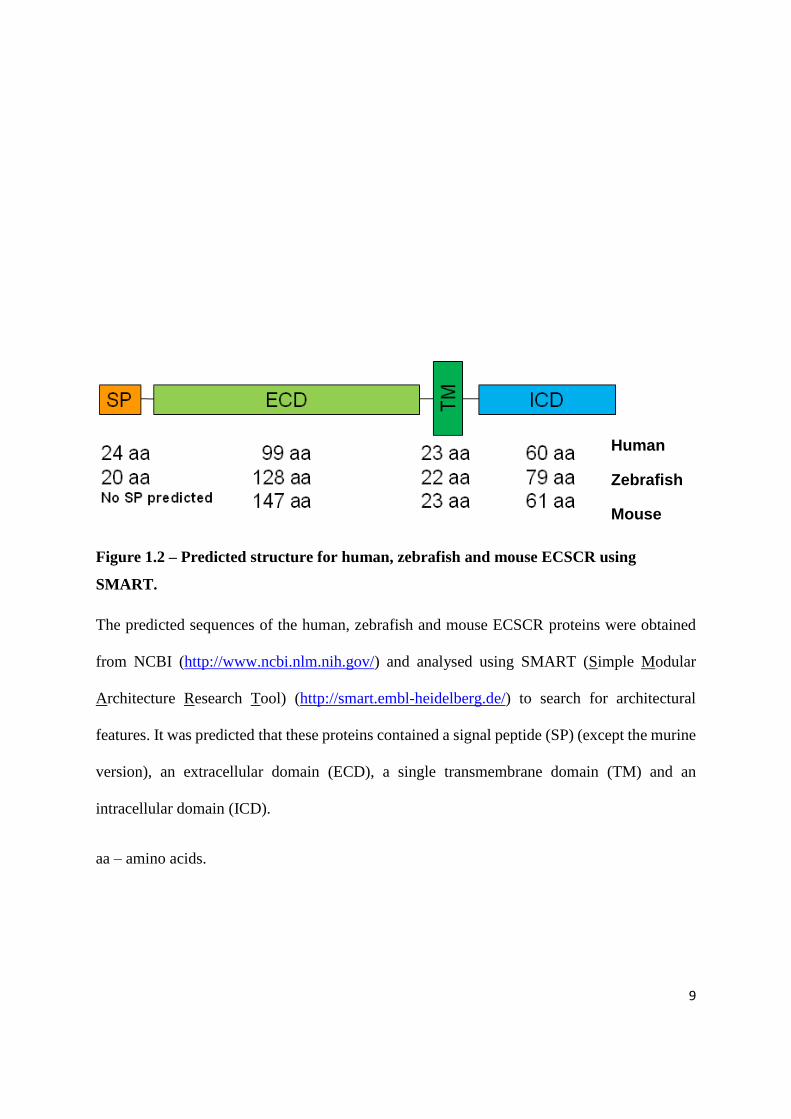
al., 2008). The predicted structure for these three proteins using SMART software indicates
the presence of a signal peptide, and extracellular, transmembrane and intracellular domains,
as shown on figure 1.2.

7
The chromosomal location of the human, mouse and zebrafish genes is 5q31.2, 18 B2 and
chromosome 21, respectively. The NCBI accession numbers for cDNA and proteins for Homo
sapiens, Mus musculus and Danio rerio are NM_001077693/NP_001071161.1,
NM_001033141.1/NP_001028313.1 and XM_002666009.1/XP_002666055.1, respectively.
Other names for the protein are ECSM2/ARIA (human), Ecsm2/Riken1110006O17 (mouse)
and hypothetical LOC100006714 (zebrafish).
The data produced by Armstrong et al. (2008) were rapidly independently confirmed by Ma et
al. (2009). They observed that in HEK293 cells transfected with ECSCR-GFP overall tyrosine
phosphorylation signalling was reduced compared to the controls. ECSCR may have a role in
attenuating the epidermal growth factor (EGF)-induced cell migration by cross talking with its
receptor (EGFR), possibly by inhibiting the Shc-Ras-ERK (MAPKinase) pathway. In these
transfected cells actin stress fibres formed by filament bundling were destroyed and the
formation of filopodia was induced. In addition to its location to the plasma membrane and
enrichment in filopodia in isolated cells, the same group has shown that ECSCR is also present
in cell-cell junctions in confluent cells (Shi et al., 2011). ECSCR promotes cell aggregation
and seems to inhibit basic fibroblast growth factor (bFGF)-mediated cell migration via the
FGFR-ERK-FAK pathway (Shi et al., 2011).

8
Figure 1.1 – Alignment of ECSCR orthologs.
To search for ECSCR orthologs, the human gene was aligned with genomes of different species
using the Ensembl website (www.ensembl.org/). The correspondent proteins were then aligned
using the online multiple sequence alignment tool Clustalw2
(http://www.ebi.ac.uk/Tools/msa/clustalw2/). Conserved regions are highlighted in grey. The
transmembrane and intracellular domains show greater conservation than the extracellular
domain (adapted from Armstrong et al., 2008).
peptide
Extracellular Transmembrane Intracellular
9
Figure 1.2 – Predicted structure for human, zebrafish and mouse ECSCR using
SMART.
The predicted sequences of the human, zebrafish and mouse ECSCR proteins were obtained
from NCBI (http://www.ncbi.nlm.nih.gov/) and analysed using SMART (Simple Modular
Architecture Research Tool) (http://smart.embl-heidelberg.de/) to search for architectural
features. It was predicted that these proteins contained a signal peptide (SP) (except the murine
version), an extracellular domain (ECD), a single transmembrane domain (TM) and an
intracellular domain (ICD).
aa – amino acids.
Human
Zebrafish
Mouse
10
In a second study published in 2009 the authors did not acknowledge the existence of ECSCR
and submitted their work on a “novel” endothelial protein called ARIA (apoptosis regulator
through modulating IAP expression) (Ikeda et al., 2009). They described that ARIA (ECSCR)
interacted with proapoptotic proteins cIAP-1 and cIAP-2, modulating their degradation by the
proteasome and thus regulating endothelial cell survival. They found that ARIA is expressed
in mouse embryonic vasculature and also in endothelial cells in vivo and in vitro. ARIA siRNA
knockdown in HUVECs resulted in significant reduction of apoptosis. More recently, the same
group has produced an ARIA knockout mouse and described that this molecule regulates the
PTEN/PI3K/Akt/eNOS pathway. The mice display non-lethal bleeding during embryogenesis
and increased small vessel density, as well as altered expression of vascular growth factors,
such as angiopoetins and VEGF receptors. Post-natal neovascularisation was enhanced using
the critical limb ischemia model and more bone marrow-derived endothelial cells were found
in ischemic muscle. ARIA was found to be enriched in endothelial progenitor cells (Koide et
al., 2011).
Ecscr knockdown in zebrafish developing embryos slows down angioblast migration towards
the midline (posterior lateral plate mesoderm) (Verma et al., 2010). In HUVECs ECSCR
partially co-localises with KDR and its knockdown results in lower VEGF-induced
phosphorylation of KDR (lower sensitivity to VEGF).
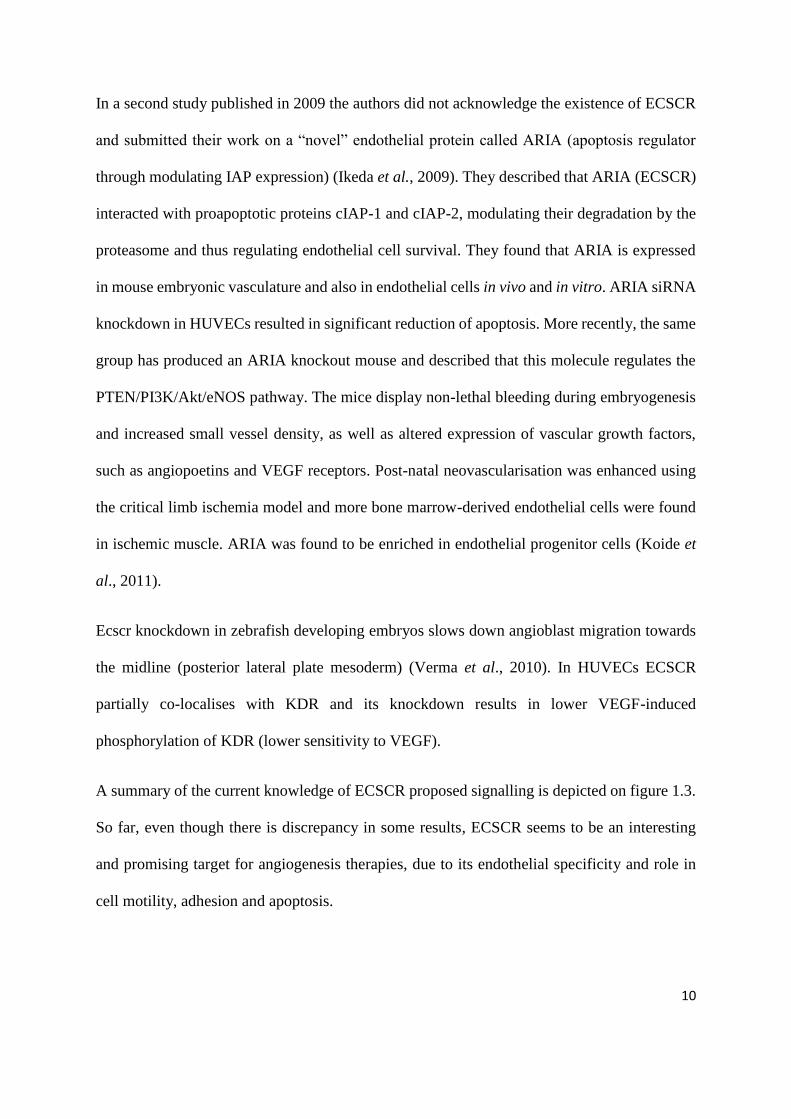
A summary of the current knowledge of ECSCR proposed signalling is depicted on figure 1.3.
So far, even though there is discrepancy in some results, ECSCR seems to be an interesting
and promising target for angiogenesis therapies, due to its endothelial specificity and role in
cell motility, adhesion and apoptosis.

11
Figure 1.3 – Proposed models describing the current knowledge of ECSCR signalling in
endothelial cells
Although the literature on ECSCR is still limited, different studies suggest distinct roles for the
protein in endothelial cells: apoptosis, via direct interaction with cIAP, angiogenesis through
PTEN, cell motility by directly interacting with Filamin A or contributing to phosphorylation
of EGFR or KDR and cell-cell adhesion through interaction with a possible ligand or the
ECSCR molecule itself. KDR - Kinase insert domain receptor; EGFR – epidermal growth
factor receptor; L – ligand; P – phosphorylation; FAK – focal adhesion kinase; PTEN –
phosphatase and tensin homolog; cIAP – cellular inhibitor of apoptosis protein; PMSA-7 –
proteasome subunit α7. (adapted from Verissimo et al., 2009).

12
1.5 Cell migration: the fine orchestration between protrusion,
retraction and adhesion
Cell migration is essential for both physiological and pathological processes. During
embryonic development intensive migration occurs so that different lineages of cells can reach
a proper location (Kurosaka and Kashina, 2008). Throughout life, certain cell types continue
to migrate in order to be able to perform their roles, such as those from the immune system
(Madri and Graesser, 2000). In pathological conditions, such as cancer, metastatic cells are
highly motile (Seol et al., 2012). Migration is a multi-step, dynamic, cyclic process, that
comprises the extension of protrusions at the leading edge, substrate adhesion and rear
retraction. All these are achieved by rapid modulation and coordination of complexes of
cytoskeletal proteins.
1.5.1 Filopodia and lamellipodia at the leading edge of migrating cells
In response to external signals cells polarise, acquiring a conspicuous morphology,
characterised by flat membrane protrusions, termed lamellipodia, and spike-like protrusions
called filopodia at the leading edge (figure 1.4). The formation of two distinct protrusive actin
structures with different architectures and dynamics in close spatial proximity is due to the
activation of two separate nucleation pathways, Arp2/3 and formins (Gomez et al., 2007).
Actin filaments polymerise at the leading edge and depolymerise at the rear of lamellipodia, in
a process named treadmilling (Wang, 1985). The fast-moving and short-lived lamellipodial
actin speckes are preceded by slow-moving, long-lived speckles that form the lamella. Actin is
arranged in branched filaments in lamellipodia, whereas in the lamella it is presented as loose,
unbranched filaments containing tropomyosin and myosin II (figures 1.4 A and 1.4 D)

13
Figure 1.4 - Processes involving the actin cytoskeleton during cell migration
In lamellipodia, branched actin filaments are formed at the plasma membrane by WASP-
Arp2/3 and regulated by a set of regulatory proteins (ADF, capping proteins, profilin) (A).
When migrating, cells extend finger-like protrusions called filopodia beyond the protruding
lamellipodia to sense the environment. At the tip, formins like mDia2 catalyze the processive
assembly of profilin-actin. The resulting non-branched actin filaments are tightly bundled by
several proteins including fascin and the Irsp53-Eps8 complex (B). Slow moving cells form
focal adhesions, that connect the extracellular matrix to contractile bundles made of actin
filaments, myosin II, and bundling proteins including alpha-actinin (C). The lamella contains
tropomyosin and myosin II. The nucleating and anchoring at the plasma membrane
mechanisms are unknown (D). Lp - lamellipodium; Fp - filopodium; Lm - lamella; SF - stress
fiber; FA - focal adhesion; FC - focal complex (adapted from Le Clainche and Carlier, 2008)
Leading edge
Trailing edge

14
(Le Clainche and Carlier, 2008). Surprisingly, injection of tropomyosin resulted in loss of
lamellipodia but increased leading edge protrusions and accelerated migration. This suggests
that lamellipodia may be more important in other processes, such as pathfinding (Gupton et al.,
2005). At low concentrations, cofilin promotes actin depolymerisation by cleavage and at high
concentrations it nucleates actin filaments, (Adrianantoadro and Pollard, 2006), whereas
profilin binds monomeric actin (Yarmola and Bubb, 2006). Treadmilling is a dynamic process
that involves and depends on the balance of many proteins that contribute to actin filaments
progression and regression, such as severing, nucleating and capping proteins (Le Clainche and
Carlier, 2008).
As cells migrate, actin filaments need to be continuously polymerised at one end and
disassembled at the other. In the lamellipodium the Wiskott–Aldrich Syndrome Proteins
(WASP) activate the actin related proteins (Arp)2/3 complex, which works in coordination
with cofilin, profilin and capping proteins to achieve branched nucleation. The Arp2/3
complex, located at the leading edge, determines the direction of the protrusion (Goley and
Welch, 2006). Actin assembly by Arp2/3 through WASP activation occurs downstream from
Rac1 and Cdc42 (responsible for the formation of ruffles and filopodia, respectively) (Nobes
and Hall, 1995).
Contrasting with the branched architecture of lamellipodia, filopodia are formed of 15-20
parallel filaments tightly packed (figure 1.4 B). They locate exteriorly to lamellipodia, at the
leading edge of protrusions (Lewis and Bridgman, 1992). Actin assembly and retrograde flow
control extension and retraction in these structures, respectively. Although Cdc42 controls
filopodia formation, some authors argue that the Arp2/3 complex does not contribute to actin
nucleation in this context, supported by the fact that N-WASP null fibroblasts possess normal
filopodia and the Arp2/3 complex promotes branched rather than linear actin nucleation (La

15
Clainche and Carlier, 2008). In the same year our group has described a role for the Arp2/3
complex in filopodia formation (Sheldon et al., 2008). In order to investigate the role of
roundabout proteins in endothelial cell biology, Robo1 and Robo4 siRNA knockdown was
performed in HUVECs and it was found that both resulted in impaired cell migration and tube
formation. Yeast-two-hybrid analysis, confirmed by glutathione-s-transferase pull down, has
identified WASP and Arp2/3 as interacting partners for Robo4 intracellular domain, as well as
Mena, which signals downstream from Cdc42 and IRSp3 (insulin receptor substrate fo 53 kDa)
to initiate filopodia. The heterodimer Robo1-Robo4 is essential for the formation of filopodia.
It was hypothesised that Slit 2 binds to Robo1 when in a complex with Robo4 thus eliciting the
formation of filopodia. Furthermore, in zebrafish endothelial cells, Robo4 activates and
controls the levels of Cdc42 and Rac1. Angioblasts isolated from zebrafish embryos where
Robo4 was knocked down search actively for direction, which suggests a role for Robo4-Rho
GTPases in attractive vascular guidance (Verissimo et al., 2009).
Formins are another group of actin-nucleating proteins downstream of Rho GTPases that are
present at the tip of filopodia and induce their formation (diaphanous-related formin, mDia2).
In Dyctiostelium dDia2 is required for filopodial extension (Schirenbeck et al., 2005). In a
study in Drosophila, Homem and Peifer (2009) have shown that activated Dia mobilises
enabled (Ena) to the deading edge. Although each of these proteins is sufficient to induce
filopodia, jointly they induce lamellipodia. Taken together, these observations suggest that the
ratio between Dia and Ena regulate the balance between these protrusive structures. Clearly,
cytoskeletal rearrangements are complex and multifactorial, contemplating fine equilibria and
perhaps some redundancy, as well as cell type-specificity.
Phosphorylated ERM (ezrin, radixin, moesin) actin-binding proteins also locate at filopodia
(Bretscher et al., 2002).

16
1.5.2 The role of cell-matrix adhesions in cell migration
Cell migration starts with the emission of cytoplasmatic protrusions and also includes the
traction of the cell body and tail retraction. Adhesion to the matrix is key in controlling the
dynamics between protrusion (achieved by actin assembly at the leading edge) and the traction
of the cell body and retraction of the tail (achieved by actomyosin contractile force) (La
Clanche and Carlier, 2009). There are three types of adhesion structures: focal complexes, focal
adhesions and fibrillar adhesions (figure 1.5) (La Clanche and Carlier, 2009). Focal complexes
are dot-like, Rac1 activated, nascent adhesions that disassemble and reassemble at the leading
edge during protrusion and contain a loose actin network (Rottner et al., 1999). Proteins such
as PAK-interacting exchange factor PIX and G-protein-coupled receptor kinase (GRK)-
interacting target 1 (GIT1) participate in focal complex disassembly (Zhao et al., 2000). In
response to RhoA these structures stabilise, mature and give origin to focal adhesions. These
are associated with the end of stress fibres and contain vinculin, talin, paxillin, alpha-actinin,
focal adhesion kinase (FAK) and integrin αvβ3 (Zaidel-Bar et al., 2003). In turn, fibrillar
adhesions arise from focal adhesions, although much less complex, and contain tensin and
integrin α5β1, taking the shape of thin actin cords (Zamir et al., 2000).
Vinculin is present in focal adhesions and is able to bind actin and talin. Its regulation seems
to be important for angiogenesis, as low levels are required for in vitro tube formation (as well
as integrin α2, talin, α-actinin and actin, although these proteins don’t decrease as much)
(Deroanne et al., 1996). Integrins are a large family of transmembrane receptors formed of
alpha and beta chains that play a major role in mediating interactions between the intracellular
compartment and the extracellular matrix. Eighteen α subunits and eight β subunits can
combine to form 24 functional heterodimers. Thus, they are involved in a variety of
physiological processes, such as cell migration, embryogenesis and haemostasis. Ligand

17
binding leads to clustering and recruitment of actin filaments through the interaction with
cytoskeletal proteins, such as talin, vinculin, α-actinin and filamin (Hemler, 1999). Integrins
have the ability to signal bidirectionally, allowing a dynamic exchange between the
intracellular and extracellular compartments (Legate et al., 2009). Signalling involving
integrins is very complex as there are, to date, 156 proteins known to be part of the integrin
adhesome (Moser and Legate, 2009). Focal adhesion kinase plays a crucial role in focal
adhesions (and therefore in regulating cell motility), by switching between Rho GAPs and
GEFs. RhoA activation leads to increased cell contractility and trailing edge retraction, whereas
RhoA inactivation results in decreased cell contractility and lamellipodia formation (Tomar
and Schlaepfer, 2009).
Stress fibres are essential to achieve retraction of the rear of the cell, by applying contractile
force on focal adhesions (Small and Resch, 2005). These structures are formed of actin and
myosin and are found both in association with focal adhesions and independent from focal
adhesions. Stress fibre formation associated with focal adhesions is activated by RhoA (Small
et al., 1998).

18
Figure 1.5 - Adhesion structures.
Depending on their composition, size, shape, dynamics and location, adhesion structures are
classified as focal complexes (A), focal adhesions (B) or fibrillar adhesion (C). Rac1 signaling
elicits the formation of focal complexes, that contain integrin beta-3, talin (Ta), and Paxillin
(Pa). Focal complexes mature into focal adhesions in response to RhoA signalling, which
activates ROCK, resulting in stress fibre contractility. Fibrillar adhesions contain high levels
of tensin (adapted from Le Clainche and Carlier, 2009)
Focal complex
Focal adhesion
Fibrillar adhesion
19
1.6 Cell-cell adhesion
Endothelial integrity is maintained by intercellular adherence, that regulates transendothelial
migration of blood cells, as well as permeability. This is achieved through tight and adherens
junctions. The first are maintained by claudin 5, junctional adhesion molecule and endothelial
cell adhesion molecule (Schnittler, 1998). The latter are particularly important in this process
and are essentially composed of vascular endothelial cadherin (VE-cadherin). It forms dimers
via the extracellular domain and recruits proteins, such as catenins, to the membrane, through
the cytoplasmic tail (Lampugnani et al., 1992). Catenins serve as a link between VE-cadherin
and the cytoskeleton (Bogatcheva et al., 2008). Initial contacts between two cells are thought
to be made through the extension of filopodia and subsequent cell migration. Almagro et al.
(2010) have shown that VE-cadherin is also present in the tip and body of filopodia in non-
confluent cells. The motor protein myosin X co-localises with and transports VE-cadherin
along actin filaments towards the membrane, thus contributing to cell-cell junction formation.
Non-muscle myosin II participates in cytoskeletal rearrangements implicated in cell adhesion,
migration and division. As well as participating in cell-matrix adhesion, this protein also
promotes the formation and stabilization of cell-cell junctions, as it is required for cadherin
clustering. Active RhoA drives contraction and compactation and activates non-muscle myosin
IIa. At a later stage, myosin II stabilises the junctions by pulling inwards in both cells involved
in the junction (Ivanov et al., 2007).
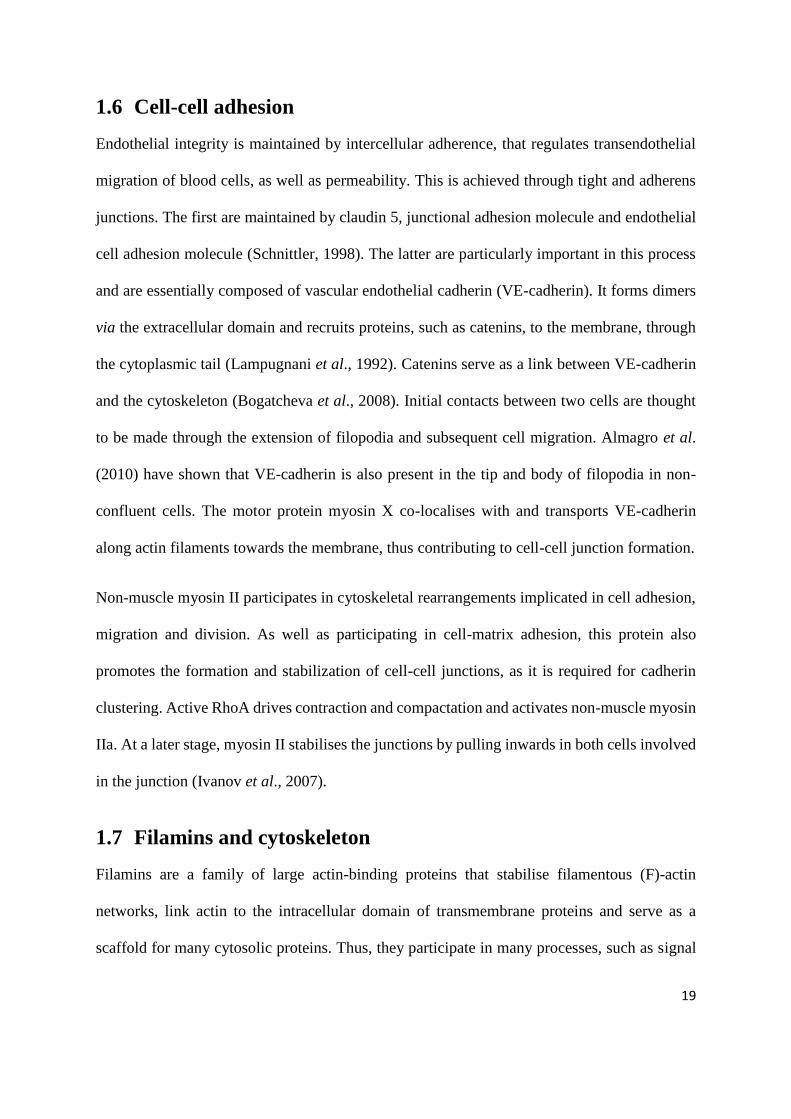
1.7 Filamins and cytoskeleton
Filamins are a family of large actin-binding proteins that stabilise filamentous (F)-actin
networks, link actin to the intracellular domain of transmembrane proteins and serve as a
scaffold for many cytosolic proteins. Thus, they participate in many processes, such as signal

20
transduction, gene transcription and receptor translocation. There are three isoforms, A, B and
C, and many splice variants have been described, that influence their crosslinking pattern, as
well as the proteins that bind to them. Filamins A and B are ubiquitous, whereas filamin C has
a more restricted distribution to skeletal and cardiac muscle cells (Zhou et al., 2009). Filamins
are formed of 24 repeats of approximately 96 amino acid each that fold into anti-parallel beta-
sheets that overlap to generate rods. They form homo or heterodimers via immunoglobulin-
like (Ig) domain 24 and bind to actin through the N-terminal actin binding domain (ABD).
There are two hinge regions, between repeats 15 and 16 and also between repeats 23 and 24.
These sites are susceptible to calpain and caspase cleavage (Stossel et al., 2001) (figure 1.6).
Many proteins have been found to interact with Filamin A that are involved in diverse
processes, such as transcription factors (androgen receptor), cell motility (migfilin, FILIP), cell
adhesion (integrins β1, β2, β7), cell signalling (caveolin-1, Rho-associated protein kinase),
lymphocyte function (CD28, calcineurin), proteolysis (caspase-3, epithin), metabolic function
(insulin receptor) and vascular function (calmodulin, calcitonin receptor, ECSCR) (figure 1.7)
(Popowicz et al., 2006; Zhou et al., 2007; Zhou et al., 2009). This multitude of functions
highlights the importance of filamin A (and filamins in general, as the other members have
been found to also interact with a variety of partners, although less studied) in cellular processes
and implicates its malfunction in many diseases. For example, humans with mutations in
filamin A develop central nervous system and skeletal disorders, as well as cardiovascular
malformations. Filamin A knockout mice die at E14 and display disrupted epithelial and
endothelial organization, altered adherens junctions in many tissues, as well as cardiovascular
abnormalities and haemorrhage (Feng et al., 2006).
21
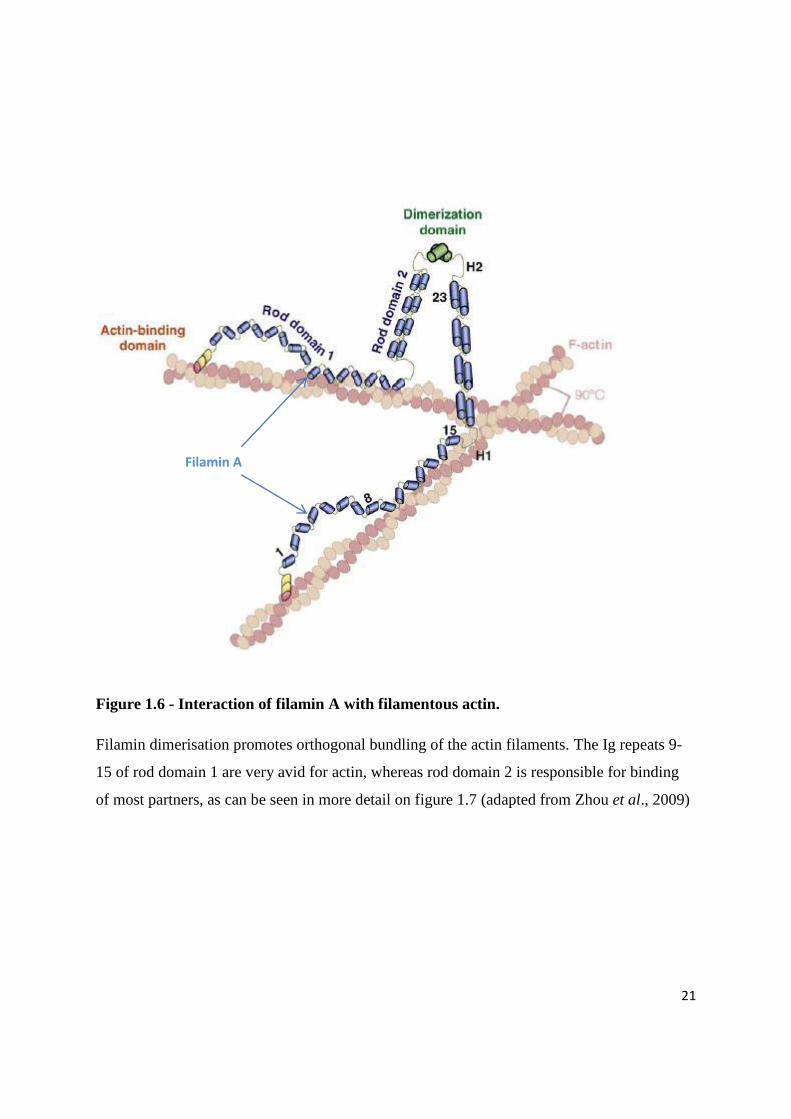
Figure 1.6 - Interaction of filamin A with filamentous actin.
Filamin dimerisation promotes orthogonal bundling of the actin filaments. The Ig repeats 9-
15 of rod domain 1 are very avid for actin, whereas rod domain 2 is responsible for binding
of most partners, as can be seen in more detail on figure 1.7 (adapted from Zhou et al., 2009)
Filamin A

22
Figure 1.7 - Structure of filamin A and mapping of binding of some interacting proteins.
Filamin A encompasses 24 repeats that fold into antiparallel β-sheets and function as interfaces
for protein–protein interactions. At the N terminus there is an actin-binding domain that
contains two calponin-homology domains (CH1 and CH2). Most of binding partners interact
with FLNA at the C-terminus, as depicted. These partners are divided into groups of
transcription factors, GTPase-related proteins, other filamins and filamentous actin, and cell
adhesion and migration proteins (adapted from Zhou et al., 2009)
CH – calponin homology domains (actin binding domain); 1-14 – Ig repeats; H1 and H2 –
hinge regions, susceptible to calpain cleavage. AR – androgen receptor; ECSM – ECSCR
ECSCR ECSCR
23
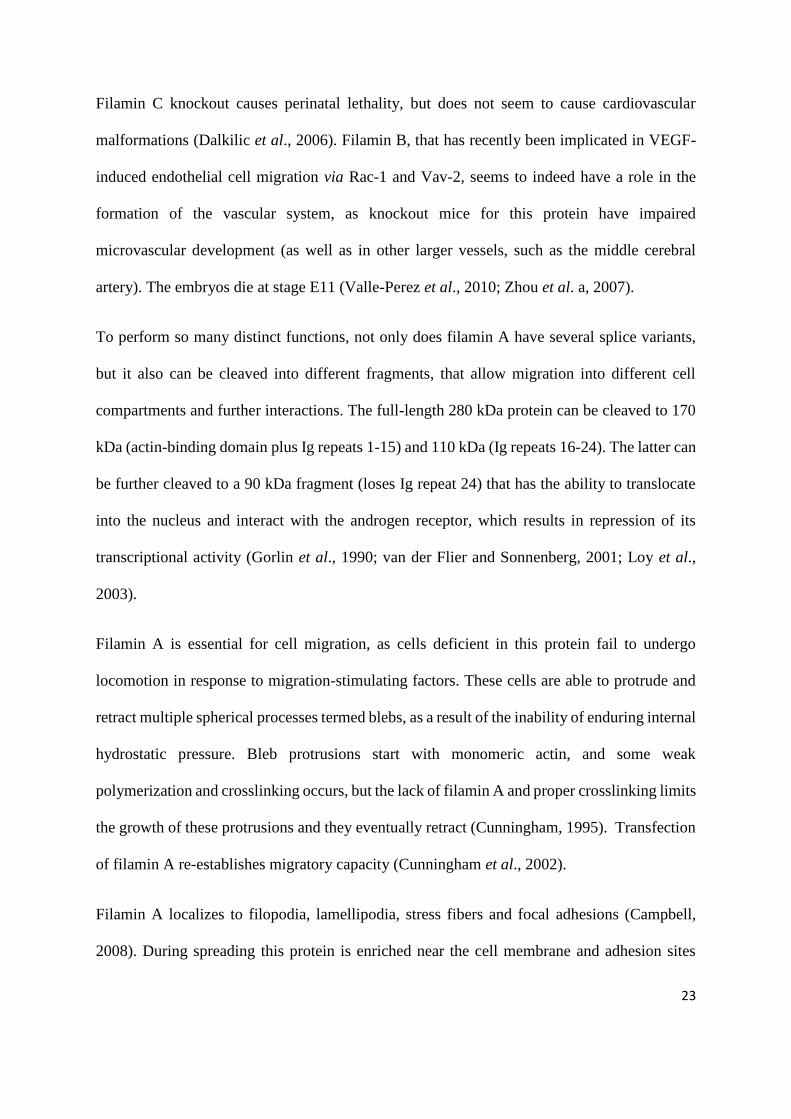
Filamin C knockout causes perinatal lethality, but does not seem to cause cardiovascular
malformations (Dalkilic et al., 2006). Filamin B, that has recently been implicated in VEGF-
induced endothelial cell migration via Rac-1 and Vav-2, seems to indeed have a role in the
formation of the vascular system, as knockout mice for this protein have impaired
microvascular development (as well as in other larger vessels, such as the middle cerebral
artery). The embryos die at stage E11 (Valle-Perez et al., 2010; Zhou et al. a, 2007).
To perform so many distinct functions, not only does filamin A have several splice variants,
but it also can be cleaved into different fragments, that allow migration into different cell
compartments and further interactions. The full-length 280 kDa protein can be cleaved to 170
kDa (actin-binding domain plus Ig repeats 1-15) and 110 kDa (Ig repeats 16-24). The latter can
be further cleaved to a 90 kDa fragment (loses Ig repeat 24) that has the ability to translocate
into the nucleus and interact with the androgen receptor, which results in repression of its
transcriptional activity (Gorlin et al., 1990; van der Flier and Sonnenberg, 2001; Loy et al.,
2003).
Filamin A is essential for cell migration, as cells deficient in this protein fail to undergo
locomotion in response to migration-stimulating factors. These cells are able to protrude and
retract multiple spherical processes termed blebs, as a result of the inability of enduring internal
hydrostatic pressure. Bleb protrusions start with monomeric actin, and some weak
polymerization and crosslinking occurs, but the lack of filamin A and proper crosslinking limits
the growth of these protrusions and they eventually retract (Cunningham, 1995). Transfection
of filamin A re-establishes migratory capacity (Cunningham et al., 2002).
Filamin A localizes to filopodia, lamellipodia, stress fibers and focal adhesions (Campbell,
2008). During spreading this protein is enriched near the cell membrane and adhesion sites

24
(Kim et al., 2008). It regulates intracellular traffic of β1 integrins, thus controlling cell
adhesion. Cells that lack filamin A show reduced expression of cell-surface β1 integrins during
the initial period of adhesion to matrix, that is rescued by the re-introduction of filamin A
(Meyer et al., 1998; Kim et al., 2010). In turn, blocking β1 integrin function reduces cell
spreading and the localization of filamin A to cell extensions (Meyer et al., 1998). The fine
regulation of the integrin-filamin interaction results in two different phenotypes: some binding
is required to stabilise cell-matrix adhesions, whereas excessive binding prevents proper actin
remodelling and cell motility (Kim et al., 2008). In order to achieve signalling and movement,
filamin A must be replaced by talin in the β-chain of integrins. Cell adhesion and spreading
depend on the integrity of actin filaments, intermediate filaments and microtubules and the
stability of these three complexes depends on each other. Although the precise mechanism
underlying this interdependence is not yet fully understood, filamin A seems to act as a bridge
between these systems, as it is present in all of them (Kim and McCulloch, 2010). More
evidence for the importance of filamin A in adhesion comes from the fact that siRNA-mediated
knockdown of filamin A results in reduction of vinculin and paxilin recruitment to focal
adhesion sites (Kim et al, 2010).
Filamin A is present in the extremities of spreading and migrating cells, in lamellipodia during
early stages of cell spreading and is enriched in filopodia upon cell migration stimulation. Cells
that do not possess filamin A fail to respond to these stimuli and are unable to form filopodia
(Ohta et al., 1999). Filamins control the nature of cell protrusions and retractions because they
are located both at the leading edge as well as the rear of polarised cells (figure 1.8). Filamin
A interacts with small GTPases of the Rho family, which are activated upon integrin binding
to the extracellular matrix. These signalling cascades lead to the formation of filopodia and
lamellipodia through actin porlymerization (Zhou et al., 2009). Filamin A is necessary for
25
RalA-mediated filopodial protrusion (Ohta et al., 1999). Another process, membrane ruffling,
is mediated by p21-activated kinase-1 (PAK1), that is activated by binding to and
phosphorylation of filamin A. PAK1 is a downstream effector of Rac1 and Cdc42. In addition,
filamin A is capable of associating with the Rho downstream effector ROCK in areas or
membrane protrusions, as well as sphingosine kinase 1, which further stimulates PAK1,
through the production of sphingosine-1-phosphate (Zhou et al., 2009). For a tighter regulation
of Rho signalling, filamin A is also able to bind guanine nucleotide-exchange factors (GEFs),
such as Trio, and GTPase-activating proteins (GAPs), such as FilGAP.
Accumulation of p190RhoGAP in the cell membrane leads to Rho inactivation and Lbc
stimulates ROCK activity which inactivates Rac through phosphorylation and stimulation of
FilGAP. This causes protrusions at the leading edge to be suppressed and cell retraction is
promoted. Furthermore, ROCK phosphorylates and activates myosin II, which is responsible
for contractile activity (Tseng et al., 2004).
26
Figure 1.8 - Interaction of filamin A with filamentous actin.
During cell migration FLNA acts as a scaffold for small GTPases. The lamellar membrane at
the leading edge of motile cells participates in a series of complex movements that involve the
assembly and reorganization of actin bundles and networks, both formed by FLNA. FLNA
crosslinks actin filaments and engages transmembrane proteins (β-integrins), as well as small
GTPases (Cdc42, Rho, Rac, RalA) and their upstream (Trio, Lbc, FilGAP, RhoGAP) and
downstream (ROCK, PAK1) factors (adapted from Zhou et al., 2009)

27
1.8 Angiogenesis assays and models
In vitro assays allow the study of endothelial cell proliferation, migration, tube formation, fluid
shear stress and flow, intracellular signalling and cell interactions (single or co-culture studies)
(Auerbach et al., 2003; Staton et al., 2006; Martin and Murray, 2009). The endothelial cell tube
formation assay on basement membrane is very easy to perform and allows the study of
angiogenic and antiangiogenic factors, to define mechanisms and pathways involved in
angiogenesis and to define endothelial populations. Basically, upon seeding on an appropriate
matrix, endothelial cells undergo a series of differentiation processes that lead to the
establishment of vessel-like structures (Arnaoutova et al., 2009). A step closer to a more
complete strategy is the quantitative-three dimensional ex vivo mouse aortic ring angiogenesis
assay, as the vessel contains other cell types that interact with the endothelium in vivo (Baker
et al., 2012). After dissection, aortic rings are serum-starved and embedded in a matrix of
choice, according to the objectives of the study. Then, the rings are fed and allowed to develop
sprouts for about 5-9 days. Before embedding, the rings can be treated with siRNA and during
regular media changes throughout the assay drugs, growth factors, etc. can be added.
Subsequently, the rings can be analysed for a variety of parameters, such as sprout number and
length, pericyte coverage, as well as used for immunofluorescent staining and confocal
imaging. Although this assay can be informative, one of its limitations is the fact that it may
not be physiologically relevant, as normal aorta does not really sprout. Retina has also proved
to be a good and widely used model in angiogenesis research to investigate neurovascular
relationships and developmental and pathological angiogenesis (Gariano and Gardner, 2005).
Although very informative, cell cultures and ex vivo models don’t account for the whole
picture, and need to be complemented with in vivo assays.

28
In vivo comparative studies of normal and pathological conditions, such as subcutaneous
implantation of matrigel plugs or sponge and subsequent analysis of vascularisation, as well
as the use of transgenic mice and zebrafish help to better understand the mechanisms of
angiogenesis and to develop and predict the effect of antiangiogenic drugs (Staton et al., 2006;
Martin and Murray, 2009).
The mouse (Mus musculus) has been used as a mammalian model for a very long time. More
recently, the zebrafish (Danio rerio) has proven to be a suitable model to human angiogenesis
and its use over the last years has increased. Zebrafish embryos have an external development
and are transparent, being suitable for very simple microscopy analysis with much detail
(Lessman, 2011). Being a vertebrate, the vasculature is similar to the mammalian one (Gore et
al., 2012). The molecular mechanisms regulating vasculogenesis and haematopoiesis are
conserved throughout vertebrate evolution as demonstrated, for example, by studies using the
cloche and spadetail mutants. In brief, both mutants display defects in haematopoiesis, but only
the cloche mutants have altered vascular gene expression. In these fish no vasculature at all
develops (Thompson et al., 1998). Transgenic lines are already available and they can be used
to directly assess the effect of morpholino knock down of genes of interest. The fact that the
genome is sequenced is another advantage (Weinstein, 2000).
The zebrafish model has contributed to finding novel endothelial-specific genes, uncover gene
function, understand developmental processes, as well as disease pathogenesis, progression
and regression. Sumanas et al. (2005) have identified several endothelial specific genes using
the zebrafish cloche mutant. They analysed over 15,000 zebrafish genes or ESTs in mutants
affected at a very early step of haematopoiesis and vasculogenesis. These fish lack almost all
blood cells, head and trunk endothelial cells and the endocardium, as well as markers for both
lineages, such as scl, gata1, flt1 and flt4. Dual specificity phosphatase 5, cadherin 5 (VE-

29
cadherin), aquaporin 8 and ETS1-like protein (etsrp) were found to be significantly down-
regulated in these mutants and their expression pattern has shown their endothelial specificity.
The same authors have then characterised etsrp and demonstrated that it is necessary and
sufficient for the initiation of vasculogenesis (Sumanas and Lin, 2006). Etsrp morpholino
knockdown in vivo resulted in the impairment of angioblast migration, differentiation and
functional blood vessel formation. Vascular endothelial markers were highly reduced in these
morphants and overexpression of etsrp restored their expression in the cloche mutants. More
vascular-specific genes were identified in the zebrafish by microarray analysis of etsrp
overexpressing zebrafish embryos, such as angiotensin II type 2 receptor, endothelial cell
specific adhesion molecule and stabilin 2 (Wong et al., 2009).
Zebrafish have been found to develop almost any tumour type known in humans, with
comparable morphology and acting through similar signalling pathways (Feitsma and Cuppen,
2008). Given all the manipulation and imaging advantages of zebrafish, a model for hypoxia-
induced pathological angiogenesis that mediates tumour cell dissemination, invasion and
metastasis has been created (Lee et al., 2009). Under hypoxia implanted murine fibrosarcoma
cells were disseminated from primary sites, invaded neighbouring tissues and metastasised to
distal parts of the body, whereas under normoxic conditions this did not happen.
Over the years many mouse models have been developed to study angiogenesis (both normal
and pathological), as well as cancer and many other conditions. These models can be wild type
mice that are surgically or otherwise physically modified or transgenic mice, which are
genetically altered. For example, the acute murine hind limb ischemia and reperfusion model
entails simultaneous occlusion of several branches of the femoral and iliac arteries to achieve
limb ischemia, followed by loosening of the pressure source to allow reperfusion (Crawford et
al., 2006). Knockout mouse models for endothelial genes have provided many insights into

30
vascular cell biology. The models available can be more or less complex, ranging from null
knockouts of the gene of interest obtained by gene targeting to conditional or inducible
knockouts, where the disruption of the occurs only in certain tissue types or upon stimulation.
An example of the former is the creation of the Tie2Cre deleter strain, that allows the study of
gene deletions specifically in the endothelium (Kisanuki et al., 2001). Another type of
transgenic mice include the expression of specific proteins fused to GFP, to allow visual
analysis, as well as cell isolation (Hillen et al., 2008). A new transgenic line can also be created
by crossing and combining pre-existing ones.
With the development of new laboratorial techniques and tools, software and equipment, the
available amount of data for mouse tumour models is enormous. In order to facilitate the
integration, location and visualisation these data, the Mouse Tumour Biology database has been
created (Kupke et al., 2008).
1.9 Hypothesis
With evidence showing that ECSCR is specifically expressed in endothelium and is involved
in cytoskeletal processes, the hypothesis being tested is that ECSCR promotes specific
endothelial cells events and its absence leads to defective vasculature formation.

31
1.10 Aim of the study
Our group has shown that ECSCR is specific to the endothelium, binds to filamin A and its
absence in HUVECs causes impairment of chemotactic migration and tube formation. It locates
to the plasma membrane and is enriched in filopodia. This suggested a role for ECSCR in
modulating cell migration through the modulation of the actin cytoskeleton (Herbert et al.,
2008; Armstrong et al., 2008). However, to the date of the start of this project nothing else was
known about this interesting molecule.
For this study, three models were used to establish molecular mechanisms by which ECSCR
regulates endothelial cell chemotaxis and angiogenesis, one in vitro: primary human umbilical
vein endothelial cells (HUVECs), and two in vivo: zebrafish and mice. The main objectives
were:
1– To identify ECSCR binding partners and reveal downstream signalling. The
elucidation of ECSCR-filamin A interaction was pursued and other binding partners were
investigated and uncovered. The effect of ECSCR loss on the distribution of these proteins was
assessed.
2– To determine the role of Ecscr during zebrafish vascular development.
The endothelial specificity of Ecscr in zebrafish was confirmed by in situ hybridization (it
seems to be located only in the zebrafish head and major trunk vasculature) and RT-PCR has
shown that Ecscr expression increases at the onset of vasculogenesis (around 15 hpf). When

32
Ecscr is knocked down with morpholino antisense oligonucleotides, the sprouting of
intersegmental vessels is disrupted.
3– To develop and characterise an Ecscr knockout mouse model
In order to further characterise the role of Ecscr during mammal development and, potentially,
during adult life in healthy and pathological andgiogenesis conditions, an Ecscr null knockout
mouse was generated. Preliminary data from LacZ staining show endothelial specificity.
Interestingly, Ecscr seems to be present only in some vessels and not all vasculature.
4 – To investigate if the function of ECSCR is conserved across species
Evidence from qPCR and in situ hybridization shows that endothelial specificity of ECSCR is
conserved in human, mouse and zebrafish. Taking data together from this work and published
literature, ECSCR seems to have a role in the development of vessels of smaller calibre (mouse
and zebrafish).

33
2 MATERIALS AND METHODS
34
2.1 Reagents and equipment
All chemicals used were of analytical or molecular biology grade and purchased from Sigma-
Aldrich (Gillingham, UK), unless otherwise specified.
Different centrifuges were used, according to the volumes, temperatures and centrifugation
speeds required:
- Biofuge Pico Heraeus (Kendro Laboratory Products GmbH, Langenselbold, Germany) for
1.5 ml tubes and up to 16060 x g;
- Hettich Mikro 22R (refrigerated) (Andreas Hettich GmbH, Tuttlingen, Germany) for 1.5 ml
tubes and up to 21910 x g;
- Biofuge Primo Heraeus (Thermo Electron Corporation, Waltham, USA) for 15 or 50 ml tubes
and up to 2576 x g;
- AvantiTM J-20XP (refrigerated) (Beckman Coulter, Brea, CA, USA) for up to 500 ml bottles
and up to 26000 x g. Depending on the tube/bottle size, JLA-10.5 or JA-25.5 rotors were used.
All other equipment used is listed throughout this chapter, within the respective sections.
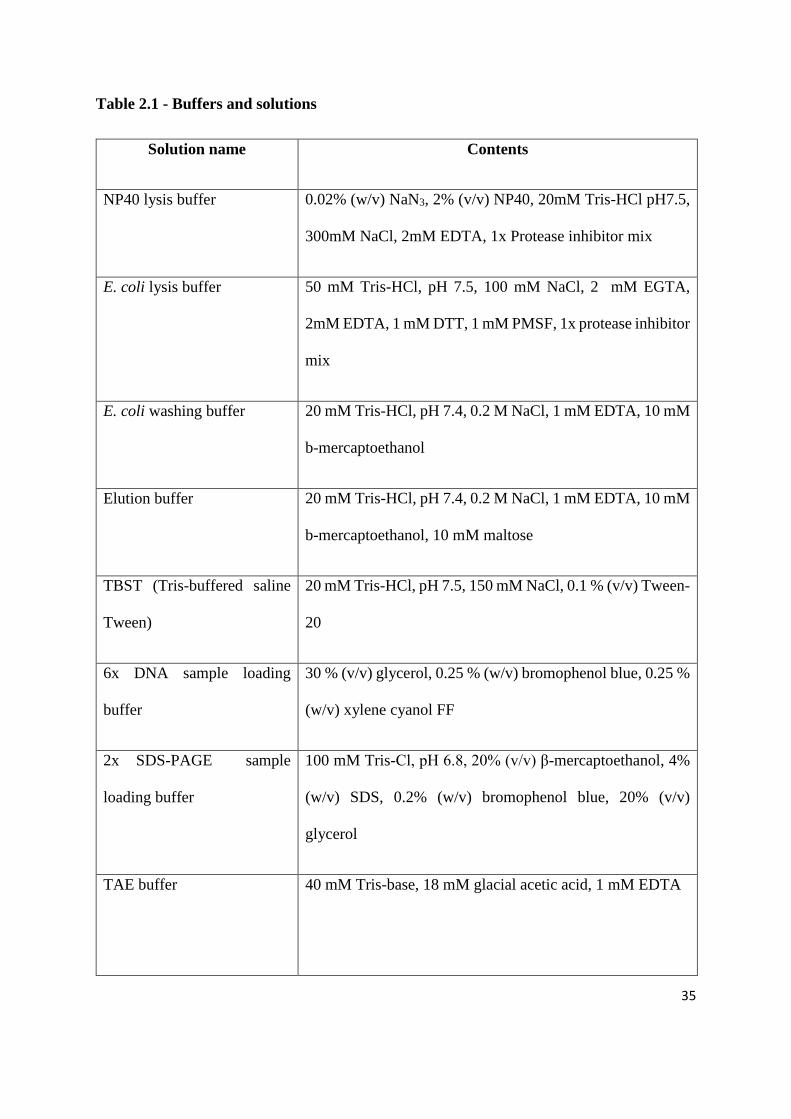
2.1.1 Buffers and solutions
The general use buffers and solutions utilised are listed and described below, on table 2.1.1.
Any other specific or commercial solutions are referred in the respective sections.
35
Table 2.1 - Buffers and solutions
Solution name Contents
NP40 lysis buffer 0.02% (w/v) NaN3, 2% (v/v) NP40, 20mM Tris-HCl pH7.5,
300mM NaCl, 2mM EDTA, 1x Protease inhibitor mix
E. coli lysis buffer 50 mM Tris-HCl, pH 7.5, 100 mM NaCl, 2 mM EGTA,
2mM EDTA, 1 mM DTT, 1 mM PMSF, 1x protease inhibitor
mix
E. coli washing buffer 20 mM Tris-HCl, pH 7.4, 0.2 M NaCl, 1 mM EDTA, 10 mM
b-mercaptoethanol
Elution buffer 20 mM Tris-HCl, pH 7.4, 0.2 M NaCl, 1 mM EDTA, 10 mM
b-mercaptoethanol, 10 mM maltose
TBST (Tris-buffered saline
Tween)
20 mM Tris-HCl, pH 7.5, 150 mM NaCl, 0.1 % (v/v) Tween-
20
6x DNA sample loading
buffer
30 % (v/v) glycerol, 0.25 % (w/v) bromophenol blue, 0.25 %
(w/v) xylene cyanol FF
2x SDS-PAGE sample
loading buffer
100 mM Tris-Cl, pH 6.8, 20% (v/v) β-mercaptoethanol, 4%
(w/v) SDS, 0.2% (w/v) bromophenol blue, 20% (v/v)
glycerol
TAE buffer 40 mM Tris-base, 18 mM glacial acetic acid, 1 mM EDTA

36
Solution name Contents
SDS-PAGE running buffer
(1x)
25 mM Tris-base, 0.25 M glycine, 0.1 % (w/v) SDS
Western blotting transfer
buffer (1x)
6 mM Tris-base, 47.6 mM glycine, 20 % (v/v) methanol, pH
8.3
Stripping buffer 1M Tris pH7.5, 10% (v/v) SDS
Coomassie staining buffer 40 % (v/v) methanol, 10 % (v/v) acetic acid, 0.2 g Coomassie
Briliant Blue dye
Coomassie destaining buffer 10 % (v/v) acetic acid, 12.5 % (v/v) isopropanol
PBS 0.14 M NaCl, 2.68 mM KCl, 10 mM Na2HPO4, 1.76 mM
KH2PO4, pH 7.4
Hybridization buffer 50% (v/v) formamide, 5x SSC, 0.5 mg/ml tRNA, 0.05 mg/ml
heparin, 9.2 mM citric acid, 1% (v/v) Tween 20
MABT 0.1M maleic acid, 0.15M NaCl, pH7.5, 0.1% (v/v) Tween 20
BCL buffer III 0.1M Tris-HCl, 0.1M NaCl, 0.05M MgCl2, 1% (v/v) Tween
20
37
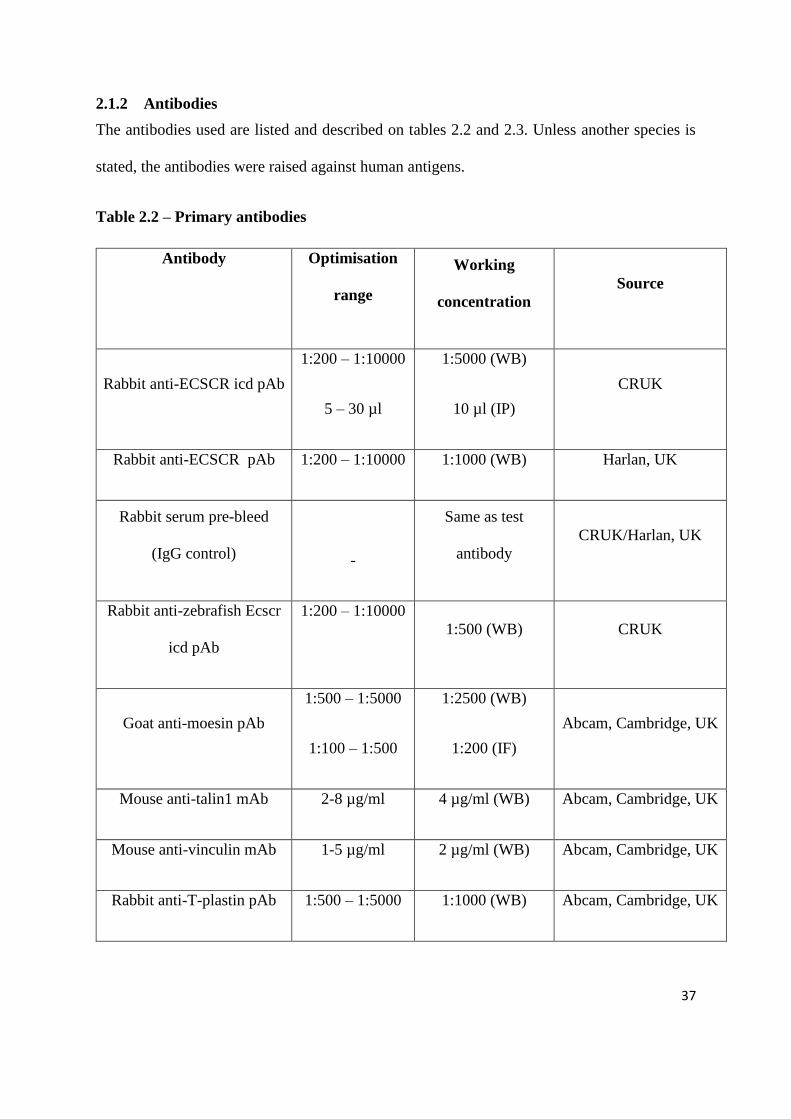
2.1.2 Antibodies
The antibodies used are listed and described on tables 2.2 and 2.3. Unless another species is
stated, the antibodies were raised against human antigens.
Table 2.2 – Primary antibodies
Antibody
Optimisation
range
Working
concentration
Source
Rabbit anti-ECSCR icd pAb
1:200 – 1:10000
5 – 30 µl
1:5000 (WB)
10 µl (IP)
CRUK
Rabbit anti-ECSCR pAb 1:200 – 1:10000 1:1000 (WB) Harlan, UK
Rabbit serum pre-bleed
(IgG control)
-
Same as test
antibody
CRUK/Harlan, UK
Rabbit anti-zebrafish Ecscr
icd pAb
1:200 – 1:10000
1:500 (WB) CRUK
Goat anti-moesin pAb
1:500 – 1:5000
1:100 – 1:500
1:2500 (WB)
1:200 (IF)
Abcam, Cambridge, UK
Mouse anti-talin1 mAb 2-8 µg/ml 4 µg/ml (WB) Abcam, Cambridge, UK
Mouse anti-vinculin mAb 1-5 µg/ml 2 µg/ml (WB) Abcam, Cambridge, UK
Rabbit anti-T-plastin pAb 1:500 – 1:5000 1:1000 (WB) Abcam, Cambridge, UK
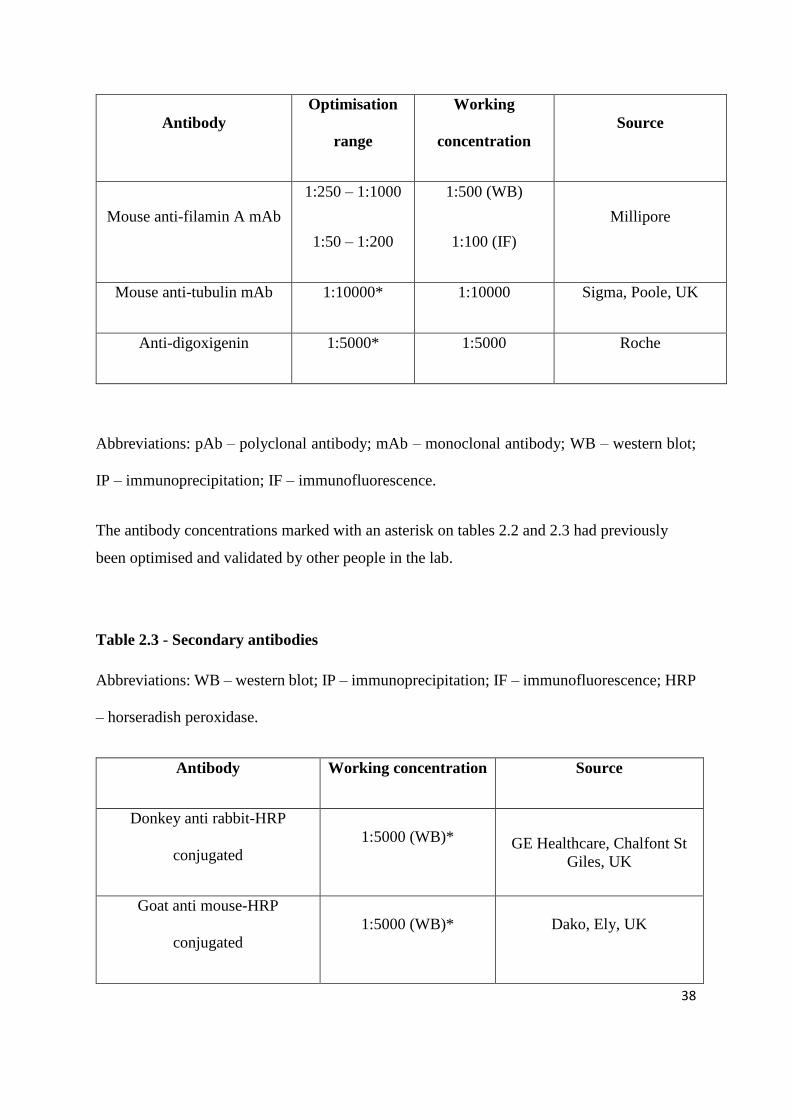
38
Antibody
Optimisation
range
Working
concentration
Source
Mouse anti-filamin A mAb
1:250 – 1:1000
1:50 – 1:200
1:500 (WB)
1:100 (IF)
Millipore
Mouse anti-tubulin mAb 1:10000* 1:10000 Sigma, Poole, UK
Anti-digoxigenin 1:5000* 1:5000 Roche
Abbreviations: pAb – polyclonal antibody; mAb – monoclonal antibody; WB – western blot;
IP – immunoprecipitation; IF – immunofluorescence.
The antibody concentrations marked with an asterisk on tables 2.2 and 2.3 had previously
been optimised and validated by other people in the lab.
Table 2.3 - Secondary antibodies
Abbreviations: WB – western blot; IP – immunoprecipitation; IF – immunofluorescence; HRP
– horseradish peroxidase.
Antibody Working concentration Source
Donkey anti rabbit-HRP
conjugated
1:5000 (WB)* GE Healthcare, Chalfont St
Giles, UK
Goat anti mouse-HRP
conjugated
1:5000 (WB)* Dako, Ely, UK

39
Table 2.3 (cont.) – Secondary antibodies
Antibody Working concentration Source
Mouse anti-rabbit light chain
specific-HRP conjugated
1:1000 (WB)* Millipore
Donkey anti-rabbit-Alexa 488
conjugated
4 µg/ml (IF)* Invitrogen
Goat anti-rabbit-Alexa 546
conjugated
4 µg/ml (IF)* Invitrogen
Goat anti-mouse-Alexa 488
conjugated
4 µg/ml (IF)* Invitrogen
Goat anti-mouse-Alexa 546
conjugated
4 µg/ml (IF)* Invitrogen
2.1.3 Cloning vectors
The plasmids used to insert various complete or partial open reading frames are listed and
described on table 2.4.

40
Table 2.4 - Cloning vectors
Plasmid Source Use
Pmal New England Biosciences MBP-fusion proteins
Pgex Amersham Biosciences GST-fusion proteins
PCR Topo blunt Invitrogen General blunt end cloning
pCS2 DL Turner, Michigan In situ probes synthesis
pACT2 Clontech Yeast-two-hybrid assay
pGBT9 Clontech Yeast-two-hybrid assay
Zipper-hGLuc[1]93 Gift from Remy and
Michnick, 2006
Luciferase
complementation assay
Zipper-hGLuc[2]93 Remy and Michnick, 2006 Luciferase
complementation assay
pRGFP-N1 Clontech C-terminus GFP fusions
2.1.4 Oligonucleotides
All the primers, as well as the siRNA duplexes were purchased from Eurogentec (Southampton,
UK). Probes for qPCR were purchased from Roche Applied Science, UK and RNA antisense
morpholinos were obtained from Gene Tools, USA.
Table 2.5 - Oligonucleotides used for sequencing, cloning, colony PCR screen and site-
directed mutagenesis (SDM)
Primer Oligonucleotide sequence (5’-3’) Application
SP6 CATACGATTTAGGTGACACTATAG Sequencing
T7 TAATACGACTCACTATAGGG Sequencing
EGFP-N CGTCGCCGTCCAGCTCGACCAG
Sequencing
pGEXF CACGTTTGGTGGTGGCGACC Sequencing
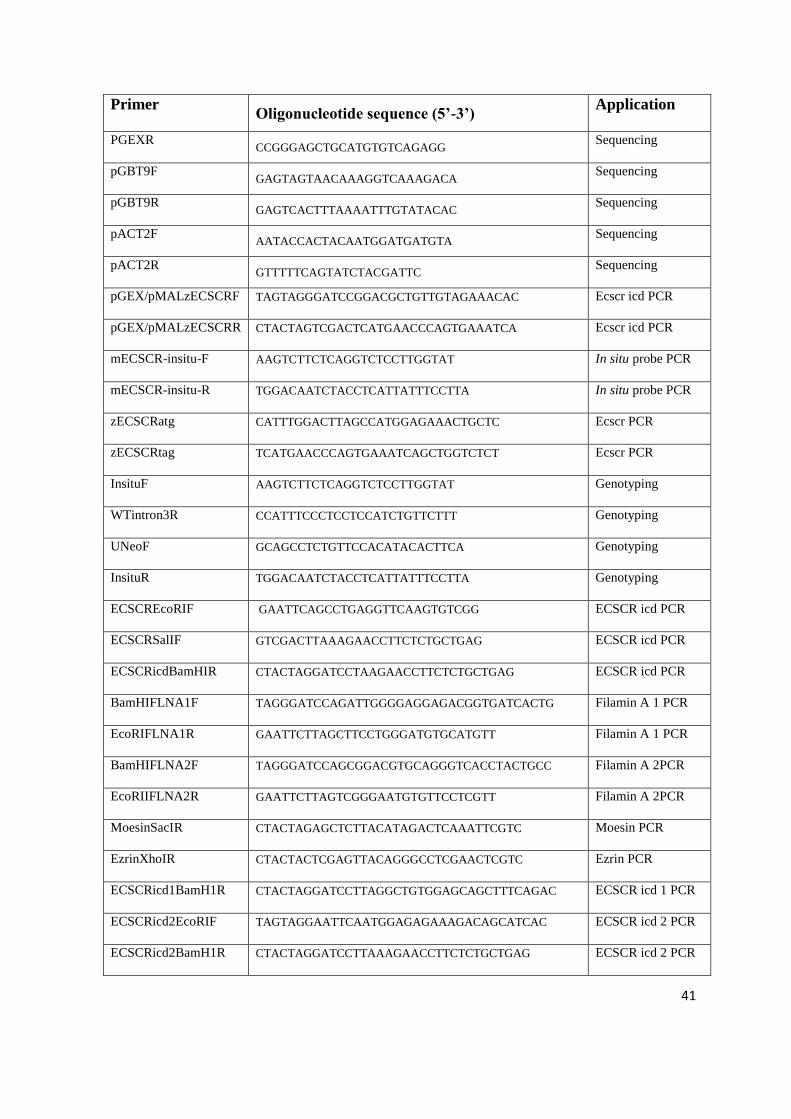
41
Primer Oligonucleotide sequence (5’-3’)
Application
PGEXR CCGGGAGCTGCATGTGTCAGAGG
Sequencing
pGBT9F GAGTAGTAACAAAGGTCAAAGACA
Sequencing
pGBT9R GAGTCACTTTAAAATTTGTATACAC
Sequencing
pACT2F AATACCACTACAATGGATGATGTA
Sequencing
pACT2R GTTTTTCAGTATCTACGATTC
Sequencing
pGEX/pMALzECSCRF TAGTAGGGATCCGGACGCTGTTGTAGAAACAC Ecscr icd PCR
pGEX/pMALzECSCRR CTACTAGTCGACTCATGAACCCAGTGAAATCA Ecscr icd PCR
mECSCR-insitu-F AAGTCTTCTCAGGTCTCCTTGGTAT In situ probe PCR
mECSCR-insitu-R TGGACAATCTACCTCATTATTTCCTTA In situ probe PCR
zECSCRatg CATTTGGACTTAGCCATGGAGAAACTGCTC Ecscr PCR
zECSCRtag TCATGAACCCAGTGAAATCAGCTGGTCTCT Ecscr PCR
InsituF AAGTCTTCTCAGGTCTCCTTGGTAT Genotyping
WTintron3R CCATTTCCCTCCTCCATCTGTTCTTT Genotyping
UNeoF GCAGCCTCTGTTCCACATACACTTCA Genotyping
InsituR TGGACAATCTACCTCATTATTTCCTTA Genotyping
ECSCREcoRIF GAATTCAGCCTGAGGTTCAAGTGTCGG ECSCR icd PCR
ECSCRSalIF GTCGACTTAAAGAACCTTCTCTGCTGAG ECSCR icd PCR
ECSCRicdBamHIR CTACTAGGATCCTAAGAACCTTCTCTGCTGAG ECSCR icd PCR
BamHIFLNA1F TAGGGATCCAGATTGGGGAGGAGACGGTGATCACTG Filamin A 1 PCR
EcoRIFLNA1R GAATTCTTAGCTTCCTGGGATGTGCATGTT Filamin A 1 PCR
BamHIFLNA2F TAGGGATCCAGCGGACGTGCAGGGTCACCTACTGCC Filamin A 2PCR
EcoRIIFLNA2R GAATTCTTAGTCGGGAATGTGTTCCTCGTT Filamin A 2PCR
MoesinSacIR CTACTAGAGCTCTTACATAGACTCAAATTCGTC Moesin PCR
EzrinXhoIR CTACTACTCGAGTTACAGGGCCTCGAACTCGTC Ezrin PCR
ECSCRicd1BamH1R CTACTAGGATCCTTAGGCTGTGGAGCAGCTTTCAGAC ECSCR icd 1 PCR
ECSCRicd2EcoRIF TAGTAGGAATTCAATGGAGAGAAAGACAGCATCAC ECSCR icd 2 PCR
ECSCRicd2BamH1R CTACTAGGATCCTTAAAGAACCTTCTCTGCTGAG ECSCR icd 2 PCR

42
Primer Oligonucleotide sequence (5’-3’) Application
MoesinNotIF TAGTAGGCGGCCGCACCATGCCCAAAACGATCAGTGTGC
GTGTG
Moesin PCR
MoesinClaIR CTACTAATCGATCATAGACTCAAATTCGTCATTGCGC Moesin PCR
ECSCRNotIF TAGTAGGCGGCCGCACCATGGGCACCGCAGGAGCCATGC
AGCTG
ECSCR PCR
ECSCRClaIR CTACTAATCGATAAGAACCTTCTCTGCTGAGAGACTTTG ECSCR PCR
Beta-actinF GCACCCAGCACAATGAAGA (Probe 63) qPCR
Beta-actinR CGATCCACACGGAGTACTTG (Probe 63) qPCR
ECSCRF AGCTGTGCTGGGTGATCCT (Probe 69) qPCR
ECSCRR ATTGTGGGCTGGGAGTTGT (Probe 69) qPCR
Table 2.6 - siRNA duplexes for in vitro knock-down
siRNA Duplex Gene knock-down Duplex sense strand (5’-3’)
D1 Human ECSCR ACAAUGACCCAGACCUCUA99
NCD No interaction Eurogentec keep this sequence private

43
Table 2.7 - RNA antisense morpholinos for in vivo translation or splice interference
Morpholino Gene affected Antisense sequence (5’-3’)
5’UTR Zebrafish Ecscr GCGTAAGTCCAAATGACGTTCAATC
5’UTR mismatch None GGCAAACTCGAAATCACCTTCAATC
Splice Zebrafish Ecscr CATCAGTAGAAAACCTACCAAAGGC
Splice mismatch None CATGACTACAAAACCTACGAAACGC
2.2 Mammalian cell culture and related techniques
2.2.1 Mammalian cells
Human umbilical vein endothelial primary cells (HUVECs) were isolated from cords obtained
through Birmingham Women’s Health Care NHS Trust, donated with informed consent. They
were prepared according to Jaffe et al., (1973). These cells were cultured in M199 complete
medium.
Human embryonic kidney 293T (HEK 293T) cells were obtained from Cancer Research UK
Central Services (Clare Hall, Hertfordshire). These cells were cultured in complete DMEM
medium.
2.2.2 Cell culture
All cell culture techniques were performed using sterile plastic culture dishes or plates (Falcon,
Becton Dickinson Labware, Franklin Lakes, USA) and the cells were incubated in a humidified
atmosphere with 5 % CO2 supply at 37 °C (Sanyo CO2 incubator, Sanyo Electric CO, Japan).
The media and gelatine were filtered through sterile 0.22 μm pore filters (Millipore) prior to
use and PBS was sterilised by autoclaving.

44
HEK 293T cells don’t require surface coating. Before seeding HUVECs, the Petri dishes,
coverslips or wells were coated with 0.1% (w/v) gelatine from porcine skin (Fluka,
BioChemika, Seelze, Germany) in PBS and incubated at 37ºC for 30 minutes. After that time
the gelatine was removed and the cells were plated, covered with warm complete M199
medium and incubated at 37ºC.
To culture HUVECs M199 medium (CRUK Central Services or Sigma-Aldrich) was
supplemented with 10% (v/v) foetal calf serum (FCS) (PAA Cell Culture Company), 0.3%
(v/v) bovine brain extract (prepared according to Maciag et al., 1979), 90 μg/ml of heparin, 4
mM of L-glutamine and penicillin/streptomycin (Invitrogen), if required. Complete DMEM
was made by adding 10% (v/v) FCS, 4 mM of L-glutamine and penicillin/streptomycin
(Invitrogen), if required, to Dulbecco’s Modified Eagle’s Medium.
HUVEC primary cells should be used within five passages, split once a week at a 1:3 ratio. In
order to split them, the medium was removed, the cells were washed with PBS and 1.5 ml of
trypsin (20 mg/ml) were added to a 10 cm dish. After 5 minutes the reaction was stopped by
adding 4.5 ml of warm medium. The suspension was then centrifuged at 195 x g, the
supernatant containing trypsin was discarded and the cells were ressuspended in warm medium
and seeded. HEK 293T cells were split in the same fashion, 1:10, twice a week.
Cell counting, when necessary, was performed after exposing the cells to trypsin and quenching
the reaction with complete medium, by mixing 10 μl of the cell suspension and 10 μl of Trypan
blue (Stratagene). 10 μl of this mixture were loaded into a haemocytometer counting chamber
(Neubauer, Paul Marienfeld GmbH & CO, Germany) and counted according to the
manufacturer’s instructions, on an inverted Leica DM IL microscope (Leica Microsystems,
Houston, USA).
45
2.2.3 siRNA knock down of ECSCR in HUVECs
The siRNA duplexes were designed according to the rules described by Reynolds et al. (2004).
One million HUVECs were seeded on gelatine coated 10 cm plates and incubated for 24 hours
at 37oC. The next day transfections were performed with Mock (sterile water), ECSCR duplex
1 (D1) and negative control duplex (NCD) siRNA at 10 nM with 0.3% (v/v) lipofectamineTM
RNAiMAX (Invitrogen). Two mixes were setup, the first containing 2 μl of 20 μM duplex /
water (Mock) in 678 μl of OptiMEM (Gibco BRL, UK) and the second containing 12 μl of
RNAiMAX lipofectamineTM and 108 μl of OptiMEM medium. Both mixtures were
homogenised and incubated separately for 10 min at room temperature and then combined,
gently mixed and incubated for another 10 min at room temperature. Meanwhile, the cells were
washed twice with PBS. The transfection mixtures were added to 3200 μl of OptiMEM
medium, mixed and the cells were covered with this solution. The plates were incubated for
four hours at 37ºC. After that time, the transfection mix was replaced with normal complete
M199 medium (without antibiotics). Two days after transfection the cells were used for various
assays.
2.2.4 Polyethylenimine (PEI) transfection of HEK 293T cells
Conventional transfection protocols rely on the calcium phosphate precipitation technique.
However, large variability in transfection efficiency is observed ans it is difficult to scale-up
the precipitation reactions (Naldini et al., 2006). Polyethylenimine is a hydrophilic polymer
that condenses DNA into positively charged particles, which bind to anionic cell surface
residues and are imported into the cell via endocytosis. Once inside, protonation of the amines
results in an influx of counter-ions and a lowering of the osmotic potential. Osmotic swelling
causes the vesicles to burst and release the polymer-DNA complex (polyplex) into the
cytoplasm. When the polyplex unpacks the DNA diffuses to the nucleus (Rudolph et al., 2000;
46
Akinc et al., 2004). Toledo et al. (2009) have shown that HEK293T transfections with PEI
after 24h display an efficiency of 94.3% (±3.2), compared to 66.2 (±5.6) to those made with
calcium phospate. Another advantage is that PEI transfections, unlike those that use calcium
phosphate, do not require a medium change 16-20h after transfection. This protocol was
described for transfection of lentiviral vectors and optimised for smaller plasmids by Dr. Mike
Tomlinson (University of Birmingham, UK).
Three million HEK 293T cells were seeded on 10 cm plates, covered with complete DMEM
medium and incubated at 37ºC for 24 hours. On the next day the medium (without antibiotics)
was replaced 2 hours before the transfection. For the transfection 9 μg of DNA plasmid were
mixed with 1 ml of OptiMEM medium and 36 μl of PEI (1 mg/ml). The tubes were briefly
vortexed and left to rest for 10 min, to allow the PEI/DNA complexes to form. This solution
was then added to the medium and gently mixed in. The cells were incubated at 37ºC for 48h
and used for different assays.
2.2.5 Scratch wound assay
The scratch wound assay allows the observation of cell migration in vitro after a scratch is
made on a confluent monolayer. It is a quick, easy and inexpensive method (Liang et al., 2007).
For that purpose, HUVECs were plated and transfected with siRNA as described in section
2.2.3. After 36 h the cells were treated with trypsin and seeded at a 7.5 x 10⁴ cells/well density
on glass coverslips (13 mm diameter, VWR International), pre-coated with 0.1% gelatine (in
24-well cell culture plates, covered with 1 ml of complete M199 medium). At 48 h two
scratches were made across each monolayer and the cells were allowed to migrate for eight
hours. After that time, the cells were fixed and immunostained for various proteins, as
described on section 2.2.6. In the classical scratch wound assay the cells are allowed to migrate
for 24h, with images being taken at 4, 6, 8, 12 and 24h to monitor the speed of wound closure.

47
In this case, the cells were allowed to migrate for only 8h because the aim was to stain cells
that were confluent as well as cells that were in the process of migration.
2.2.6 Immunofluorescent staining
The cells were seeded and treated as described on section 2.2.5. The medium was removed
from the wells and the cells were washed with PBS. Then, they were fixed with 4% PFA (w/v)
in PBS for 15 min at room temperature and permeabilised with 0.1% (v/v) Triton X100 in PBS
for 4 min. One more PBS wash was performed and the cells were incubated with 100 µl of
blocking buffer (10% (v/v) FCS, 3% (w/v) BSA in PBST – PBS with 0.1% (v/v) Tween 20)
for 1 h at room temperature. All the subsequent incubations were done at this temperature. The
primary antibodies were added in the concentrations described on table 2.1.2, in blocking
buffer and incubated for 1 h. After that time, the cells were washed 3 times with PBST for 5
min each and incubated for one more hour with secondary antibody with an appropriate
fluorescent tag diluted in blocking buffer (4 µg/ml). This solution was washed out with PBST
for 5 min, 3 times. The coverslips were then mounted on glass slides (Menzel-Glaser GmbH,
Braunschweig, Germany) using 5 μl of ProLong Gold Antifade reagent with DAPI (Invitrogen)
per coverslip. The stained cells were observed and images were acquired using an Axiovert
100M confocal microscope and LSM 510 software (Zeiss). LSM Image Browser software
(Zeiss) was used to open, edit and export the images.
2.3 Protein analyses and assays
2.3.1 Cell lysis and protein extraction
10 cm confluent plates of cells were washed with 1x PBS, exposed to trypsin, quenched with
medium and centrifuged at 195 x g. The pellet was ressuspended and lysed in 100μl of NP40
buffer by pipetting up and down (on ice). Alternatively, after the PBS wash, the cells were
treated with 150 μl of lysis buffer and scraped and collected into tubes on ice. The samples

48
were centrifuged at 10000 rpm for 5 min and the supernatant was transferred into a new tube
containing 1 V of 2x SDS-PAGE sample loading buffer. This mixture was boiled for 5 min at
100ºC and loaded on an SDS-PAGE gel or stored at -80ºC.
2.3.2 Immunoprecipitation using an anti-ECSCR intracellular (icd) domain antibody
To precipitate possible binding partners for ECSCR, 1050 μl of HUVECs lysate from seven 10
cm plates for each assay were incubated for 2 hours at 4ºC on a wheel with 10 μl of antibodies
(either the polyclonal antibody against the icd of ECSCR or rabbit IgG as a control) and 30 μl
of packed G-protein beads (Sigma). After that period the supernatant was removed and the
beads were washed with 1ml of NP40 buffer 3 times. SDS-PAGE loading buffer was added
1:1 and the samples were boiled at 100oC for 5 min and loaded on a polyacrylamide gel, ran,
and stained with brilliant blue coomassie.
2.3.3 SDS-PAGE
Protein samples were boiled for 5 min at 100ºC, spun down for 10 s and loaded on 6-10%
polyacrylamide gels (Protogel, National Diagnostics, Hessle Hull, UK), according to the size
of the proteins of interest. These gels were prepared according to Sambrook and Russel (2001).
All the electrophoresis equipment used was from Invitrogen (Carlsbad, USA). Electrophoresis
was performed in 1x running buffer at 80 V until the samples reached the resolving buffer and
then the voltage was increased to 120 V. After the electrophoresis the gels were Coomassie
stained or used for western blotting.
2.3.4 Gel staining of proteins with Coomassie Brilliant Blue
For protein staining, polyacrylamide gels were placed in coomassie brilliant blue staining
buffer and rocked for at least 1 hour at room temperature (or overnight). The gel was then de-
stained at room temperature using Coomassie Brilliant Blue de-staining buffer. For the
preparation of samples for mass spectrometry analysis, gels were stained with Protoblue Safe

49
(National Diagnostics) colloidal stain (1 part of ethanol plus 9 parts of the colloidal solution)
and de-stained with distilled water.
2.3.5 In-gel digestion of proteins separated on SDS-PAGE gel for mass spectrometry
analysis
All tubes, boxes, ruler and glass plate were rinsed with 0.1% formic acid (Fluka)/50%
acetonitrile. The stained gel was placed the glass plate and the bands were excised with a sterile
scalpel blade (about 5 mm each) and placed in individual 1.5 ml tubes. The gel pieces were
washed 2x with 100 µl of 50% acetonitrile/50 mM ammonium bicarbonate for 45 minutes at
37oC with agitation and then dried down in the speedvac. 50 µl of 50 mM DTT (made up in
10% acetonitrile/50 mM ammonium bicarbonate) were added and an incubation at 56oC for 1h
followed. The supernatant was discarded and 50 µl of 100 mM iodoacetamide (made up in
10% acetonitrile/50 mM ammonium bicarbonate) were added. The tubes were covered in foil
and incubated at room temperature for 30 minutes. The supernatant was removed and the bands
were washed 3x with 10% acetonitrile in 40 mM ammonium bicarbonate for 15 minutes at
room temperature with agitation. The pellets were dried down in the speedvac and rehydrated
in 20 µl or 1.5x the gel volume (if greater than 20 µl) of 12.5 µg/ml Promega seq. Grade
modified trypsin in 10% acetonitrile/40 mM ammonium bicarbonate for 1h at room
temperature. 20 µl of 10% acetonitrile/40 mM ammonium bicarbonate were added and the
bands were incubated at 37oC overnight.
On the following day the supernatant was collected and saved and 30 µl of 3% formic acid in
water were added to the pellet and incubated at 37oC for 1h. This supernatant was added to the
one previously collected. This step was repeated for 30 min and the three supernatants
containing the digested peptides were combined. The samples were stored at -20oC and ran by
Dr. Douglas Ward from Cancer Sciences, University of Birmingham.
50
2.3.6 Expressing zebrafish Ecscr intracellular domain (icd) fused to MBP
Zebrafish Ecscr icd was amplified by PCR from cDNA and cloned into pMAL. This plasmid
was used to transform chemically competent BL21(DE3) pLys S E. coli. One colony was
inoculated in LB-broth (Ampicillin, Chloramphenicol), incubated over night at 37 ºC and then
diluted 100-fold into LB-broth (Ampicillin, Chloramphenicol). The bacteria were cultured at
37 ºC until OD600nm = 0.4-0.6, when they were induced with 1 mM IPTG for 3 hours. To
minimise protein degradation, 0.5 mM PMSF was added. After the induction, the bacteria were
centrifuged (10 min, 6000 rpm), washed with E. coli washing buffer and centrifuged again.
Pellets were stored in -80 ºC. After that, the bacteria were thawed on ice, lysed with ice-cold
E. coli lysis buffer (2 ml per 100 ml of bacterial culture) and ultra-sonicated for 3 min
(Ultrasonicator Vibra CellTM, Sonics & Materials, Newtown, USA). Triton X100 to 1% was
added and the samples were incubated on ice for 30 min. The lysates were centrifuged (10 min,
14000 rpm, 4 ºC), the supernatant was collected and mixed with glycerol to give a final
concentration of glycerol 50% (v/v) and stored at -20 ºC.
To purify the zebrafish Ecscr-MBP protein, bacterial lysate was incubated with packed amylose
beads on a rotating wheel for 2 hours at 4 °C. After that time beads were washed with E. coli
washing buffer and eluted with elution buffer and de-salted through a PD10 column. To
roughly assess the efficacy of purification and the amount of protein that was bound to
amylose-agarose beads, 10 μl of each sample was run on a polyacrylamide gel alongside with
the BSA samples as mass standards. The purified samples were sent to CRUK to immunise
two rabbits and produce a polyclonal antibody (1x 1200 µl of 50-100 µg and 5x 1200 µl of
200-400µg).
51
2.3.7 GST pull down
Human ECSCR icd was amplified by PCR from cDNA and cloned into pGEX, to make a GST
fusion protein, that was expressed and purified in the same way as described in 2.3.6, but using
glutathione beads instead of amylose ones. As a control, GST alone was also expressed (pGEX
vector alone). The pulldown was performed using 300 µl of bacterial lysates and 1050 µl of
HUVECs lysates, as described on section 2.3.2 for immunoprecipitation, but using glutathione
beads instead of protein G ones. After the final wash, 2x SDS-PAGE sample buffer was added
1:1 and the samples were boiled, ran on an SDS-PAGE gel and analysed by western blot.
2.3.8 Western Blot
After the SDS-PAGE, the gels, blotting paper and blotting pads were soaked in transfer buffer
for 10 min prior to assembling the transfer apparatus in the X cell II™ Mini cell, X cell II™
Blot Module and X cell sure lock™ (Invitrogen, Carlsbad, USA). PVDF membrane
(Immobilon-P, 0.45 μm, Millipore, Billerica, USA) was activated by pre-wetting in methanol
(Fisher Scientific) for 30 s and then placed also in 1x transfer buffer. Wet transfer was
performed at 30 V for 2 hours at 4 ºC. The membranes were stained with Ponceau S dye
(Sigma) to check the transfer and then blocked with 5 % dried milk (prepared in TBST buffer)
for 1 hour at room temperature or overnight at 4ºC. The membranes were briefly washed in
TBST and placed in appropriate primary antibody solution probing at room temperature for 1h
on a rotator. After this incubation, the membranes were washed for 30 min in TBST with 4
buffer changes and incubated with appropriate secondary antibodies conjugated with
horseradish peroxidase (HRP). After 1 hour of incubation at room temperature, the membranes
were washed for 30 min as above and developed with ECL Western Blotting
Detection Reagents (GE Healthcare, Little Chalfont, UK) for 1 minute. The blots were

52
visualized by autoradiography on Hyperfilm ECL (GE Healthcare) which was exposed to the
membrane for different times, in the dark.
When reprobing with another antibody was required, the membranes were stripped. For that
purpose, the membranes were incubated for 30 min at 65ºC in 50 ml of stripping buffer
supplemented with 350 μl of beta-mercaptoethanol (Sigma), washed with TBST for 30 min
changing the buffer every 10 min, blocked and probed as described above.
2.3.9 Yeast-two-hybrid assay
In order to assess direct interactions between ECSCR and candidate binding partners identified
by mass spectrometry, yeast-two-hybrid assays were performed.
2.3.9.1 Yeast strain and media
The yeast strain used for this assay was PJ69-4A (genotype: MATa, trp1-901, leu2-3,112, ura3-
52, his3-200, gal4Δ, gal80Δ, GAL2-ADE2, LYS2::GAL1-HIS3, met2::GAL7-lacZ).
PJ69-4A yeast was grown on yeast-peptone-dextrose (YPD) full medium (1 % (w/v) bacto-
yeast extract, 2 % (w/v) bacto-peptone, 2 % (w/v) dextrose, 0.01 % (w/v) tryptophan (Trp) and
2 % (w/v) bacto-agar (when solid medium was required).
For the assay, selective media were used. Special synthetic complete dextrose (SCD) medium
contained 0.67 % (w/v) yeast nitrogen base without amino acids, 2 % (w/v) dextrose and 0.14
% (w/v) yeast synthetic drop-out media supplement lacking histidine (His), leucine (Leu),
uracil (Ura) and Trp and 2 % (w/v) bacto-agar (for solid medium). Before the final screening,
as described below, SCD medium was supplemented with 100 mg/L Trp, 50 mg/L Leu, 40
mg/L His or 20 mg/L Ura. Except for Trp and Ura, that were sterilised by filtering through 0.22
μm-pore filters (Millipore), all the stock solutions were autoclaved.
53
2.3.9.2 Yeast-two-hybrid method
The entire method was carried out using aseptic technique.
ECSCR icd was cloned into pGBT9 (to be fused to the binding domain of Gal4p) and the
interacting candidates were cloned into pACT2 (to be fused to the activation domain of Gal4p).
These constructs were transformed into the yeasts sequentially and the positive clones were
selected by SCD medium lacking Trp (for clones containing pGBT9), Leu (for clones
containing pACT2) or both (for double transformants). This yeast strain contains a Gal4
promoter-His3 reporter gene. Once the double transformants were obtained, they were grown
on SCD-Leu--Trp- at 30oC and diluted to an OD600 of 0.5. Then, five ten-fold serial dilutions
were made and 10 µl of each were carefully placed on agar plates of SCD-Leu--Trp- and SCD-
Leu--Trp-His-(3AT) and allowed to grow for 3-7 days at 30oC. All spots should grow on the
former plates and in the latter only the ones where an interaction occurs should survive.
For the transformations yeasts were grown overnight at 30oC with agitation from a single
colony in 3 ml of YPD or SCD lacking the appropriate ingredients. The lithium acetate / single
stranded carrier DNA / polyethylene glycol method by Gietz and Woods (2002) was used.
Briefly, on the following morning the cultures were diluted to an OD600 of 0.25 and allowed to
grow for two more generations up to OD600 of 0.5-1. An OD600 of 1 is approximately 2 x 10⁷
yeast/ml. For this protocol, 2 x 10⁸ yeasts were used per transformation. These were centrifuged
for 2 min at 5000 x g and the pellets washed with 1 ml of sterile water and transferred into 1.5
ml tubes. Another centrifugation as before followed and the water was removed. In this order,
240 μl of 50 % (w/v) polyethylene glycol (PEG, molecular weight of 3350 g), 36 μl of 1 M
lithium acetate, 10 μl of 10 mg/ml single-stranded-carried DNA from salmon sperm
(Invitrogen) (previously boiled for 5 min and chilled on ice), and 34 μl of plasmid DNA diluted
in water (0.1 to 1 μg of DNA) were added to the yeast pellet, that was then ressuspended in this
54
mixture. The yeasts were agitated at 30oC for 30 min and then a 15 min heat-shock at 42oC was
performed. The yeasts were centrifuged as previously and the pellets were washed with 1 ml
of water. In the end, they were plated in the appropriate media, after ressuspending in 150-200
µl of water.
2.3.10 Luciferase complementation assay
When the yeast-two-hybrid method was unable to provide a more specific answer, protein-
protein interaction was studied using the luciferase complementation assay, where ECSCR was
cloned into Zipper-hGLuc[1]93 (to replace the zipper protein and make a fusion to the first half
of Gaussia luciferase) and the interacting candidates were cloned into Zipper-hGLuc[2]93 (to
replace the zipper protein and make a fusion to the second half of Gaussia luciferase) (Remy
and Michnick, 2006). When an interaction occurs, the two halves of luciferase come together
to form an active enzyme, and this activity can be measured using a luminometer upon supply
of an appropriate substrate (the Renilla luciferase assay system, from Promega was used).
The complementing plasmids were transfected into HEK 293T cells, following the PEI
protocol on section 2.2.4. As a transfection efficiency control, a third plasmid expressing beta-
galactosidase was co-transfected (1/10th of the concentration of the other plasmids, as advised
by Dr. Michael Tomlinson). After 48 h the medium was removed and the cells were washed
with PBS. For a 6-well plate 500 µl of 1x lysis buffer (Promega) were added to each well and
the plates were placed on a rocker and incubated at room temperature for 15 min.
The lysates were collected into 1.5 ml tubes. For the luciferase assay, it is not necessary to
remove the cell debris, but for other applications the lysates were spun down at 16,000 x g and
the clear supernatant was collected. 100 µl of 1x Renilla luciferase substrate in Renilla
luciferase assay buffer (Promega) were aliquoted into each well of an opaque, white, shiny,
55
clean 96-well plate and 20 µl of cell lysate were added and mixed thoroughly. This was done
in triplicates. Untransfected cells, as well as water and lysis buffer only were used as controls.
The plates were placed in the luminometer and the bioluminescence was read. Luminescence
was integrated over 10’’ with a 2’’ delay.
To normalise the luminescence data, a beta-galactosidase assay was also performed. For that,
900 µl of phosphate buffer (60 mM Na2HPO4, 40 mM NaH2PO4, 10 mM KCl, 1 mM MgSO4)
were added to 200 µl of ONPG (4 mg/ml dissolved in phosphate buffer 0.1 M, pH 7) and 40
µl of cell lysate. This mixture was incubated 37oC for about 1h, until yellow. The reaction was
stopped by adding 200 µl the Na2CO3 1M and the tubes were spun down for 10 minutes at
13000 rpm. The OD was measured at 420 nm. The normalised activity was calculated as
follows: normalised activity = luciferase activity/β-gal activity.
2.4 Molecular biology methods
All molecular biology methods were performed according to either the manufacturer’s
insctructions when kits were used or according to protocols existing in the laboratory that have
been optimised over time by various scientists, based on Sambrook and Russell (2001).
2.4.1 Bacterial strains and media
For transformation with various plasmids, fusion protein expression and site-directed
mutagenesis, chemically competent Escherichia coli strains DH5α, BL21(DE3) pLys S or
XL1-Blue Supercompetent Cells (Stratagene, La Jolla, USA) were used. All bacteria were
cultured in liquid Luria Bertani (LB) broth or plated on LB agar (both from Cancer Research
UK Central Services, Clare Hall, Hertfordshire or Sigma). According to the antibiotics
resistance carried by the different plasmids, 0.1 of mg/ml ampicillin (Amp, Sigma, Poole, UK),
56
0.02 mg/ml chloramphenicol (Sigma) and/or 0.03 mg/ml kanamycin (Sigma) were added to
the media.
2.4.2 DNA amplification by PCR
DNA fragments were amplified by polymerase chain reaction (PCR) using a high fidelity
polymerase. 25 μl of reaction contained 5.8 μl of water, 4 μl of 5x Phusion HF Buffer (New
Engalnd Biolabs (NEB), Herts, UK), 2 μl of dNTP (2 mM, Bioline, London, UK), 2 μl of each
primer (10 μM) and 0.2 μl of PhusionTM High-Fidelity DNA Polymerase (NEB). In the end
500 ng of template were added to the mixture. For the negative control, the template was
replaced by water. The PCR reaction conditions were as follows: initial denaturation (98ºC, 30
s), 30 cycles of denaturation (98ºC, 10 s), annealing (appropriate temperature for each pair of
primers, 30 s) and elongation (72 ºC, for the time necessary for the fragment to be amplified –
ca. 1000 bp/min). A final elongation step at 72ºC for 5 min was included.
2.4.3 DNA digestion using restriction enzymes
Restriction enzyme digestion was used either to confirm the presence of inserts in plasmids or
to digest inserts and vectors for ligation (sticky ends). Purified PCR product or plasmid were
incubated in 50 μl of digestion mixture, containing 5 μl of suitable 10x NEBuffer, 5 μl of 10x
BSA (if necessary, NEB), 3-5 units of each restriction enzyme (NEB) per microgram of DNA
and water. Digestion was carried out for 2 hours at the appropriate temperature for each
enzyme.
2.4.4 Nucleic acids electrophoresis in agarose gel
DNA/RNA gel electrophoresis was performed in 0.8 – 1.5% agarose (VWR International,
Lutterworth, UK) gels made up with TAE buffer and containing 1:10000 DNA Sybr Safe
(Invitrogen). The separation was carried out in TAE buffer, at 90 V. Gels were visualised and
imaged using Gene Genius Bio Imaging System (Syngene, Cambridge, UK).
57
2.4.5 Plasmid ligation and bacterial transformation
Inserts obtained directly by PCR or restriction digestion were ligated into the appropriate
digested plasmids using T4 Ligase (400000 U/ml, NEB). To 16 μl of insert/vector ratio of 3:1,
2 μl of enzyme and 2 μl of T4 Ligase Buffer (NEB) were added. Ligations were performed at
room temperature for 1 hour or overnight for greater efficiency. Chemically competent E. coli
(25 μl) were mixed with 5 µl of ligation mix or 50-500 ng of plasmid (for protein expression)
and incubated on ice for 30 min. Subsequently, the bacteria were heat shocked at 42ºC for 1.5
min and incubated on ice for further 2 min. 250 µl of room temperature SOC medium (or LB)
were added to the bacteria and they were incubated at 37ºC for 1 hour, with 200 rpm shaking
(Sanyo/Gallenkamp, Loughborough, UK). Bacteria were plated on LB-agar plates (containing
appropriate antibiotics) and incubated overnight at 37 ºC.
Positive colonies were screened by PCR or digestion with the appropriate restriction enzymes.
For further confirmation of ligation and sequence integrity, the plasmids were sent out to
Functional Genomics and Proteomics (School of Biosciences, University of Birmingham) for
sequencing.
Glycerol stocks of bacteria containing all constructs were produced by mixing saturated
bacterial cultures with an equal volume of 30 % (v/v) glycerol and stored at -80 ºC.
2.4.6 Plasmid preparation and purification
Large scale preparation of plasmids was performed from 200 ml cultures grown overnight
using the GenEluteTM Plasmid Maxiprep Kit (Sigma, Poole, UK) according to the
manufacturer’s instructions. For small-scale plasmid preparations DNA was isolated from 5 ml
cultures according to the GeneJETTM Plasmid Miniprep Kit (Fermentas, UK). DNA
concentration was measured using the NanoDrop ND-1000 Spectrophotometer (Labtech,
Ringmer, UK).

58
2.4.7 Cell lysis and RNA extraction
The medium was removed from the cells growing in 10 cm dishes and 1 ml of Tri Reagent
(Ambion) was added. The cells were lysed by pipetting up and down, the lysate was collected
in 1.5 ml tubes and frozen at -20ºC. To extract the RNA the samples were thawed, incubated
at 30ºC for 10 min and vortexed. After that, the solutions were centrifuged at 12000 rpm for 5
min, 200 μl of chloroform (per 1 ml of Tri Reagent) were added and the tubes were agitated.
Following a 10 min incubation at room temperature, the samples were centrifuged at 12000
rpm for 10min and the supernatant was transferred into a new tube containing 0.7 V of ice cold
isopropanol. This mixture was incubated at -20ºC for 30 min, centrifuged at 12000 rpm for 10
min, the pellet was washed with 70% ethanol and the final pellet was suspended in nuclease-
free water and quantified using NanoDrop ND-1000 Spectrophotometer (Labtech, Ringmer,
UK).
2.4.8 cDNA synthesis
cDNA synthesis was performed using the High Capacity cDNA Reverse Transcription kit
(Applied Biosystems) for qPCR or the Superscript III for RT-PCR kit for cloning. For the first
one, per reaction, 2 μl of 10x RT buffer, 0.8 μl of 25x dNTP mix, 2 μl of 10x random primer,
1 μl of multiscribe RT, 4.2 μl of RNase free water and 10 μl of RNA sample were added in a
tube. The reaction was carried out at 25ºC for 10 min followed by 2 hours at 37ºC. For the
latter, 1 μl of 0.5 μg/μl oligo(dT)12-18 primers, 1 μl of 10 mM dNTP mix, 5 μg of RNA and
water up to 13 μl were added to a nuclease-free tube. The mixture was heated at 65ºC for 5 min
and incubated on ice for 1 min. Then, 4 μl fo 5x first strand buffer, 1 μl of 0.1 M DTT, 1 μl of
RNase out (40 U/μl) and 1 μl of Superscript III RT (200 U/μl) were added and after
homogeneising, the reaction was incubated at 50ºC for 1 hour. Finally, the reaction was
inactivated by heating at 70ºC for 15 min.
59
2.4.9 Quantitative RT-PCR (qPCR)
To quantify relative gene expression, 12.5 μl of sensi mix (Abgene, Epsom, UK), 1 μl of each
primer (10 μM), 0.25 μl of each probe (Exiqon, Vedbaek, Denmark) and 0.25 μl of nuclease-
free water were mixed in a hood. On the lab bench, 10 μl of each sample dilution (1:10, 1:100)
were added to the previous mixture (in triplicates). The qPCR reaction was performed on
Rotor-Gene RG-3000 qPCR machine (Corbett Research Ltd, Australia).
2.4.10 Microarray
Unless otherwise stated, the reagents used to perform the microarray were purchased from
Agilent Technologies.
For the microarray three 10 cm plates of ECSCR siRNA transfected and three plates of negative
control duplex transfected HUVECs were used (after 48h of transfection). Total RNA was
extracted and purified. Cy3 dye was used for knock down samples and Cy5 dye for the controls.
To generate the microarray the Agilent Two Colour Microarray-Based Gene Expression
Analysis (Quick Amp Labelling) kit was used, following the manufacturer’s instructions. The
protocol comprises the following steps: cDNA synthesis, cRNA synthesis and labelling,
purification and quantification of the labelled/amplified cRNA, hybridization, washing,
reading, extracting data and data analysis.
In brief, a total of 1μg of each RNA sample was mixed with the T7 promoter primer, spike mix
(A for Cy3 or B for Cy5) and nuclease-free water. The samples were denatured and first strand
buffer, DTT, dNTP mix, MMLV-RT, RNase out and water were added for the cDNA synthesis
reaction. cRNA was synthesized and labelled by adding nuclease-free water, transcription
buffer, DTT, NTP mix, PEG, RNase out, inorganic pyrophosphatase, T7 RNA polymerase and
Cy3 or Cy5 to the previous reaction. Labelled and amplified cRNA was purified and washed

60
using RNeasy mini spin columns (Quiagen) and quantified on Nanodrop ND-1000 UV-VIS
Spectrophotometer version 3.2.1.
The microarray data were analysed using two different programs: SAM (statistical analysis of
microarrays) contained in a program called MeV (multiexperiment viewer) from Tigr – the
institute for genomics research (http://www.tm4.org/mev/) and R, a free statistical program
from Bioconductor (http://www.bioconductor.org). The workflow for both programmes is
equivalent and includes quality control, normalisation and differential expression analysis. The
final list of genes was obtained for a fold change above 2 and a p value below 0.01.
In order to put the results into context, the lists of up and downregulated genes were analysed
using Ingenuity Pathway Analysis (Quiagen) (www.ingenuity.com).
2.5 Methods employed for in vivo analyses
2.5.1 Species and strains
To study the function of ECSCR in vivo, two model species were used, Danio rerio (zebrafish,
vertebrate fish model) and Mus musculus (common mouse, mammalian model). The animals
were reared and bred at the Biomedical Services Unit, University of Birmingham.
Two strains of zebrafish were used, wild type AB* and transgenic tg[fli1:EGFP]. The mouse
strain used as background was black C57Bl/6JOlaHsd, the white strain used to obtain
blastocysts and do germline transmission testing was albino C57Bl/6 and the strain used
implant blastocysts injected with ES cells was CD-1.
2.5.2 Zebrafish and mouse whole mount in situ hybridization (WISH)
The in situ hybridization technique allows the detection of sites of expression of a certain gene.
For that purpose, a digoxigenin-labelled anti-sense RNA probe (complementary to the mRNA

61
to be detected) is synthesized and hybridized against paraffin sections or, in this case, whole
embryos to detect expression of the target gene (Thisse and Thisse, 2008).
For the WISH E9.5 C57Bl/6JOlaHsd mouse embryos and 24 hours post-fertilization (hpf) AB*
zebrafish embryos were used. The protocol was done according to Thisse and Thisse (2008).
2.5.2.1 Mouse RNA probe synthesis
SEND cells were cultured and RNA was extracted. cDNA was synthesized using the high
capacity cDNA reverse transcription kit. An 857 bp fragment was amplified by PCR and cloned
into PCR TOPO blunt (using 0.5 µl of salt solution, 0.5 µl of TOPO vector, 2 µl of DNA and
0 µl of nuclease-free water). The purified plasmid was linearised with NotI (for antisense RNA)
and BamH1 (for sense RNA). For the transcription of the sense and antisense RNA probes, by
this order, 1 µg of linear plasmid (10 µl), 2 µl of 10x transcription buffer (Roche), 2µl of 10x
digoxigenin label mix (Roche), 2 µl of 10x SP6 (for antisense probe) or T7 (for sense probe)
RNA polymerase, 1 µl of ribolock RNase inhibitor (Fermentas) and 3 µl of nuclease-free water,
to a total of 20 µl were added. The solutions were mixed and incubated at 37C for 2.5 hours. 1
µl of DNaseI was added and the tubes were incubated at 37ºC for 15 min. The probes were
then purified using the Mini Quick spin columns (Roche Applied Science), according to the
manufacturer’s instructions. The probes were quantified and 10 µl aliquots were stored at -
80oC. The probes were visualised on a 2% (w/v) agarose gel.
2.5.2.2 Whole-mount in situ hybridization
On the first day the embryos were rehydrated through a methanol series of 75%, 50% and 25%
(in DEPC-treated PBS), for 5min each and rinsed twice (5 min) in PBST (0.1% v/v of Tween
20 in DEPC-treated PBS). The embryos were then incubated with freshly made proteinase k
10 µg/ml (Sigma) for 30 min and the reaction was stopped with 2 mg/ml of glycine (Sigma) in
PBST for 5 min. After that the embryos were washed twice with PBST for 5 min, post-fixed
62
in 4% (w/v) PFA (in DEPC-treated PBS) and washed again with PBST. Subsequently, they
were incubated with 50% PBST/50% hybridization buffer for 3 min at room temperature and
with 100% hybridization buffer at 70ºC for 4 hours, with a change after 2 hours. The probes
were denatured at 95ºC for 5 min and diluted in the hybridization buffer to 500 ng/ml. The
embryos were incubated with this solution overnight at 70ºC.
On the following day the hybridization buffer was removed and the embryos were washed
through a series of hybridization buffer: 2xSSC (100:0, 75:25, 50:50, 25:75 and 0:100), 10 min
each. They were then washed with 0.2% SSC and another series of 0.2% SSC: MABT (75:25,
50:50, 25:75 and 0:100) for 5 min each. The embryos were blocked in 2% Boehringer blocking
agent, 5% goat serum (in MABT) at room temperature for 1 hour. After that time, another 2
hour incubation as described before took place, with fresh solution. The embryos were then
incubated overnight with gentle shaking at 4ºC with 1:5000 anti-digoxigenin antibody in the
same solution.
On the last day of the protocol the tubes containing the embryos were transferred to room
temperature for 1 hour. The antibody mix was removed and the embryos were were washed 8x
with MABT, 15 min each. After one quick wash with BCL buffer III, two 15 min washes
followed. Finally, colour was developed by using 400 µl of BM purple at room temperature
(the tubes were wrapped in foil). After two hours the embryos were checked for development
of colour. The reaction was stopped by washing with 20mM EDTA in PBST, the embryos were
post-fixed with 4% PFA and stored at 4ºC.
2.5.3 Injection of antisense zebrafish Ecscr morpholino oligonucleotides
Antisense morpholino zebrafish Ecscr oligonucleotides were microinjected into the yolk of 1-
cell transgenic tg[fli1:EGFP] zebrafish embryos. As controls, uninjected embryos and embryos
injected with mismatched morpholinos were used. The concentrations tested were 0.2, 0.4 and
63
0.8 ng of morpholino per embryo (1 nl of 0.25, 0.5 and 1 mM). The transgenic embryos were
observed, photographed and counted at 28 hpf. They were divided into three categories,
according to the severity of the effects caused by the morpholino injections, compared to the
controls: no abnormal phenotype, mild and severe. The percentages of embryos in each
category were calculated. This experiment was done three times and at least 100 embryos were
counted each time, for each condition.
2.5.3.1 Zebrafish Ecscr morpholino phenotype rescue assay
In order to assess the specificity of the morpholinos, a rescue assay was performed, by co-
injecting zebrafish Ecscr mRNA.
Zebrafish Ecscr was amplified by PCR from cDNA and cloned into the pCS2 vector, that
contains an RNA polymerase promoter, SP6. The plasmid was linearised with Not I (New
England Biosciences) and mRNA was synthesized with SP6 RNA polymerase using the
MmessageMmachine kit (Ambion). This mRNA was microinjected into one cell zebrafish
embryos alone (to optimise the right concentration to be used) or in combination with the
zebrafish Ecscr translation or splicing blocking morpholinos.
All animal work was carried out under approved Home Office projects and personal licenses.
The PhD student’s personal license number for both zebrafish and mice was PIL 40/9557 and
the two project licenses held by Prof. Roy Bicknell were PPL 40/3131 (“An analysis of tissue
development in zebrafish”) and PPL 80/2217 (“Validation of novel endothelial genes as
vascular targets”).
2.6 Statistical analyses
Unless otherwise stated, all experiments were repeated at least three times with similar results.
Data were plotted with error bars representing the standard deviation. A Shapiro-Wilk

64
normality test was performed on data sets to confirm a normal distribution. For this test, data
are normally distributed when p ≥ 0.05. P values were determined using GraphPad Prism 5 to
test for significant differences in data. Unpaired, two-tailed Student’s t-test was used to
determine the significance of experiments. When the calculated p value was less than 0.05, the
hypothesis that the means of the two compared groups differed significantly was accepted. On
chapter 4 (figures 4.7 and 4.8) a chi-squared test was performed, as the data sets are lists of
counts. Differences between conditions were also considered significant when p ≤ 0.05.

65
3 IDENTIFICATION OF
PROTEINS INTERACTING
WITH ECSCR
66
3.1 Introduction
Endothelial cell specific molecule 2 (ECSM2) was first identified in 2000 (Huminiecki and
Bicknell, 2000) but until 2008 there were no other publications concerning ECSCR. Armstrong
et al. (2008) used siRNA knockdown and implicated a role for ECSM2 in cell migration and
tube formation and identified a molecular interaction with filamin A. In the light of these
findings, ESCM2 was renamed by the Human Genome Organization (HUGO) Gene
Nomenclature Committee (HGNC) endothelial cell specific chemotaxis regulator (ECSCR). In
2009, two further independent studies were published. The first showed that ECSCR can
attenuate the epidermal growth factor receptor (EGFR)‐induced cell migration, possibly by
inhibition of the Shc‐Ras‐ERK (MAPKinase) pathway (Ma et al., 2009). The second identified
the role of ECSCR in cell survival by interaction with the cIAP-1 and cIAP-2 pro-apoptotic
proteins and modulation of their degradation by the proteasome (Ikeda et al., 2009). More
recently, a zebrafish developmental study by Verma et al. (2010) has proposed that ECSCR
enhances endothelial VEGF receptor 2 sensitivity to VEGF, thus in turn promoting migration
of zebrafish angioblasts.
The endothelial specificity of ECSCR and its effect on cell migration suggests a role in
endothelial cell biology. Although some possible interactions between ECSCR and other
molecules are starting to emerge, the exact mechanism of action and signalling pathways are
yet to be clarified.
3.2 Identification of binding partners for ECSCR
To capture and identify ECSCR interacting proteins/complexes a co-immunoprecipitation (co-
IP) analysis was performed. This used anti-ECSCRicd antiserum (rabbit serum was used as an
IgG control). Co-IPs were run on a gradient gel (4-12%), stained and processed for mass

67
spectrometry (MS) analysis. The results were analysed, proteins were ranked by number of
hits/differences between the ECSCR and negative control IPs and grouped by function, using
the DAVID software. Principal functional groups were cytoskeletal processes, trafficking,
protein folding, apoptosis and metabolism (figure 3.1 A). As ECSCR had been previously
implicated in cytoskeletal modulation, this cluster was analysed in more detail. (figure 3.1 B).
The analysis of the MS data has also revealed a good peptide diversity for each hit, i.e., each
protein was identified by several different peptides, which adds confidence to the results.
Identification of filamin A (with 34 peptides for the specific IP versus 5 for the control),
confirmed earlier work by Armstrong et al. (2008). Putative interacting proteins were chosen
for confirmation of the MS data by GST pull down (ECSCRicd-GST and GST alone, as a
control) and subsequent western blot – talin 1, vinculin, filamin A, moesin, myosin 9 (myosin
II) and plastin 3. Briefly, there are no apparent differences in myosin II, talin and vinculin, and
there seems to be more filamin A (as shown by the Armstrong et al., 2008), moesin and plastin
3 in the pull down with ECSCRicd-GST than with GST alone (figure 3.2).
Filamin A, moesin and plastin 3 were chosen for further studies, as the two latter ones are
present in filopodia, which is where ECSCR is enriched. Filamin A and moesin were analysed
for direct interactions with ECSCRicd by yeast-two-hybrid. Bioinformatics analysis of the
ECSCR protein primary structure using the tools available at www.expasy.com, such as
SMART, revealed no conserved domains or structural features similar to other proteins
contained in public databases. However, ECSCRicd contains a cluster of basic amino acids
RK(S)K, immediately after the transmembrane domain, which has been shown to interact with
ezrin-radixin-moesin (ERM) family of proteins in other proteins (Yonemura et al., 1998). As
for filamin A, the interaction with ECSCRicd had already been found by others

68
Figure 3.1 - Proteins that co-immunoprecipitate with ECSCR from HUVECs lysate.
The list of proteins that co-IP with ECSRicd was submitted to DAVID, to obtain functional
clusters (A). The cytoskeletal fraction was chosen for study in further detail (B). IP – number
of peptides obtained for each protein upon immunoprecipitation using an antibody against
ECSCR icd; IgG – number of peptides obtained for each protein upon immunoprecipitation
using rabbit serum. The lines in green show proteins present in filopodia.

69
(Armstrong et al., 2008), so the aim was to confirm these results and try to map the interaction
to the ECSCRicd.
The ultimate goal, after finding direct interactions with specific regions, would be to mutate
them and to show that the proteins no longer interacted, as well as using those mutants in
functional assays (like the Boyden chamber, for example, since it was demonstrated by
Armstrong et al. (2008) that the lack of ECSCR significantly reduces HUVECs migration
through a pore).
For the yeast-two-hybrid assay, the complete intracellular domain of ECSCR was amplified by
PCR and inserted into the pGBT9 plasmid using EcoRI and BamHI restriction enzymes. The
candidate interactors, full length moesin and two fragments of filamin A corresponding to Ig
repeats 15-16 and 19-21 (Armstrong et al., 2008) were inserted into pACT2, using BamHI and
EcoRI restriction enzymes. Ezrin full length was also cloned in the same way and was used as
a negative control, as it is very closely related to moesin (both part of the ERM family) but did
not appear in the MS results. Combinations of ECSCRicd and the potential interactors were
transfected into yeast (as well as combinations of ECSCRicd and empty pACT2 as a control).
The two plasmids encode for an activating domain and a binding domain of Gal4p which, upon
binding of the fused interacting proteins, come together to activate a reporter gene (HIS3). For
more details see section 2.3.9.

70
Figure 3.2 - Assessment of the results of mass spectrometry by GST pull down and
western blot analysis
GST pull down was control for ECSCRicd-GST. There were proteins that showed no
difference between the test and the control (A) and others that were specifically pulled down
with ECSCRicd-GST (B). This experiment was performed 3 times with similar findings. GST
– glutathione-S-transferase; ECSCRicd-GST – ECSCR intracellular domain fused to GST.

71
After seeding the double transformants in the appropriate selective media, all contained both
plasmids (as they grew on SCD Trp- Leu-) (Figure 3.3). However, only the colonies containing
ECSCRicd and either fragment of filamin A grew on the medium that selected for interactions
(SCD His- (3AT) Trp- Leu-) (figure 3.3). This confirmed that Filamin A and ECSCRicd directly
interact. To look further into this result, yeast containing ECSCRicd and moesin, ezrin (and
pACT2 as a control) were grown and total protein was extracted and analysed by western blot.
This revealed that neither moesin nor ezrin were expressed by the yeast. Therefore, other
methods were employed to test for this interaction, as described below.
After confirmation of binding between ECSCRicd and filamin A, an attempt was made to map
the region of ECSCRicd responsible for it. Since there are no conserved domains, two halves
of ECSCR (the first 30 amino acids and the second 30 amino acids) were amplified by PCR
and inserted into pGBT9 using EcoRI and BamHI restriction enzymes. These constructs were
then co-transfected into yeast with the pACT2 plasmids containing either fragment of filamin
A. The yeast-two-hybrid assay revealed that neither of the two halves of ECSCRicd was able
to bind either of the filamin A fragments (figure 3.4). This study was abandoned because this
technique didn’t seem to be the most appropriate to determine the region of filamin A where
ECSCR binds. Making a construct where ECSCR becomes much smaller than the protein it is
fused to may result in occlusion of the amino acids that bind to filamin A, leading to a false
result. On the other hand, since neither half of ECSCR seems to bind to Filamin A, the next
step would be to test a region in the junction between the two. This could also lead to false
results, as often proteins need to be in a certain conformation to be able to interact with other
molecules. Therefore, it cannot be ruled out that instead of the middle region, actually both
halves of ECSCR are important for binding to filamin A, as they may interact with each other
via distant amino acids to confer a certain secondary structure necessary for interaction. An

72
alternative but time consuming method would be to mutate individual amino acids and evaluate
the effect upon binding. The fact that ECSCR bares no homology to any other protein makes
this study more difficult, as there is no obvious candidate region to start with.

73
Figure 3.3 - Yeast-two-hybrid assay to assess protein interactions between ECSCRicd
and filamin A
A yeast-two-hybrid assay was performed using ECSCR intracellular domain to look for
interactions with filamin A fragments corresponding to repeats 15-16 (FLNA 1) and 19-21
(FLNA 2), as well as moesin and ezrin. The assay confirmed direct interaction between
ECSCRicd and filamin A, but not moesin or ezrin. SCD – synthetic complete dextrose; Trp- -
lacks tryptophan; Leu- - lacks leucine; His- - lacks histidine; 3AT – 3-amino-1,2,4-triazole.

74
Figure 3.4 - Yeast-two-hybrid assay to assess protein interactions between the two
halves of ECSCRicd and filamin A
To further investigate the interaction between ECSCR and filamin A, a yeast-two-hybrid assay
was performed using either the first 30 amino acids (ECSCRicd1) or the last 30 amino acids
(ECSCRicd2) of ECSCR intracellular domain to look for interactions with filamin A fragments
corresponding to repeats 15-16 (FLNA 1) and 19-21 (FLNA 2). The assay showed that either
half of ECSCRicd is insufficient to bind to either fragments of filamin A. SCD – synthetic
complete dextrose; Trp- - lacks tryptophan; Leu- - lacks leucine; His- - lacks histidine; 3AT –
3-amino-1,2,4-triazole.

75
To obtain a more conclusive answer about the ECSCRicd-moesin interaction, a luciferase
complementation assay was performed. This assay is similar to the yeast-two-hybrid, in the
sense that the two potential interactors are fused to two halves of a protein that becomes
functional upon binding. In this case, luciferase is an enzyme that is able to degrade a substrate
and the interaction is measured by a luminometer, as the degradation product is bioluminescent.
The method was developed by Remy and Michnick (2006), who kindly provided the Zipper-
hGLuc[1]93 and Zipper-hGLuc[2]93 plasmids, which were used as a positive control. Moesin
and ECSCRicd were amplified by PCR and inserted into these plasmids using the NotI and
ClaI restriction enzymes, which resulted in the replacement of the zipper protein by these two.
Instead of yeast, for this method mammalian cells (HEK 293T) were tansfected with the
appropriate combinations of plasmids (and also each one plus either Zipper-hGLuc[1]93 or
Zipper-hGLuc[2]93 to assess specificity). In addition, all cells were transfected with a third
plasmid, encoding beta-galactosidase, to normalise the trasnfection efficiency.
The results indicate a positive interaction between ECSCRicd and moesin (p < 0.05) (figure
3.5). However, marginal significance was obtained only after five repeats, as there is a big
variation between replicates and the negative controls containing moesin fused to the first half
of luciferase co-transfected with the second half of luciferase fused to a zipper protein (which
should not interact with either ECSCR or moesin) produce high levels of background, having
luminescence reads close to those of the ECSCR-moesin interaction. The same result was
observed for the other negative control, where ECSCR intracellular domain is fused to the
second half of luciferase co-transfected with the first half of luciferase fused to a zipper protein.
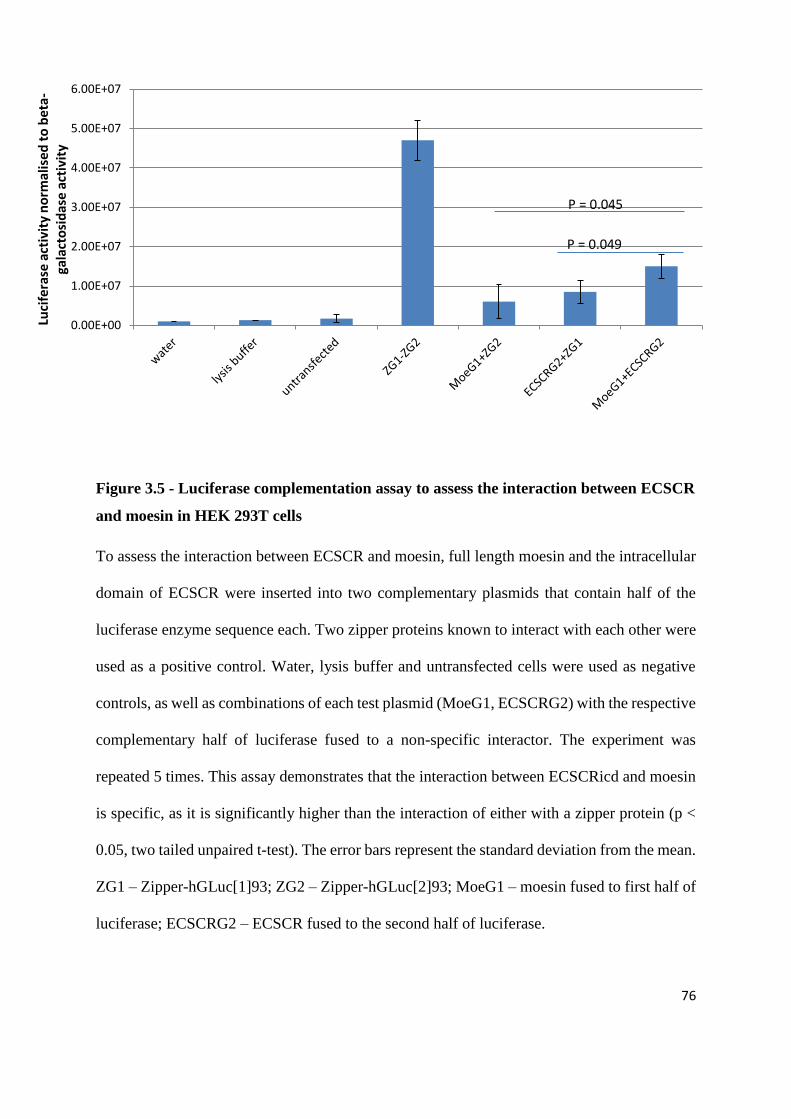
76
Figure 3.5 - Luciferase complementation assay to assess the interaction between ECSCR
and moesin in HEK 293T cells
To assess the interaction between ECSCR and moesin, full length moesin and the intracellular
domain of ECSCR were inserted into two complementary plasmids that contain half of the
luciferase enzyme sequence each. Two zipper proteins known to interact with each other were
used as a positive control. Water, lysis buffer and untransfected cells were used as negative
controls, as well as combinations of each test plasmid (MoeG1, ECSCRG2) with the respective
complementary half of luciferase fused to a non-specific interactor. The experiment was
repeated 5 times. This assay demonstrates that the interaction between ECSCRicd and moesin
is specific, as it is significantly higher than the interaction of either with a zipper protein (p <
0.05, two tailed unpaired t-test). The error bars represent the standard deviation from the mean.
ZG1 – Zipper-hGLuc[1]93; ZG2 – Zipper-hGLuc[2]93; MoeG1 – moesin fused to first half of
luciferase; ECSCRG2 – ECSCR fused to the second half of luciferase.
0.00E+00
1.00E+07
2.00E+07
3.00E+07
4.00E+07
5.00E+07
6.00E+07
Luci
fera
se a
ctiv
ity
no
rmal
ised
to
bet
a-
gala
cto
sid
ase
acti
vity
P = 0.045
P = 0.049

77
3.3 The effect of ECSCR on the cytoskeletal arrangement
It has been shown that the knockdown of ECSCR by siRNA in HUVECs causes impaired tube
formation and migration in a Boyden chamber assay and that ECSCR probably modulates the
cytoskeleton organization via filamin A (Armstrong et al., 2008).
In the present study the interaction with filamin A has been confirmed and other cytoskeletal
proteins involved in filopodia formation have been co-immunoprecipitated with endogenous
full length ECSCR, as well as pulled down by its intracellular domain.
To further investigate the role of ECSCR at a cellular level, siRNA knockdown was performed
in HUVECs and cytoskeletal proteins such as plastin 3, talin1, VE-cadherin, F-actin
(phalloidin), moesin, filamin A and non-muscle myosin II were visualised using
immunofluorescence (figure 3.6). These proteins were chosen because they have been
specifically co-immunoprecipitated with ECSCR (figure 3.1). Additionally, VE-cadherin was
stained because ECSCR also localises to cell-cell junctions (Shi et al., 2011). The aim was to
evaluate if the lack of this protein would somehow disrupt cell-cell adhesion. Phalloidin was
used to stain stress fibres (F-actin) because Ma et al. (2009) have reported that in HEK 293T
cells transfected with ECSCR-GFP stress fibres were largely destructed compared to the GFP
control. Phalloidin was used in cells treated with ECSCR siRNA (and negative control duplex
control) to assess if ECSCR knockdown would result in an increase of stress fibres.
Plastin 3 locates to cell protrusions and seems to be less evident in cells where ECSCR is
depleted. Talin 1 locates near the cell edges in adhesion points, which seem to be lost when
ECSCR is absent. VE-cadherin locates to cell-cell junctions and ECSCR knockdown does not
seem to have an effect on this protein. When ECSCR is knocked down, stress fibres seem to
be less organised (F-actin). Moesin is located at cell protrusions and seems to have a more
diffused distribution when ECSCR is knocked down. Both filamin A and myosin II are

78
arranged in fibre-like structures along the cells, which seem disorganised in the absence of
ECSCR. In general, the lack of ECSCR seems to result in a less organised cytoskeleton in terms
of protrusions and fibre-like structures, that seem to be disconnected from the membrane. This
is consistent with a role for ECSCR in anchoring the cytoskeleton to the membrane. Although
the immunofluorescence protocol was optimised for each antibody and the experiment was
done 3 times, some antibodies still did not produce a very good staining. Some further
optimisation could be attempted or different antibodies could be purchased to generate results
that are clearer.
On the other hand, the opposite experiment was performed, where ECSCR-GFP was
overexpressed in cells that do and do not contain filamin A. ECSCR is located at the plasma
membrane and filopodia in HEK 293T cells. The construct was able to induce the formation of
filopodia in HEK 293T cells (that contain filamin A), but not in and M2 cells (that do not
express filamin A) (figure 3.7). The experiment was done 3 times for HEK 293T cells and only
once for M2 cells. In the latter ECSCR also seems to locate at the plasma membrane. However,
these cells seem to be blebbing (even the GFP control). The experiment should be repeated to
obtain reproducible results.

79
Figure 3.6 (part 1) – Immunofluorescent staining of cytoskeletal proteins upon ECSCR
siRNA knockdown
siRNA knockdown was performed in HUVECs and cytoskeletal proteins such as plastin 3, talin1, VE-
cadherin and F-actin (phalloidin) were visualised using immunofluorescence (green). DAPI was used
to stain the nuclei (blue). Plastin 3 locates to cell protrusions and seems to be less evident in cells where
ECSCR is depleted. Talin 1 locates near the cell edges in adhesion points, which seem to be lost when
ECSCR is absent. VE-cadherin locates to cell-cell junctions and ECSCR knockdown does not seem to
have an effect on this protein. When ECSCR is knocked down, stress fibres seem to be less organised
(F-actin).
Negative control duplex ECSCR duplex 1
Plastin 3
Talin 1
VE-cadherin
Phalloidin
(F-actin)

80
Figure 3.6 (part 2) – Immunofluorescent staining of cytoskeletal proteins upon ECSCR
siRNA knockdown
siRNA knockdown was performed in HUVECs and cytoskeletal proteins such as moesin,
filamin A and myosin II were visualised using immunofluorescence (green). DAPI was used
to stain the nuclei (blue). Moesin is located at cell protrusions and seems to have a more
diffused distribution when ECSCR is knocked down. Both filamin A and myosin II are
organised in fibre-like structures along the cells, which seem disorganised in the absence of
ECSCR.
Negative control duplex ECSCR duplex 1
Moesin
Filamin A
Myosin II

81
Figure 3.7 – ECSCR overexpression in HEK 293T and M2 cells
ECSCR-GFP was transfected into HEK 293T and M2 cells (B, C, E, F). GFP was used as a
control (A, D). C and F are magnifications of B and E, respectively. The white arrows point at
the location of ECSCR. ECSCR is able to induce filopodia in HEK 293T cells, but not in M2
cells. The experiment was repeated 3 times with similar results for HEK 293T cells and once
for M2 cells. Total magnification: 400x.
A B C
D E F

82
3.4 siRNA duplex titration and transfection stability assessment
In order to study the role of ECSCR, siRNA-mediated knock down can be performed to
evaluate the loss of function of this molecule in various assays.
The siRNA duplex 1 (D1) had already been used by Armstrong et al. (2008), at a concentration
of 50 nM, but no titration had been done to assess the minimum concentration that could be
used. For that purpose, HUVECs were transfected with 1, 10, 30 and 50 nM of D1 (mock
transfection was used as a control) and the ECSCR mRNA and protein were quantified by
qPCR and western blot, respectively (figures 3.8 and 3.9). ECSCR has a molecular weight of
55 kDa. From the two figures it is possible to verify that all the concentrations of D1 tested had
a significant effect on knocking down ECSCR.

83
Figure 3.8 - Relative ECSCR expression of siRNA transfected HUVECs assessed by
qPCR.
In order to assess the minimum concentration of siRNA duplex (D1) that could be used to
knock ECSCR down, HUVECs were treated with 1, 10, 30 and 50 nM of D1. Mock-treated
cells were used as a control. RNA was collected, converted to cDNA and amplified by qPCR.
ECSCR expression was normalised to that of actin for each sample and ECSCR relative
expression in the treated cells is presented relative to that of the mock control. The experiment
was done 3 times and qPCR for each sample was performed in triplicate. All concentrations
tested were able to produce an ECSCR knock down. A two-tailed unpaired t-test was performed
between each treated sample and the control and all p-values were <0.005.

84
Figure 3.9 - Relative ECSCR expression of siRNA tranfected HUVECs assessed by
western blot
In order to assess the minimum concentration of siRNA duplex (D1) that could be used to
knock ECSCR down, HUVECs were treated with 1, 10, 30 and 50 nM of D1. Mock-treated
cells were used as a control. Total protein was collected, ran on a 12% acrylamide gel,
transferred onto a PVDF membrane and blotted for ECSCR and tubulin, as a control. The
experiment was done 3 times. As for the mRNA levels, all D1 concentrations have successfully
knocked down the ECSCR protein.

85
3.5 Microarray
In addition to finding molecules that interact directly with ECSCR, in order to have an insight
on its role on endothelial cell biology, a microarray was performed using cells transfected with
ECSCR siRNA and cells transfected with an unspecific duplex. The RNA quality was analysed
using Bioanalyser (Agilent Technologies) and all the samples had a RIN (RNA Integrity
Number) above 9.4. The maximum value on this scale is 10 and the closer to this number the
RIN of a sample is the better. Samples with RIN values below 6 or 7 should not be considered.
After labelling, the specific activity was above 13 in all samples. This value should be between
10 and 14.
The slides were scanned and the data were extracted. The microarray data were analysed using
two different programs: SAM (statistical analysis of microarrays) contained within the MeV
(multiexperiment viewer) from Tigr (the institute for genomics research) and R, a free
statistical program from Bioconductor. The lists of up and downregulated genes obtained from
both programs were very similar, and the one produced by R had the advantage of containing
information about the fold change. All the genes considered had a fold change equal to or
greater than 2. 342 genes were found to be upregulated and 354 downregulated. The most
upregulated gene was CCL20 (a chemokine involved in attracting lymphocytes and dendritic
cells towards endothelial cells) and the most downregulated gene was CYP26B1 (a member of
the cytochrome P450 family of metabolism enzymes, responsible for inactivating all-trans
retinoic acid to hydroxylated forms). The full lists of up and downregulated genes can be found
on appendix 1.
From these lists, 15 random genes (8 upregulated and 7 downregulated) were chosen to validate
the microarray by qPCR. The six original samples (RNA from three controls and three ECSCR
knocked down HUVECs) plus six new ones (also RNA from D1 and negative control duplex-

86
treated HUVECs) were analysed by qPCR (in triplicate). Gene expression was normalised to
that of actin for each sample and a fold change between the samples treated with ECSCR-
targeting duplex and negative control duplex was calculated using the delta delta CT method
(Livak and Schmittgen, 2001). Although the fold change value is different from that obtained
from the microarray analysis, all genes show the same trend as they do in the microarray results
(figure 3.10). CD 36 was not detected in any samples by qPCR.
The two lists of genes were analysed separately in a program that creates clusters of genes
according to their common structural features or role in a certain pathway or process. This
program is called DAVID (Database for Annotation, Visualization and Integrated Discovery)
(Dennis et al., 2003). 123 upregulated and 90 downregulated clusters were identified. Most of
the genes, both up- and downregulated, fell into the categories of adhesion molecules,
glycoproteins, cytoskeleton-related, chemotaxis and apoptosis (figure 3.11). Figure 3.11 does
not show the category “glycoproteins” because this is a structural feature common to many
unrelated proteins, rather than a more specific grouping according to function.
Within each general cluster several others could be found. For example, upregulated genes
involved in adhesion are specifically involved in cell-cell adhesion, whereas downregulated
gens in this category are involved in both cell-cell adhesion and cadherin-mediated adhesion
(figure 3.11). Upregulated cytoskeletal genes are involved in actin processes and cell
projection, whereas downregulated genes interact with actin mostly via a kelch domain (β-
propeller tertiary structure) or are associated with microtubules. Regarding chemotaxis, the
absence of ECSCR seems to increase inflammation and decrease locomotive behaviour.
Negative regulators of apoptosis are upregulated, whereas positive modulators of apoptosis
seem to be both up and downregulated, in cells treated with ECSCR-targeting siRNA duplex
compared to cells expressing normal levels of this protein.

87
Figure 3.10 – Gene expression validation by qPCR of 15 random genes differentially
expressed in the microarray
To validate the results obtained from the microarray analysis, the same 3 samples and 3 new
ones of RNA from HUVECs treated with ECSCR-targeting siRNA duplex or a negative control
duplex were analysed by qPCR. Fold change between gene expression in controls and ECSCR
knocked down cells was calculated using the delta delta CT method. The results largely validate
the microarray, as all show the same trend. CD36 was not detected in any sample. The error
bars represent the standard deviation from the mean. A two-tailed unpaired t-test was
performed to assess significant differences between gene expression of HUVECs treated with
D1 and negative control duplex. * - p < 0.05 two tailed unpaired t-test.

88
Figure 3.11 – Main functional clusters of up and downregulated genes when ECSCR is
knocked down
The lists of up- and downregulated genes found using R were submitted to DAVID so that
genes could be grouped by function. The main clusters were adhesion, cytoskeleton,
chemotaxis and apoptosis. Purple arrows pointing up refer to clusters containing upregulated
genes; green arrows pointing down refer to clusters containing downregulated genes. Examples
of genes contained in each cluster were included in brackets.
89
To have an idea of what pathways may be altered when ECSCR is depleted, the results from R
(gene accession number, log ratio, fold change and p-value) were also analysed on the
Ingenuity Pathway Analysis program (Quiagen). A cut off of 2 fold (either up or
downregulated) and p < 0.01 were selected. This software clusters genes according to how they
relate to each other in specific interaction networks. Figure 3.12 illustrates the initial outputs
once the data are analysed. The different pathways are represented by blue bars, identified on
the x axis and are ordered by the proportion of genes in a certain pathway that were contained
in the supplied results list (from R) compared to the total number of genes in that pathway
(figure 3.12 A). The whole data sets can be viewed in different formats, such as a network
connecting the different pathways (figure 3.12B).
By clicking on each blue bar, the up and donwregulated genes from the list obtained from R
that are on a specific pathway can be seen. Furthermore, the pathway itself can also be
visualised. Figures 3.13 and 3.14 illustrate two of those pathways: granulocyte adhesion and
diapedesis and atherosclerosis. Genes represented in grey are part of the pathway, but were not
on the list of significantly differentially expressed genes between HEVECs treated with
negative control duplex and ECSCR-targeting siRNA duplex. Green represents
downregulation and red represents upregulation. Stronger or weaker shades of these colours
represent higher or lower fold change, respectively.
Although very informative, the actual interpretation of the pathways provided is difficult, as
some molecules in the same pathway are downregulated and others that are affected by those
are upregulated. Also, many of the molecules are expressed (or more described) in other cell
types. However, only HUVECs were used for this experiment, so not much can be concluded
about other cells.

90
Figure 3.12 – Examples of Ingenuity Pathway Analysis initial outputs
The lists of up and downregulated genes found using R were submitted to Ingenuity Pathway
Analysis to look for altered pathways when ECSCR is depleted. The initial outputs once the
data are analysed are illustrated. The different pathways are represented by blue bars, identified
on the x axis and are ordered by the proportion of genes in a certain pathway that were
contained in the supplied results list compared to the total number of genes in that pathway
(A). The whole data sets can be viewed in different formats, such as a network connecting the
different pathways (B).
B
A

91
A
A

92
Figure 3.13 – Granulocyte adhesion and diapedesis pathway (this page and previous
page)
Granulocyte adhesion and diapedesis was the pathway with the highest proportion of submitted genes
compared to the total amount of genes in the pathway. Genes represented in grey are part of the pathway,
but were not on the list of significantly differentially expressed genes between HEVECs treated with
negative control duplex and ECSCR-targeting siRNA duplex. Green represents downregulation and red
represents upregulation. Stronger or weaker shades of these colours represent higher or lower fold
change, respectively.
A
A A
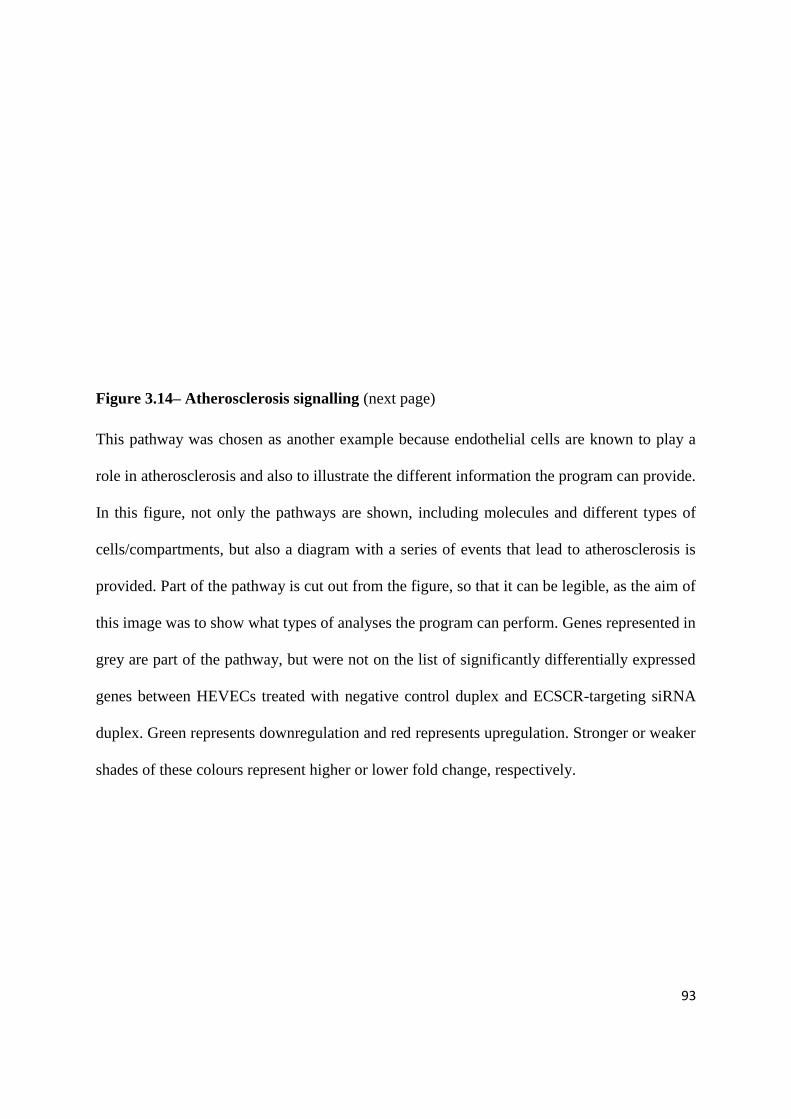
93
Figure 3.14– Atherosclerosis signalling (next page)
This pathway was chosen as another example because endothelial cells are known to play a
role in atherosclerosis and also to illustrate the different information the program can provide.
In this figure, not only the pathways are shown, including molecules and different types of
cells/compartments, but also a diagram with a series of events that lead to atherosclerosis is
provided. Part of the pathway is cut out from the figure, so that it can be legible, as the aim of
this image was to show what types of analyses the program can perform. Genes represented in
grey are part of the pathway, but were not on the list of significantly differentially expressed
genes between HEVECs treated with negative control duplex and ECSCR-targeting siRNA
duplex. Green represents downregulation and red represents upregulation. Stronger or weaker
shades of these colours represent higher or lower fold change, respectively.
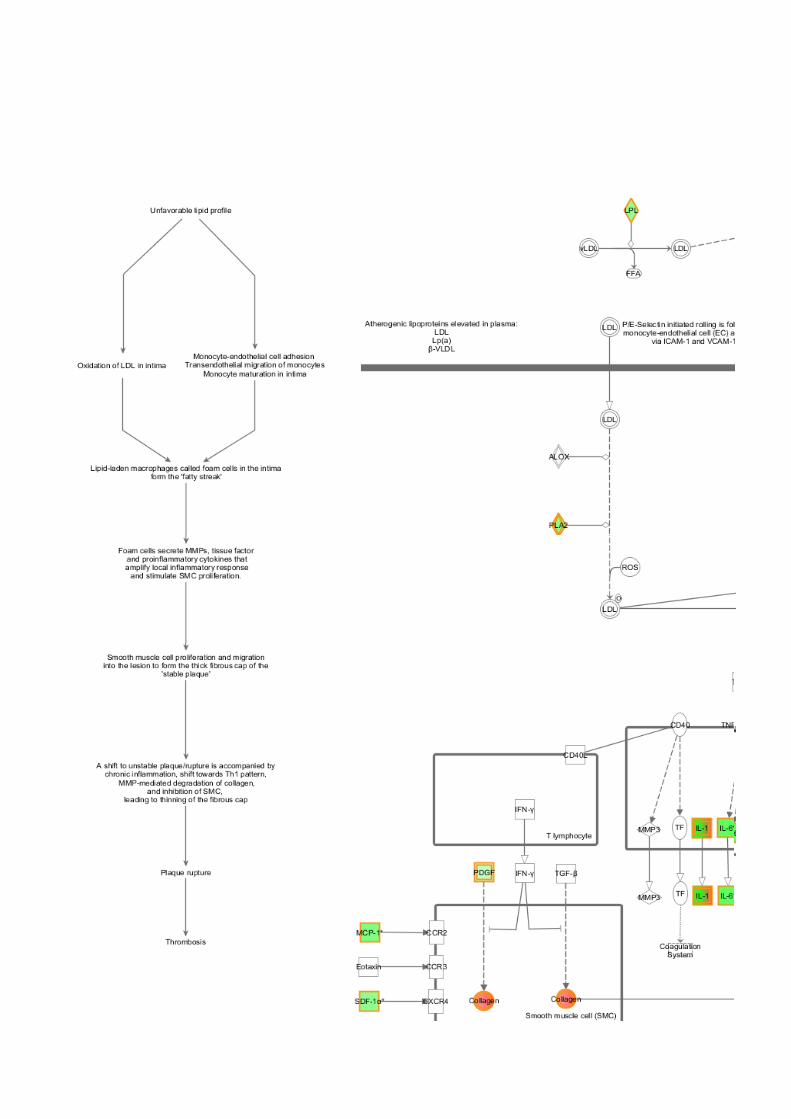
94
A

95
Additionally to this work, a monoclonal antibody produced against ECSCR by Phusion
Antibodies (Belfast) was used to detect ECSCR in normal and cancer human tissues and in
angiogenesis assays. The results are presented as appendix 2, as only in the end it was
discovered that the antibody does not recognise ECSCR after all and this work cannot be
published. However, it represented many months of work towards this thesis. The antibody has
blocks endothelial cell migration on a scratch wound assay and tube formation on matrigel. In
situ hybridization on human paraffin-embedded normal and cancer specimens done by Bicknell
and Nagy (University of Birmingham, UK) seemed to show that ECSCR was upregulated in
some cancers. Based on this, the antibody was used to stain tissue arrays containing human
normal and cancer samples. This antibody recognises the naked protein, but not endogenous
endothelial glycosylated ECSCR on a western blot. The final proof was provided by FACS
analysis, where the antibody induced a shift in the population compared to that not treated with
antibody, but there was no difference between HUVECS expressing ECSCR and not
expressing ECSCR (knocked down by siRNA). In conclusion, this antibody recognises
endothelium specifically and has biological effects on angiogenesis assays. However, its target
is unknown.

96
3.6 Discussion
3.6.1 Finding binding partners for ECSCR
Previously to the present study, Laura Armstrong (2005), a PhD student in the same laboratory,
had isolated, cloned and characterised full length ECSCR cDNA, as the only available
sequence at the time was derived from alignment of EST sequences. Then, she verified the
endothelial specificity by detecting the transcript in several cell lines by qPCR, as well as
human tissue paraffin sections, by in situ hybridization. A range of endothelial cell stimuli were
tested, alone or in combination, to identify which ones regulated ECSCR expression. Hypoxia
(0.1% oxygen), oxidative stress (1 mM H2O2), confluence (250,000 cells seeded on each plate
and harvested at different times), VEGF (10 ng/ml), FGF (10 ng/ml), VEGF + FGF (10 ng/ml
each), IFN-gamma (100 units/ml), TNF-alpha (100 ng/ml), IFN-gamma + TNF-alpha (100
units/ml and100 ng/ml, respectively) and IL1-beta (10 ng/ml). The conditions were tested at 4,
8, 16 and 24h. None has had a significant effect on ECSCR expression. Much effort was also
dedicated to producing an antibody that would recognise ECSCR, which was largely
unsuccessful. Filamin A was identified as a binding partner for the intracellular domain of
ECSCR using yeast-two-hybrid on an endothelial cell library.
Ikeda et al. (2009) reported that cIAP-1 and cIAP-2 also interacted with this domain. So far,
no other interacting molecules for the intracellular domain have been described and no attempt
made to find interacting partners or even a ligand for the extracellular domain. That is a crucial
step to understand the mechanism by which ECSCR signals.
Protein co-immunoprecipitation using a polyclonal antibody against ECSCR and subsequent
analysis of the samples by mass spectrometry (MS) showed that ECSCR potentially interacted
with proteins involved in cytoskeletal processes (actin bundling and anchorage of cytoskeletal
proteins to the plasma membrane), trafficking (endosomes), protein folding, apoptosis

97
(ubiquitin and ubiquitin-related proteins) and metabolism (glycolytic proteins) (figure 3.1). The
protein with most specific hits in the co-immunoprecipitation with ECSCR versus IgG control
was Filamin A, which is in line with the work by Armstrong et al. (2008). Curiously, filamin
A is ubiquitous whereas filamin B expression is more restricted to endothelial cells. Filamin B,
but not filamin A knockdown by siRNA has impaired VEGF-induced cell migration of
HUVECs through the increase of the number of focal adhesions. This seemed to be achieved
by changes in activity and location of Rac-1, a small GTP-binding protein, with consequences
on downstream signalling. This indicated a possible pathway involving filamin B, Rac-1 and
Vav-2 (an activating guanine nucleotide exchange factor for Cdc42/Rac-activated kinase
kinase (PAK)-4/5/6) (Valle-Perez et al., 2010). The fact that filamin B is somehow more
specific to endothelium than filamin A and this isoform but not filamin A is involved in VEGF-
induced cell migration, indicates they have different roles and participate in distinct signalling
pathways. This is reinforced by the current data, where filamin A strongly associates with
ECSCR and, although very structurally similar, no filamin B was co-immunoprecipitated.
The co-immunoprecipitation results were subsequently confirmed by GST-pull down, where
moesin, filamin A and plastin 3 were pulled specifically with ECSCR, whereas talin-1, vinculin
and myosin II were not (figure 3.2). The GST pull down is considered to be a more stringent
method than immunoprecipitation. The latter can yield entire complexes of proteins that bind
to the target of the antibody, whereas the former relies on more specific affinity, as the fusion
protein is competing with the endogenous one for potential interacting partners. This explains
why there were more proteins associated with ECSCR using co-immunoprecipitation
compared to GST-pull down. These two techniques are complementary, as
immunoprecipitation can give a broader insight into signalling complexes, as it is able to
capture them to the beads, conserving true endogenous interactions. GST-pull down is then a
98
refinement, capturing proteins that interact with ECSCR more directly. By combining these
two techniques it is possible to start building networks, where Filamin A, moesin and plastin 3
are more directly associated with ECSCR (not necessarily in the same pathway) and other
molecules, such as talin-1 or myosin II may still be part of the same pathways, but are separated
by several other proteins.
The current study differs from that performed by Armstrong (2005) in the number of candidate
interactors found. This is because distinct methods were applied. In this study, co-
immunoprecipitation was followed by GST-pull down and yeast-two-hybrid, which first give
a general view of what proteins may be involved (directly and indirectly) with ECSCR
signalling and then direct interactions can be confirmed to establish the role and position of
ECSCR within the network. Laura has used BD matchmaker two hybrid system (Clontech,
UK) to look for ECSCR interacting proteins. The 58 amino acids of ECSCR intracellular
domain were expressed as bait, in pGBKT7 and a placental cDNA library was inserted into
pGADT7. Placental polyA+ RNA was used to make cDNA. Colonies that contained several
inserts were excluded, as well as unlikely partners for the intracellular domain, such as secreted
proteins. Colonies containing only one insert were selected to re-confirm interactions that were
consistently reproducible and most expressed filamin A. PIAS1 (protein inhibitor of activated
STAT1), a nuclear protein, was also identified. There is a possibility that ECSCR is cleaved
and translocated into the nucleus in a similar manner to Notch, a membrane-bound transcription
factor (Kopan, 2002) or PIAS1 can translocate into the cytoplasm. However, this protein was
not further analysed. In the present study this protein was not found in ECSCR
immunoprecipitation. Although a library holds potential to find interactors for Ecscr, Laura has
encountered various technical difficulties related to several constructs being present in the same
colony, false positives and low reproducibility. As discussed below, yeast may not be able to

99
express some human proteins at all or with the correct post-translation modifications that are
essential for signalling or binding. Also, it is a more artificial system than using actual
endothelial cells and trying to capture endogenous interactions using an antibody. The latter
method captures endothelial molecules produced in endothelial cells, bound to each other in a
way that is closest to what may be physiological than any other method using yeast or non-
endothelial cells.
ECSCR shows no structure homology to any known protein. However, its intracellular domain
contains a cluster of basic amino acids, that was shown to be critical for the binding of other
proteins to moesin (Martin-Villar et al., 2010). In the light of these findings and given that
ECSCR selectively pulled down moesin, this protein was chosen to proceed to more
specifically test a possible direct interaction. As yeast-two-hybrid failed to answer this question
(the yeast did not express moesin), a luciferase complementation assay was performed (figures
3.3 and 3.5). The two methods are similar in the sense that the two candidates for interaction
are each fused to one half of a reporter protein that is only expressed if an interaction occurs.
However, yeast-two-hybrid uses yeast, whereas the luciferase complementation assay uses
mammalian cells. Yeast are not able to reproduce many post-translational modifications
present in mammalian cells, which may be important for interactions (Luo et al., 1997). Also,
due to toxicity or other species incompatibilities, yeast may not be able to produce the protein
of interest at all, which was the case for moesin. The luciferase complementation assay has
successfully demonstrated an interaction between ECSCR intracellular domain and moesin.
However, minimal significance (p < 0.05) was only obtained after 5 replicates. Negative
controls were included where either moesin or ECSCR were co-expressed with a zipper protein
fused to the complementary luciferase half for each case. No interaction between the zipper
protein and moesin or ECSCR was expected to happen. However, the luminescence values for

100
these controls, although lower than those for the specific interaction between moesin and
ECSCR, were quite high. HEK 293T cells are a popular cell line to use for protein expression,
as they can produce most post-translational mammalian modifications and yield high amounts
of protein expression (Thomas and Smart, 2005). In the case of the luciferase complementation
assay, however, this may not be an advantage. Too much protein being overexpressed may
mean that non-specific interactions start to occur due to excessive amounts of protein, rather
than real interactions. To obtain cleaner results, perhaps HeLa cells could be used instead of
HEK 293T.
The interaction between ECSCR and filamin A found by Armstrong (2005) was also confirmed
in this study using yeast-two-hybrid (figure 3.3). The two regions from filamin A (repeats 15-
16 and 19-21) have been shown to bind many other proteins (Zhou et al., 2009). These are
involved in a variety of functions, from intracellular signalling to cell cycle, transcription and
adhesion. Protein kinase C (PKC) also binds to filamin A, this interaction occurs at the plasma
membrane and is believed to lead to lead to the phosphorylation of filamin A, influencing its
interaction with cell surface molecules. As for ECSCR, PKC was shown to bind to filamin A
at two separate sites in repeats 1-4 and 22-24 (Tigges et al., 2003). ECSCR localises to the
plasma membrane and filamin A is known to interact with several other membrane bound
proteins, many of which are involved in cell adhesion and coagulation pathways. For example,
filamin A can promote and inhibit adhesive functions. When bound to the integrin cytoplasmic
domain, it restricts integrin-dependent cell migration by inhibiting transient membrane
protrusion and cell polarisation (Calderwood et al., 2001). The multitude of filamin A
interactors involved in many different pathways may implicate a diverse role for ECSCR,
controlling the filamin A availability not only to bind to other molecules but also to be anchored
to the membrane, thus modulating these pathways.

101
3.6.2 The role of ECSCR in modulating the cytoskeleton
To further investigate the role of ECSCR in modulating the cytoskeleton siRNA knockdown
was performed and several cytoskeletal proteins found in the co-immunoprecipitation assay
were visualised by immunofluorescence (figure 3.6). VE-cadherin, a molecule present in cell-
cell adhesion regions was also stained, as Shi et al. (2001) have reported that ECSCR also
localizes to cell-cell junctions. Although ECSCR promotes cell aggregation in vitro (Shi et al.,
2001) its loss does not seem to be sufficient to affect cell-cell adhesion, as there seems to be
no difference between VE-cadherin staining in HUVECs transfected with ECSCR siRNA or
negative control duplex.
Additionally, Armstrong (2005) has demonstrated that ECSCR co-localises with F-actin, which
also binds filamin A. Co-localisation around the membrane was expected, but clusters of co-
localised proteins were also observed at the base of cell protrusions. This suggests that ECSCR
has a role in the development of these protrusions through its interaction with filamin A and
possible coupling to F-actin, in a migratory or adhesive function. F-actin was stained using
phalloidin. Although subtle, there seems to be a difference in stress fibres of cells transfected
with ECSCR siRNA compared to those treated with negative control duplex. Loss of Ecscr
seems to result in more disorganised fibres, that are more distant from the cell edges. Ma et al.
(2009) have reported that the transfection of ECSCR-GFP into HEK 293T cells had resulted in
the destruction of stress fibres. In accordance to that observation, loss of ECSCR should result
in increased stress fibres, however the opposite was observed. This can be due to differences
between the two cell types, where different binding partners may be available, thus influencing
distinct pathways. Also, ECSCR produced in HEK 293T cells is slightly smaller than the
102
endothelial one (Armstrong, 2005), which means it may lack important post-translational
modifications, such as a specific glycosylation pattern of carbohydrate, which affects its role
in stress fibre formation.
As for the other proteins studied, the loss of ECSCR results in a similar phenotype: filamin A
and myosin II are present in fibre-like structures, which become destructed and disorganised
when ECSCR is lost, in a similar fashion to F-actin. This is consistent with a role for ECSCR
in anchoring the cytoskeleton to the membrane. Talin-1 and plastin 3 also seem to be lost at
cell-surface adhesions and cell protrusions, respectively. Actin-bundling proteins not only
structure the cortical actin cytoskeleton, but also control actin dynamics. Plastin 3 has been
shown to decrease F-actin disassembly rate and inhibit cofilin-mediated depolymerisation of
actin filaments in vitro (Giganti et al., 2005). If upon ECSCR loss plastin 3 is dislocated, then
its role in keeping actin fibres assembled may be impaired. Moesin, rather than lost, seems to
be more distant from the membrane and to have a more diffused distribution, compared to the
very well-defined spike-like structures observed in HUVECs treated with negative control
duplex. The staining protocol for this antibody could still be further optimised, as it has
produced a clearer staining when used by Martin-Villar et al. (2010). ERM proteins, such as
moesin, link membrane proteins to the underlying cortical cytoskeleton and control the
distribution of and signalling from membrane receptors (McClatchey and Fehon, 2009). Since
many proteins work cooperatively, loss of ECSCR may affect their distribution, regardless of
interacting directly or indirectly with them. Additionally, ECSCR may have specific roles in
adhesion, protrusion or migration that are only revealed in a particular context. Armstrong et
al. (2008) have shown that lack of ECSCR results in slower migration through a membrane
pore. Myosin II has been demonstrated to have a very specific role in contraction only during
passage through narrow gaps, where squeezing contraction of the trailing edge propels the rigid
103
nucleus (Lämmermann et al., 2008). To further investigate the interaction of ECSCR with these
proteins (or its influence in a signalling pathway where they are important), context-specific
assays could be performed, such as the Boyden chamber assay to assess migration through a
pore rather than migration on a flat surface, where myosin II has no role.
To further elucidate any role for ECSCR, the opposite experiment was performed, where
ECSCR-GFP was overexpressed. The M2 cell line is deficient in filamin A and the cells display
defects in membrane stability and migration. When filamin A is re-introduced, these functions
are restored (Cunningham et al., 1992). Other studies in these cells have also revealed that
filamin A is essential for the maintenance of protrusions or lamellae which enable the cells to
crawl (Flanagan et al., 2001). In the current study, M2 cells were transfected with ECSCR. The
cells were still unable to form filopodia, whereas in HEK cells (that contain filamin A), ECSCR
was able to induce the formation of these structures (figure 3.7). This shows that ECSCR has
the ability to induce the formation of filopodia and needs filamin A to do so.
Interestingly, M2 cells contain filamin B, which does not appear to have a redundant function
to that of filamin A, as demonstrated by these cells’ inability to form cell protrusions
(Cunningham et al., 1992). ECSCR seems to require specifically filamin A but not filamin B
for tube formation. This is reinforced by the fact that filamin A was specifically co-
immunoprecipitated with ECSCR (34 hits for ECSCR versus 5 for the IgG control) and filamin
B, although very similar in structure, was not found to be associated to ECSCR.
Consistent with its role in cytoskeleton modulation, ECSCR knockdown resulted in less stress
fibres and displacement of cytoskeletal components and its overexpression has induced the
formation of filopodia. The overexpression experiments were performed in both cells that
express filamin A and cells that do not. It had been reported that M2 cells, due to the lack of

104
filamin A, were unable to respond to RalA and Cdc42 to form filopodia. The current study
shows that ECSCR, which interacts directly with filamin A, is also not able to induce filopodia
in the absence of filamin A. The M2 experiments, nevertheless, should be repeated to confirm
these results. The cells were a kind gift from Dr. Jo Morris (University of Birmingham, UK).
However, they were found to be contaminated with fungus. They were subject to treatment
with anti-fungal agents and after two weeks seemed to be contamination-free. There were no
apparent morphological changes under bright field microscopy, but when transfected with
GFP, even the controls showed very small blebs. ECSCR was still able to locate to the
membrane, but it is unclear whether blebs were caused by these cells not being healthy, or due
to ECSCR expression (as they were much more evident in ECSCR-containing cells). For many
years blebbing has been associated with cell death. However, it also constitutes a mode of
locomotion that is actin-free and completely dependent on myosin, as demonstrated by Blaser
et al. (2008) in zebrafish primordial germ cells in vivo.
3.6.3 Microarray to test the effect of ECSCR knockdown
A microarray was performed to assess the effect of ECSCR knockdown in the gene expression
of HUVECs. All the genes considered had a fold change equal to or greater than 2. 342 genes
were found to be upregulated and 354 downregulated. The most upregulated gene was CCL20
(a chemokine involved in attracting lymphocytes and dendritic cells towards endothelial cells)
and the most downregulated gene was CYP26B1 (a member of the cytochrome P450 family of
metabolism enzymes, responsible for inactivating all-trans retinoic acid to hydroxylated
forms). 15 up and downregulated genes were chosen to confirm the microarray data by qPCR
(figure 3.10). They have shown the same trend as the microarray. CD36 was not detected by
qPCR. The reason why CD36 was detected in samples from HUVECS by microarray but not

105
by qPCR may have to do with the sensitivity of each technique. The microarray chip was
designed for very low-input samples. HUVECs have been reported as being CD36 negative
(McCormick et al., 2000), as well as CD36 positive (Sölder et al., 2012). The latter authors
have also found that HUVECs are negative for LYVE-1, whereas the in the current study the
message for this protein was found elevated (and, therefore, present) in HUVECs with low
levels of ECSCR, both by microarray and qPCR.
Most of the genes, both up- and downregulated, fell into the categories of adhesion molecules,
glycoproteins, cytoskeleton-related, chemotaxis and apoptosis (analysis done using DAVID)
(figure 3.11). When possible pathways were analysed using ingenuity pathway analysis, the
more apparent role for ECSCR in these functions seemed to be diluted (figures 3.12-3.14). The
first method groups proteins by function regardless of a specific pathway, whereas the second
one groups them by pathway and the result was not as useful as anticipated in interpreting the
effects of ECSCR loss. Also, most of the figures show other types of cells that are not
endothelial, as that particular pathway is either specific to them or has been more extensively
studied in those cell types.
VEGFA and FGF13, well known angiogenesis stimulators, were found to be upregulated (4.2
and 8.9 fold, respectively). This cell response to the loss of ECSCR appears to make HUVECs
more angiogenic. Many chemokynes and their receptors also seemed to be altered, both up and
donwregulated. It is known that, for example, CXC chemokines have both anti-and pro-
angiogenic effects. Those with an ELR motif promote angiogenesis and those that are inducible
by interferons and do not contain the ELR motif inhibit angiogenesis (Belperio et al., 2000).
Members of both groups were up and downregulated. Microarray results should be interpreted
carefully and together with other experimental evidence. It is suggested that more cell based
assays are performed, such as Boyden chamber to evaluate any role of ECSCR in myosin II-
106
mediated contraction and then, based on a specific context, the tables produced from the
microarray analysis can be used to suggest what other genes can be measured or visualised.
3.6.4 siRNA duplexes titration and transfection stability assessment
The expression of ECSCR was silenced in HUVECs using a regulatory cellular pathway known
as RNA interference (RNAi). In the eukaryotic cell, long dsRNA are cleaved by Dicer, a
ribonuclease III–like enzyme, into short RNA duplexes, small interfering RNA (siRNA).
Synthetic siRNA can be generated and introduced into cells to knockdown the expression of a
particular gene. After entering into cells by lipofection, the siRNA is assembled into an
endoribonuclease-containing complex, known as RNA-induced silencing complex (RISC) and
unwinds to become single stranded. The siRNA strand incorporated into RISC base pairs to its
complementary mRNA sequence, resulting in its cleavage and degradation. This blocks the
translation of mRNA into protein thus silencing its expression in the cell (Xia et al., 2002).
Cells can sometimes display an innate immune interferon response to double stranded siRNA
duplexes used in RNAi technology, because double stranded RNA is sometimes present in
virus-infected cells (Anderson et al., 2008). Also, siRNA duplexes can trigger off-target effects
such that they can knock down unintended mRNAs with high silencing efficacy (Sledz et al.,
2003). In order to minimize both the interferon response and off-target effects, the lowest
concentration of siRNA required to knockdown ECSCR expression was determined. In
addition, it had been shown by Armstrong et al. (2008) that ECSCR siRNA with D1 does not
elicit interferon response (by quantifying the expression of OAS1 and ISG20 by qPCR).
3.6.5 In silico analysis of conserved ECSCR putative functional motifs
ECSCR is a unique protein that does not share domain homologies with any known protein
when analysed in silico. To find those similarities and confirm the functionality of such
conserved domains usually constitutes the first step when trying to characterize a novel protein.

107
Therefore, to have some insights on possible functions or protein interactions, other in silico
analyses for the ECSCR primary structure have been done, such as the search for conserved
predicted functional sites using the human, mouse and zebrafish sequences.
This was done using Eukaryotic Linear Motif (ELM) resource for predicting functional sites in
eukaryotic proteins. For the intracellular domain several possible functional sites conserved in
all three species were found and could be investigated: PKA (protein kinase A) and CK1
(casein kinase 1) phosphorylation sites and GSK3 (glycogen synthase kinase 3)
phosphorylation recognition site, class III PDZ domains binding motif (in the C terminus of
the protein) and a sorting and internalisation signal found in the cytoplasmic juxtamembrane
region of type I transmembrane proteins (figure 3.15).
The endosomes play key roles in the cell such as sorting and recycling of membranes and cargo
and the intracellular delivery of proteins, toxins and viruses by endocytosis. In addition to these
classical functions, it has become clear over the last few years that endosomes are also involved
in cell signalling (by internalising receptors or facilitating the recruitment and integration of
signalling cascades on the surface of endocytic vesicles), cytokinesis, polarity and migration
(Gould and Lippincott-Schwartz, 2009). So far, ECSCR-GFP seems to localize to the plasma
membrane and filopodia, rather than organelles. However, in the MS analysis of proteins that
co-precipitated with ECSCR, some proteins regulating trafficking related to endosomes have
been identified.
CK1 is involved in cytoskeleton remodelling by, for example, phosphorylating RhoB and thus
impeding actin stress fibre organization and epidermal growth factor receptor (EGF)
stabilization (Tillement et al., 2008). In quiescent cells, β-catenin in association with
cytoskeletal components (such as E-cadherin), orchestrates actin dynamics and regulates cell
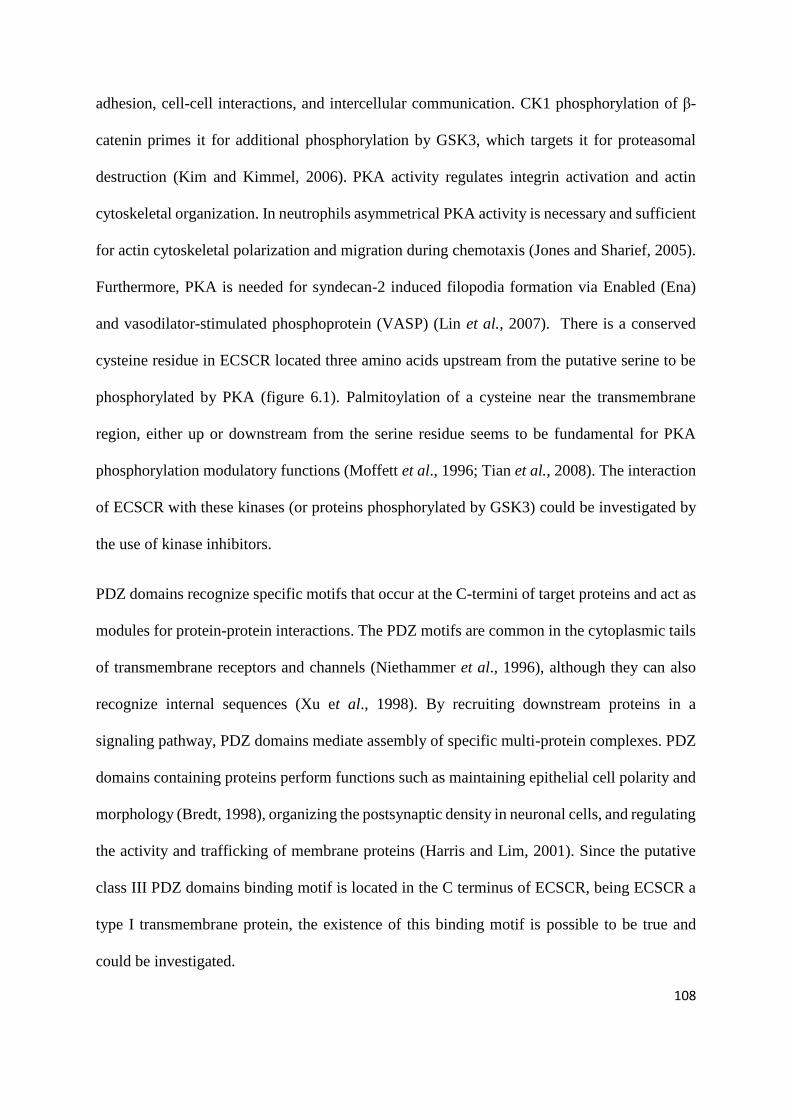
108
adhesion, cell-cell interactions, and intercellular communication. CK1 phosphorylation of β-
catenin primes it for additional phosphorylation by GSK3, which targets it for proteasomal
destruction (Kim and Kimmel, 2006). PKA activity regulates integrin activation and actin
cytoskeletal organization. In neutrophils asymmetrical PKA activity is necessary and sufficient
for actin cytoskeletal polarization and migration during chemotaxis (Jones and Sharief, 2005).
Furthermore, PKA is needed for syndecan-2 induced filopodia formation via Enabled (Ena)
and vasodilator-stimulated phosphoprotein (VASP) (Lin et al., 2007). There is a conserved
cysteine residue in ECSCR located three amino acids upstream from the putative serine to be
phosphorylated by PKA (figure 6.1). Palmitoylation of a cysteine near the transmembrane
region, either up or downstream from the serine residue seems to be fundamental for PKA
phosphorylation modulatory functions (Moffett et al., 1996; Tian et al., 2008). The interaction
of ECSCR with these kinases (or proteins phosphorylated by GSK3) could be investigated by
the use of kinase inhibitors.
PDZ domains recognize specific motifs that occur at the C-termini of target proteins and act as
modules for protein-protein interactions. The PDZ motifs are common in the cytoplasmic tails
of transmembrane receptors and channels (Niethammer et al., 1996), although they can also
recognize internal sequences (Xu et al., 1998). By recruiting downstream proteins in a
signaling pathway, PDZ domains mediate assembly of specific multi-protein complexes. PDZ
domains containing proteins perform functions such as maintaining epithelial cell polarity and
morphology (Bredt, 1998), organizing the postsynaptic density in neuronal cells, and regulating
the activity and trafficking of membrane proteins (Harris and Lim, 2001). Since the putative
class III PDZ domains binding motif is located in the C terminus of ECSCR, being ECSCR a
type I transmembrane protein, the existence of this binding motif is possible to be true and
could be investigated.

109
3.6.6 Glycosylation paterns of ECSCR
Glycosylation is one of the most frequent post-translational modifications of proteins. It is well
documented that altered glycosylation is a feature of cancer cells and some glycan types can
even be used as markers of tumour progression (Dall’Olio, 1996; Varki, 2008). The altered
glycosylation profiles of tumour-associated endothelium, however, are not well characterized.
Peng et al. (2010) have recently found that beta-1,6-GlcNAc branching modification of
PECAM-1 leads to cytoskeletal conformational changes that result in cell contraction, which
facilitates tumour cell extravasation.
ECSCR is predicted to be heavily glycosylated, due to containing multiple O-glycosylation and
one consensus N-glycosylation sites and also because on a western blot it is detected at around
55 kDa and the predicted size is 21.6 kDa (Armstrong et al., 2008). An attempt was made to
immunoprecipitate ECSCR and then digest it using different combinations of glycosidases.
Changes in size of the protein would be detected both by western blot (proteins) and using a
kit containing the Schiff reagent, based on the periodic acid reaction, that recognizes
carbohydrates. However, all antibodies are glycosylated and the heavy chain has the same size
as ECSCR. The positive control (fetuin) has been successfully deglycosylated, but the analysis
of ECSCR was not conclusive. All samples were incubated with five different
glycosidases(PNGase F, sialidase, beta-glycosidase, glucosaminidase and O-glycosidase) from
the DeGlycoMx kit (QA-Bio). It was not possible to know if the (incompletely digested) band
around 50 kDa was ECSCR or the heavy chain of the antibody. As an alternative, a kit
containing different lectins that will bind to and allow the identification of specific
carbohydrate groups could be used, rather than trying to remove specific carbohydrate groups.
Another alternative would be to overexpress ECSCR- GFP in HUVECs using a lentiviral
110
Figure 3.15 –Putative conserved predicted functional sites on ECSCR.
The transmembrane domain is depicted in blue. The predicted functional sites are highlighted
in yellow or underlined, when overlapping. The terminal predicted PDZ III domain binding
motif for zebrafish was manually added, as it locates to the end of the C-terminus, but this
protein is longer and has a part of the sequence that doesn’t align with the other orthologs.
111
system and subsequent immunoprecipitation and deglycosylation. This would remove ECSCR
from the 50 kDa range, so that it could be distinguished from the antibody heavy chain. It is
important to use HUVEC cells, as glycosylation patters in endothelial cells are very specific.
For example, an antibody against the extracellular domain of ECSCR was raised by a company
in Belfast (appendix 1). They have used the bacterially expressed naked protein as an
immunogen and the antibody was able to recognize ECSCR-GFP overexpressed in HEK 293T
cells. However, this protein was not as glycosylated as it would have been in HUVECs, as it
runs at a much lower molecular weight on an SDS-PAGE. This was also observed by Shi et
al., (2011), when an ECSM2-FLAG fusion protein was observed at ~40 kDa, compared to the
~55 kDa from HUVECs)
Shi et al., (2011) have immunoprecipitated ECSCR from HUVECs using a monoclonal
antibody and treated the purified protein with a glycosidase mix. They were able to produce
some lighter bands, but the full length ECSCR did not disappear, which may indicate that
ECSCR has a very specific type of carbohydrate or there are other post-translational
modifications contributing to its molecular weight.
3.6.7 What regulates ECSCR?
A quick promoter analysis of the region 2000 bp upstream of ECSCR and intron 1 using a
program available online, TFSEARCH (http://www.cbrc.jp/research/db/TFSEARCH.html),
has found some interesting conserved potential transcription factors. These could be narrowed
down to a small number and all seem to be related to haematopoiesis and endothelial cells
(table 3.1). In the future it would be interesting to knock some of these transcription factors
down (the ones more specific to endothelial cell biology) and assess their effect on the
expression of ECSCR and angiogenesis.
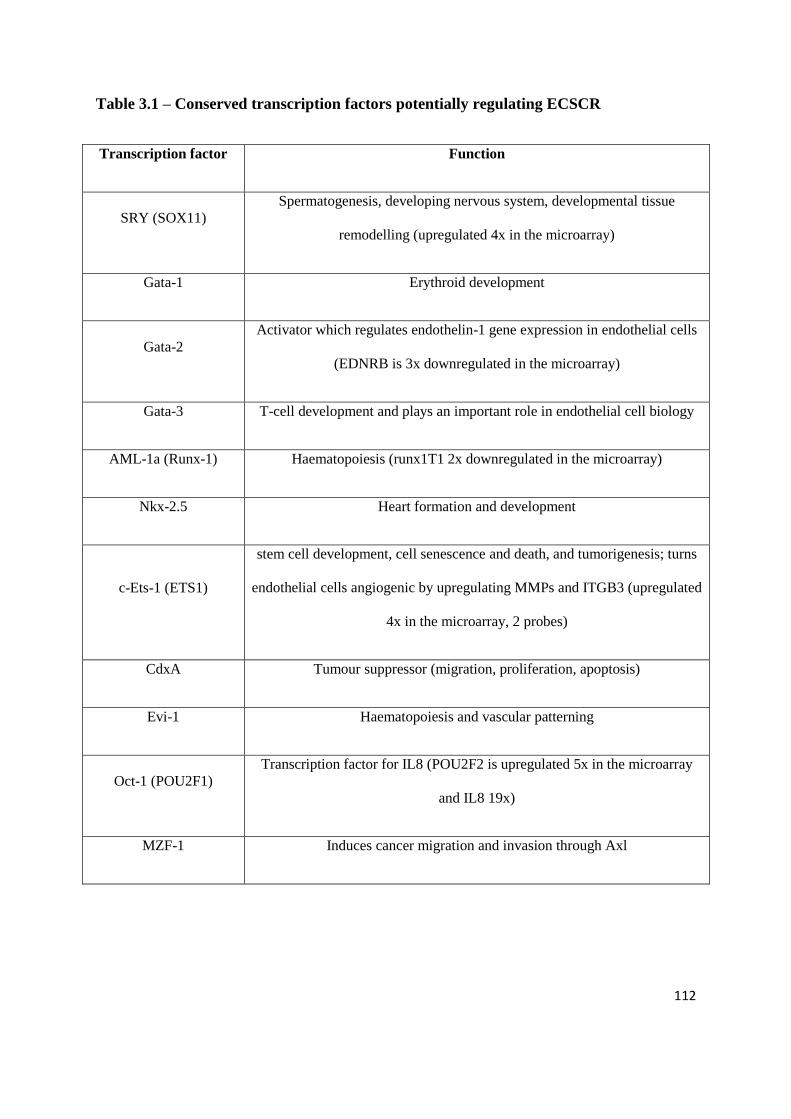
112
Table 3.1 – Conserved transcription factors potentially regulating ECSCR
Transcription factor Function
SRY (SOX11)
Spermatogenesis, developing nervous system, developmental tissue
remodelling (upregulated 4x in the microarray)
Gata-1 Erythroid development
Gata-2
Activator which regulates endothelin-1 gene expression in endothelial cells
(EDNRB is 3x downregulated in the microarray)
Gata-3 T-cell development and plays an important role in endothelial cell biology
AML-1a (Runx-1) Haematopoiesis (runx1T1 2x downregulated in the microarray)
Nkx-2.5 Heart formation and development
c-Ets-1 (ETS1)
stem cell development, cell senescence and death, and tumorigenesis; turns
endothelial cells angiogenic by upregulating MMPs and ITGB3 (upregulated
4x in the microarray, 2 probes)
CdxA Tumour suppressor (migration, proliferation, apoptosis)
Evi-1 Haematopoiesis and vascular patterning
Oct-1 (POU2F1)
Transcription factor for IL8 (POU2F2 is upregulated 5x in the microarray
and IL8 19x)
MZF-1 Induces cancer migration and invasion through Axl

113
4 THE ROLE OF ECSCR IN
DEVELOPMENTAL
ANGIOGENESIS OF THE
ZEBRAFISH (DANIO RERIO)
114
4.1 Introduction
HUVECs primary cells were used as a human in vitro model to perform signalling and
interaction studies. As a complement, in vivo studies were also performed, using zebrafish and
an Ecscr knockout mouse as models. Mouse and zebrafish orthologs for ECSCR have been
identified by Armstrong et al. (2008). Zebrafish are very easy to use, as they reproduce often
and quickly and the embryos are transparent and develop rapidly, which allows direct
observation. In addition, there are several transgenic lines available suitable for angiogenesis
studies, such as tg[fli1:EGFP] (Lawson and Weinstein, 2002). In this line, friend leukaemia
integration 1 (fli1) is fused to enhanced green fluorescent protein (EGFP), which allows the
visualisation, study and manipulation of the vasculature. Fli1 is an E-twenty six (ETS)-domain
transcription factor that is present in vasculature since the appearance of the haemangioblasts
(Brown et al. 2000).
Blood and endothelial cells derive from a mesodermal common precursor, the haemangioblast
(Keller, 2001). In the developing zebrafish embryo two populations of haemangioblasts arise
at the lateral plate mesoderm to form the primitive vasculature. The anterior population forms
the head vasculature and the posterior originates the dorsal aorta and posterior cardinal vein,
the axial vessels of the tail and trunk (Fouquet et al., 2007). The latter starts migrating into the
midline at the 14 hours post fertilization (hpf) stage (10 somites) and coalesces to form a tube.
Soon after, the anterior angioblasts also migrate to locate ventrally to the dorsal aorta and by
13-15 hpf (7-12 somites) the arterial and venous fates are already determined (Zhong et al.,
2001). Cell fate is controlled by neighbouring tissues. The dorsal aorta is located ventrally to
the notochord and hypocord and dorsally to the posterior cardinal vein, being laterally flanked
by the somites (Fouquet et al., 2007; Zhong et al., 2001). The posterior cardinal vein is dorsally
flanked by the aorta and ventrally by the endoderm. The midline structures secrete hedgehog

115
towards the dorsal aorta, which controls important signalling pathways, including Vegf and
Notch (Lawson et al., 2002). Hedgehog signalling is required in vascular development at three
stages: medial migration of dorsal aorta progenitors, arterial-specific gene expression and
sprouting of intersegmental vessels (Gering and Patient, 2005). By 22 hpf primary
intersegmental vessels sprout upwards from the dorsal aorta and soon after, by 24 hpf, the
primitive vascular loop is formed and circulation starts (Isogai et al., 2003). Secondary
sprouting from the posterior cardinal vein starts at 32 hpf and gives rise to venous
intersegmental vessels and the lymphatic system. Through remodelling of the trunk
vasculature, primary arterial sprouts contribute to the formation of both arterial and venous
intersegmental vessels (Isogai et al., 2003). Arterial sprouting depends on Vegfa, kdr and kdr-
1, whereas venous intersegmental vessels require Vegfc. Delta-like ligand 4 supresses the
ability of developing intersegmental arteries to respond to Vegfc-driven Flt4 signalling (Hogan
et al., 2009).
At 22 hpf, the sprouting of primary intersegmental vessels from the dorsal aorta occurs by
angiogenesis and has been widely used as a model to study that process. Sprouting starts with
arterial cells migrating out and overlapping. Then, they form a multicellular tube. After
undergoing several complex rearrangements, such as division, rearrangement and changes in
cell-cell contacts, the dorsal-most cell (tip cell) acquires a T-shape and joins with its anterior
and posterior neighbours to form the dorsal longitudinal anastomotic vessel. The lumen of the
vessel is formed through the formation and fusion of vacuoles from contiguous cells (Blum et
al., 2008).
116
4.2 Zebrafish Ecscr expression pattern
Armstrong et al. (2008) reported that an uncharacterised putative zebrafish protein showed
similarity to human ECSCR, especially in the intracellular domain. The endothelial specificity
in zebrafish embryos of this protein is now investigated. RNA whole mount in situ
hybridization was performed. RNA antisense (and sense, as a control) probes were made by
extracting total RNA from 24 hours post-fertilization (hpf) zebrafish embryos. RNA was
converted into cDNA, putative Ecscr was amplified by PCR and inserted into the PCR TOPO
blunt vector using EcoRI and BamHI restriction enzymes. The orientation of the insert was
confirmed by sequencing and the plasmid was linearised using NotI (for the sense probe,
synthesised using the SP6 RNA polymerase promoter) and BamHI (for the antisense probe,
synthesised using the T7 RNA polymerase promoter) restriction enzymes. The RNA probes
were synthesised using the mMessagemMachine kit and subsequently purified, so that they
could be used for detection of the Ecscr transcript by whole mount in situ hybridization.
Figure 4.1 shows that zebrafish Ecscr is specifically expressed in the vasculature, namely in
the major head and trunk vessels. No expression in the intersegmental vessels was detected.
Subsequently, the message levels of Ecscr were detected by reverse-transcription PCR using
lysates from AB* wild type embryos at different developmental stages, from 1 cell to 72 hpf
(Figure 4.2). Ecscr is maternally expressed and the levels decrease up to the 12-somite stage.
By the 16-somite stage, transcription levels increase substantially and remain high at 72 hpf.
This suggests that Ecscr may play a part in the developing vasculature. A second transcript of
Ecscr was detected. This transcript seems to have a role between 12 and 30 hpf, as it is not
detectable on samples from other stages. Elongation factor 1 alpha was used as a housekeeping
gene and a -RT PCR was performed using the samples not converted into cDNA to assess
possible contamination with genomic DNA.

117
Although the gels shown on figure 4.2 allow a more visual assessment and the detection of a
second transcript, real-time quantitative PCR was also performed on the same samples (figure
4.3). The Ecscr expression was normalised to that of EF1-alpha. The pattern observed on figure
4.3 is the same as on figure 4.2.
To further investigate the presence of two Ecscr bands, full-length Ecscr was amplified by PCR
from cDNA and the two bands were excised from an agarose gel, purified and sequenced. The
sequencing results have revealed two alternative transcripts, differing on the presence/absence
of exon 2 (figure 4.4).

118
Figure 4.1 - Zebrafish Ecscr mRNA expression pattern in 24 hpf zebrafish AB* wild type
embryos
The zebrafish Ecscr transcript was detected by whole mount in situ hybridization. At 24 hpf
Ecscr is expressed in the head and major trunk vessels, as indicated by the black arrows. The
two inserts below the main image are a magnification of the head and trunk regions where the
transcript was detected. This staining has been repeated 3 times with similar results, on 10
embryos each time.

119
Figure 4.2 - Ecscr transcript levels during zebrafish embryonic development using
reverse transcriptase-PCR
Wild type zebrafish embryos were collected at different stages, from 1 cell (maternal) to 72
hpf. PCR reactions for Ecscr, Ef1-alpha and –RT were performed (from cDNA) and repeated
3 times with similar results. The Ecscr transcript is maternally expressed and levels decrease
up to the 12-somite stage. By the 16-somite stage, transcription levels increase substantially
and remain high at 72 hpf. A second transcript was detected. hpf – hours post fertilization; Ef1-
alpha – elongation factor 1 alpha ; -RT – negative control for the reverse transcriptase reaction.
Specification of haemangioblasts/vasculogenesis/angiogenesis
Ef1‐alpha
Ecscr
‐RT
EF1‐alpha
Ecscr
‐RT
1000 bp 800 bp
100 bp 200 bp 300 bp
1000 bp 800 bp 600 bp

120
Figure 4.3 – Ecscr transcript levels during zebrafish embryonic development using real
time quantitative PCR.
Wild type zebrafish embryos were collected at different stages, from 1 cell (maternal) to 72
hpf. Total RNA was extracted and converted to cDNA. qPCR reactions were performed and
the expression levels of Ecscr were normalised to those of Ef1-alpha. Each reaction was
performed in triplicate and repeated 3 times with similar results. As observed for figure 4.2,
Ecscr transcript is maternally expressed and levels decrease up to the 14 hpf stage. By the 15
hpf stage, transcription levels increase and remain high at 72 hpf. Statistical variation is shown
as standard deviation. hpf – hours post fertilization.
0
0.2
0.4
0.6
0.8
1
1.2
Zeb
rafi
sh E
cscr
exp
ress
ion
no
rmal
ise
d t
o
Ef1
-alp
ha

121
Figure 4.4 - Alternative splicing of the zebrafish Ecscr transcript
When analysing the Ecscr expression during embryonic development by reverse-transcriptase
PCR (figure 4.2), the gel has revealed a second band for the stages between 12 and 30 hpf that
are not present before or after these points. This was further investigated by excising and
sequencing the two bands. The results have shown that there are two alternatively spliced Ecscr
variants in wild type zebrafish, differing in the presence/absence of exon 2 (A and B).

122
Figure 4.5 – Test of antibodies suitable to detect zebrafish Ecscr
To be able to detect the zebrafish Ecscr protein, the polyclonal antibody against human ECSCR was
tested on HUVECs (positive control) and 24 hpf zebrafish lysate. This antibody did not detect the fish
protein (A). Therefore, a new antibody was produced in rabbit, using Ecscricd-MBP. The different test
bleeds were able to detect the immunogen (B, arrow), as well as the endogenous protein (C). the MBP
– maltose-binding protein; Ecscricd-MBP – zebrafish Ecscr intracellular domain fused to MBP; PB –
pre-bleed; TB1 – test bleed 1; TB2 – test bleed 2; BO – bleed out; CoMo – negative control morpholino;
UTR Mo – morpholino targeting Ecscr 5’ UTR region.
PB TB1 TB2 BO
52
42
72
37
A C
B
52
25
52
72
42

123
4.3 Raising an antibody against the zebrafish Ecscr intracellular
domain (icd)
Many antibodies have the ability to detect ortholog proteins from different species, when the
regions used as immunogens show sufficient conservation. Since a polyclonal antibody against
the whole human ECSCRicd (conserved across species) was available, total protein from wild
type zebrafish embryos was extracted and analysed by western blot. Total protein from
HUVECs was used as a positive control. This antiserum did not recognise the zebrafish protein
(figure 4.5 A). In order to detect Ecscr on a western blot or to use it for immunoprecipitation
studies in the future, the production of a suitable antibody was necessary. A zebrafish Ecscricd-
MBP (maltose binding protein) fusion protein was produced and purified. A rabbit was
immunised and the bleeds were tested against the protein that was sent to CRUK for antisera
production, as well as against zebrafish embryos lysates (injected with control or UTR
morpholino, as described on the next section). Prior to being tested, the antiserum was
incubated with PVDF membrane where containing MBP, so that it could be depleted from
these antibodies. The antibody successfully recognised both the bacterially produced fusion
protein and endogenous zebrafish Ecscr (figure 4.5 B and C). This validates not only the
antibody, but also the morpholino, as the double band (~40-47 kDa) is present in the negative
control and absent in samples from embryos treated with an Ecscr 5’ UTR-targeting
morpholino.
4.4 Loss of Ecscr function causes defects in intersegmental vessels
sprouting
One of the most commonly used strategies to study the function of a given gene consists of
removing it from the system, either by knockdown or knockout techniques. To study the loss
124
of Ecscr function antisense morpholino technology was used (Nasevicius and Ekker, 2000).
Two different morpholinos were designed to target Ecscr: one that binds to the 5’ UTR region
immediately before the start codon and another one that binds between the end of exon 5 and
the beginning of intron 5. The first should interfere with and block translation, whereas the
latter should impair splicing between exons 5 and 6. As controls for specificity, a mismatch
morpholino was designed for each targeting one, differing in five nucleotides, which causes
them not to bind to the specific target. Transgenic tg[Fli1:EGFP] one cell embryos were
injected with 8, 4 and 2 ng of each morpholino, which correspond to 1 nl of 1, 0.5 and 0.25
mM, respectively. The amount of morpholino that caused a phenotype for the Ecscr-targeting
sequence and no alterations for the mismatch controls was 4 ng for both pairs. In the light of
this result, 4 ng per embryo was the amount chosen for further loss of function studies. The
embryos were observed and counted at 30 hpf. Three independent experiments were performed
for each morpholino and at least 100 viable embryos were counted and assessed for each
condition. Figure 4.6 depicts the basic anatomy of a zebrafish embryo and shows what region
has been used for imaging. The embryos injected with control morpholinos were not affected
(Figure 4.7). The specifically targeted morphants displayed a range of intersegmental vessel
effects due to Ecscr loss of function. In general, Ecscr knockdown caused defects in the
sprouting of intersegmental vessels from the main trunk vasculature. The range of phenotypes
observed was divided into four categories: no abnormal effects detectable (the embryos look
like the controls), mild (one or two intersegmental vessels disrupted), intermediate (three or
four abnormal intersegmental vessels) and severe effects (more than five intersegmental vessels
disrupted) (Figure 4.7). The embryos were counted for each category and are represented on
figures 4.8 A and 4.8 B as a percentage of the total. Upon morpholino injection, approximately
75% of the embryos presented vessel defects in both conditions.

125
The specificity of the targeting morpholinos was also tested by using in vitro transcribed Ecscr
mRNA, where neither of the morpholinos can bind. The construct used to make the transcript
contained only the open reading frame (so the 5’UTR morpholino cannot bind) and, since the
mRNA was already spliced, the splicing-interfering morpholino was also unable to target this
molecule. The injection of this message alone caused a similar phenotype to the one inflicted
by the morpholino when used at high concentrations (1, 100 and 1000 ng/µl were tested). The
concentration chosen for the assay was 100 ng/µl). When co-injected with the morpholino, a
rescue of the phenotype was achieved, reflected by the significant decrease (p < 0.05) in the
number of embryos displaying mild and especially severe abnormalities (figures 4.9 A and 4.9
B). Even in the few cases where significance of decrease was not achieved, those categories
still showed a decreasing trend. A western blot was also performed for protein samples from
embryos injected with the various morpholinos and mRNA, to assess changes in Ecscr protein
expression (figure 4.10). The injection of mRNA alone has produced an increase in Ecscr
expression, whereas the injection of either morpholino has produced a considerable decrease.
The injection of either mismatch negative control morpholino has not affected the amount of
Ecscr compared to the uninjected control. A co-injection of either targeting morpholino and
Ecscr mRNA has restored the protein levels back to those of the uninjected control. An
antibody against mouse actin was used as a loading control. This antibody can still recognise
the fish protein but, probably due to evolutionary distance, the bands are faint and somewhat
diffused.

126
Figure 4.6 – The zebrafish vasculature at 36 hours post fertilization
To illustrate the typical vasculature of a 36 hpf zebrafish embryo, a transgenic tg[fli1:EGFP]
embryo was imaged (A). The white rectangle represents the area of the trunk that was selected
for further imaging and comparisons. The main zebrafish axial vessels are schematically
represented in (B). The black rectangle highlights the main trunk axial vessels. DA – dorsal
aorta; CV – cardinal vein; ISV – intersegmental vessels.

127
Figure 4.7 – Ecscr loss of function in transgenic tg[Fli1:EGFP] 30 hpf zebrafish embryos.
At 30 hpf zebrafish embryos injected with Ecscr-targeting morpholinos displayed
intersegmental vessel formation abnormalities, that ranged from no abnormal phenotype (A)
to more than 5 vessels disrupted (D). This was quantified in at least 100 viable embryos, 3
times. The red arrows indicate the disrupted vessels and their number in each panel is
proportional to the severity of the abnormal phenotype. A – No abnormal phenotype; B – mild
(1-2 disrupted vessels); C – intermediate (3-4 disrupted vessels); D – severe (more than 5
disrupted vessels).
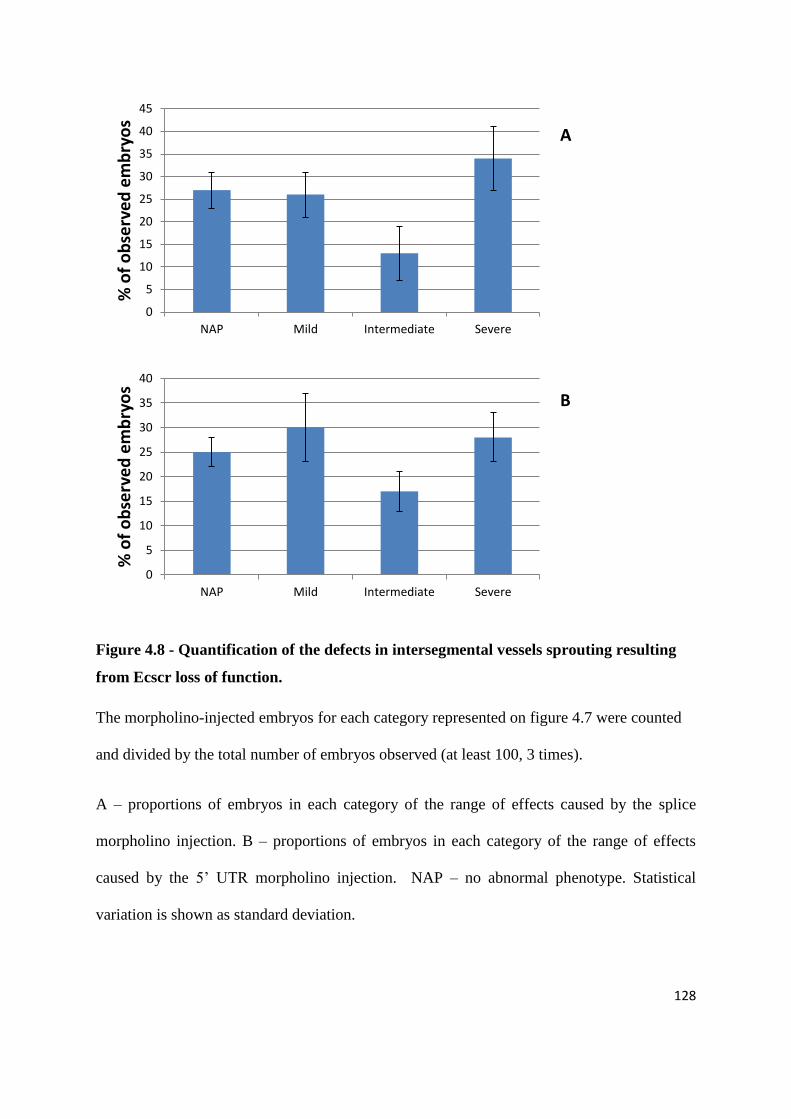
128
Figure 4.8 - Quantification of the defects in intersegmental vessels sprouting resulting
from Ecscr loss of function.
The morpholino-injected embryos for each category represented on figure 4.7 were counted
and divided by the total number of embryos observed (at least 100, 3 times).
A – proportions of embryos in each category of the range of effects caused by the splice
morpholino injection. B – proportions of embryos in each category of the range of effects
caused by the 5’ UTR morpholino injection. NAP – no abnormal phenotype. Statistical
variation is shown as standard deviation.
0
5
10
15
20
25
30
35
40
45
NAP Mild Intermediate Severe
% o
f o
bse
rve
d e
mb
ryo
s
0
5
10
15
20
25
30
35
40
NAP Mild Intermediate Severe
% o
f o
bse
rve
d e
mb
ryo
sA
B

129
Figure 4.9 - Quantification of the defects in intersegmental vessels sprouting after
mRNA rescue
To verify the specificity of the targeting morpholinos, these were co-injected with Ecscr RNA
and the same counts were performed as for figure 4.8. A chi-square test was done to determine
significant differences between counts of morpholino-injected embryos and rescued embryos,
for the same category. A p-value < 0.05 is represented by *. A – proportions of embryos in
each category of the range of effects caused by the splice morpholino and zebrafish Ecscr
mRNA co-injection. B – proportions of embryos in each category of the range of effects caused
by the 5’ UTR morpholino and zebrafish Ecscr mRNA co-injection injection. NAP – no
abnormal phenotype. Statistical variation is shown as standard deviation.
0
10
20
30
40
50
60
70
NAP Mild Intermediate Severe
% o
f o
bse
rve
d e
mb
ryo
s
0
10
20
30
40
50
60
70
80
NAP Mild Intermediate Severe
% o
f o
bse
rve
d e
mb
ryo
s
A
B *
*
* *
*
*

130
Figure 4.10 – Ecscr protein assessment by western blot of zebrafish embryos injected with
morpholinos and mRNA
A western blot was performed for protein samples from embryos injected with the various morpholinos
and mRNA, to assess changes in Ecscr protein expression. The injection of mRNA alone has produced
an increase in Ecscr expression, whereas the injection of either morpholino has produced a considerable
decrease. The injection of either mismatch negative control morpholino has not affected the amount of
Ecscr compared to the uninjected control. A co-injection of either targeting morpholino and Ecscr
mRNA has restored the protein levels back to those of the uninjected control. An antibody against
mouse actin was used as a loading control. A – Ecscr splice morpholino; B – Ecscr 5’ UTR morpholino.
CoMo – mismatch control morpholino
Ecscr
Ecscr
actin
actin
B
A
131
Figure 4.11 – Effects of ECSCR knockdown at the transcript level.
After injection of the morpholinos, RNA was purified and cDNA was synthesised. This was
used to amplify the full length zebrafish Ecscr (A). The 5’UTR morpholino resulted in no
transcript being made and the splice morpholino resulted in a smaller transcript. The difference
in sizes is shown by the black arrows. The two transcripts were sequenced and the smaller one
lacked exon 6 (B).
1000 bp 800 bp 600 bp
132
After injection of the morpholinos, RNA was purified and cDNA was synthesised. This was
used to amplify the full length zebrafish Ecscr. The 5’UTR morpholino resulted in no transcript
being made and the splice morpholino resulted in a smaller transcript (figure 4.11 A). The two
transcripts were sequenced and the smaller one lacked exon 6 (figure 4.11 B).
The intersegmental vessels are known to sprout from both the dorsal aorta and the cardinal vein
(Isogai et al., 2003). Using specific markers for artery (Ephb2) and vein (Efn4) endothelial
cells, the major trunk vessels seem to be intact when Ecscr is depleted (figure 4.12). These
markers do not stain intersegmental vessels. MyoD, a marker for myogenesis, was used to
assess endoderm integrity, to attest that the intersegmental vessel phenotype was specific and
other structures deriving from the mesoderm were not affected. The somites, as the blood
vessels, originate from the mesoderm. There may be a slight ventral expansion of the cardinal
vein in embryos injected with Ecscr morpholino. However, these are preliminary data that need
to be repeated, as the experiment was performed only once.

133
Figure 4.12 - RNA staining for vascular markers in zebrafish embryos with depleted
Ecscr by morpholino injection.
Zebrafish embryos were injected with 5’ UTR morpholino and the transcripts of blood vessel
markers were detected by in situ hybridization. The arrows indicate specific staining for the
dorsal aorta (Ephb2) and cardinal vein (Efn4). MyoD was used to make sure that mesoderm-
derived structures were developing normally. Fli1 is a marker for endothelial differentiation,
which is present in both veins and arteries.
A
134
4.5 Discussion
4.5.1 Spatial and temporal distribution of zebrafish Ecscr
Zebrafish has been recognised as a good genetic and developmental biology model to study
vessel development. Many genetic mutants and transgenic lines of endothelial lineages have
been created and are currently available. Importantly, developmental mechanisms including
those of blood vessels are conserved between higher vertebrates and zebrafish (Davidson and
Zon, 2004).
A zebrafish orthologue for ECSCR has been found by Armstrong et al. (2008). In order to
determine its endothelial specificity and therefore study its role in developmental angiogenesis,
in situ hybridization was performed using 24 hpf wild type embryos. This revealed that Ecsr is
expressed in the major head and trunk vessels exclusively (figure 4.1). Later others have
independently confirmed these results. Furthermore, they have detected the message at as early
as 10 somites in the lateral plate mesoderm, at positions where endothelial precursors are
expressed. From 16-18 somites Ecscr message is present at midline vascular structures and at
24 hpf it is detected on both trunk axial vessels (dorsal aorta and cardinal vein) and main head
vessels (Verma et al., 2010). As in the present study, they have not detected Ecscr in the
intersegmental vessels. This can be because the transcript is not there or it is expressed at such
low levels that the technique is not powerful enough to detect it.
Many other genes that are endothelial specific and play a role in vascular development have
been identified in zebrafish by genome-wide analysis and in situ hybridization screening.
GA2692 (orthologue of mammalian HspA12B, a distant member of the heat shock protein 70
family) mRNA expression was detected in zebrafish ventral hematopoietic and vasculogenic
mesoderm and later throughout the vasculature up to 48 hours post fertilization. Morpholino-

135
mediated knockdown of this protein resulted in multiple defects in vasculature, particularly at
sites undergoing active capillary sprouting (intersegmental vessels, sub-intestinal vessels and
the capillary sprouts of the pectoral fin vessel). HspA12B is highly expressed in HUVECs in
vitro and knockdown by siRNAs blocked wound healing, migration and tube formation,
whereas overexpression enhanced migration and accelerated wound healing (Hu et al., 2006).
Another example are the transcription factors from the ETS family members erg, fli1 and etsrp.
Loss-of-function analyses have demonstrated that erg and fli1 are required for angiogenesis,
acting cooperatively, possibly by regulating VE-cadherin. Etsrp, on the other hand, is essential
for haemangioblasts and vasculogenesis (Liu and Patient, 2010; Sumanas and Lin 2006).
Some proteins are expressed during transient distinct developmental periods to perform
functions that are only required during development, such as GA2692, which is only expressed
up to 48 hpf (Hu et al., 2006). Others are important during the whole lifetime of an individual.
This seems to be the case of ECSCR. It is expressed during embryonic stages (in HUVECs)
and in situ hybridization has detected ECSCR in human adult vessels from paraffin-embedded
tissue arrays (appendix 2, figure A4). Temporal expression of zebrafish Ecscr was studied from
1 cell to 72 hpf (figures 4.2 and 4.3). It is maternally expressed, as it is present already at the
1-cell stage. Maternal gene products drive early development when the embryo is
transcriptionally inactive. It only begins to produce its own RNA after the maternal-zygotic
transition, which occurs at the blastula stage (Schier 2007). This suggests that Ecscr may have
a role in very early development. However, it does not seem to be a determinant of embryonic
survival, as Ecscr-targeting morpholino injected embryos do not present lethal phenotypes. The
transcript starts expression remains low until 12 somites and then increases and remains high.
This coincides with the period when vasculogenesis occurs (Baldessari and Mione, 2008),
which implies that Ecscr may have a role during this stage. If it does, again, it does not appear

136
to be crucial, as both dorsal aorta and cardinal vein seem fairly normal when Ecscr is knocked
down (figure 4.12). However, this in situ hybridization should be repeated and examined
carefully, to confirm if there is a slight ventral vein expansion. Alternatively, because there is
a temporal gap between mRNA and protein, this increase in transcript may be in preparation
for a role in intersegmental vessel sprouting, that starts at around 22 hpf. Studies in the present
work show that loss of Ecscr results in intersegmental vessel sprouting disruption (figure 4.7).
Temporal expression of Ecscr was quantified using qPCR, which shows the pattern described
above (figure 4.3). Additionally, a reverse-transcriptase PCR was also performed and the
products were run on a gel. This allowed the identification of a second transcript that otherwise
would have not been seen (figure 4.2). What is interesting about this transcript (lacking exon
2, figure 4.4) is that it is only transiently expressed, between 5 somites (12 hpf) and 30 hpf. Its
peak of expression is between 16 somites (17 hpf) and 22 hpf (figure 4.2). This coincides with
the period during which the intersegmental vessels sprout from the axial vessels (at 22 hpf and
then the second wave at 30 hpf) (Isogai et al., 2003). Others have also reported the existence
of two mouse Ecscr transcripts, differing from each other in the first and second exons (Wu et
al., 2012). The human protein is also known to present two distinct bands on an SDS-PAGE
gel (figure 3.10; Armstrong 2005). Further investigations should be carried out to determine
the role of this transcript in intersegmental vessel sprouting, as discussed below.
4.5.2 Effects of zebrafish Ecscr loss of function in zebrafish embryos
Tg[Fli:EGFP] is a zebrafish transgenic line, in which the endothelium and its precursors are
labelled with GFP (Weinstein, 2002). These embryos were used to rapidly assess the effect of
Ecscr loss by targeting morpholino injections. Two Ecscr-specific morpholinos were used, one
targeting the 5’ UTR (translation-blocking morpholino) and another one targeting a region
between exon 5 and intron 5 (splice-blocking morpholino). For each one of those, a mismatch

137
control was used, where 5 nucleotides were altered so that the sequences are very similar but
these do not bind to the targets. When Ecscr is depleted the intersegmental vessels don’t form
properly (figure 4.7). The injected embryos displayed a variety of intersegmental vessel
disruption, ranging from no abnormal phenotype to mild (1-2 vessels disrupted), moderate (3-
4 disrupted vessels) and severe (more than 5 abnormal vessels). Approximately 75% of the
observed embryos presented an altered phenotype (figure 4.8). Although mismatch controls
that had no effect on vascular development were used, there is always concern about off-target
effects of the Ecscr-specific morpholino. While the underlying mechanism of these effects is
unknown, one well-described and relatively consistent phenotype is p53-dependent neural
toxicity, which is dose-dependent and has been estimated to be apparent in 15–20% of all
morpholinos when injected at standard efficacy doses (Bedell et al., 2011). A possible solution
is to co-inject a p53-targeting morpholino, to eliminate this toxicity. Another common
phenotype is known as the “monster phenotype”, where embryos display overall severe
deformities, such as shortened and gnarled tails, massive body curvatures and small heads and
eyes (Bedell et al., 2011). Minimum morpholino doses that would cause a vascular-only
phenotype were carefully optimised, to avoid non-specific morphological abnormalities. Most
of the embryos injected displayed overall normal anatomy and morphology. Therefore, any
embryo with abnormal morphology was considered a non-specific effect and was not used
when counting embryos and assigning them to the various intersegmental vessel defects
categories. Furthermore, to assess the integrity of the mesoderm, where endothelial cells derive
from (Gilbert, 2006), in situ hybridization was performed for MyoD, which shows normal
somites in morpholino-injected embryos (figure 4.12). To additionally attest Ecscr specificity
of the morpholinos, these were co-injected with Ecscr mRNA, which has resulted in the rescue
of the phenotype towards milder defects or no abnormal vasculature (figure 4.9).

138
In the developing zebrafish embryo angioblasts arise from the lateral plate mesoderm at the 5-
somite stage (Gilbert, 2006). Then, they migrate to the midline and form the dorsal aorta and
cardinal vein by vasculogenesis. A recent study (Herbert et al., 2009), however, suggests that
only the dorsal aorta is formed by vasculogenesis from a common precursor vessel and the
cardinal vein is formed by venous fated endothelial cells that segregate and migrate ventrally.
Subsequently, intersegmental vessels sprout from the dorsal aorta and cardinal vein by
angiogenesis, forming the dorsal longitudinal anastomotic vessels. Haemangioblasts are the
common precursors of endothelial cells, haematopoietic cells and the cells that form the heart
tube. After trans-differentiation and migration, each of these lines expresses specific markers.
Friend leukaemia integration (fli1) is expressed only in the endothelial lineage, and ephrin B2a
(Efnb2a) and ephrin 4 (Eph4) are arterial and venous markers, respectively. Transcription
factors such as stem cell leukaemia (Scl) or Gata1 are markers for the erythroid lineage. Blood
cell development occurs in two phases, termed primitive and definitive haematopoiesis. The
first one is transitory and occurs in the blood islands in the ventral mesoderm close to the yolk
sac and the latter takes place in the mesodermal region surrounding the aorta (Davidson and
Zon, 2004). Given this common origin of vascular endothelial cells and blood cells, the effect
of Ecscr loss could be evaluated in haematopoiesis by in situ hybridization using Ecscr
morpholino injected embryos and haematopoiesis specific RNA probes.
The intersegmental vessels are known to sprout from both dorsal aorta and cardinal vein. Using
specific markers for artery and vein endothelial cells, the major trunk vessels seem to be intact
when Ecscr is depleted (figure 4.12), although these observations need to be repeated and
confirmed carefully. Therefore, Ecscr may be more important for angiogenesis (the formation
of new blood vessels from pre-existing ones) than it is to vasculogenesis. However, Ecscr is
present in zebrafish at all times (as the transcript was detected from the 1-cell stage) and
139
morpholino knockdown studies by Verma et al. (2010) have shown that loss of this protein
results in slower migration of the angioblasts to the midline, which is part of vasculogenesis,
not angiogenesis. It is possible that there are proteins with a redundant function, or that can be
upregulated to compensate for the loss of Ecscr at this stage, as vascular development is not
arrested. Because it is maternally expressed, it may have other unknown roles in early
development, as it may regulate the availability of filamin A, which is involved in a multitude
of processes (Zhou et al., 2009). Also, other binding partners have recently been discovered,
such as moesin (this study) and cIAP (Ikeda et al., 2009). Survivin, a member of the IAP family
conserved in zebrafish, has been demonstrated to be an essential regulator of neurogenesis,
vasculo-angiogenesis, haematopoiesis and cardiogenesis (Delvaeye et al., 2009; Ma et al.,
2007). Regarding angiogenesis, it would be interesting to keep observing the morpholino-
injected Tg[Fli:EGFP] embryos over time to assess if the loss of Ecscr causes permanent
damages in the vasculature. Also, the role of the second transcript of Ecscr that is only produced
in the embryo from 12 to 30 hpf with a peak that coincides with intersegmental vessel sprouting
should be investigated. For that, a translation-blocking morpholino could be used to abolish all
Ecscr expression, in conjunction with mRNA specific for either transcript. This would evaluate
if they have distinct roles at different stages. Additionally, a morpholino could be designed to
specifically eliminate this transcript. Similar studies, as well as protein interaction studies could
be performed in HUVECs using both proteins, to possibly uncover distinct binding partners
and pathways in an isoform-dependent manner.
In addition to visually assessing the effects of Ecscr loss via morpholino injection, the Ecscr
transcript and protein levels were also monitored. PCR products were visualised on an agarose
gel, which showed the absence of Ecscr in embryos injected with the 5’ UTR morpholino and
a smaller transcript in splice morpholino injected embryos compared to controls (figure 4.11).

140
Sequencing of this band shows lack of exon 6, which was expected, as the morpholino binds
between exon 5 and intron 5, resulting in mis-splice between exons 5 and 6. Verma et al. (2010)
have performed the same experiment for younger embryos and have observed several bands
smaller than the original transcript, instead of just one. This can be due to the fact that embryos
at different developmental stages process the transcript differently or respond to the
morpholino in a distinct manner. Another possibility is that they may have used more cDNA
template and therefore detected low copy transcripts that were not observed in the present
study. In order to detect the zebrafish protein, that was shown to display the same pattern as
the transcript (figure 4.10), a rabbit polyclonal antibody was generated from a fusion protein
containing maltose binding protein and zebrafish Ecscr intracellular domain. Before doing so,
the polyclonal antibody against human ECSCR was tested, but failed to recognise the zebrafish
protein (figure 4.5). Relatively few zebrafish antibodies are available, so usually the first step
is to identify antibodies raised for other species that cross-react with the zebrafish antigen
(Akhtar et al., 2009). Typically, a panel of different antibodies can be tested, but at the time
our group possessed the only available anti-ECSCR antibody, which had also been custom
made from ECSCR-GST produced in our laboratory. Having an antibody that recognises the
zebrafish protein provides the opportunity for further zebrafish studies, such as co-
immunoprecipitation, immunofluorescence and even the possibility of it working as a blocking
antibody.
4.5.3 Further directions
A recent study in zebrafish has shown that moesin 1 knockdown results in intersegmental
vessel sprouting and lumen formation defects. Furthermore, this has led to the loss of VE-
cadherin in cell-cell junctions. During embryonic angiogenesis, the primary lumen elongates
along cell-cell junctions and moesin 1 is enriched in intracellular vacuoles that fuse with the
141
luminal membrane during expansion of the primary lumen (Wang et al., 2010). In the future,
Ecscr morpholino injected zebrafish embryos could be analysed in greater detail and stained
for VE-cadherin, as Ecscr knockdown results in intersegmental vessel formation disruption and
ECSCR has been shown to be present at cell-cell adhesions and interacts with moesin (Shi et
al., 2011; this study). Although the initial staining (that needs repeating) for VE-cadherin in
HUVECs where ECSCR was knocked down shows that VE-cadherin doesn’t seem to change
(figure 3.6), this in vitro model does not contain the rich pro-angiogenic environment that the
sprouting vessels are exposed to in vivo. This difference could be essential to uncover a role
for Ecscr in vivo that cannot be easily reproduced in vitro.
The tg[fli:GFP::gata1:dsRed] zebrafish transgenic line displays green vessels (GFP-tagged
Fli1) and red erythrocytes (dsRed-tagged gata1) (Gering and Patient, 2001). Using time-lapse
fluorescence microscopy imaging of this line, the defects in vascular development in these
embryos can be imaged and therefore any flow disturbances or missed effects in
haematopoiesis can be analysed. Time-lapse high magnification imaging of tip endothelial
cells in sprouting intersegmental vessels from controls and embryos lacking Ecscr could
provide insights on the impact this molecule on, for example, filopodia (number, length,
turnover), or cell-cell interactions.
142
5 PRODUCTION AND
PRELIMINARY
CHARACTERIZATION OF AN
ECSCR KNOCKOUT MOUSE

143
5.1 Introduction
In the previous chapter, RNA antisense oligonucleotides, morpholinos, were used to assess the
role of ECSCR in angiogenesis. Morpholino-mediated knockdown of genes is a quick and
relatively easy and cheap way of obtaining a fast answer that has been largely used in the
zebrafish model. However, these changes are neither permanent nor complete. Homologous
disruption has not yet been found to be efficient in zebrafish, mainly because of the difficulty
in isolating and cultivating ES cells from this organism (Wienholds and Plasterk, 2004). To
overcome this barrier a new gene targeting approach is starting to be used in zebrafish,
employing synthetic zinc finger nucleases (Doyon et al., 2008; Ekker 2008; Meng et al., 2008).
Nevertheless, the mouse is still the most widely used model to study the function of genes and
to model human disease. As it is a mammal, it is closer to humans than the zebrafish is.
Presently, the International Knockout Mouse Consortium (IKMC), that comprises large-scale
efforts from the Knockout Mouse Project (KOMP), European Conditional Mouse Mutagenesis
(EUCOMM), North American Conditional Mouse Mutagenesis Project NorCOMM and the
International Gene Trap Consortium, aims to mutate all protein-coding genes in the mouse
using C57BL/6 embryonic stem (ES) cells. They have employed a selection of techniques, such
as gene traps and conditional and non-conditional gene targeting strategies. In the past,
researchers would make their own constructs, with the desired particularities or they would be
available from heterogeneous sources, such as BayGenomics. This consortium of research
groups focuses mainly on genes relevant to cardiovascular and pulmonary development and
disease (Stryke et al., 2003). At the KOMP, by creating the same types of constructs for
different genes, the project aims to generate alleles that are as uniform as possible, to allow
accurate comparisons. However, because of the nature of the studies to be performed or the
severity of effects, constructs made available allow the creation of both null and conditional

144
knockouts. If nothing is known about the function of a gene or the severity of its absence is not
thought to be lethal, a null knockout can be generated. The insertion of a reporter gene, such
as β-galactosidase, allows the visualization of where the gene of interest would be expressed
(Austin et al., 2004).
In Europe, the EUCOMM is contributing to the mouse genome mutagenesis programme by
establishing and integrating mutagenesis platforms, phenotyping units, gene expression
resources, storage and distribution centres and bioinformatics resources. They are applying
conditional strategies for the rapid creation of conditional alleles in ES cells (Auwerx et al.,
2004).
In recent years many important advances have been made in improving strategies and
efficiency of gene targeting and gene trapping. The KOMP provides constructs for these two
strategies, transfected into ES cells. Gene targeting comprises the insertion of a drug-resistance
selection cassette into a specific region of the genome by homologous recombination, thus
resulting in the interruption of the target gene. Gene trapping is achieved by random integration
of a promoterless reporter construct and is restricted to genes expressed in ES cells (Skarnes,
2005). A clever strategy developed by Friedel et al. (2005) and named “targeted trapping”
combines both. This was adopted by the KOMP to make their constructs to produce null
knockouts. The null knockout produced for the present study was prepared using ES cells
containing such a construct. There are two homologous recombination arms, 5’ and 3’, so that
the sequences contained between them can be integrated into determined specific locations in
the genome (figure 5.1). In the case of the Ecscr construct, the whole cassette was inserted
between the 24 first nucleotides of exon 1 (in the untranslated (UTR) region) and the first 6
nucleotides of exon 9, immediately before the stop codon. A promoterless β-galactosidase open
reading frame followed by a simian virus 40 polyadenylation signal (SV40 PolyA) will both
145
interrupt the gene and indicate in which cells that has happened upon LacZ staining. This
happens because the inserted promoterless beta- galactosidase will be expressed under the
control of the Ecscr promoter. The SV40 polyA has the ability to terminate transcription and
add a polyA tail to mRNA (Li et al., 2012). In order to select which ES cells were successfully
transfected with the construct, it contains a Neomycin-resistance (Neo) cassette with an mPkg
polyA that has the same function as the SV40 polyA. This cassette is under the control of a
hybrid promoter between human ubiquitin C (that permits its expression in mammalian cells,
such as ES cells) and a prokaryote promoter EM7, that allows the expression in bacteria for
positive selection when the construct is being made and purified before going into the ES cells
(Liu et al., 2003). The Neo cassette (promoter, open reading frame and polyA) is flanked by
two loxP sites in the same orientation. This allows for further removal of the cassette, if
required, using a Cre recombinase. LoxP sites (locus of X-over P1) from bacteriophage P1 are
a 34 base pair long region consisting of two flanking 13 base pair palindromic sequences and
an 8 base pair central sequence that is asymmetric. If the two sites are in the same orientation,
the recombinase will produce a deletion; if the LoxP sites are in opposite orientations, then an
inversion will be obtained (Nagy, 2000).
Once a null knockout mouse is produced using the method mentioned above, the alteration will
be permanent. However, if the knockout is lethal, either embryonically or during any other time
early in life, some studies may not be possible. To overcome this problem, as well as allow
gene function studies in mice under challenging conditions, in specific cell types or age,
conditional knockout mice can be created instead. The KOMP provides constructs to produce
conditional gene knockout in mice that they termed “knockout-first”. As for the previous
construct, two homologous recombination arms are present (figure 5.2). This is a multi-purpose
construct, that in the first instance works like the null one and a LacZ cassette will report if and

146
where the trap occurs. However, it differs in the way the LacZ cassette is inserted, as RNA
processing signals have been added to the design. The promoterless beta-galactosidase cassette
with its polyA tail starts with a splice acceptor from the gene engrailed homeobox 2, which
allows it to be spliced onto the preceding mouse exon. In the case of the construct available for
Ecscr, it would be exon 1. To prevent an accidental in frame stop codon between the mouse
sequence for the gene of interest and the lacZ open reading frame (which would result in no
beta-galactosidase expression), or a frameshift, or a fusion protein that might not be active, an
encephalomyocarditis virus (EMCV) internal ribosomal entry site (IRES) has been included.
This ensures that, regardless of the transcript, the enzyme will be fully and independently
produced and can act as a reporter in the cells where the protein of interest is ablated. The Neo
cassette under the control of the human beta-actin promoter and with its polyA tail has the same
function as that mentioned for the null construct. The construct described is a modification of
the one developed by Testa et al. (2003).
In order to produce a conditional knockout mouse, the two cassettes (LacZ and Neo) have been
flanked by FLP (flipase) recognition target (FRT) sites. Flipase is a recombinase that works in
the same fashion as Cre, but recognises a different sequence. Upon removal of the cassette, the
mice need to be subsequently crossed with a Cre-expressing deleter strain to finally remove the
genomic information between the LoxP sites.

147
Figure 5.1 - Targeting trap construct produced by the KOMP, used to make an Ecscr
null knockout mouse.
In this type of construct there are two homologous recombination arms, 5’ and 3’, so that the
sequences contained between them can be integrated into determined specific locations in the
genome. In the case of the Ecscr construct, the whole cassette was inserted between the 24 first
nucleotides of exon 1 (in the untranslated region) and the first 6 nucleotides of exon 9,
immediately before the stop codon. A promoterless β-galactosidase open reading frame
followed by a simian virus 40 polyadenylation signal will both interrupt the gene and indicate
in which cells that has happened upon LacZ staining. The construct also contains an ES cell
selection Neomycin-resistance (Neo) cassette. The two loxP sites flanking this cassette allow
for further removal, if desired, using a Cre recombinase.
βGal – beta-galactosidase; pA – polyadenylation signal; hUBC – human ubiquitin C promoter
(the box represents a hybrid promoter, containing mostly sequence from hUBC promoter and
67 nucleotides from the EM7 promoter); Neo – neomycin resistance cassette; red triangles –
loxP sites; vertical black rectangles – exons.

148
Figure 5.2 - Knockout-first allele construct produced by the KOMP, used to make a
conditional knockout mouse.
In this type of construct two homologous recombination arms are present. When it is introduced
into cells, it produces a null knockout and a LacZ cassette will report if and where the trap
occurs. The promoterless beta-galactosidase cassette will be spliced onto the preceding exon
due to the insertion of a splice acceptor. An internal ribosomal entry site was added so that the
enzyme produced is not fused to any fraction of the trapped protein. This construct also
comprises a Neo cassette for ES cell selection. To produce a conditional knockout mouse, the
two cassettes are flanked by flipase recognition target (FRT) sites. Upon their removal, the
mice will subsequently be crossed with a Cre-expressing deleter strain to finally remove the
genomic information between the LoxP sites.
En2 SA – engrailed homeobox 2 splice acceptor; IRES – internal ribosomal entry site; βGal –
beta-galactosidase; pA – polyadenylation signal; βact – human beta-actin promoter; Neo –
neomycin resistance cassette; red triangles – loxP sites; green rectangles – FRT sites; vertical
black rectangles – exons.

149
There are currently two effective flipase deleter strains available. The first, Flpo, was produced
in a C56BL/6 background with a codon-optimised Flpo gene, which showed higher
recombination efficacy compared to Flpe deleter mice. A complete removal of the FRT-flanked
Neo cassette was observed in the first generation, that was then passed on to further generations
(Wu et al., 2009). If the construct used has the FRT sites in opposite orientations, then an
inversion rather than a deletion is necessary to make a conditional knockout mouse. For that
purpose, a ROSA26Flpo deleter strain has been successfully created, using the codon-
optimised Flpo at the ROSA26 locus. Like the previous one, this line is also more efficient than
the traditional Flpe (Raymond and Soriano, 2010). As for Cre deleter strains, there are many
available, that produce constitutive knockouts in specific tissues or inducible ones, activated
by drugs. This offers many possibilities and applications.
5.2 Ecscr expression in mouse
In order to assess if Ecscr displayed the same endothelial specific distribution as in zebrafish
and human tissues, an RNA in situ hybridization was performed. The mouse protein seemed to
be expressed in the trunk, intersegmental and brain vasculature (figure 5.3). Although there
was no staining with the sense probe (figure 5.3 A), there is much background produced with
the antisense probe, which needs optimization. However, the observed pattern was similarly
described by Ikeda et al. (2009).
5.3 Initial attempt produce a conditional knockout mouse
As Ecscr seemed to have a vascular distribution in the mouse, a conditional knockout was
attempted, to characterise the role of the protein using this model. The original project
150
encompassed the in-house production of the construct and its subsequent electroporation into
ES cells.
A construct was designed as shown on figure 5.4. In short, a SnaBI-AgeI fragment from the
mouse BAC clone bMQ121H10 would be cloned into the SmaI site of pBluescript by blunt-
end ligation. This fragment consists of 5.2 kb of genomic DNA upstream of the first exon, all
9 exons and 7.3 kb of genomic DNA downstream of the last exon. Unique restriction enzyme
sites within this fragment were selected to incorporate loxP sites as well as a neomycin
selection cassette.
To delete the exons 1-7, a loxP site would be inserted at Hpy99I site before exon-1 and at PmeI
site after exon-7. A neomycin cassette flanked by FRT sites would be excised from pMyb3.0H
vector (provided by Dr. Paloma Garcia, University of Birmingham) and cloned into the AfeI
site after exon-9 by blunt-end ligation (Garcia et al., 2005). A thymidine kinase (TK) gene
would be cloned into the XhoI site of pBluescript. The targeting construct would be linearized
with NotI (which does not cut the 20.6 kb Ecscr fragment) before electroporation into the ES
cells.
To detect homologous recombination, two probes (one each at upstream and downstream of
the recombination arm) could be used. To do the southern blot using the upstream probe, the
genomic DNA would be digested with ClaI. For detection using the downstream probe the
DNA would be digested with MfeI.
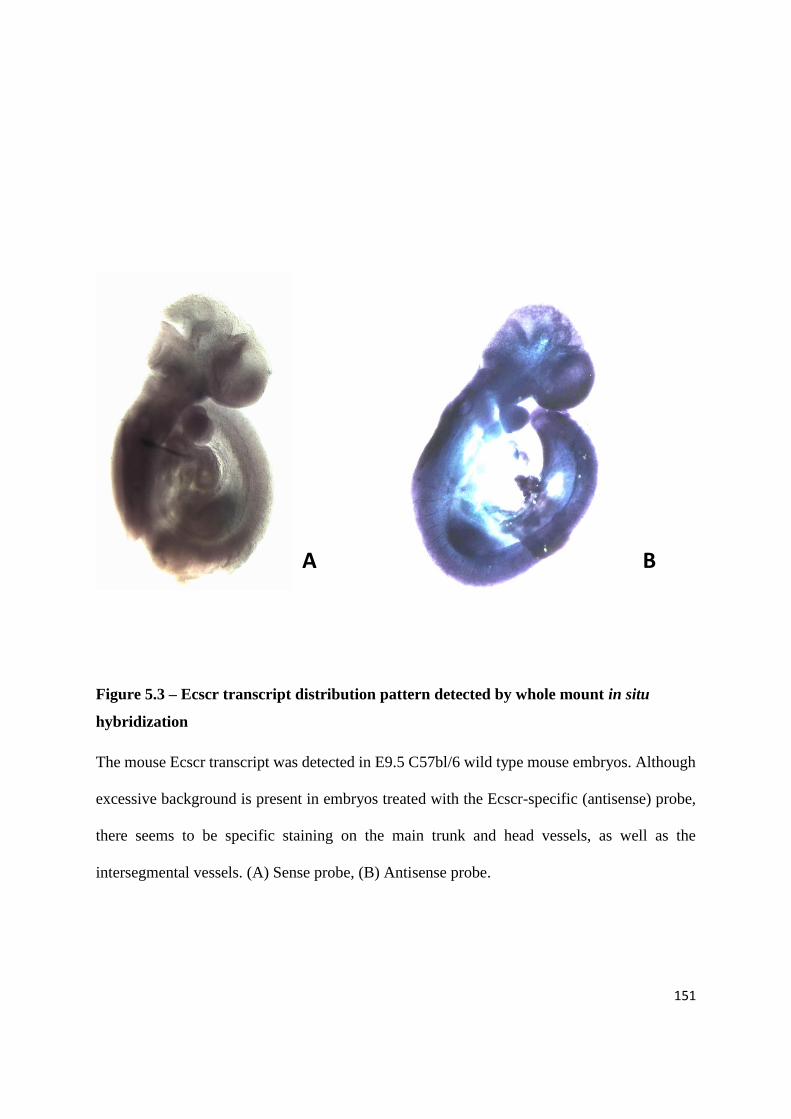
151
Figure 5.3 – Ecscr transcript distribution pattern detected by whole mount in situ
hybridization
The mouse Ecscr transcript was detected in E9.5 C57bl/6 wild type mouse embryos. Although
excessive background is present in embryos treated with the Ecscr-specific (antisense) probe,
there seems to be specific staining on the main trunk and head vessels, as well as the
intersegmental vessels. (A) Sense probe, (B) Antisense probe.
A B

152
The strategy described above was put into practise, but all the attempts to obtain the fragment
of interest from the BAC have failed. Both restriction digestion and combined PCR
amplification and ligation were not successful in obtaining the desired fragment. Despite
Professor Gerard Eberl’s (Pasteur Institute, France) advice on BAC extraction, purification and
handling, it was impossible to even amplify a small fragment (800 bp) from the original vial
by PCR-colony.
As an alternative, embryonic stem (ES) cells were purchased from the Sanger Institute to
generate a conditional knock out mouse for Ecscr. These cells for the conditional knockout
mouse were produced by the knockout mouse project – KOMP
(http://www.knockoutmouse.org). The line JM8A1.N3 is subcloned from JM8 parental line,
derived from C57BL/6N mice. These ES cells have been modified to correct the black mutation
on the Agouti allele and originated an Agouti coat colour (Pettit et al., 2009). This work has
been carried out at the University of Birmingham’s MRC centre for immune regulation by the
centre’s animal resource manager Andrea Bacon.
Recipient blastocysts were harvested from C57BL/6OlaHsd pregnant black mice and injected
with the JM8A1.N3 ES cells containing a construct with potential to obtain an Ecscr
conditional knockout (figure 5.2). In total 160 correctly injected blastocysts were implanted in
the uteri of CD-1 pseudopregnant white mice (16 per mouse, 8 on each side). Only four
chimeras were born in total, 3 males and one female. The coat colour chimerism was about
50% for each mouse, but no germline transmission was observed. One of the males has never
successfully had a female producing a plug and a second one had to be culled before germline
testing, due to severe skeletal malformations (the necropsy revealed a protruding xyphoid
process and a much arched spine when compared to a sex and age-matched littermate). The

153
Figure 5.4 - Diagram showing the original construct design to generate a conditional
Ecscr knockout mouse.
To make this construct, a fragment consisting of 5.2 kb of genomic DNA upstream of the first
exon, all 9 exons and 7.3 kb of genomic DNA downstream of the last exon would be excised
and inserted into pBluescript. Unique restriction enzyme sites within this fragment were
selected to incorporate loxP sites, as well as a neomycin selection cassette. To detect
homologous recombination by southern blot using the upstream probe, genomic DNA would
be digested with ClaI. For detection using the downstream probe the DNA would be digested
with MfeI. The wild type and transgenic fragments would have different sizes, depending on
whether the cassette had been incorporated or not.
βact – beta-actin promoter; pA – polyadenylation signal; Neo – neomycin resistance cassette;
red triangles – loxP sites; vertical black rectangles – exons; green rectangles – FRT sites
154
remaining male and the female have only ever produced descendents with a black coat.
In order to assess that the construct had been built according to its design, critical regions were
amplified by PCR and sequenced (figure 5.5, table 5.1). Samples from FVB/N white mice and
C57BL/6OlaHsd black mice were used as wild type. All the tested regions of the construct
were successfully amplified and identified. However, since there was no germline transmission
observed, the ES cells were compared to those used to make a full knockout mouse in our
laboratory, which have given rise to germline transmission (for Clec14a). Overall, the
morphology of both types of ES cells was similar, as well as the chromosome spreads (both
contained 40 chromosomes) (Figure 5.6).
In the KOMP website, a different type of clone was available for purchase. This is the one that
was used to create Clec14a null knockout mice and its design is less complex. Basically, upon
homologous recombination, the whole Ecscr gene will be replaced with a LacZ cassette (figure
5.1). The genotyping strategy is also simpler, as depicted on table 5.4. This clone has produced
germline transmission, as shown on the next chapter.

155
Figure 5.5 - Example of the PCR strategy used to identify the different components of
the knockout-first construct.
PCR 1 was performed using the pair of primers 3armF + 3armR (table 5.1). This corresponds
to a region in the wild type genome. As the ES cells are heterozygous, all there samples were
positive. PCR2 refers to a region within the cassette introduced by homologous recombination,
amplified with the pair Universal5F + Common-n2R. Therefore, only the ES cells provided
amplification of a band.
A
A
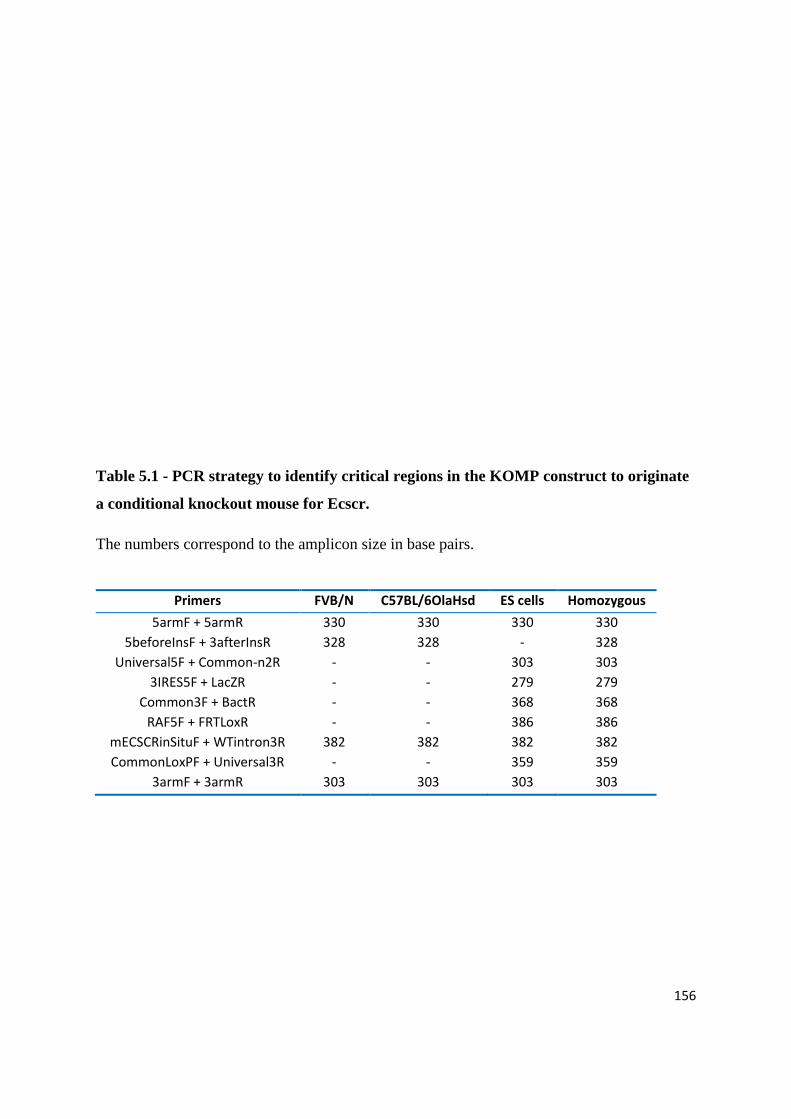
156
Table 5.1 - PCR strategy to identify critical regions in the KOMP construct to originate
a conditional knockout mouse for Ecscr.
The numbers correspond to the amplicon size in base pairs.
Primers FVB/N C57BL/6OlaHsd ES cells Homozygous
5armF + 5armR 330 330 330 330
5beforeInsF + 3afterInsR 328 328 - 328
Universal5F + Common-n2R - - 303 303
3IRES5F + LacZR - - 279 279
Common3F + BactR - - 368 368
RAF5F + FRTLoxR - - 386 386
mECSCRinSituF + WTintron3R 382 382 382 382
CommonLoxPF + Universal3R - - 359 359
3armF + 3armR 303 303 303 303

157
Figure 5.6 - Comparison between ES cells purchased from the KOMP containing
constructs for Clec14a and ECSCR knockout mice.
ES cells containing a conditional construct for Ecscr were compared to those used to make a
full knockout mouse in our laboratory, which have given rise to germline transmission (for
Clec14a). Overall, the morphology of both types of ES cells was similar, as well as the
chromosome spreads (both contained 40 chromosomes).
158
5.4 Producing a null Ecscr knockout mouse
ES cells containing the conditional knockout-first construct (figure 5.2) were initially bought
from the KOMP, as they offer the possibility of making both a null and a conditional knockout.
However, the number of chimeras produced was very low (only 4 in total, having one suddenly
died) and there was no germline transmission. Alternatively, ES cells containing the construct
to produce a null Ecscr knockout mouse (figure 5.1) were purchased.
These ES cells were expanded and injected into blastocysts by the MRC transgenic facility
manager at the University of Birmingham, Dr. Andrea Bacon. The ES cells derived from the
(black) C57BL/6NTac strain, so they were injected into blastocysts from an albino black 6
strain B6(Cg)-Tyrc-2J/J (or B6-albino) and implanted into the uteri of pseudopregnant females
also from the latter strain. As, in very simplistic terms, black is dominant over white, the degree
of chimerism observed in the mice’s coat colour is an indicator of how well the ES cells have
integrated into the embryos. The higher the percentage of black compared to white, the higher
the probability of germline transmission. To test for germline transmission two male chimeras
with over 50% black coat were chosen to be crossed with B6-albino females. One male has
produced several litters of all-white pups and another one has produced both white and black
pups, which confirms germline transmission for the latter male, but not the former.
A detailed description of the litters produced by the male chimera is shown on table 5.2. Ten
litters were produced, with 25 black pups in total. 60% of the pups were heterozygous and 40%
were wild type. The sex ratio was 48% males and 52% females. Of the heterozygous, 66.7%
were males and 33.3% females. Interestingly, as more litters were produced, the number of
black pups in each increased (table 5.2).
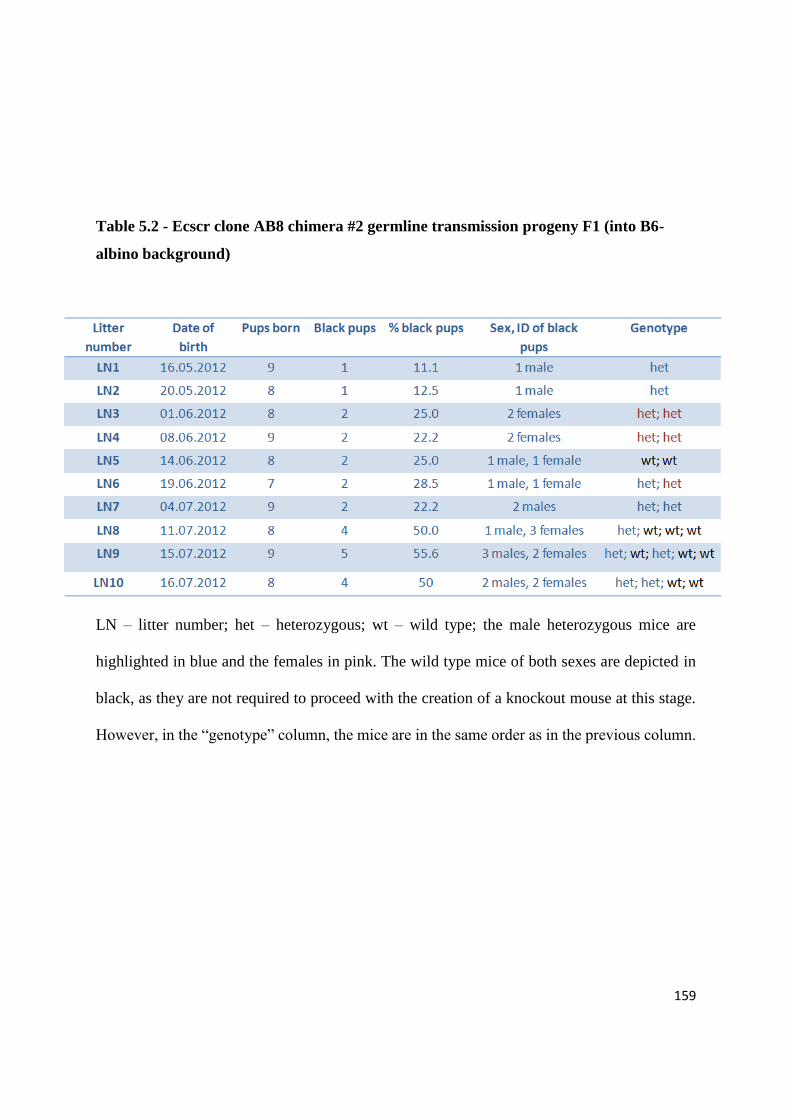
159
Table 5.2 - Ecscr clone AB8 chimera #2 germline transmission progeny F1 (into B6-
albino background)
LN – litter number; het – heterozygous; wt – wild type; the male heterozygous mice are
highlighted in blue and the females in pink. The wild type mice of both sexes are depicted in
black, as they are not required to proceed with the creation of a knockout mouse at this stage.
However, in the “genotype” column, the mice are in the same order as in the previous column.
160
Once the heterozygous mice were old enough to breed (6-8 weeks), they were crossed using
males and females from different litters, as depicted on table 5.3. Not all litters have produced
knockout mice but, once positive males and females are mature, they will be crossed to produce
a pure knockout colony. As this work is currently ongoing, it is yet unknown if the knockout
mice can survive until reaching maturity and old age, if they are fertile and what phenotype the
absence of Ecscr causes.
5.5 Genotyping strategy
The most well-known inbred mouse strain is C57BL/6. From this one, nine other substrains
have been created, including the C57BL/6J (from the Jackson Laboratory) and C57BL/6N
(from the National Institutes of Health). A study has found genetic differences between these
two major substrains while genotyping for single nucleotide polymorphisms (SNP) at eleven
loci. Even among C57BL/6J substrains there are more substantial differences. For example,
the same group has found a deletion of exons 7-11 from the nicotinamide nucleotide
transhydrogenase gene in C57BL/6J strains and 1,446 SNPs genotyping among seven C57BL/6
strains (Mekada et al., 2008). For this reason, the first step before injecting the ES cells into
B6-albino blastocysts was to check that the Ecscr gene was present in the strain of choice
(C57BL/6JOlaHsd). A positive band obtained by PCR served both to optimise the PCR
conditions for genotyping and to be able to proceed, as Ecscr is present in this strain.
PCR of small fragments from genomic DNA (up to 400 base pairs) was chosen as the
genotyping strategy, over the more traditional southern blot. The tissue samples used for
genotyping were ear clippings (that serve this purpose, as well as numbering of the pups).
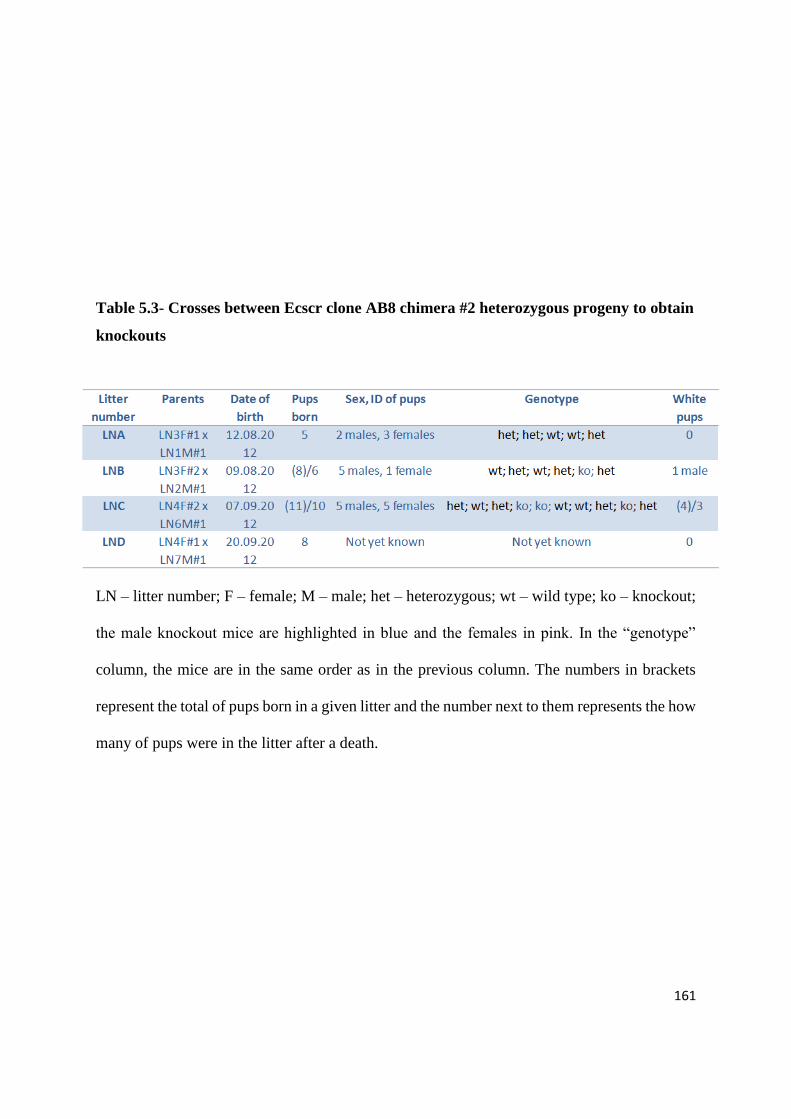
161
Table 5.3- Crosses between Ecscr clone AB8 chimera #2 heterozygous progeny to obtain
knockouts
LN – litter number; F – female; M – male; het – heterozygous; wt – wild type; ko – knockout;
the male knockout mice are highlighted in blue and the females in pink. In the “genotype”
column, the mice are in the same order as in the previous column. The numbers in brackets
represent the total of pups born in a given litter and the number next to them represents the how
many of pups were in the litter after a death.

162
Table 5.4- Genotyping strategy
The primer combinations and respective expected amplicon sizes for wild type, heterozygous
and knockout mice are presented.
WT – wild type; Het – heterozygous; KO – knockout; bp – base pairs.

163
Figure 5.7 - Example of genotyping results for wild type, heterozygous and knockout
mice
In order to determine zygosity, a biopsy from each pup has to be submitted to PCR analysis for
both wild type and cassette bands. Wild type mice are expected to have only the wild type
band, samples from knockout mice should contain only the cassette band and heterozygous
will have both. The wild type band is the resulting amplicon from mECSCR-in situF and
WTintron3R primers and the cassette band is obtained using the primers 5armF and ULacZ-
Rev. DNA from the ES cells used to produce the chimeras (heterozygous) was extracted and
submitted to PCR analysis, as a positive control to check band sizes.
800
1500
Ban
d s
ize
(bp
)
1000
600
400
1000
600
400
800

164
Primers were designed to amplify both wild type bands (present in wild type and heterozygous
mice) and cassette bands (present in heterozygous and knockout mice) (table
5.4). The primers to amplify the cassette bands were planned so that one of them would bind
to the mouse genomic sequence and the other would bind to a region in the cassette. As they
should provide the same answer, one pair for each side of the cassette was tested. The
combination of UNeo-Fw + mECSCR-in situR provided a single, clearer band, compared to
5armF + ULacZ-Rev, so this was chosen for further genotyping. The ES cells were used to
optimise the primers for the cassette.
As illustrated on figure 5.7, both bands are needed to interpret the genotyping results. The wild
type mice should only have the wild type band (as the cassette was engineered and inserted by
homologous recombination), the heterozygous mice should have both bands, as they have one
wild type allele and another one that is modified. The ES cells purchased from the KOMP are
also heterozygous. The knockout mice should have a complete replacement of the wild type
band by the cassette.
5.6 Monitoring and mapping the replacement of Ecscr by beta-
galactosidase
As previously discussed, the knockout-first construct includes a gene trap that expresses beta-
galactosidase when and wherever it replaces the target gene. The location of this enzyme can
easily be identified by LacZ staining. Litter number C (table 5.3) was suddenly left orphan and
rejected by a possible foster mother. As the pups were too old to foster and too young to survive
on their own (11 days post-natal), they had to be culled. This provided an opportunity to
perform a LacZ stain. Briefly, after genotyping the pups (results shown on table 5.3) the heart

165
and lungs were removed and rapidly fixed. Then, they were incubated with X-Gal, a substrate
for beta-galactosidase, fixed overnight and examined under the microscope.
The degradation of X-gal produced a blue product, easily identifiable. It was possible to see a
dose-dependent effect, and no stain was observed for the wild type organs, some staining was
observed in the organs from heterozygous mice and strong staining was noted in organs
belonging to knockout mice. The lungs of the knockout mice were very strong blue (figure
5.8). After being stained for LacZ activity, the lungs were included in paraffin, sectioned and
stained with hematoxylin and eosin to analyse tissue morphology. Lungs from knockout mice
seemed to be denser, containing more cells and less air space than those from wild type (figure
5.9). As for the hearts, a very interesting distribution pattern for the Ecscr has emerged (figure
5.10). It doesn’t seem to be present in large vessels and it seems to be found only on (some but
not all) small capillaries around the heart. Also, in the hearts from knockout and, to a lesser
extent, heterozygous mice, there seems to be an asymmetry, where the right atria look enlarged.
5.7 Monitoring the Ecscr protein and transcript amounts in wild
type, heterozygous and knockout mice
To further confirm the deletion of Ecscr, a small sample of lung, kidney, liver and blood was
taken from a specimen of each category. The tissues were macerated using a homogeniser and
the total protein was extracted and analysed by western blot, using the anti-human ECSCR
polyclonal antiserum. Unfortunately, in spite of the homology between the human and mouse
proteins, this antiserum didn’t seem to detect the murine version. Alternatively, small samples
of lung had also been taken and snap frozen. Total RNA was extracted, converted into cDNA
and a qPCR (real-time quantitative polymerase chain reaction) was performed. The data were
normalised to actin and are represented as relative expression compared to the wild type (figure
5.11). As observed for the colour gradient in the LacZ staining, Ecscr is no longer present in

166
the lungs from knockout mice and it is present in approximately half the amount of the wild
type in heterozygous mice. As these are preliminary data, only one specimen per category was
analysed for qPCR. Each sample was analysed in triplicates for Ecscr and actin.
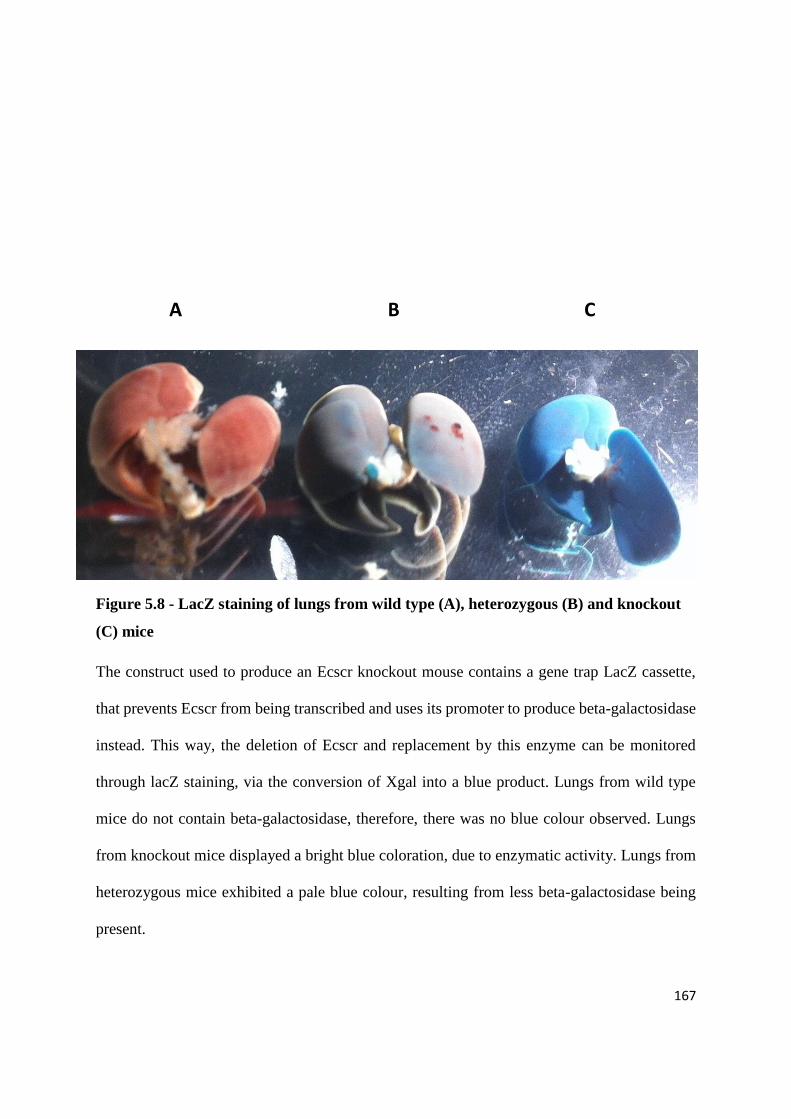
167
Figure 5.8 - LacZ staining of lungs from wild type (A), heterozygous (B) and knockout
(C) mice
The construct used to produce an Ecscr knockout mouse contains a gene trap LacZ cassette,
that prevents Ecscr from being transcribed and uses its promoter to produce beta-galactosidase
instead. This way, the deletion of Ecscr and replacement by this enzyme can be monitored
through lacZ staining, via the conversion of Xgal into a blue product. Lungs from wild type
mice do not contain beta-galactosidase, therefore, there was no blue colour observed. Lungs
from knockout mice displayed a bright blue coloration, due to enzymatic activity. Lungs from
heterozygous mice exhibited a pale blue colour, resulting from less beta-galactosidase being
present.
A B C

168
Figure 5.9 – Hematoxylin and eosin staining of lung paraffin sections from wild type
(A), and knockout (B) mice
After being stained for LacZ activity, the lungs were included in paraffin, sectioned and stained
with hematoxylin and eosin to analyse tissue morphology. Lungs from knockout mice seemed
to be denser, containing more cells and less air space than those from wild type.
Total magnification of the images on the left hand side is 2.5x and 7.2x on the right.
A
B

169
Figure 5.10 - LacZ
staining of hearts from wild type (A), heterozygous (B) and knockout (C) mice
As described on figure 5.4 for lungs, hearts from wild type, heterozygous and knockout mice were also
stained for LacZ activity. Wild type hearts have no blue stain, hearts from knockout mice show some
external vessels (but not all) stained in blue and heterozygous hearts display the same pattern as the
knockouts, with a weaker signal. The right atria of knockout mice and, to a lesser extent, heterozygous,
seem to be enlarged compared to those of wild type mice.
A
C
B
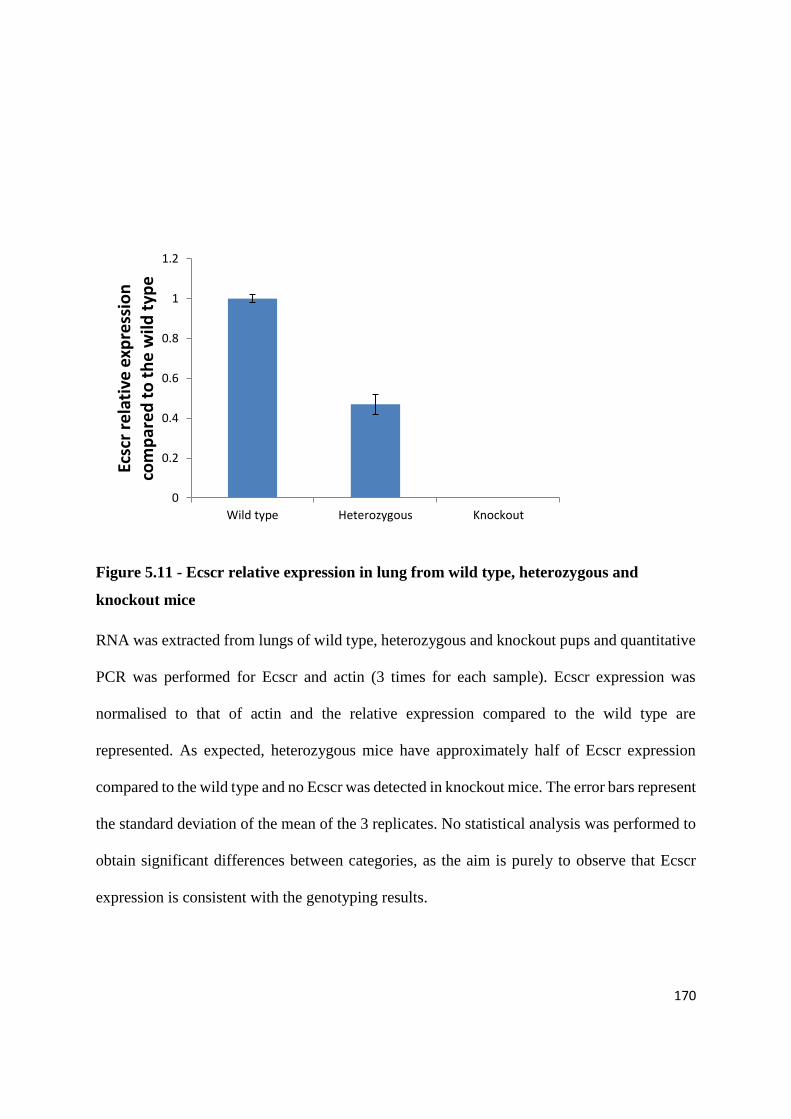
170
Figure 5.11 - Ecscr relative expression in lung from wild type, heterozygous and
knockout mice
RNA was extracted from lungs of wild type, heterozygous and knockout pups and quantitative
PCR was performed for Ecscr and actin (3 times for each sample). Ecscr expression was
normalised to that of actin and the relative expression compared to the wild type are
represented. As expected, heterozygous mice have approximately half of Ecscr expression
compared to the wild type and no Ecscr was detected in knockout mice. The error bars represent
the standard deviation of the mean of the 3 replicates. No statistical analysis was performed to
obtain significant differences between categories, as the aim is purely to observe that Ecscr
expression is consistent with the genotyping results.
0
0.2
0.4
0.6
0.8
1
1.2
Wild type Heterozygous Knockout
Ecsc
r re
lati
ve e
xpre
ssio
n
com
par
ed
to
th
e w
ild t
ype
171
5.8 Discussion
5.8.1 Ecscr transcript expression patterns in mouse E9.5 embryos
Initial results from Ecscr in situ hybridization of E9.5 wild type embryos show that the mouse
protein seems to be expressed in the trunk, intersegmental and brain vasculature (figure 5.3).
Ikeda et al. (2009) found a similar distribution using the same technique and also E9.5 embryos.
Their images for the entire embryo were even less clear than those in this thesis. They have
then sectioned the embryos, which revealed more conclusive staining results. These authors
described that Ecscr transcript is present in the intersegmental arteries, dorsal aorta and blood
vessels of the yolk sac. Furthermore, they have generated an antibody against mouse Ecscr,
which has detected the protein in bronchial epithelial cells, artery and vein in lung, as well as
blood vessels in spleen. In blood vessels, they claimed Ecscr is expressed in both endothelial
and smooth muscle cells. No further detail is provided regarding the age of the mice or what
artery(ies) or vein(s) have been stained.
The antisense probe has produced much background. This can be because the probe was too
concentrated, in which case it should be diluted for further experiments. Probes can be re-used
and tend to produce too much staining the first time they are used and work better in subsequent
cycles of usage. Also, the protocol optimised by Thisse and Thisse (2008) for zebrafish was
applied to mouse embryos. Because these are thicker and of different nature, they may not have
been completely digested, which may have resulted in incomplete penetration of the probe. A
protocol dedicated to mouse embryos should be applied, such as the one described by Piette et
al. (2008). This protocol is largely similar to that described for zebrafish, but contains
incubation times specific for the various mouse developmental stages and an additional
172
permeabilization step with RIPA buffer after the proteinase K digestion, which may contribute
for better results.
As Ecscr appeared to have an endothelial distribution, a knockout mouse model was generated
to study its role in vascular development.
5.8.2 Generation of an Ecscr knockout mouse model
In order to create an Ecscr knockout mouse model, different approaches were adopted, as it
was not a straightforward procedure. Firstly, a construct to obtain a conditional knockout
mouse was designed (figure 5.4). Exons 1-7 would be deleted, as loxP sites would be inserted
at Hpy99I site before exon-1 and at PmeI site after exon-7. A neomycin cassette flanked by
FRT sites (used to screen positive ES cells once electroporated with the linearized construct)
would be cloned into the AfeI site after exon-9 by blunt-end ligation (Garcia et al., 2005). The
design of this construct could have been improved by the insertion of a reporter gene, such as
β-galactosidase, which allows the visualization of where the gene of interest would be deleted
(Austin et al., 2004). At the time Ecscr expression in mouse embryos seemed to be endothelial-
specific, but the in situ hybridization technique had to be much improved to have a more
definitive answer (figure 5.3). Making a conditional knockout mouse meant that even if Ecscr
expression was not restricted to the endothelium, its role in endothelial cells could still be
studied by crossing these mice with, for example, the Tie-1-Cre delete strain. In these mice Cre
recombinase is expressed in endothelial cells of embryoid bodies and transgenic mice driven
by the Tie-1 promoter (Gustafsson et al., 2000). To confirm endothelial specificity, these mice
were crossed with Rosa26R reporter mice. The Rosa26R mice have the lacZ gene inserted into
the ubiquitously expressed Rosa locus that is preceded by a transcriptional stop cassette flanked

173
by loxP sites (Mao et al., 1999; Soriano, 1999). LacZ staining showed that the Tie-1-Cre
transgenic strain can efficiently direct deletion of floxed genes in endothelial cells in vivo
(Gustafsson et al., 2000). Another advantage of a floxed strain is the possibility of halting
expression of the gene of interest at a specific point in the animal’s life. This was achieved with
the creation of CreER inducible strains, where ligand-dependent Cre recombinases can be
activated by administration of tamoxifen to the animal, which binds to the oestrogen receptor
(ER) and prevents expression of the gene of interest. Cre is fused to a mutant ER that binds to
tamoxifen but not endogenous ligands and translocates into the nucleus upon tamoxifen
induction. CreER tissue-specific strains have also been produced (Feil et al., 2009).
The production of this construct was, however, unsuccessful, as all components were correctly
inserted into the backbone plasmid, but the genomic insert containing Ecscr full length and 5.2
kb of genomic DNA upstream of the first exon, as well as 7.3 kb of genomic DNA downstream
of exon 9 was not effectively excised or amplified to be included in the final construct. This
was probably due to inexperience and lack of expertise in this area. As an alternative strategy,
ES cells were purchased from the KOMP that contained a knockout-first construct, with the
potential to also generate a conditional knockout mouse (figure 5.2). This approach is less time-
consuming and potentially yields more successful results, as the constructs and ES cell
handling and electroporation are done by a team of experienced experts. The first step was to
confirm that indeed the construct had all the elements as described. For that purpose, several
PCR reactions were performed to amplify and sequence small key sequences such as LoxP
sites, LacZ cassette or the actual Ecscr gene (figure 5.5; table 5.1). As the identity of all of them
was confirmed, these ES cells were then injected into recipient blastocysts to generate
chimeras. The number of chimeras created was low and no germline transmission was
observed. In an attempt to understand why this strategy had failed, chromosome spreads were

174
done for these ES cells compared to ES cells containing a targeting trap construct used to
successfully produce Clec14a null knockout mice, under the guidance of Dr. Laura O’Neil
(University of Birmingham, UK). No evident abnormalities were observed (figure 5.6).
Generating transgenic mice from genetically modified ES cells injected into blastocyst hosts
produces chimeras that are only partially derived from the ES cells. These chimeras have to be
tested for germline transmission of the mutant features and then the offspring need to be further
crossed to obtain homozygosity. This is a long and expensive process and germline
transmission is not guaranteed. An alternative strategy was proposed by Poueymirou et al.
(2007): laser-assisted injection of transgenic ES cells into 8-cells embryos (rather than
blastocysts). This has efficiently yielded F0 generation mice that are fully ES cell-derived and
healthy, have 100% germline transmission and allow immediate phenotypic assessment
(Poueymirou et al., 2007). This alternative route could be explored by the University of
Birmingham transgenics unit, however it requires specialised equipment, training and high
level of skill.
Finally, ES cells containing a targeting trap construct to produce a null knockout mouse were
purchased from the KOMP (figure 5.1). Injection of these cells into blastocysts has produced
chimeras that yielded germline transmission of the engineered inserted cassette. The first
generation was heterozygous and by the time of completion of this thesis heterozygous mice
had just been crossed and produced the first homozygous pups (tables 5.2 and 5.3). To
distinguish between homozygous, heterozygous and wild type mice, a combination of two PCR
reactions had to be analysed (table 5.4; figure 5.7). Homozygous (knockout) mice had the
cassette interrupting Ecscr successfully inserted in both alleles, as confirmed by the presence
of an amplicon for the cassette and complete absence of the wild type band. This is because the
primers designed to detect the wild type band bind to a region that was replaced by the cassette

175
by homologous recombination. Conversely, in samples from wild type mice only the wild type
band is detected. This is because the cassette was engineered and its elements do not naturally
occur in the mouse genome. Heterozygous mice contain one wild type allele and one allele
where the cassette has been inserted by recombination. Therefore, both products are amplified
by PCR.
Apart from a less complex construct than the knockout-first, the targeting trap was also
electroporated into different ES cells. The conditional construct was inserted into JM8A1.N3
cells, subcloned from JM8 parental line, derived from C57BL/6N mice. These ES cells have
been modified to correct the black mutation on the Agouti allele and originated an Agouti coat
colour (Pettit et al., 2009). For this reason, recipient blastocysts had to be harvested from
C57BL/6OlaHsd pregnant black mice rather than white mice. This has produced black and
brown chimeras rather than the traditionally white and black ones. In this case, the less black
coat coverage (and more brown), the more likely chimeras are to produce germline
transmission. The opposite is true for the null knockout mice. Since the ES cells derived from
the (black) C57BL/6NTac strain, they were injected into blastocysts from an albino black 6
strain B6(Cg)-Tyrc-2J/J (white). Therefore, the more black hair patches compared to white, the
more likely a chimera will be to yield germline transmission. It can be hypothesised that
simpler constructs somehow have a higher rate of recombination compared to longer, more
complex ones, resulting in faster or more successful germline transmission. So far, in our
laboratory, two knockout strains have been successfully produced using the targeting trap
construct. Another reason can be related to the nature of the ES cells. It is possible that line
specific features determine the success of integration into blastocysts, producing more or less
chimeric animals. On the other hand, assuming equal integration potential, the key may lie in
recipient blastocysts from different strains being more or less amenable to allow foreign ES

176
cells to integrate, survive, migrate, and differentiate. To finalise, still regarding the different
nature of the ES cells, these were cultured and manipulated in the same way, which may have
favoured one line in detriment of the other, that may have been grown under suboptimal
conditions, resulting in less efficiency.
Traditionally, white mice from strains other than black 6 were used as blastocyst donors, as
well as white mice that were crossed with chimeras to check for the presence of black pups in
case of germline transmission (Nagy et al., 2003). This would mean that pups from these
crossings would be discarded, as they were in a mixed background, which is not desirable. The
use of the black 6 albino strain represents an advantage, as it allows an easy method to create
knockout mice on the C57BL/6J genetic background and pups from the germline transmission
confirmation crossings can be used instead of culled. This is a spontaneous mutation in the
tyrosinase gene and when the mice are homozygous for the mutation the coat color is albino
rather than black (this information was obtained from the Jackson Laboratory webpage at
http://jaxmice.jax.org/strain/000058.html).
5.8.3 Preliminary characterisation of the Ecscr null knockout mouse model
As unfortunately this first litter containing some knockout pups was left orphan too old to be
adopted by another female and too young to be weaned, they had to be culled. This has made
it impossible to know whether they would be fertile, survive through adulthood or even develop
a disease at old age. However, it has created the opportunity to do a preliminary analysis of 11
days old wild type, heterozygous and homozygous knockout Ecscr littermate pups.
Hearts and lungs from the three genotypes were chosen to perform LacZ staining to confirm
the loss of Ecscr, as well as observe its location. The targeting trap construct contains a reporter

177
gene, β-galactosidase, which allows the visualization of a blue enzymatic product coincident
with its location (Austin et al., 2004). Lungs from wild type pups displayed no LacZ staining,
whereas lungs from knockout mice were intensely blue and lungs from heterozygous pups
presented an intermediate colour (figure 5.8). This gradient is consistent with the expected
amount of Ecscr being expressed, which was confirmed by qPCR (figure 5.11). Lung staining
is also consistent with this organ containing 30% of endothelial cells in the body (Atochina et
al., 1998). Furthermore, Ikeda et al. (2009) have reported Ecscr staining in lung epithelial cells,
additionally to endothelial cells, which could explain such an intense and apparently
homogeneous staining for lungs from knockout mice. This would also explain why the paraffin
sections from knockouts seemed to have a pale blue-green colour throughout the whole tissue,
compared to the white (paraffin colour) seen for the wild type. These sections were made from
the lungs stained for LacZ. To further investigate this and compare morphology, hematoxylin
and eosin staining was performed. Lungs from knockout mice seemed to have less air space
and more cells, as evidenced by a much stronger dark purple hematoxylin stain of nuclei
(Fischer et al., 2008) (figure 5.9). Lung hyperplasia has also been reported by Xian et al. (2001)
in Dutt1/Robo1 knockout mice. This phenotype is evident since E15.5 and the newborns die
within 24h due to breathing difficulties. Ecscr knockout mice live at least until the age of 11
days. Ecscr heterozygous can reach breeding age and are fertile. However, the mother of the
pups that has died was heterozygous and the same has been reported for other females by the
technicians at the animal facility. According to animal welfare guidelines, because there may
be a harmful phenotype that was previously unaccounted for, only heterozygous females were
allowed to breed, which slows down the process of obtaining a knockout line. Not all
heterozygous females died soon after giving birth, but a higher than normal number did. This
needs to be investigated in greater detail. Giving birth to approximately 8-9 pups is a big effort,

178
that requires intense breathing. Although the LacZ staining was performed only once, as well
as sectioning and hematoxylin and eosin, all the observations taken together seem to indicate
that the loss of Ecscr may cause breathing problems due to changes in lung morphology and
efficiency.
In addition to lungs, hearts from the three genotypes were also stained for beta-galactosidase
activity. Surprisingly, only some (but not all) superficial cardiac smaller vessels were stained
(figure 5.10). Large vessels, such as the aorta, were not stained. Given that in both zebrafish
and mouse embryos Ecscr transcript is found in the dorsal aorta, this was not expected.
However, as discussed in section 4, Ecscr may have a more prominent role in the sprouting of
smaller vessels and its role in larger vessels may be limited to a specific period during
embryonic vascular development. To shed some light into this matter, LacZ staining could be
performed in embryos at different stages. Koide et al. (2011) have also produced an Ecscr
knockout mouse model, where the first three exons were deleted. Although bleeding was
observed in embryos, mice were viable and fertile and had an overall otherwise normal
development. Small vessel (< 10 µm) density was increased and no change was found in larger
vessels. Accordingly, in a critical limb ischaemic model, blood flow recovery and capillary
density was significantly increased in knockout mice compared to the wild type.
Additionally, right atria from knockout pups seemed enlarged compared to those of wild types.
Again, this can be linked to the phenotype observed in the lungs. Causes of right atrial
enlargement include COPD, mitral stenosis, mitral regurgitation, or pulmonary emboli. Most
cases of right atrial enlargement are associated with right ventricular hypertrophy (Harrigan
and Jones, 2002). This was not as evident, but could be explored by comparing sections of
hearts from knockout and wild type mice. In the results from pathway analysis of the
microarray data there was a cluster called “cardiac hypertrophy”, where MEF2C is

179
downregulated. According to Zhao et al. (2002) myocyte enhancer factor-2 (MEF2) is more
abundant in atria than ventricles and upregulated in the atria in response to hypertrophic stimuli.
VEGF induces the expression of and MEF2 is an important mediator of VEGF in endothelial
cells (Maiti et al., 2008).
5.8.4 Further directions
One of the aims when creating a conditional knockout mouse was to characterise the expression
patterns and mechanism of action of Ecscr during embryonic development and tumour
angiogenesis. In order to do that, Ecscr knockouts could be compared to the wild type. Namely,
cryosections of different developmental stages could be done and immunostained with
antibodies against Ecscr and general and specific vessel markers. Other markers may be found
relevant from future results obtained with the other models (HUVECs or zebrafish). The
embryos could be analysed anatomically and histologically to uncover any defect caused by
the loss of Ecscr. The culture of wild type and Ecscr knock out endothelial cells could be
attempted in order to assess the behaviour of these cells in angiogenesis assays such as the
scratch wound and tube formation on Matrigel. In adult mice (as so far the knockout does not
seem to be lethal) a piece of sponge could be inserted subcutaneously and the blood vessel
growth into it could be assessed by analysing parameters such as vessel density, number,
calibre, morphology (Andrade and Ferreira, 2009). In order to uncover any role for Ecscr in
tumour angiogenesis, cancer cells (such as Lewis lung carcinoma) could be injected
subcutaneously and tumour growth as well as vascularisation could be assessed (Dudek et al.,
2007).

180
6 GENERAL CONCLUSIONS
181
Angiogenesis, although a normal process during development and wound healing, is also
involved in pathological conditions, such as cancer. ECSCR has been identified as an
endothelial-specific protein that binds to filamin A and is involved in tube formation and cell
migration, possibly via modulation of the actin cytoskeleton. This makes ECSCR a potentially
interesting marker for therapy. In the beginning of this project the mechanisms by which
ECSCR regulates the cytoskeleton were unknown and required further investigation.
Therefore, the aims were to 1) identify ECSCR binding partners and subsequent downstream
signalling, 2) determine a putative role in zebrafish vascular development, 3) produce and
characterise an Ecscr knockout mouse model and 4) assess whether ECSCR function is
conserved across species.
Identification of proteins interacting with ECSCR was done using two in vitro approaches, co-
immunoprecipitation combined with mass spectrometry and GST pull-down followed by
western blotting. Two proteins were chosen for further investigations using yeast-two-hybrid:
moesin and filamin A. Yeast-two-hybrid failed to show any association between ECSCR and
moesin (as the yeast did not express the latter protein) and confirmed the interaction with
filamin A. An alternative method, luciferase complementation assay, has demonstrated an
interaction between ESCR intracellular domain and moesin. To determine the effects of
ECSCR loss, siRNA knockdowm was performed. Several cytoskeletal proteins were visualised
by immunofluorescent staining and lack of ECSCR resulted in disorganised stress fibres and
uncoupling of the cytoskeleton from the plasma membrane. Overexpression of ECSCR-GFP
in HEK 293T cells induced the formation of filopodia. This was not replicated in filamin A-
deficient M2 cells, which implies that filamin A is necessary for the formation of filopodia and
the two proteins probably associate to form these structures. A microarray to compare
expression of HUVECs treated with ECSCR-targeting siRNA and a negative control duplex

182
was also performed. Altered gene expression was observed for proteins involved in migration,
apoptosis and cytoskeletal processes.
After confirming endothelial specificity by in situ hybridization (mainly in head and major
trunk vessels), the role of Ecscr in zebrafish developmental angiogenesis was explored using
morpholino knockdown. Loss of Ecscr results in disrupted intersegmental vessels sprouting,
which can be rescued by co-injection of Ecscr mRNA and morpholino. Two splice variants
were identified, one of particular interest, which is only present during intersegmental vessel
sprouting, possibly indicating a crucial role in this process.
Mouse endothelial specificity of Ecscr was also confirmed by in situ hybridization, which has
detected the transcript in trunk and head vessels, as well as intersegmental vessels. Three
strategies were attempted to produce an Ecscr knockout mouse model. Initially, the construct
to make a conditional knockout mouse was going to be made, electroporated into ES cells,
selected and injected into blastocysts to produce chimeras. Most of the construct was
successfully made, but an essential element containing the genomic DNA could not be inserted.
Alternatively, ES cells were purchased to make the same type of knockout, but no germline
transmission was observed. Finally, ES cells containing a construct for a null knockout have
produced chimeras with germline transmission. Preliminary analyses show that Ecscr is
expressed in lung and some but not all heart superficial vessels. It seems to be absent from the
aorta. Initial observations of the lung histology indicate less air space and more cells, which
can be indicative of respiratory problems. This seems to be supported by the presence of
enlarged right atria and the fact that some heterozygous females have died a few days after
giving birth.
183
ECSCR endothelial specificity seems to be conserved across species (human, zebrafish and
mouse), as demonstrated by qPCR and in situ hybridization (this work and published literature).
Regarding specific vessels, Ecscr seems to be present in the major trunk vessels in both
zebrafish and mouse embryos, but absent from the murine aorta in 11 days old pups. The
presence of Ecscr in large calibre vessels was not studied in older zebrafish or in humans. A
role in smaller vessels seems evident. However, there seem to be differences between species,
as loss of Ecscr results in incorrect formation of intersegmental vessels in zebrafish, but it has
been reported to induce the growth of microvasculature in knockout mice (Koide et al., 2011).
Nevertheless, caution must be taken when interpreting these results, as these phenomena were
observed at different developmental stages. Additionally, Verma et al. (2010) suggest a role
for Ecscr in angioblast migration in zebrafish, which was not studied in in mouse.
A considerable part of this thesis involved the development and validation of techniques and
reagents, which has proved challenging. Some of the aims were fulfilled more successfully
than others but, when unsuccessful, techniques were replaced by logical alternatives which in
the end proved to be more efficient to accomplish the goal. This was the case, for example, of
the yeast-two-hybrid technique which was replaced by the luciferase complementation assay.
The latter has confirmed the interaction between moesin and ECSCR. Three strategies were
attempted to produce an Ecscr knockout mouse. In the end, this mouse model was successfully
generated.

184
APPENDICES

185
APPENDIX 1: LISTS OF UP AND DOWNREGULATED GENES UPON ECSCR KNOCKDOWN IN HUVECS
Table A1 – Genes that are upregulated when ECSCR is knocked down
FC – fold change; the numbers in brackets after the gene name are the fold change for that gene found in other probes, as the chip contains more
than one probe for some genes
Gene Symbol Gene name FC
CCL20 chemokine (C-C motif) ligand 20 69,27775
IL1B interleukin 1, beta" (50, 50, 44, 43, 41, 40, 37, 36) 55,58571
CXCL5 chemokine (C-X-C motif) ligand 5 (5) 51,55574
SELE selectin E 45,62285
CXCL3 chemokine (C-X-C motif) ligand 3 (19) 43,1904
BIRC3 baculoviral IAP repeat-containing 3 39,29428
LINCR likely ortholog of mouse lung-inducible Neutralized-related C3HC4 RING domain protein 35,91131
KYNU kynureninase (L-kynurenine hydrolase) (19) 35,25836
CXCL2 chemokine (C-X-C motif) ligand 2 (12) 26,25162
IFI44L interferon-induced protein 44-like 23,43921
LTB lymphotoxin beta (TNF superfamily, member 3)" 22,39423
C6orf58 chromosome 6 open reading frame 58 (15) 22,16312
CXCL1 chemokine (C-X-C motif) ligand 1 (melanoma growth stimulating activity, alpha)" 22,14715
ATF3 activating transcription factor 3 (16) 18,71241
IL8 interleukin 8 18,58318
CD69 CD69 molecule (18, 18, 17, 17, 17, 15, 15, 14,12) 18,06872
NR0B1 nuclear receptor subfamily 0, group B, member 1" 17,81812
FAM129A family with sequence similarity 129, member A" (10) 17,73367
NR4A3 nuclear receptor subfamily 4, group A, member 3" 17,54172
CEBPD CCAAT/enhancer binding protein (C/EBP), delta 17,47981
CX3CL1 chemokine (C-X3-C motif) ligand 1 17,32104

186
UBD ubiquitin D 16,71386
IL6 interleukin 6 (interferon, beta 2)" (14, 13, 13, 13, 13, 12, 11, 11, 11) 15,82812
CSF3 colony stimulating factor 3 (granulocyte) 14,69577
RRAD Ras-related associated with diabetes (11) 14,46713
TNIP3 TNFAIP3 interacting protein 3 13,40016
CLDN1 claudin 1 12,99483
IL20RB interleukin 20 receptor beta 12,98884
RSAD2 radical S-adenosyl methionine domain containing 2 (5) 12,40548
TRAF1 TNF receptor-associated factor 1 (11) 12,26445
C15orf48 chromosome 15 open reading frame 48 12,2139
IL1A interleukin 1, alpha" (11, 11, 10, 10, 10, 9, 9, 9, 9) 12,11216
MX1 myxovirus (influenza virus) resistance 1, interferon-inducible protein p78 (mouse)" 11,93219
ICAM1 intercellular adhesion molecule 1 (11, 10,10, 10, 9, 8) 11,49177
TSLP thymic stromal lymphopoietin 11,48282
TAC1 tachykinin, precursor 1 (8) 11,47063
IL13RA2 interleukin 13 receptor, alpha 2" 11,46244
NKD2 naked cuticle homolog 2 (Drosophila) 11,24896
ETV7 ets variant 7 11,24188
IFI6 interferon, alpha-inducible protein 6" 11,17219
LOC344887 similar to hCG2041270 (9) 10,93561
RASGRF2 Ras protein-specific guanine nucleotide-releasing factor 2 10,12908
EBI3 Epstein-Barr virus induced 3 (3) 10,12063
KCNA7 potassium voltage-gated channel, shaker-related subfamily, member 7 9,942975
GAL galanin prepropeptide 9,67776
FOXF1 forkhead box F1 9,476391
FOXF2 forkhead box F2 9,372928
DDIT4L DNA-damage-inducible transcript 4-like 9,327639
PTGS2 prostaglandin-endoperoxide synthase 2 (prostaglandin G/H synthase and cyclooxygenase) (9, 9, 8, 8, 8, 8, 7, 7, 7, 4) 9,198848
TUBB2B tubulin, beta 2B" 9,191147
FGF13 fibroblast growth factor 13 (6) 8,862905
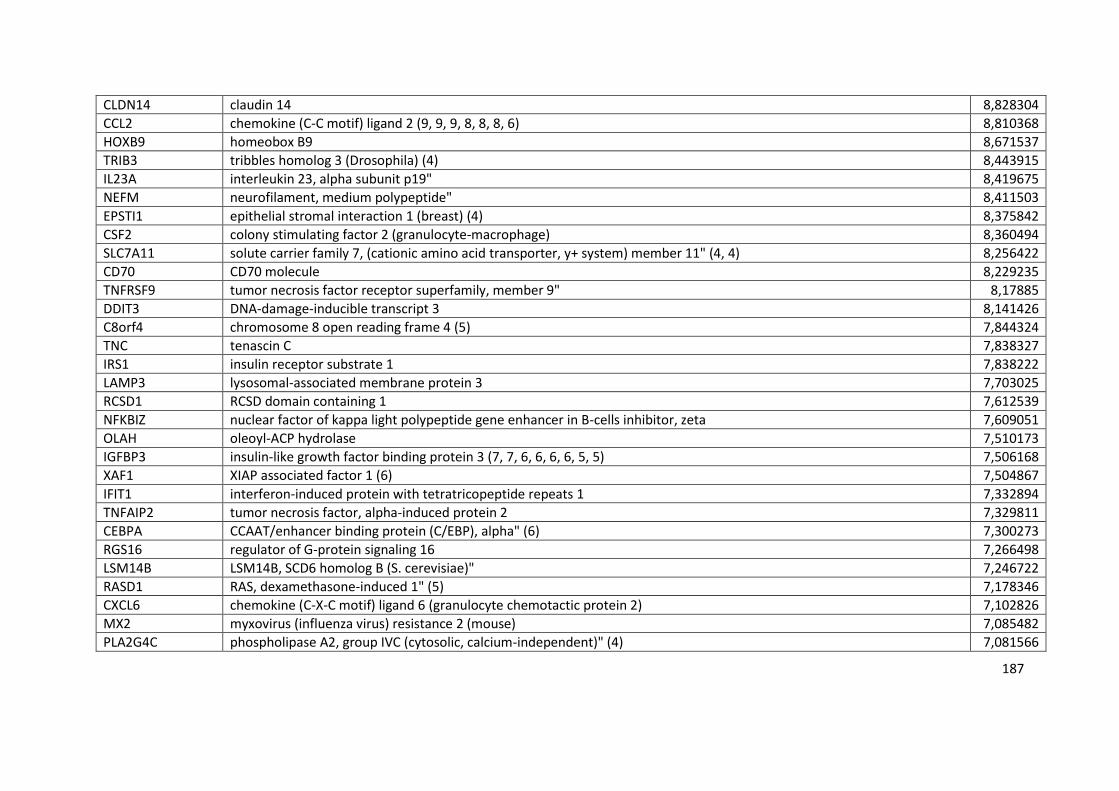
187
CLDN14 claudin 14 8,828304
CCL2 chemokine (C-C motif) ligand 2 (9, 9, 9, 8, 8, 8, 6) 8,810368
HOXB9 homeobox B9 8,671537
TRIB3 tribbles homolog 3 (Drosophila) (4) 8,443915
IL23A interleukin 23, alpha subunit p19" 8,419675
NEFM neurofilament, medium polypeptide" 8,411503
EPSTI1 epithelial stromal interaction 1 (breast) (4) 8,375842
CSF2 colony stimulating factor 2 (granulocyte-macrophage) 8,360494
SLC7A11 solute carrier family 7, (cationic amino acid transporter, y+ system) member 11" (4, 4) 8,256422
CD70 CD70 molecule 8,229235
TNFRSF9 tumor necrosis factor receptor superfamily, member 9" 8,17885
DDIT3 DNA-damage-inducible transcript 3 8,141426
C8orf4 chromosome 8 open reading frame 4 (5) 7,844324
TNC tenascin C 7,838327
IRS1 insulin receptor substrate 1 7,838222
LAMP3 lysosomal-associated membrane protein 3 7,703025
RCSD1 RCSD domain containing 1 7,612539
NFKBIZ nuclear factor of kappa light polypeptide gene enhancer in B-cells inhibitor, zeta 7,609051
OLAH oleoyl-ACP hydrolase 7,510173
IGFBP3 insulin-like growth factor binding protein 3 (7, 7, 6, 6, 6, 6, 5, 5) 7,506168
XAF1 XIAP associated factor 1 (6) 7,504867
IFIT1 interferon-induced protein with tetratricopeptide repeats 1 7,332894
TNFAIP2 tumor necrosis factor, alpha-induced protein 2 7,329811
CEBPA CCAAT/enhancer binding protein (C/EBP), alpha" (6) 7,300273
RGS16 regulator of G-protein signaling 16 7,266498
LSM14B LSM14B, SCD6 homolog B (S. cerevisiae)" 7,246722
RASD1 RAS, dexamethasone-induced 1" (5) 7,178346
CXCL6 chemokine (C-X-C motif) ligand 6 (granulocyte chemotactic protein 2) 7,102826
MX2 myxovirus (influenza virus) resistance 2 (mouse) 7,085482
PLA2G4C phospholipase A2, group IVC (cytosolic, calcium-independent)" (4) 7,081566

188
IL7R interleukin 7 receptor 7,035184
OAS1 2',5'-oligoadenylate synthetase 1, 40/46kDa" 6,923822
TNFRSF11B tumor necrosis factor receptor superfamily, member 11b" (6, 5, 5, 4, 4, 4, 4, 4, 4, 4, 3) 6,869461
FAM150B family with sequence similarity 150, member B" 6,783794
RELB v-rel reticuloendotheliosis viral oncogene homolog B 6,686273
CXCL12 chemokine (C-X-C motif) ligand 12 (stromal cell-derived factor 1) (6, 6, 6, 6, 5, 5, 5, 5, 4) 6,63401
PAPLN papilin, proteoglycan-like sulfated glycoprotein" 6,546394
LPL lipoprotein lipase 6,513617
TNFAIP6 tumor necrosis factor, alpha-induced protein 6" 6,463195
CEBPB CCAAT/enhancer binding protein (C/EBP), beta" (6, 6, 6, 6, 6, 5, 5, 5) 6,44158
PRRX2 paired related homeobox 2 6,388108
SLC15A3 solute carrier family 15, member 3 6,239996
CXCL10 chemokine (C-X-C motif) ligand 10 6,202999
SLC12A7 solute carrier family 12 (potassium/chloride transporters), member 7" (3) 6,169221
TLR2 toll-like receptor 2 (4, 3, 3) 6,165808
FLJ45422 FLJ45422 protein 6,096475
KCTD16 potassium channel tetramerisation domain containing 16 6,084301
PITX2 paired-like homeodomain 2 6,051326
LOC645638 similar to WDNM1-like protein 5,975268
ITGA9 integrin, alpha 9 (4) 5,931367
SLC10A4 solute carrier family 10 (sodium/bile acid cotransporter family), member 4 5,916113
HLA-B major histocompatibility complex, class I, B" 5,911434
SH2D5 SH2 domain containing 5 5,896935
OASL 2'-5'-oligoadenylate synthetase-like 5,862833
CITED4 Cbp/p300-interacting transactivator, with Glu/Asp-rich carboxy-terminal domain, 4 (4) 5,815169
HMOX1 heme oxygenase (decycling) 1 (5, 5, 5, 5, 5, 5, 5, 5, 5, 5) 5,76187
OAS2 2'-5'-oligoadenylate synthetase 2, 69/71kDa (4) 5,754087
HERC6 hect domain and RLD 6 5,740996
SQSTM1 sequestosome 1 5,73985
SOD2 superoxide dismutase 2, mitochondrial" 5,735423

189
ISG20 interferon stimulated exonuclease gene 20kDa 5,687222
PTCHD1 patched domain containing 1 5,684286
UNC5B unc-5 homolog B (C. elegans) 5,601578
COL8A2 collagen, type VIII, alpha 2" 5,560278
MC5R melanocortin 5 receptor 5,555165
MMP1 matrix metallopeptidase 1 (interstitial collagenase) (5, 5, 5, 5, 4, 4, 4, 4) 5,527686
LOC100126784 hypothetical LOC100126784 5,510926
CLIP4 CAP-GLY domain containing linker protein family, member 4" 5,503133
NUAK2 NUAK family, SNF1-like kinase, 2" 5,486645
SPINK1 serine peptidase inhibitor, Kazal type 1" 5,394292
AREG Amphiregulin 5,373462
NOG Noggin 5,250764
HES4 hairy and enhancer of split 4 (Drosophila) 5,148451
IFIT3 interferon-induced protein with tetratricopeptide repeats 3 5,105371
KCNN2 potassium intermediate/small conductance calcium-activated channel, subfamily N, member 2" 5,069032
IFI27 interferon, alpha-inducible protein 27" (4, 4, 4, 4, 4, 3, 3, 3, 3, 3, 3) 5,067551
ATP1B1 ATPase, Na+/K+ transporting, beta 1 polypeptide" (4) 5,004399
MAFF v-maf musculoaponeurotic fibrosarcoma oncogene homolog F (avian) 4,972289
HIST1H3D histone cluster 1, H3d" 4,962294
SLC7A2 solute carrier family 7 (cationic amino acid transporter, y+ system), member 2" 4,883991
CD83 CD83 molecule 4,870915
DUSP5P dual specificity phosphatase 5 pseudogene (4) 4,861522
TNFRSF4 tumor necrosis factor receptor superfamily, member 4" 4,851218
RAB3IL1 RAB3A interacting protein (rabin3)-like 1 4,788185
PCK2 phosphoenolpyruvate carboxykinase 2 (mitochondrial) (3) 4,775168
CBS cystathionine-beta-synthase 4,752131
LOC728855 hypothetical LOC728855 4,659575
BDKRB2 bradykinin receptor B2 4,656202
BATF3 basic leucine zipper transcription factor, ATF-like 3 4,645409
DNER delta/notch-like EGF repeat containing 4,63993

190
GPC6 glypican 6 4,598506
HLA-F major histocompatibility complex, class I, F" 4,588335
ICAM4 intercellular adhesion molecule 4 (Landsteiner-Wiener blood group) 4,587044
AKAP12 A kinase (PRKA) anchor protein 12 4,581684
CEBPE CCAAT/enhancer binding protein (C/EBP), epsilon" 4,578664
ICOSLG inducible T-cell co-stimulator ligand 4,560733
POU2F2 POU class 2 homeobox 2 4,555146
FAM148B family with sequence similarity 148, member B" 4,55495
CAMTA1 calmodulin binding transcription activator 1 (3) 4,544532
FOXA3 forkhead box A3 4,532092
BMP8B bone morphogenetic protein 8b 4,528976
SLC7A5 solute carrier family 7 (cationic amino acid transporter, y+ system), member 5" 4,501349
MAMDC2 MAM domain containing 2 4,490658
ADRA2C adrenergic, alpha-2C-, receptor" 4,46032
MMP10 matrix metallopeptidase 10 (stromelysin 2) 4,445137
LOC345630 similar to hCG1641252 4,377962
MT1M metallothionein 1M 4,374825
ZC3H12A zinc finger CCCH-type containing 12A 4,362434
DDIT4 DNA-damage-inducible transcript 4 4,353625
BMPR1B bone morphogenetic protein receptor, type IB" 4,336013
IFITM1 interferon induced transmembrane protein 1 (9-27) 4,335091
PMAIP1 phorbol-12-myristate-13-acetate-induced protein 1 (4, 4, 4, 3, 3, 3, 3, 3) 4,238996
PPARG peroxisome proliferator-activated receptor gamma (3, 2) 4,237915
ATP13A3 ATPase type 13A3 (4) 4,177427
VEGFA vascular endothelial growth factor A (3) 4,167951
MT1JP metallothionein 1J (pseudogene) 4,12442
SPATA13 spermatogenesis associated 13 4,106179
CTHRC1 collagen triple helix repeat containing 1 4,103684
IRX2 iroquois homeobox 2 4,090886
TNF tumor necrosis factor (TNF superfamily, member 2)" 4,087982
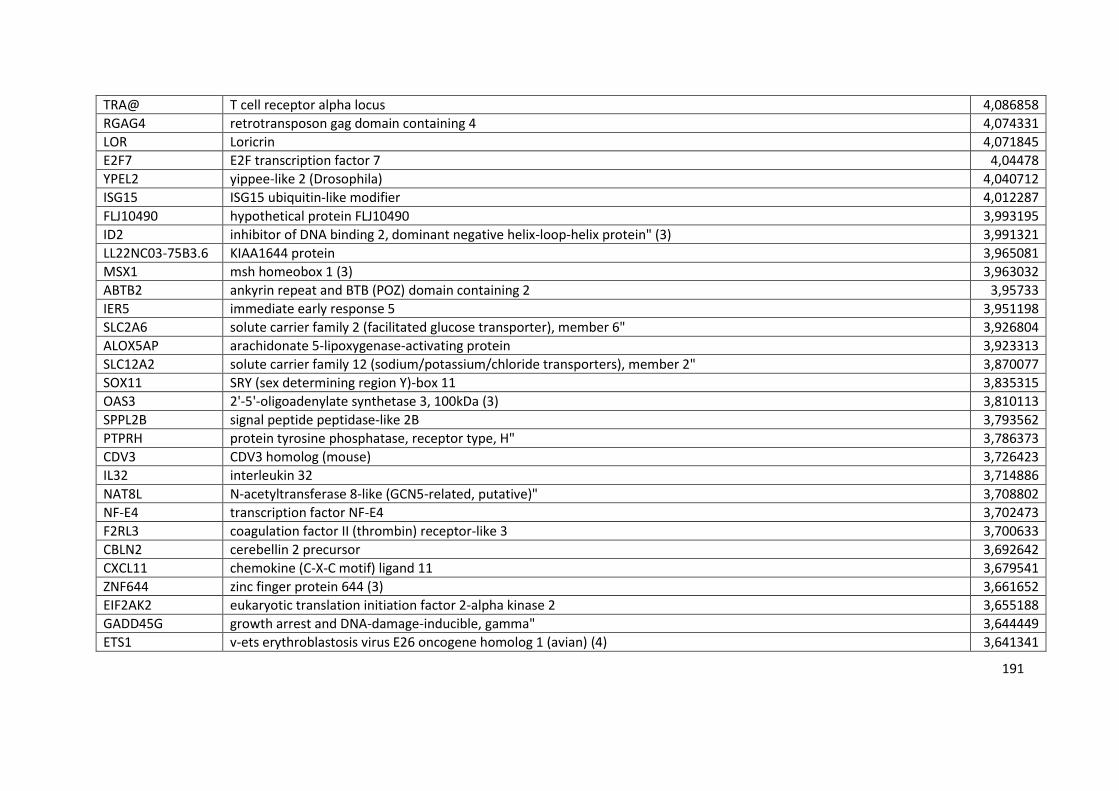
191
TRA@ T cell receptor alpha locus 4,086858
RGAG4 retrotransposon gag domain containing 4 4,074331
LOR Loricrin 4,071845
E2F7 E2F transcription factor 7 4,04478
YPEL2 yippee-like 2 (Drosophila) 4,040712
ISG15 ISG15 ubiquitin-like modifier 4,012287
FLJ10490 hypothetical protein FLJ10490 3,993195
ID2 inhibitor of DNA binding 2, dominant negative helix-loop-helix protein" (3) 3,991321
LL22NC03-75B3.6 KIAA1644 protein 3,965081
MSX1 msh homeobox 1 (3) 3,963032
ABTB2 ankyrin repeat and BTB (POZ) domain containing 2 3,95733
IER5 immediate early response 5 3,951198
SLC2A6 solute carrier family 2 (facilitated glucose transporter), member 6" 3,926804
ALOX5AP arachidonate 5-lipoxygenase-activating protein 3,923313
SLC12A2 solute carrier family 12 (sodium/potassium/chloride transporters), member 2" 3,870077
SOX11 SRY (sex determining region Y)-box 11 3,835315
OAS3 2'-5'-oligoadenylate synthetase 3, 100kDa (3) 3,810113
SPPL2B signal peptide peptidase-like 2B 3,793562
PTPRH protein tyrosine phosphatase, receptor type, H" 3,786373
CDV3 CDV3 homolog (mouse) 3,726423
IL32 interleukin 32 3,714886
NAT8L N-acetyltransferase 8-like (GCN5-related, putative)" 3,708802
NF-E4 transcription factor NF-E4 3,702473
F2RL3 coagulation factor II (thrombin) receptor-like 3 3,700633
CBLN2 cerebellin 2 precursor 3,692642
CXCL11 chemokine (C-X-C motif) ligand 11 3,679541
ZNF644 zinc finger protein 644 (3) 3,661652
EIF2AK2 eukaryotic translation initiation factor 2-alpha kinase 2 3,655188
GADD45G growth arrest and DNA-damage-inducible, gamma" 3,644449
ETS1 v-ets erythroblastosis virus E26 oncogene homolog 1 (avian) (4) 3,641341
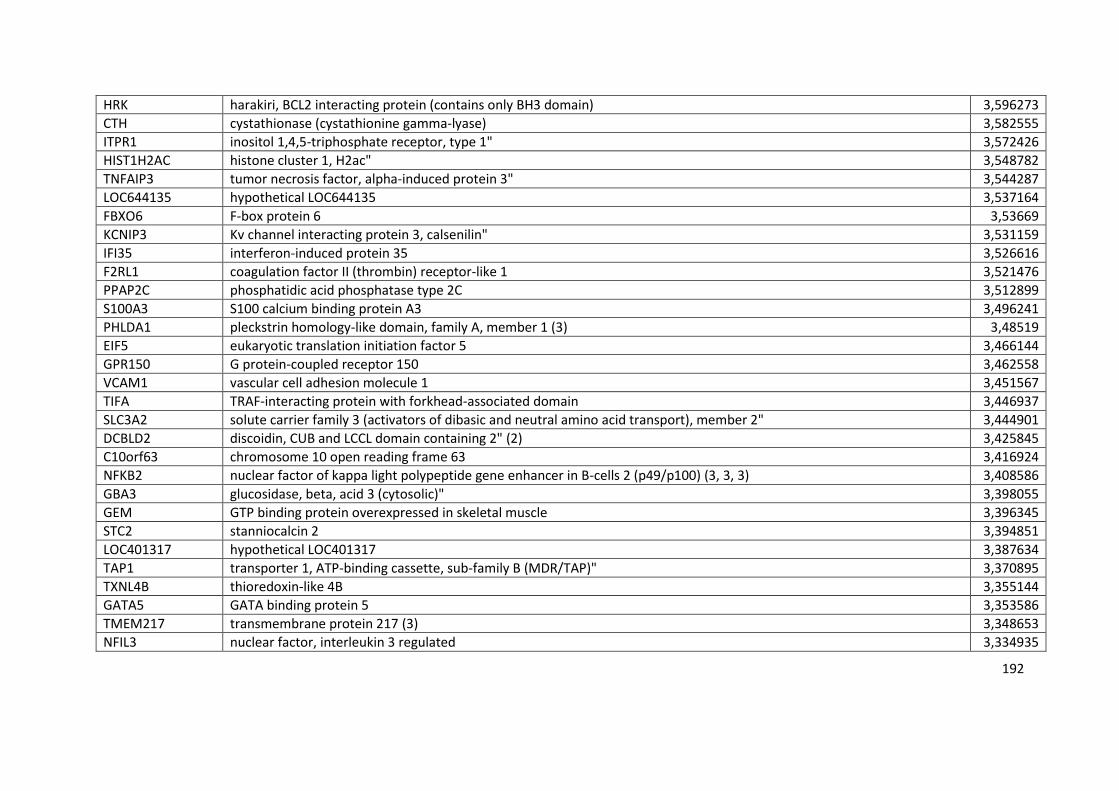
192
HRK harakiri, BCL2 interacting protein (contains only BH3 domain) 3,596273
CTH cystathionase (cystathionine gamma-lyase) 3,582555
ITPR1 inositol 1,4,5-triphosphate receptor, type 1" 3,572426
HIST1H2AC histone cluster 1, H2ac" 3,548782
TNFAIP3 tumor necrosis factor, alpha-induced protein 3" 3,544287
LOC644135 hypothetical LOC644135 3,537164
FBXO6 F-box protein 6 3,53669
KCNIP3 Kv channel interacting protein 3, calsenilin" 3,531159
IFI35 interferon-induced protein 35 3,526616
F2RL1 coagulation factor II (thrombin) receptor-like 1 3,521476
PPAP2C phosphatidic acid phosphatase type 2C 3,512899
S100A3 S100 calcium binding protein A3 3,496241
PHLDA1 pleckstrin homology-like domain, family A, member 1 (3) 3,48519
EIF5 eukaryotic translation initiation factor 5 3,466144
GPR150 G protein-coupled receptor 150 3,462558
VCAM1 vascular cell adhesion molecule 1 3,451567
TIFA TRAF-interacting protein with forkhead-associated domain 3,446937
SLC3A2 solute carrier family 3 (activators of dibasic and neutral amino acid transport), member 2" 3,444901
DCBLD2 discoidin, CUB and LCCL domain containing 2" (2) 3,425845
C10orf63 chromosome 10 open reading frame 63 3,416924
NFKB2 nuclear factor of kappa light polypeptide gene enhancer in B-cells 2 (p49/p100) (3, 3, 3) 3,408586
GBA3 glucosidase, beta, acid 3 (cytosolic)" 3,398055
GEM GTP binding protein overexpressed in skeletal muscle 3,396345
STC2 stanniocalcin 2 3,394851
LOC401317 hypothetical LOC401317 3,387634
TAP1 transporter 1, ATP-binding cassette, sub-family B (MDR/TAP)" 3,370895
TXNL4B thioredoxin-like 4B 3,355144
GATA5 GATA binding protein 5 3,353586
TMEM217 transmembrane protein 217 (3) 3,348653
NFIL3 nuclear factor, interleukin 3 regulated 3,334935
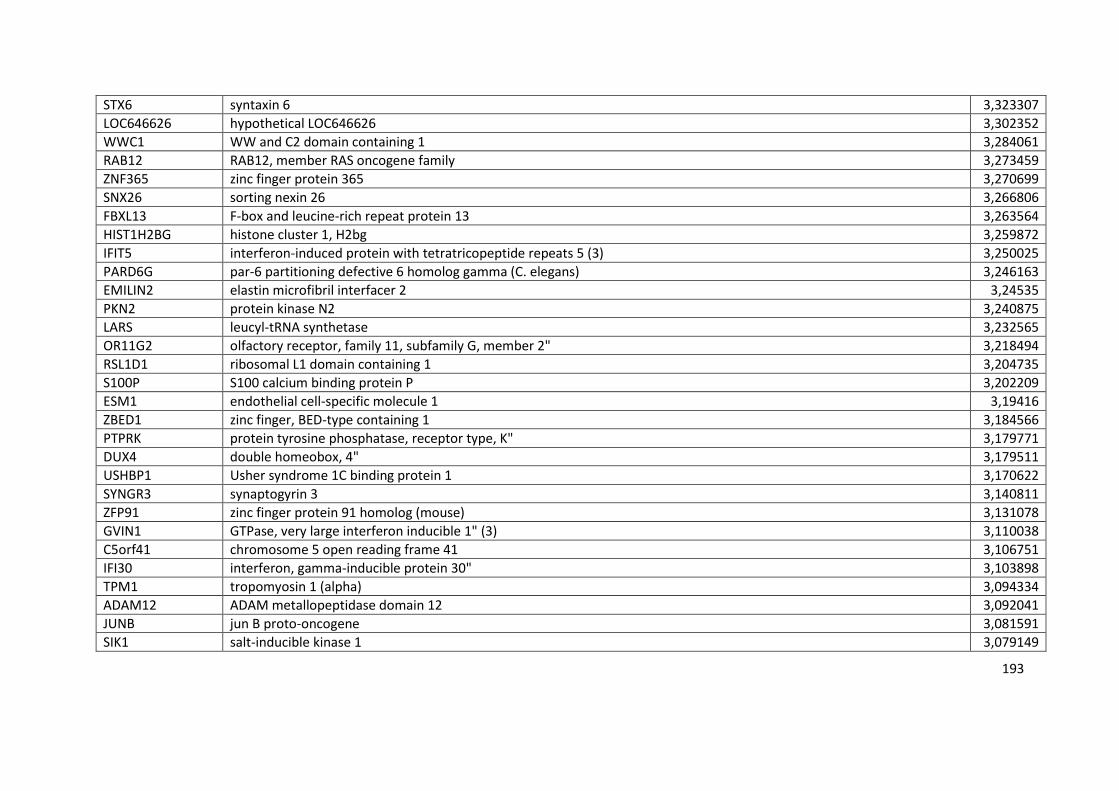
193
STX6 syntaxin 6 3,323307
LOC646626 hypothetical LOC646626 3,302352
WWC1 WW and C2 domain containing 1 3,284061
RAB12 RAB12, member RAS oncogene family 3,273459
ZNF365 zinc finger protein 365 3,270699
SNX26 sorting nexin 26 3,266806
FBXL13 F-box and leucine-rich repeat protein 13 3,263564
HIST1H2BG histone cluster 1, H2bg 3,259872
IFIT5 interferon-induced protein with tetratricopeptide repeats 5 (3) 3,250025
PARD6G par-6 partitioning defective 6 homolog gamma (C. elegans) 3,246163
EMILIN2 elastin microfibril interfacer 2 3,24535
PKN2 protein kinase N2 3,240875
LARS leucyl-tRNA synthetase 3,232565
OR11G2 olfactory receptor, family 11, subfamily G, member 2" 3,218494
RSL1D1 ribosomal L1 domain containing 1 3,204735
S100P S100 calcium binding protein P 3,202209
ESM1 endothelial cell-specific molecule 1 3,19416
ZBED1 zinc finger, BED-type containing 1 3,184566
PTPRK protein tyrosine phosphatase, receptor type, K" 3,179771
DUX4 double homeobox, 4" 3,179511
USHBP1 Usher syndrome 1C binding protein 1 3,170622
SYNGR3 synaptogyrin 3 3,140811
ZFP91 zinc finger protein 91 homolog (mouse) 3,131078
GVIN1 GTPase, very large interferon inducible 1" (3) 3,110038
C5orf41 chromosome 5 open reading frame 41 3,106751
IFI30 interferon, gamma-inducible protein 30" 3,103898
TPM1 tropomyosin 1 (alpha) 3,094334
ADAM12 ADAM metallopeptidase domain 12 3,092041
JUNB jun B proto-oncogene 3,081591
SIK1 salt-inducible kinase 1 3,079149

194
ZDHHC11 zinc finger, DHHC-type containing 11" 3,064191
CTSS cathepsin S 3,063559
SP5 Sp5 transcription factor 3,062138
CD274 CD274 molecule 3,050084
SGK1 serum/glucocorticoid regulated kinase 1 3,042282
LOC100127983 hypothetical protein LOC100127983 3,038411
CDH24 cadherin-like 24 3,03514
MT2A metallothionein 2A 3,032209
HES2 hairy and enhancer of split 2 (Drosophila) 3,030875
OBFC2A oligonucleotide/oligosaccharide-binding fold containing 2A 3,018
EVC2 Ellis van Creveld syndrome 2 3,015805
CRCP CGRP receptor component 3,007095
FTH1 ferritin, heavy polypeptide 1" 2,963964
OSGIN1 oxidative stress induced growth inhibitor 1 2,957198
KITLG KIT ligand 2,9491
IRF7 interferon regulatory factor 7 2,933232
RCOR2 REST corepressor 2 2,922273
TNFSF15 tumor necrosis factor (ligand) superfamily, member 15" 2,90531
DHX58 DEXH (Asp-Glu-X-His) box polypeptide 58 2,899787
N4BP3 Nedd4 binding protein 3 2,89582
HDAC9 histone deacetylase 9 2,892829
LOC644189 similar to peroxisomal long-chain acyl-coA thioesterase 2,88748
NFKBIA nuclear factor of kappa light polypeptide gene enhancer in B-cells inhibitor, alpha" 2,867977
KCNJ14 potassium inwardly-rectifying channel, subfamily J, member 14 2,867113
MAFA v-maf musculoaponeurotic fibrosarcoma oncogene homolog A (avian) 2,860308
CFTR cystic fibrosis transmembrane conductance regulator (ATP-binding cassette sub-family C, member 7)" 2,851662
PDGFA platelet-derived growth factor alpha polypeptide 2,842574
RHBDF2 rhomboid 5 homolog 2 (Drosophila) 2,84253
FCRLB Fc receptor-like B 2,833371
NUPL1 nucleoporin like 1 2,832407

195
KBTBD11 kelch repeat and BTB (POZ) domain containing 11 2,821291
DTX3L deltex 3-like (Drosophila) 2,799295
PLXNA1 plexin A1 2,793375
OCIAD2 OCIA domain containing 2 2,789949
UBE2E1 ubiquitin-conjugating enzyme E2E 1 (UBC4/5 homolog, yeast)" 2,776083
WNT5A wingless-type MMTV integration site family, member 5A" 2,772922
KITLG KIT ligand 2,76321
PARP9 poly (ADP-ribose) polymerase family, member 9 2,757096
SPON2 spondin 2, extracellular matrix protein" 2,755371
GPR68 G protein-coupled receptor 68 2,749564
SIX1 SIX homeobox 1 2,732723
PAG1 phosphoprotein associated with glycosphingolipid microdomains 1 2,728033
GRPEL2 GrpE-like 2, mitochondrial (E. coli)" 2,728015
ZNF697 zinc finger protein 697 2,716183
AIFM2 apoptosis-inducing factor, mitochondrion-associated, 2" 2,716176
FOSL2 FOS-like antigen 2 2,711685
AADAC arylacetamide deacetylase (esterase) 2,710489
MYLK myosin light chain kinase 2,707101
TCF7 transcription factor 7 (T-cell specific, HMG-box)" 2,704893
FAM132A family with sequence similarity 132, member A 2,68782
ADFP adipose differentiation-related protein 2,662066
MT2A metallothionein 2A 2,660903
IL4I1 interleukin 4 induced 1 2,658979
UTS2R urotensin 2 receptor 2,645053
HIST1H2AE histone cluster 1, H2ae 2,631659
PRDM10 PR domain containing 10 2,627767
CIDECP cell death-inducing DFFA-like effector c pseudogene 2,62727
ZNF322B zinc finger protein 322B 2,624297
TLR7 toll-like receptor 7 2,620025
ERRFI1 ERBB receptor feedback inhibitor 1 2,613644

196
VAV3 vav 3 guanine nucleotide exchange factor 2,612158
NPBWR1 neuropeptides B/W receptor 1 2,578884
SOX7 SRY (sex determining region Y)-box 7 2,576394
CKB creatine kinase, brain" 2,49131
EIF1 eukaryotic translation initiation factor 1 2,487807
GBP1 guanylate binding protein 1, interferon-inducible, 67kDa 2,478448
G0S2 G0/G1switch 2 2,464977
AKIRIN1 akirin 1 2,454619
DEAF1 deformed epidermal autoregulatory factor 1 (Drosophila) 2,446047
C9orf150 chromosome 9 open reading frame 150 2,423348
HIST2H2AA4 histone cluster 2, H2aa4 2,417622
BCAN Brevican 2,402919
SYNCRIP synaptotagmin binding, cytoplasmic RNA interacting protein" 2,385486
MT1G metallothionein 1G 2,382322
C3orf52 chromosome 3 open reading frame 52 2,378354
CTSK cathepsin K 2,369672
LIPG lipase, endothelial 2,368038
SRGN Serglycin 2,367863
KLF11 Kruppel-like factor 11 2,360476
PSMB8 proteasome (prosome, macropain) subunit, beta type, 8 (large multifunctional peptidase 7)" 2,354499
CLDN23 claudin 23 2,313628
CUEDC1 CUE domain containing 1 2,288127
MAFK v-maf musculoaponeurotic fibrosarcoma oncogene homolog K (avian) 2,278666
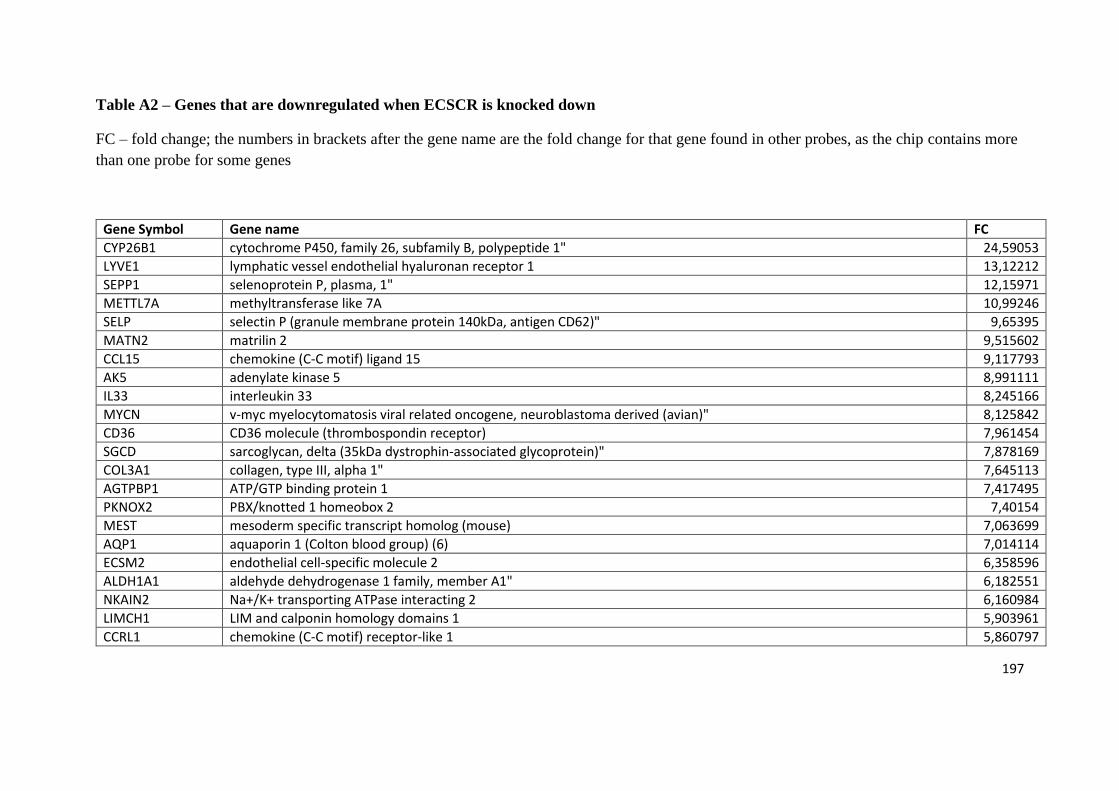
197
Table A2 – Genes that are downregulated when ECSCR is knocked down
FC – fold change; the numbers in brackets after the gene name are the fold change for that gene found in other probes, as the chip contains more
than one probe for some genes
Gene Symbol Gene name FC
CYP26B1 cytochrome P450, family 26, subfamily B, polypeptide 1" 24,59053
LYVE1 lymphatic vessel endothelial hyaluronan receptor 1 13,12212
SEPP1 selenoprotein P, plasma, 1" 12,15971
METTL7A methyltransferase like 7A 10,99246
SELP selectin P (granule membrane protein 140kDa, antigen CD62)" 9,65395
MATN2 matrilin 2 9,515602
CCL15 chemokine (C-C motif) ligand 15 9,117793
AK5 adenylate kinase 5 8,991111
IL33 interleukin 33 8,245166
MYCN v-myc myelocytomatosis viral related oncogene, neuroblastoma derived (avian)" 8,125842
CD36 CD36 molecule (thrombospondin receptor) 7,961454
SGCD sarcoglycan, delta (35kDa dystrophin-associated glycoprotein)" 7,878169
COL3A1 collagen, type III, alpha 1" 7,645113
AGTPBP1 ATP/GTP binding protein 1 7,417495
PKNOX2 PBX/knotted 1 homeobox 2 7,40154
MEST mesoderm specific transcript homolog (mouse) 7,063699
AQP1 aquaporin 1 (Colton blood group) (6) 7,014114
ECSM2 endothelial cell-specific molecule 2 6,358596
ALDH1A1 aldehyde dehydrogenase 1 family, member A1" 6,182551
NKAIN2 Na+/K+ transporting ATPase interacting 2 6,160984
LIMCH1 LIM and calponin homology domains 1 5,903961
CCRL1 chemokine (C-C motif) receptor-like 1 5,860797

198
MAN1C1 mannosidase, alpha, class 1C, member 1" 5,814218
ACP5 acid phosphatase 5, tartrate resistant" 5,77145
CCL3L3 chemokine (C-C motif) ligand 3-like 3 5,76664
CCNE2 cyclin E2 5,625399
LEPR leptin receptor 5,61404
E2F8 E2F transcription factor 8 5,571739
ABCG2 ATP-binding cassette, sub-family G (WHITE), member 2 5,535094
PCDH10 protocadherin 10 5,530232
SLC40A1 solute carrier family 40 (iron-regulated transporter), member 1" 5,287551
PLAT plasminogen activator, tissue" (5, 5,5, 5, 5, 5,4, 4) 5,287475
KIAA0644 KIAA0644 gene product 5,275179
MRAP2 melanocortin 2 receptor accessory protein 2 5,238853
METTL7A methyltransferase like 7A 5,222575
ST6GALNAC1 ST6 (alpha-N-acetyl-neuraminyl-2,3-beta-galactosyl-1,3)-N-acetylgalactosaminide alpha-2,6-sialyltransferase 1 5,183783
MMP7 matrix metallopeptidase 7 (matrilysin, uterine)" 5,165852
GUCY1A3 guanylate cyclase 1, soluble, alpha 3" 5,073154
FRY furry homolog (Drosophila) 5,057096
MALAT1 metastasis associated lung adenocarcinoma transcript 1 (non-protein coding) 5,052179
PCDH7 protocadherin 7 5,047044
ACSM2B acyl-CoA synthetase medium-chain family member 2B 5,043029
ACSM2A acyl-CoA synthetase medium-chain family member 2A 4,975459
KCNMB2 potassium large conductance calcium-activated channel, subfamily M, beta member 2" 4,939225
GPR126 G protein-coupled receptor 126 4,853051
SULF1 sulfatase 1 4,766119
PROS1 protein S (alpha) 4,764287
C5orf4 chromosome 5 open reading frame 4 4,721733
ITGA11 integrin, alpha 11 4,673621
MGP matrix Gla protein 4,665341
SLC14A1 solute carrier family 14 (urea transporter), member 1 (Kidd blood group)" 4,550198
SGCD sarcoglycan, delta (35kDa dystrophin-associated glycoprotein)" 4,550033
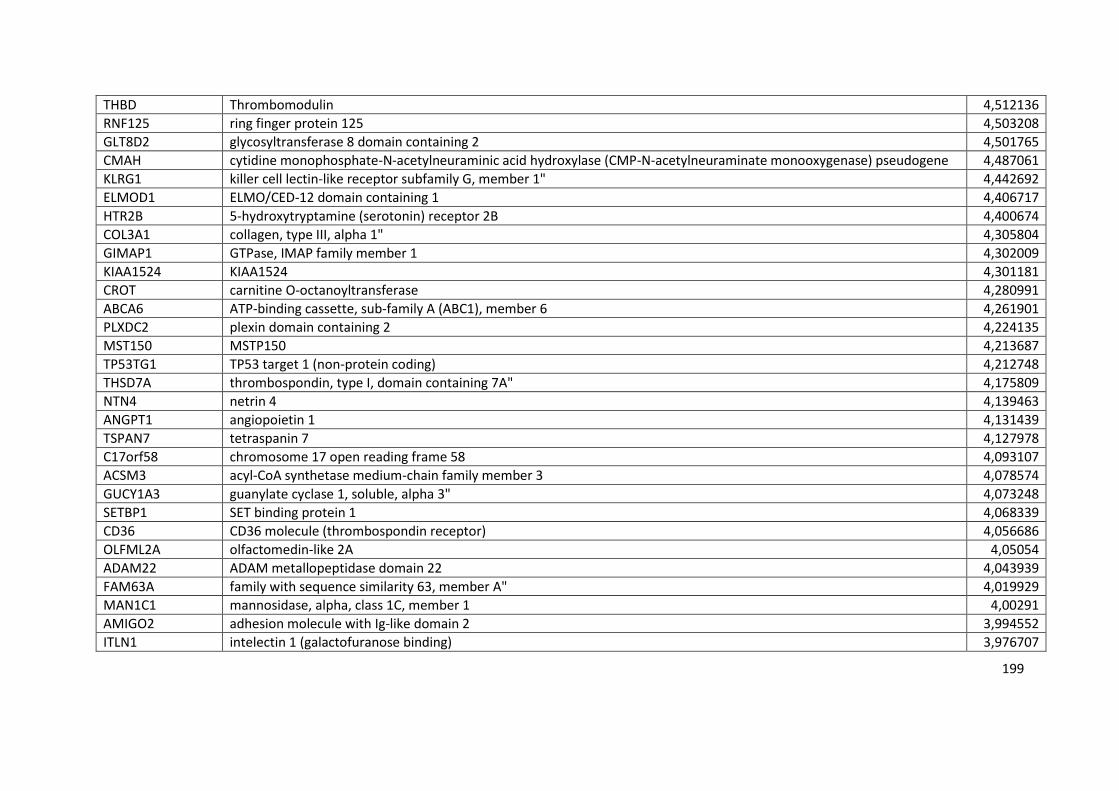
199
THBD Thrombomodulin 4,512136
RNF125 ring finger protein 125 4,503208
GLT8D2 glycosyltransferase 8 domain containing 2 4,501765
CMAH cytidine monophosphate-N-acetylneuraminic acid hydroxylase (CMP-N-acetylneuraminate monooxygenase) pseudogene 4,487061
KLRG1 killer cell lectin-like receptor subfamily G, member 1" 4,442692
ELMOD1 ELMO/CED-12 domain containing 1 4,406717
HTR2B 5-hydroxytryptamine (serotonin) receptor 2B 4,400674
COL3A1 collagen, type III, alpha 1" 4,305804
GIMAP1 GTPase, IMAP family member 1 4,302009
KIAA1524 KIAA1524 4,301181
CROT carnitine O-octanoyltransferase 4,280991
ABCA6 ATP-binding cassette, sub-family A (ABC1), member 6 4,261901
PLXDC2 plexin domain containing 2 4,224135
MST150 MSTP150 4,213687
TP53TG1 TP53 target 1 (non-protein coding) 4,212748
THSD7A thrombospondin, type I, domain containing 7A" 4,175809
NTN4 netrin 4 4,139463
ANGPT1 angiopoietin 1 4,131439
TSPAN7 tetraspanin 7 4,127978
C17orf58 chromosome 17 open reading frame 58 4,093107
ACSM3 acyl-CoA synthetase medium-chain family member 3 4,078574
GUCY1A3 guanylate cyclase 1, soluble, alpha 3" 4,073248
SETBP1 SET binding protein 1 4,068339
CD36 CD36 molecule (thrombospondin receptor) 4,056686
OLFML2A olfactomedin-like 2A 4,05054
ADAM22 ADAM metallopeptidase domain 22 4,043939
FAM63A family with sequence similarity 63, member A" 4,019929
MAN1C1 mannosidase, alpha, class 1C, member 1 4,00291
AMIGO2 adhesion molecule with Ig-like domain 2 3,994552
ITLN1 intelectin 1 (galactofuranose binding) 3,976707

200
PCDH17 protocadherin 17 3,971997
DNAJB4 DnaJ (Hsp40) homolog, subfamily B, member 4" 3,970255
CYP4X1 cytochrome P450, family 4, subfamily X, polypeptide 1" 3,933246
KLHL13 kelch-like 13 (Drosophila) 3,926297
LIMCH1 LIM and calponin homology domains 1 3,901281
CASP12 caspase 12 (gene/pseudogene) 3,859531
NPHS2 nephrosis 2, idiopathic, steroid-resistant (podocin) 3,839631
ZNF608 zinc finger protein 608 3,831042
COL1A2 collagen, type I, alpha 2" 3,81778
KIAA1377 KIAA1377 3,801961
GDF6 growth differentiation factor 6 3,789169
SP8 Sp8 transcription factor 3,789124
C10orf10 chromosome 10 open reading frame 10 3,785241
DNAJB4 DnaJ (Hsp40) homolog, subfamily B, member 4" 3,776615
KCNMB4 potassium large conductance calcium-activated channel, subfamily M, beta member 4 3,756521
PIK3C2B phosphoinositide-3-kinase, class 2, beta polypeptide" 3,746364
COL1A2 collagen, type I, alpha 2" 3,737154
PXMP2 peroxisomal membrane protein 2, 22kDa 3,706716
RAD51AP1 RAD51 associated protein 1 3,697544
ENTPD1 ectonucleoside triphosphate diphosphohydrolase 1 3,696764
STON1 stonin 1 3,687482
CYP4X1 cytochrome P450, family 4, subfamily X, polypeptide 1" 3,681587
TTC13 tetratricopeptide repeat domain 13 3,667282
LOC339483 hypothetical LOC339483 3,659573
FAM107A family with sequence similarity 107, member A 3,65268
C4orf49 chromosome 4 open reading frame 49 3,642848
COL1A2 collagen, type I, alpha 2" 3,634113
SDPR serum deprivation response (phosphatidylserine binding protein) 3,628161
DSCC1 defective in sister chromatid cohesion 1 homolog (S. cerevisiae) 3,617317
GCNT1 glucosaminyl (N-acetyl) transferase 1, core 2 (beta-1,6-N-acetylglucosaminyltransferase) 3,613131

201
MMRN1 multimerin 1 3,597911
CDKN2C cyclin-dependent kinase inhibitor 2C (p18, inhibits CDK4)" 3,581516
ATAD2 ATPase family, AAA domain containing 2" 3,576729
MYO5C myosin VC 3,567839
FABP4 fatty acid binding protein 4, adipocyte" 3,548161
ALDH6A1 aldehyde dehydrogenase 6 family, member A1" 3,525673
RACGAP1 Rac GTPase activating protein 1 3,517794
FAM107A family with sequence similarity 107, member A 3,514274
KLHL3 kelch-like 3 (Drosophila) 3,513667
GIPC2 GIPC PDZ domain containing family, member 2 3,512596
SCN9A sodium channel, voltage-gated, type IX, alpha subunit" 3,502842
FCRL3 Fc receptor-like 3 3,492753
NAP1L3 nucleosome assembly protein 1-like 3 3,491722
CCDC80 coiled-coil domain containing 80 3,484302
COL1A2 collagen, type I, alpha 2" 3,458554
NDC80 NDC80 homolog, kinetochore complex component (S. cerevisiae)" 3,449489
C6orf142 chromosome 6 open reading frame 142 3,449136
GIPC2 GIPC PDZ domain containing family, member 2 3,42513
CDO1 cysteine dioxygenase, type I" 3,414906
KIF20B kinesin family member 20B 3,414889
TRERF1 transcriptional regulating factor 1 3,399105
COL1A2 collagen, type I, alpha 2" 3,390621
COL1A2 collagen, type I, alpha 2" 3,381495
GJA4 gap junction protein, alpha 4, 37kDa" 3,377162
CLDN22 claudin 22 3,364727
VWA5A von Willebrand factor A domain containing 5A 3,346545
CLEC14A C-type lectin domain family 14, member A 3,331307
DSCC1 defective in sister chromatid cohesion 1 homolog (S. cerevisiae) 3,328079
LOC643733 hypothetical LOC643733 3,325942
HAPLN1 hyaluronan and proteoglycan link protein 1 3,320056

202
SORT1 sortilin 1 3,31407
SPTLC3 serine palmitoyltransferase, long chain base subunit 3 3,309382
KAL1 Kallmann syndrome 1 sequence 3,302677
SELENBP1 selenium binding protein 1 3,287307
PTGIS prostaglandin I2 (prostacyclin) synthase 3,286498
CFH complement factor H 3,272152
TMEM71 transmembrane protein 71 3,262596
CCL3L3 chemokine (C-C motif) ligand 3-like 3 3,26022
GPR126 G protein-coupled receptor 126 3,258217
C18orf34 chromosome 18 open reading frame 34 3,250303
KCNJ15 potassium inwardly-rectifying channel, subfamily J, member 15" 3,238777
ABLIM1 actin binding LIM protein 1 3,235758
CGNL1 cingulin-like 1 3,234857
KCND2 potassium voltage-gated channel, Shal-related subfamily, member 2" 3,234167
LUM Lumican 3,231183
TMSB15A thymosin beta 15a 3,231081
TRERF1 transcriptional regulating factor 1 3,230042
GRB14 growth factor receptor-bound protein 14 3,220014
CALCRL calcitonin receptor-like 3,219786
SESN3 sestrin 3 3,209932
SLC22A5 solute carrier family 22 (organic cation/carnitine transporter), member 5" 3,207387
KBTBD6 kelch repeat and BTB (POZ) domain containing 6 3,207162
FILIP1 filamin A interacting protein 1 3,19257
GALNTL2 UDP-N-acetyl-alpha-D-galactosamine:polypeptide N-acetylgalactosaminyltransferase-like 2 3,188781
HMCN1 hemicentin 1 3,186536
STAB2 stabilin 2 3,166811
B3GNT1 UDP-GlcNAc:betaGal beta-1,3-N-acetylglucosaminyltransferase 1" 3,165542
ACOX2 acyl-Coenzyme A oxidase 2, branched chain" 3,163547
ALS2CR4 amyotrophic lateral sclerosis 2 (juvenile) chromosome region, candidate 4" 3,147664
SLC9A9 solute carrier family 9 (sodium/hydrogen exchanger), member 9" 3,132598

203
COL1A2 collagen, type I, alpha 2" 3,128723
FAT4 FAT tumor suppressor homolog 4 (Drosophila) 3,120981
SORT1 sortilin 1 3,118484
KIAA0101 KIAA0101 3,118215
HEPH Hephaestin 3,117348
MAP2K6 mitogen-activated protein kinase kinase 6 3,1117
TTK TTK protein kinase 3,111003
AMPH Amphiphysin 3,105592
KLRG1 killer cell lectin-like receptor subfamily G, member 1" 3,101475
TMEM106C transmembrane protein 106C 3,096738
UBA5 ubiquitin-like modifier activating enzyme 5 3,095758
FUCA1 fucosidase, alpha-L- 1, tissue" 3,093508
GGTA1 glycoprotein, alpha-galactosyltransferase 1" 3,090182
TBC1D8B TBC1 domain family, member 8B (with GRAM domain)" 3,086032
ATAD2 ATPase family, AAA domain containing 2" 3,083222
TBC1D8B TBC1 domain family, member 8B (with GRAM domain)" 3,069616
NCAPG non-SMC condensin I complex, subunit G 3,064876
SPEG SPEG complex locus 3,036352
RNFT2 ring finger protein, transmembrane 2 3,034193
EDNRB endothelin receptor type B 3,033874
SAMD13 sterile alpha motif domain containing 13 3,032893
SATB1 SATB homeobox 1 3,029964
RRM2 ribonucleotide reductase M2 polypeptide 3,029954
ATP6V0A4 ATPase, H+ transporting, lysosomal V0 subunit a4" 3,027554
LMO7 LIM domain 7 3,023999
SLC1A1 solute carrier family 1 (neuronal/epithelial high affinity glutamate transporter, system Xag), member 1" 3,013368
TRO Trophinin 3,007376
NHLRC3 NHL repeat containing 3 3,003075
MYH10 myosin, heavy chain 10, non-muscle 3,000197
ASAH1 N-acylsphingosine amidohydrolase (acid ceramidase) 1 2,996805

204
KLHL4 kelch-like 4 (Drosophila) 2,987169
ANGPT1 angiopoietin 1 2,98547
ETV1 ets variant 1 2,983133
RBP1 retinol binding protein 1, cellular" 2,98245
TCF19 transcription factor 19 (SC1) 2,980965
GIMAP8 GTPase, IMAP family member 8" 2,977004
RNASE1 ribonuclease, RNase A family, 1 (pancreatic)" 2,975943
ATAD2 ATPase family, AAA domain containing 2" 2,962574
MELK maternal embryonic leucine zipper kinase 2,961678
DCLK1 doublecortin-like kinase 1 2,960902
DEPDC1B DEP domain containing 1B 2,959885
E2F2 E2F transcription factor 2 2,959335
BEND5 BEN domain containing 5 2,944889
HFE Hemochromatosis 2,942213
C1orf21 chromosome 1 open reading frame 21 2,939498
MGC16121 hypothetical protein MGC16121 2,938651
C17orf76 chromosome 17 open reading frame 76 2,929663
RICH2 Rho-type GTPase-activating protein RICH2 2,925252
FAM64A family with sequence similarity 64, member A" 2,925092
TXNDC16 thioredoxin domain containing 16 2,922002
CD46 CD46 molecule, complement regulatory protein" 2,921294
GNA14 guanine nucleotide binding protein (G protein), alpha 14 2,919711
PCDH17 protocadherin 17 2,916579
NUDT7 nudix (nucleoside diphosphate linked moiety X)-type motif 7 2,916499
LOC54492 neuralized-2 2,910138
ATAD2 ATPase family, AAA domain containing 2" 2,907876
COL1A2 collagen, type I, alpha 2" 2,905537
C6orf114 chromosome 6 open reading frame 114 2,904462
METTL2A methyltransferase like 2A 2,897252
ATAD2 ATPase family, AAA domain containing 2" 2,894996

205
COL1A2 collagen, type I, alpha 2" 2,893378
GPR124 G protein-coupled receptor 124 2,889106
GIMAP1 GTPase, IMAP family member 1" 2,888239
ATAD2 ATPase family, AAA domain containing 2" 2,881836
ANGPTL5 angiopoietin-like 5 2,881786
KIF18A kinesin family member 18A 2,875793
MAGEH1 melanoma antigen family H, 1 2,873733
THRA thyroid hormone receptor, alpha (erythroblastic leukemia viral (v-erb-a) oncogene homolog, avian)" 2,861482
PLS1 plastin 1 (I isoform) 2,854548
EPHA4 EPH receptor A4 2,853894
SMARCA2 SWI/SNF related, matrix associated, actin dependent regulator of chromatin, subfamily a, member 2" 2,851817
FGGY FGGY carbohydrate kinase domain containing 2,849485
ITGB3 integrin, beta 3 (platelet glycoprotein IIIa, antigen CD61)" 2,847288
KBTBD7 kelch repeat and BTB (POZ) domain containing 7 2,815308
ATAD2 ATPase family, AAA domain containing 2" 2,812275
FAM74A3 family with sequence similarity 74, member A3" 2,807836
MRAP2 melanocortin 2 receptor accessory protein 2 2,806959
FADS2 fatty acid desaturase 2 2,804734
FAM64A family with sequence similarity 64, member A" 2,803523
EPHX2 epoxide hydrolase 2, cytoplasmic 2,802932
FAM64A family with sequence similarity 64, member A" 2,802722
FAM113B family with sequence similarity 113, member B 2,795731
NR1H3 nuclear receptor subfamily 1, group H, member 3" 2,786837
FAM83D family with sequence similarity 83, member D 2,771843
CEP192 centrosomal protein 192kDa 2,769905
KCNMA1 potassium large conductance calcium-activated channel, subfamily M, alpha member 1" 2,747961
GUCY1B3 guanylate cyclase 1, soluble, beta 3 2,739744
DZIP1 DAZ interacting protein 1 2,735478
NPAL3 NIPA-like domain containing 3 2,719882
SEMA3D sema domain, immunoglobulin domain (Ig), short basic domain, secreted, (semaphorin) 3D 2,719666
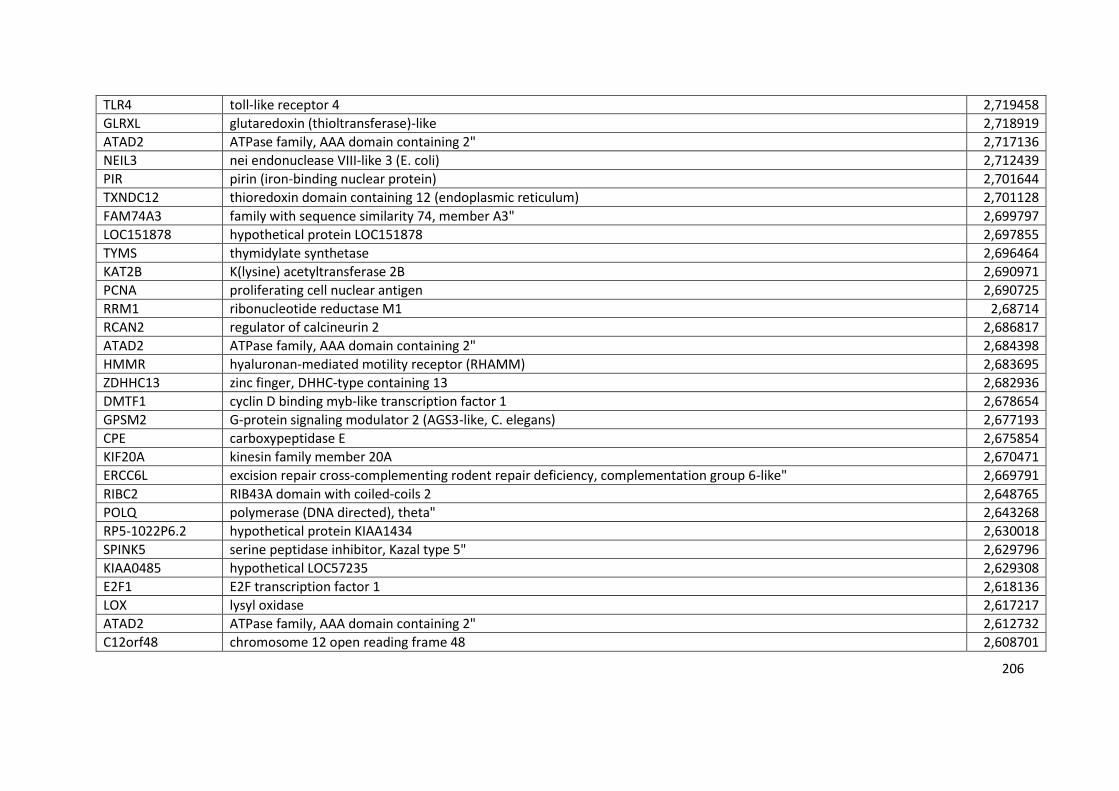
206
TLR4 toll-like receptor 4 2,719458
GLRXL glutaredoxin (thioltransferase)-like 2,718919
ATAD2 ATPase family, AAA domain containing 2" 2,717136
NEIL3 nei endonuclease VIII-like 3 (E. coli) 2,712439
PIR pirin (iron-binding nuclear protein) 2,701644
TXNDC12 thioredoxin domain containing 12 (endoplasmic reticulum) 2,701128
FAM74A3 family with sequence similarity 74, member A3" 2,699797
LOC151878 hypothetical protein LOC151878 2,697855
TYMS thymidylate synthetase 2,696464
KAT2B K(lysine) acetyltransferase 2B 2,690971
PCNA proliferating cell nuclear antigen 2,690725
RRM1 ribonucleotide reductase M1 2,68714
RCAN2 regulator of calcineurin 2 2,686817
ATAD2 ATPase family, AAA domain containing 2" 2,684398
HMMR hyaluronan-mediated motility receptor (RHAMM) 2,683695
ZDHHC13 zinc finger, DHHC-type containing 13 2,682936
DMTF1 cyclin D binding myb-like transcription factor 1 2,678654
GPSM2 G-protein signaling modulator 2 (AGS3-like, C. elegans) 2,677193
CPE carboxypeptidase E 2,675854
KIF20A kinesin family member 20A 2,670471
ERCC6L excision repair cross-complementing rodent repair deficiency, complementation group 6-like" 2,669791
RIBC2 RIB43A domain with coiled-coils 2 2,648765
POLQ polymerase (DNA directed), theta" 2,643268
RP5-1022P6.2 hypothetical protein KIAA1434 2,630018
SPINK5 serine peptidase inhibitor, Kazal type 5" 2,629796
KIAA0485 hypothetical LOC57235 2,629308
E2F1 E2F transcription factor 1 2,618136
LOX lysyl oxidase 2,617217
ATAD2 ATPase family, AAA domain containing 2" 2,612732
C12orf48 chromosome 12 open reading frame 48 2,608701
207
LMO7 LIM domain 7 2,60593
TLR4 toll-like receptor 4 2,594917
PLEKHA6 pleckstrin homology domain containing, family A member 6" 2,591856
LGR4 leucine-rich repeat-containing G protein-coupled receptor 4 2,589069
CCDC3 coiled-coil domain containing 3 2,579823
C4orf12 chromosome 4 open reading frame 12 2,578949
RACGAP1 Rac GTPase activating protein 1 2,571524
FLJ30901 hypothetical protein FLJ30901 2,570284
LOX lysyl oxidase 2,569416
RNASEL ribonuclease L (2',5'-oligoisoadenylate synthetase-dependent) 2,56885
ERLIN2 ER lipid raft associated 2 2,566741
MTSS1 metastasis suppressor 1 2,565103
NCAM2 neural cell adhesion molecule 2 2,56095
CFH complement factor H 2,558314
SGIP1 SH3-domain GRB2-like (endophilin) interacting protein 1 2,557269
KIAA1522 KIAA1522 2,554842
ALDH5A1 aldehyde dehydrogenase 5 family, member A1" 2,550732
FAM64A family with sequence similarity 64, member A" 2,547409
INHBB inhibin, beta B" 2,540446
C16orf75 chromosome 16 open reading frame 75 2,537688
KIF20A kinesin family member 20A 2,534352
MYH10 myosin, heavy chain 10, non-muscle 2,527407
LTA4H leukotriene A4 hydrolase 2,525544
ADSS adenylosuccinate synthase 2,519818
PLK4 polo-like kinase 4 (Drosophila) 2,518215
CCL23 chemokine (C-C motif) ligand 23 2,512078
C10orf58 chromosome 10 open reading frame 58 2,507434
KIF20A kinesin family member 20A 2,495433
PBX1 pre-B-cell leukemia homeobox 1 2,487947
C3orf64 chromosome 3 open reading frame 64 2,479864
208
PAM peptidylglycine alpha-amidating monooxygenase 2,475382
LOX lysyl oxidase 2,467707
PTGER4 prostaglandin E receptor 4 (subtype EP4) 2,464955
DIAPH3 diaphanous homolog 3 (Drosophila) 2,460108
LOC100129406 hypothetical protein LOC100129406 2,448051
RAB38 RAB38, member RAS oncogene family" 2,446264
RUNX1T1 runt-related transcription factor 1; translocated to, 1 (cyclin D-related)" 2,442814
ALDH2 aldehyde dehydrogenase 2 family (mitochondrial) 2,440793
KIAA0586 KIAA0586 2,434786
CASC5 cancer susceptibility candidate 5 2,424181
C1R complement component 1, r subcomponent" 2,420773
LOC100134119 similar to hCG2018924 2,420194
CD302 CD302 molecule 2,413478
SGOL2 shugoshin-like 2 (S. pombe) 2,410969
DYNC1I1 dynein, cytoplasmic 1, intermediate chain 1" 2,410772
FAM64A family with sequence similarity 64, member A" 2,409291
TM7SF3 transmembrane 7 superfamily member 3 2,40264
EXO1 exonuclease 1 2,378808
NAIP NLR family, apoptosis inhibitory protein" 2,374909
C18orf56 chromosome 18 open reading frame 56 2,374383
FLJ14213 protor-2 2,37244
GIMAP8 GTPase, IMAP family member 8" 2,368156
ITGB2 integrin, beta 2 (complement component 3 receptor 3 and 4 subunit)" 2,366366
BRCA1 breast cancer 1, early onset" 2,35691
MALL mal, T-cell differentiation protein-like" 2,353596
SAMD12 sterile alpha motif domain containing 12 2,336493
LIPA lipase A, lysosomal acid, cholesterol esterase" 2,33034
MEF2C myocyte enhancer factor 2C 2,325836
P2RY5 purinergic receptor P2Y, G-protein coupled, 5" 2,32418
HNRNPA0 heterogeneous nuclear ribonucleoprotein A0 2,323535
209
NUDT15 nudix (nucleoside diphosphate linked moiety X)-type motif 15 2,308787
EXO1 exonuclease 1 2,306251
DPY19L4 dpy-19-like 4 (C. elegans) 2,28757
210
APPENDIX 2: TESTING THE EFFECTS OF AN ANGIOGENESIS-
BLOCKING ANTIBODY
A1.1 Angiogenesis assays
Wound healing usually depends on a combination of both cell migration and proliferation
(Boamah, 2007). Mitomycin C is an antibiotic that is activated in vivo into an alkylating agent
that binds to DNA, blocking DNA synthesis and inhibiting cell growth (Yarrow et al., 2004).
Therefore, mitomycin C was added to the scratch wound assay to ensure that closure of the
wound was not due to cell division but to migration solely. Some care needs to be taken in
order to have a uniform width of the scratch. An alternative may be to grow the cells in special
inserts that contain a separation and remove the insert by the time of the assay. In this way, all
the scratches would be directly comparable.
Matrigel is a mixture of extracellular and basement membrane proteins derived from the mouse
Engelbreth–Holm–Swarm sarcoma on which endothelial cells attach and rapidly form tubes
(Lawley, 1898). Matrigel stimulates attachment, migration and differentiation of endothelial
cells into tubes mimicking in vivo angiogenesis (Auerbach et al., 2003). Electron microscopy
showed that tight junctions are formed between the endothelial cells during these assays.
Therefore, in vitro 2-dimensional tube formation assays are considered a model of capillary
development and represent the differentiation stage of angiogenesis (Auerbach et al., 2003;
Staton et al., 2006).

211
The ECSCR siRNA-mediated knockdown with duplex 1 (D1) was used as a control for further
experiments. An antibody company based in Belfast (Northern Ireland), Fusion Antibodies,
has produced a monoclonal antibody in mouse against the extracellular domain of ECSCR
(13G11). The naked protein, produced in bacteria, was used as an immunogen. This antibody
was employed in two angiogenesis assays: the scratch wound assay and the tube formation on
MatrigelTM.
A1.1.1 Scratch wound assay
Cell migration was observed over a period of 24h after making a scratch on siRNA knocked
down HUVECs (and controls, mock and negative control duplex) or HUVECs treated with 4.5,
23 and 45 nM of 13G11 antibody (and IgG controls). siRNA knocked down cells, after a period
of 24h seemed to be able to close the wound, but slower compared to the controls. In the
controls it was impossible to trace the scratch and the treated cells still showed a migration
phenotype. However, it is not quantitatively significant (figure A1). On the other hand, as little
as 4.5 nM of 13G11 antibody seemed to inhibit cell migration, since the wound is still not
closed after 24h (figure A1). All the used concentrations of blocking antibody have had an
effect on cell migration, which seems to be dose dependent.
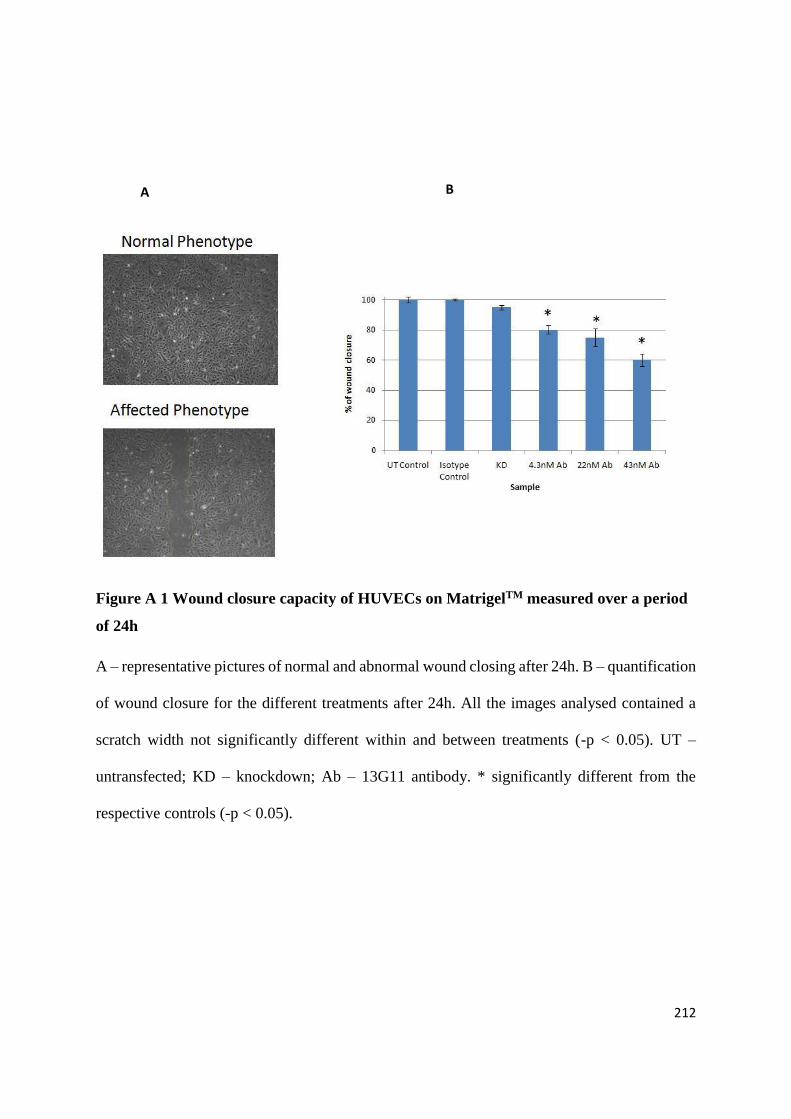
212
Figure A 1 Wound closure capacity of HUVECs on MatrigelTM measured over a period
of 24h
A – representative pictures of normal and abnormal wound closing after 24h. B – quantification
of wound closure for the different treatments after 24h. All the images analysed contained a
scratch width not significantly different within and between treatments (-p < 0.05). UT –
untransfected; KD – knockdown; Ab – 13G11 antibody. * significantly different from the
respective controls (-p < 0.05).
A B

213
A1.1.2 Matrigel tube formation assay
For the same treatments as on section A1.1.1, the ability of forming tubular structures on
MatrigelTM was assessed (Arnaoutova et al., 2009). Both siRNA knock down and 13G11
antibody at all concentrations had a negative effect on tube formation in contrast to the controls
(figure A2 B). The quantification of this effect was done by counting the number of nodes per
image, which was not significantly different (figure A2 B, blue bars). However, the images of
the phenotypes caused by either the 13G11 blocking antibody or siRNA looked quite different
from the respective controls. Therefore, the number of branches radiating from each node was
not only quantified but also qualified. Strong branches are those which are thick and connect
two nodes; weak branches still connect two nodes, but are very thin; broken branches were also
counted because they budded from one particular node, but did not connect it to any other.
Compared to the respective controls both siRNA and increasing concentrations of 13G11
antibody caused a decreased number of strong branches and an increased number of weak and
broken branches sprouting from the nodes (figure A2 B).
Previous work (Bicknell and Nagy, unpublished) had suggested that ECSCR might be
upregulated at the transcript level in some types of human cancer, compared to matched normal
tissue (figure A3). The 13G11 antibody was used to stain tissue sections of normal versus
cancer, using a variety of tissues. No significant differences were found between the two types
of samples. The antibody seemed to recognise vessels and could be used for both
immunohistochemistry and immunofluorescence. Figure A4 illustrates an example of these
two techniques using 13G11. Interestingly, the staining seems to co-localise with ULEX (a
vascular marker) only on the lumen of the vessels.
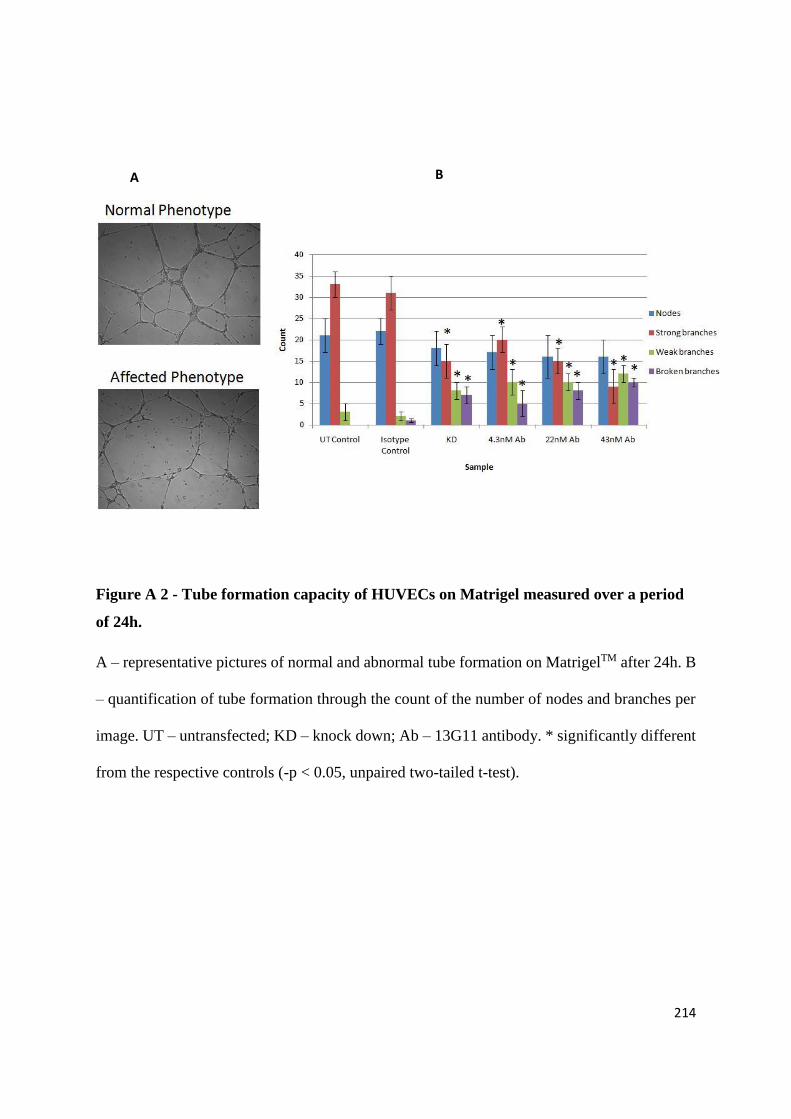
214
Figure A 2 - Tube formation capacity of HUVECs on Matrigel measured over a period
of 24h.
A – representative pictures of normal and abnormal tube formation on MatrigelTM after 24h. B
– quantification of tube formation through the count of the number of nodes and branches per
image. UT – untransfected; KD – knock down; Ab – 13G11 antibody. * significantly different
from the respective controls (-p < 0.05, unpaired two-tailed t-test).
A B
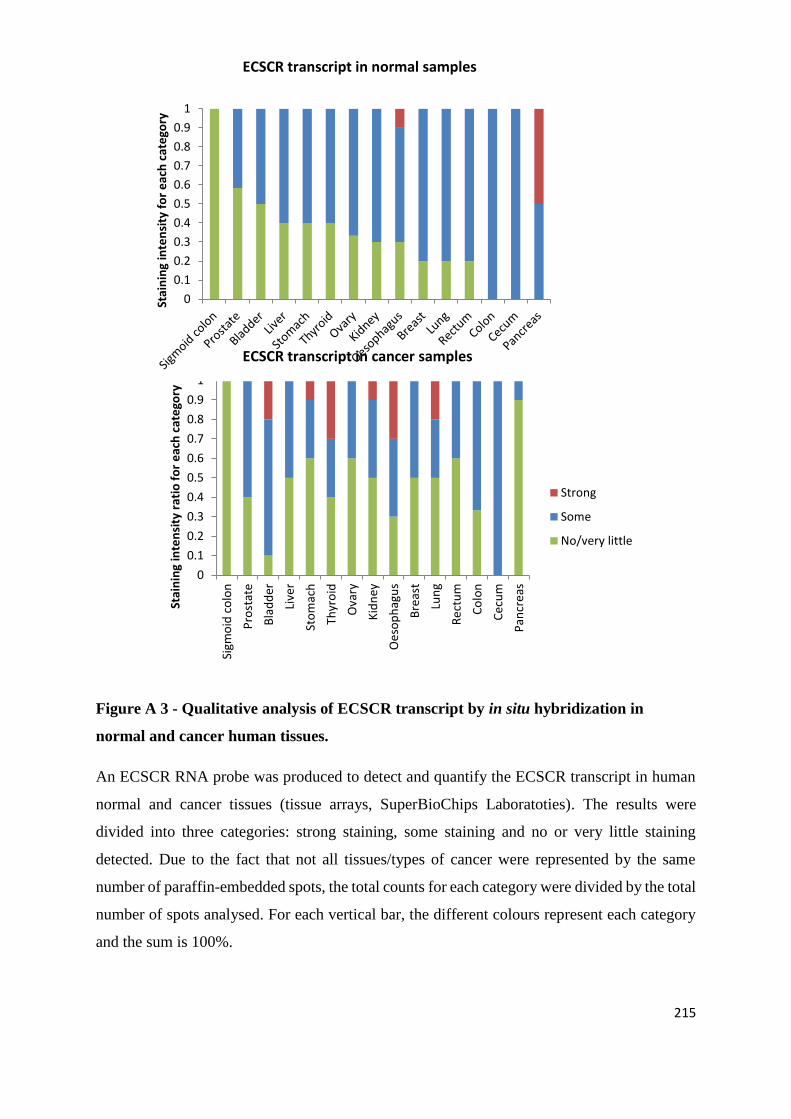
215
Figure A 3 - Qualitative analysis of ECSCR transcript by in situ hybridization in
normal and cancer human tissues.
An ECSCR RNA probe was produced to detect and quantify the ECSCR transcript in human
normal and cancer tissues (tissue arrays, SuperBioChips Laboratoties). The results were
divided into three categories: strong staining, some staining and no or very little staining
detected. Due to the fact that not all tissues/types of cancer were represented by the same
number of paraffin-embedded spots, the total counts for each category were divided by the total
number of spots analysed. For each vertical bar, the different colours represent each category
and the sum is 100%.
0
0.1
0.2
0.3
0.4
0.5
0.6
0.7
0.8
0.9
1
Sigm
oid
co
lon
Pro
stat
e
Bla
dd
er
Live
r
Sto
mac
h
Thyr
oid
Ova
ry
Kid
ney
Oe
sop
hag
us
Bre
ast
Lun
g
Re
ctu
m
Co
lon
Ce
cum
Pan
cre
as
Stai
nin
g in
ten
sity
rat
io f
or
eac
h c
ate
gory
Strong
Some
No/very little
0
0.1
0.2
0.3
0.4
0.5
0.6
0.7
0.8
0.9
1
Stai
nin
g in
ten
sity
fo
r e
ach
cat
ego
ry
ECSCR transcript in normal samples
ECSCR transcript in cancer samples

216
Figure A 4 - Breast cancer paraffin sections stained with 13G11.
Since ECSCR transcript seemed to be upregulated in some cancer types (figure A3), an
antibody against ECSCR (13G11) produced by our collaborators at Phusion Antibodies
(Belfast) was used to assess the protein levels in human paraffin samples (SuperBioChips
Laboratories) by immunofluorescence and immunohistochemistry. The qualitative results of
staining are shown on tables A3-A9. This figure shows an example of 13G11 endothelial-
specific staining in samples from human breast cancer. Panels on the left –
immunofluorescence; panel on the right immunohistochemistry. Endothelial cell markers were
used (Ulex, CD31) to confirm endothelial specificity of the 13G11 staining. All staining and
image analysis were performed with Dr. Stephanie Maloney, who has acquired these images
and kindly allowed their inclusion in this thesis.
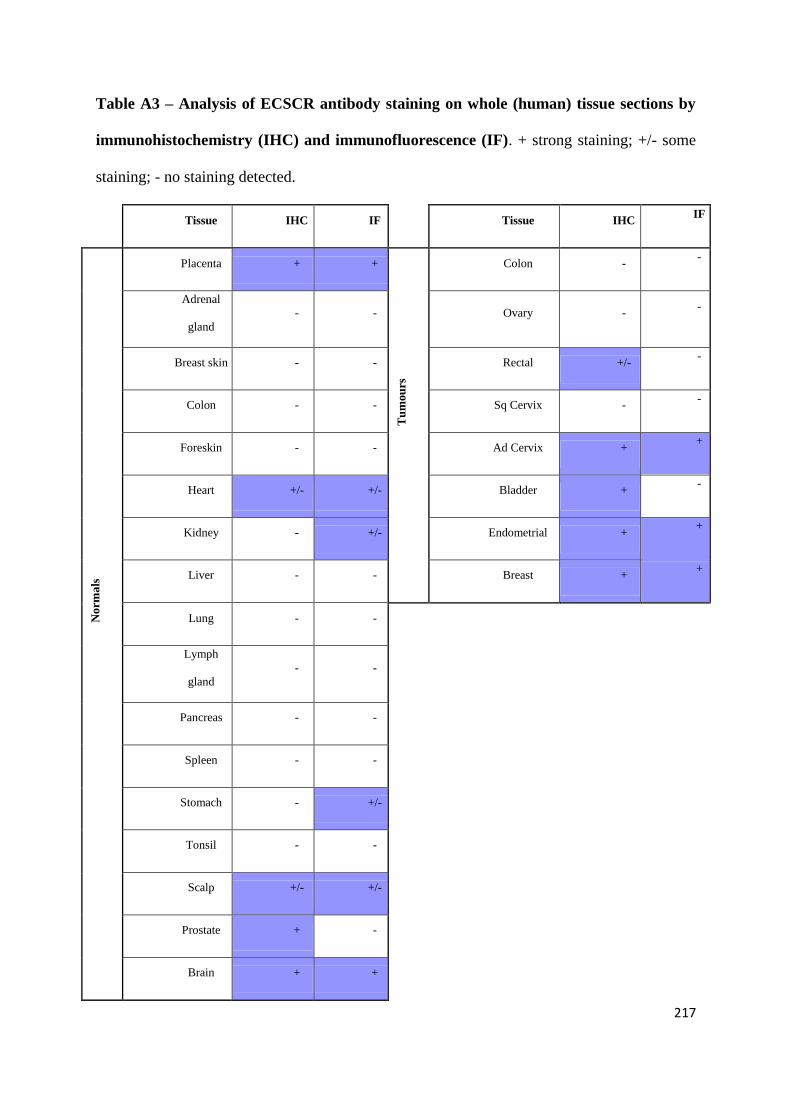
217
Table A3 – Analysis of ECSCR antibody staining on whole (human) tissue sections by
immunohistochemistry (IHC) and immunofluorescence (IF). + strong staining; +/- some
staining; - no staining detected.
Tissue IHC IF Tissue IHC IF
No
rma
ls
Placenta + +
Tu
mou
rs
Colon - -
Adrenal
gland
- - Ovary - -
Breast skin - - Rectal +/- -
Colon - - Sq Cervix - -
Foreskin - - Ad Cervix + +
Heart +/- +/- Bladder + -
Kidney - +/- Endometrial + +
Liver - - Breast + +
Lung - -
Lymph
gland
- -
Pancreas - -
Spleen - -
Stomach - +/-
Tonsil - -
Scalp +/- +/-
Prostate + -
Brain + +

218
Table A4 – Analysis of ECSCR antibody staining on human cancer tissue array MA2
(SuperBioChips Laboratories) by immunohistochemistry. + strong staining; +/- some
staining; - no staining detected. The numbers on the first column represent each spot for each
sample type. The cells with no annotation mean that either that specific spot got lost or damaged
during processing or there were less spots present in the chip for that specific tissue.
Tissue microarray MA2 common cancers
# stomach esophagus lung colon thyroid Kidney
1 - - - - +/- -
2 - +/- - - - +/-
3 + - + - + -
4 + - - + +/- -
5 +/- + + - +/- +/-
6 - - - - - -
7 - +/- +/- - - -
8 - + - - + +/-
9 - - - - -
10 - +/- +/- - -

219
Table A5 – Analysis of ECSCR antibody staining on human normal tissue array MAN2
(SuperBioChips Laboratories) by immunohistochemistry. + strong staining; +/- some
staining; - no staining detected. The numbers on the first column represent each spot for each
sample type. The cells with no annotation mean that either that specific spot got lost or damaged
during processing or there were less spots present in the chip for that specific tissue.
Tissue microarray MAN2 matching normals
# stomach esophagus lung colon thyroid kidney
1 - +/- + + + +
2 + +/- +/- - - +/-
3 - + - + +/- +
4 - + +/- + - +/-
5 + + + - +/- -
6 - + + - + -
7 +/- +/- + - - +/-
8 - - + + +/- -
9 - + + - - -
10 - - +/- + -

220
Table A6 – Analysis of ECSCR antibody staining on human cancer tissue array MB3
(SuperBioChips Laboratories) by immunohistochemistry. + strong staining; +/- some
staining; - no staining detected. The numbers on the first column represent each spot for each
sample type. The cells with no annotation mean that either that specific spot got lost or damaged
during processing or there were less spots present in the chip for that specific tissue.
Tissue microarray MB3 common cancers
# breast liver bladder ovary pancreas prostate
1 + +/- - - +/- -
2 - - +/- + - -
3 +/- - - + - +/-
4 +/- - - + - -
5 - +/- + - - -
6 - - - - - +/-
7 + +/- - - - +/-
8 - - - + - -
9 - - +/- + - -
10 - - - - -

221
Table A7 – Analysis of ECSCR antibody staining on human normal tissue array MBN3
(SuperBioChips Laboratories) by immunohistochemistry. + strong staining; +/- some
staining; - no staining detected. The numbers on the first column represent each spot for each
sample type. The cells with no annotation mean that either that specific spot got lost or damaged
during processing or there were less spots present in the chip for that specific tissue.
Tissue microarray MBN3 matching normals
# breast liver bladder ovary pancreas prostate
1 +/- - - +/- +/-
2 + +/- - + + +/-
3 - + - +/- - +
4 + - +/- + + -
5 - - +/- +/- - +
6 + - - + + -
7 +/- - + - - -
8 +/- - + - - +
9 + +/- - + - +
10 +/- - - + +/-

222
Table A8 – Analysis of ECSCR antibody staining on human cancer tissue array MC4
(SuperBioChips Laboratories) by immunohistochemistry. + strong staining; +/- some
staining; - no staining detected. The numbers on the first column represent each spot for each
sample type. The cells with no annotation mean that either that specific spot got lost or damaged
during processing or there were less spots present in the chip for that specific tissue.
Tissue microarray MC4 common cancers
# Endometrium
Gall-
bladder
Larynx Cervix Lymphoma Melanoma
1 +/- - - - - -
2 +/- +/- - - +/- -
3 - - +/- - -
4 - - - - + -
5 - - - +/- - -
6 - +/- - - - +/-
7 - - - - +/- +
8 - - - - - -
9 - - +/- +/- +/- -
10 +/- - +/- -

223
Table A9 – Analysis of ECSCR antibody staining on human normal tissue array MCN4
(SuperBioChips Laboratories) by immunohistochemistry. + strong staining; +/- some
staining; - no staining detected. The numbers on the first column represent each spot for each
sample type. The cells with no annotation mean that either that specific spot got lost or damaged
during processing or there were less spots present in the chip for that specific tissue.
Tissue microarray MCN4 matching normals
# Endometrium
Gall-
bladder
Larynx Cervix Lymphoma Melanoma
1 - + - + +/- -
2 - - + +/- +/- +
3 - - + + + -
4 - - +/- + + +/-
5 - + + +/- +/-
6 + + + +/- - +/-
7 - +/- + -
8 - +/- +/- +/- -
9 + + + +
10 +/- +/- +/- - +/-

224
While the functional assays and tissue staining were being done in Birmingham, the isotype
(IgG1) and epitope of 13G11 were being determined in Belfast. In order to map the epitope,
several constructs were made, lacking segments of the protein (figure A5) and subsequent
western blots were performed to assess where the antibody would bind or not. The epitope
recognised by 13G11, QTVPPNSTTM, is located between amino acids 91 and 100.
To test the specificity of 13G11 for ECSCR, in Belfast, HEK 293T cells were transfected with
ECSCR-GFP (and untransfected HEK 293T cells were used as a control). The antibody has
recognised a protein at about 55 kDa in the transfected lysate. This corresponds to the size of
a fusion protein between GFP and unglycosylated or very little glycosylated ECSCR.
Several attempts were made to use 13G11 to detect ECSCR in HUVEC lysate, but they were
unsuccessful. In order to further test for specificity, HUVECs were transfected with ECSCR
siRNA (and respective controls) and analysed by FACS. This analysis has shown that the
antibody binds to HUVECs, but does not recognise ECSCR (figure A 7), as there is a shift from
the population not treated with 13G11 to the populations exposed to the antibody, but there are
no differences between mock, negative control duplex and ECSCR siRNA.
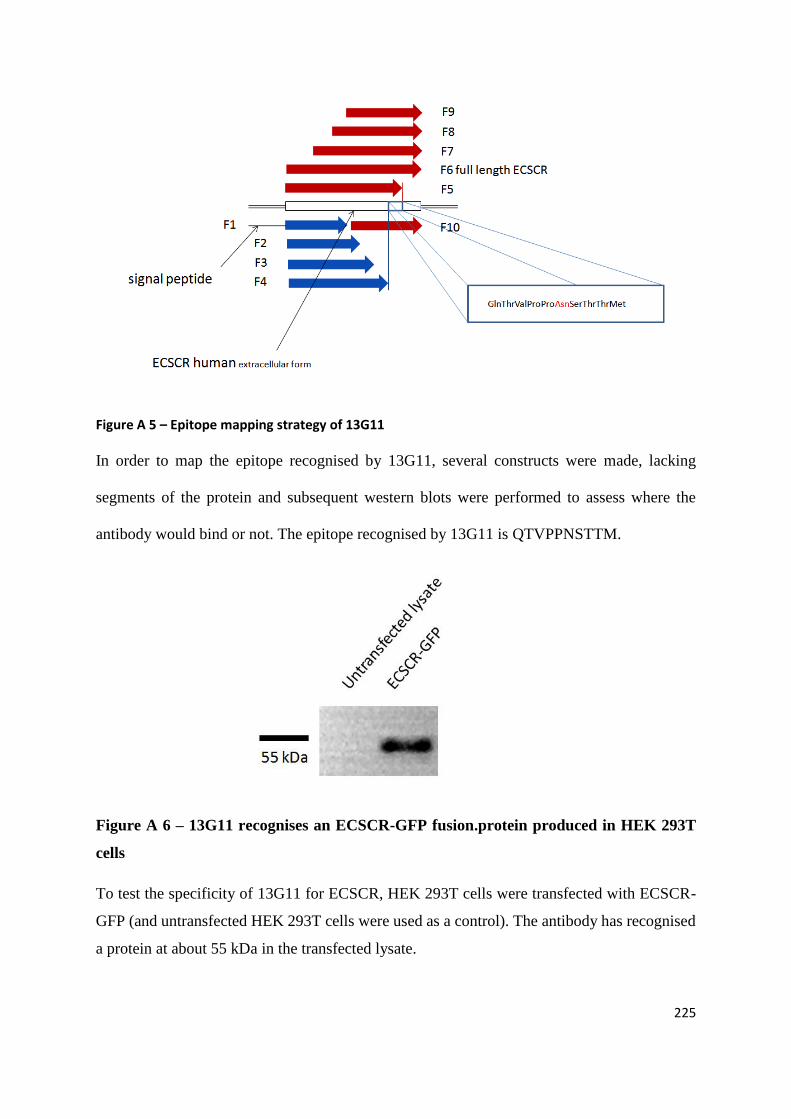
225
Figure A 5 – Epitope mapping strategy of 13G11
In order to map the epitope recognised by 13G11, several constructs were made, lacking
segments of the protein and subsequent western blots were performed to assess where the
antibody would bind or not. The epitope recognised by 13G11 is QTVPPNSTTM.
Figure A 6 – 13G11 recognises an ECSCR-GFP fusion.protein produced in HEK 293T
cells
To test the specificity of 13G11 for ECSCR, HEK 293T cells were transfected with ECSCR-
GFP (and untransfected HEK 293T cells were used as a control). The antibody has recognised
a protein at about 55 kDa in the transfected lysate.
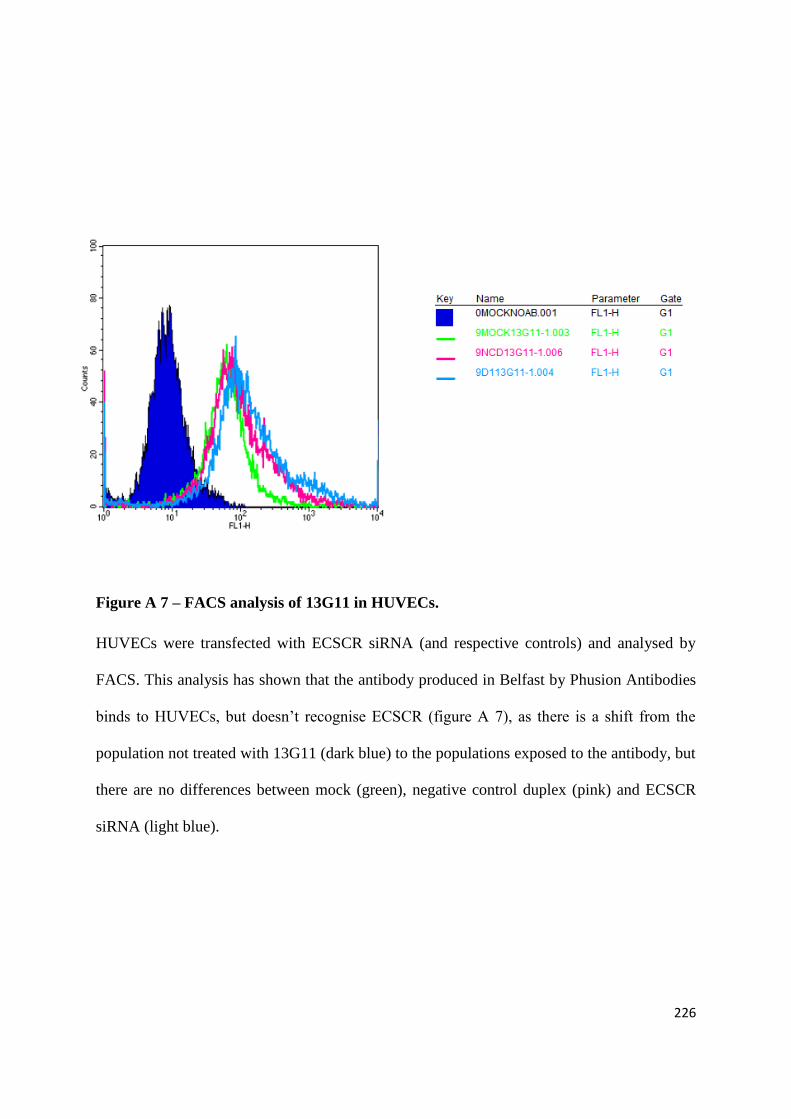
226
Figure A 7 – FACS analysis of 13G11 in HUVECs.
HUVECs were transfected with ECSCR siRNA (and respective controls) and analysed by
FACS. This analysis has shown that the antibody produced in Belfast by Phusion Antibodies
binds to HUVECs, but doesn’t recognise ECSCR (figure A 7), as there is a shift from the
population not treated with 13G11 (dark blue) to the populations exposed to the antibody, but
there are no differences between mock (green), negative control duplex (pink) and ECSCR
siRNA (light blue).

227
APPENDIX 3: RE-PRINT OF THE THESIS-RELATED PUBLICATION
Verissimo AR, Herbert JMJ, Heath VL, Legg JA, Sheldon H, Andre M, Swain RK and
Bicknell R. (2009). Functionally defining the endothelial transcriptome, from Robo4 to
ECSCR. Biochem Soc Trans. 37: 1214-1217

228
APPENDIX 4: LIST OF PRESENTED ABSTRACTS
1. Poster presentations
2011 – The role of ECSCR in endothelial cell biology. Gordon Research Conference on
Vascular Cell Biology, Ventura, CA, USA.
2010 – Regulation of zebrafish developmental angiogenesis by endothelial cell specific
chemotaxis regulator (ECSCR). 9th International Zebrafish Development and Genetics
Conference, Madison, WI, USA.
2009 – Endothelial cell specific molecule 2 is involved in actin cytoskeleton modulation.
Molecular and Cellular Mechanisms of Angiogenesis (Biochemical Society meeting), Chester,
UK.
2009 – Endothelial cell specific molecule 2 is involved in actin cytoskeleton modulation.
Angionet Meeting, Dundee, UK.
2. Oral presentations
2010 – Functional characterisation of ECSCR. EMBO mouse anatomy and embryology
practical course, Split, Croatia – award for best oral presentation.
2009 – The role of endothelial cell specific molecule 2 in angiogenesis. VITA seminars,
University of Birmingham, UK.

229
REFERENCES

230
Akhtar T, Li J, Olden T, and Wallace KN. (2009). Use of Phospholipase A2 for Antigen
Retrieval in Zebrafish Whole-Mount Immunohistochemistry. Zebrafish. 6(3): 223–227.
Akinc A, Thomas M, Klibanov AM, Langer R. (2004). Exploring polyethylenimine-mediated
DNA transfection and the proton sponge hypothesis. J Gene Med. 7 (5): 657–663.
Anderson EBQ, Khvorova A, Karpilow J. (2008) Identifying siRNA-induced offtargets by
microarray analysis. Methods Mol Biol. 442: 45-63.
Andrade SP, Ferreira MA. (2009). The sponge implant model of angiogenesis. Methods Mol
Biol. 467:295-304.
Armstrong L-J, Heath VL, Sanderson S, Kaur S, Beesley JFJ, Herbert JM, Legg JA, Poulsom
R and Bicknell R. (2008). ECSM2, an endothelial specific filamin A binding protein that
mediates chemotaxis. Arterioscler Thromb Vasc Biol. 28:1640-1646.
Armstrong L-J. (2005). Characterisation of the endothelial specific molecule ECSM2. D.Phil.
Thesis, University of Oxford, Oxford, U.K.
Arnaoutova I, George J, Kleinman HK, Benton G. (2009). The endothelial cell tube formation
assay on basement membrane turns 20: state of the science and the art. Angiogenesis.
12(3):267-74.
Atochina EN, Balyasnikova IV, Danilov SM, Granger DN, Fisher AB, Muzykantov VR.
(1998). Immunotargeting of catalase to ACE or ICAM-1 protects perfused rat lungs
against oxidative stress. Am J Physiol. 275(4 Pt 1):L806-17.
Auerbach R, Lewis R, Shinners B, Kubai L, and Aktar N. (2003) Angiogenesis assays: a critical
overview. Clin. Chem. 49: 32-40.

231
Baker M, Robinson SD, Lechertier T, Barber PR, Tavora B, D'Amico G, Jones DT, Vojnovic
B and Hodivala-Dilke K. (2012). Use of the mouse aortic ring assay to study
angiogenesis. Nature Protocols. 7(1): 89-104.
Baldessari D and Mione M. (2008). How to create the vascular tree? (Latest) help from the
zebrafish. Pharmacology and Therapeutics. 118: 206-230.
Bazzoni G and Dejana E. (2004). Endothelial cell to cell junctions: molecular organisation and
role in vascular homeostasis. Physiol Rev. 84: 869-901.
Bedell VM, Westcot SE, Ekker SC. (2011). Lessons from morpholino-based screening in
zebrafish. Brief Funct Genomics. 10(4):181-8.
Bergers G and Hanahan D. (2008). Models of resistance to anti-angiogenic therapy. Nat Rev
Cancer. 8: 592-603.
Blaser H, Reichman-Fried M, Castanon I, Dumstrei K, Marlow FL, Kawakami K, Solnica-
Krezel L, Heisenberg CP and Raz E. (2006). Migration of zebrafish primordial germ
cells: a role for myosin contraction and cytoplasmic flow. Dev. Cell. 11(5): 613–627.
Boamah EK. (2007). Mitomycin-DNA adducts induce p53 dependant and p53 independant cell
death pathways. ACS Chemical Biology, 399-407.
Bredt DS. (1998). Sorting out genes that regulate epithelial and neuronal polarity. Cell. 94:691–
694.
Bretscher A, Edwards K and Fehon RG. (2002). ERM proteins and merlin: Integrators at the
cell cortex. Nat Rev Mol Cell Biol, 3:586–599.
Brown JM and Wilson WR. (2004). Exploiting tumour hypoxia in cancer treatment. Nat Rev

232
Cancer. 4:437-447.
Carmeliet P. (2005). Angiogenesis in life, disease and medicine. Nature. 438 (15): 932-936.
Castets M, Mehlen P. (2010). Netrin-1 role in angiogenesis: to be or not to be a pro-angiogenic
factor? Cell Cycle. 15;9(8):1466-71.
Cha YR and Weinstein BM. (2007). Visualization and experimental analysis of blood vessel
formation using transgenic zebrafish. Birth Defects Research (Part C). 81: 286-296.
Childs S, Chen JN, Garrity DM and Fishman MC. (2002). Patterning of angiogenesis in the
zebrafish embryo. Development. 129: 973-982.
Coultas L, Chawengsaksophak K and Rossant J. (2005). Endothelial cells and VEGF in
vascular development. Nature Insights. 937-945.
Davidson AJ and Zon LI. (2004). The definitive (and primitive) guide to zebrafish
hematopoiesis. Oncogene. 23: 7233-7146.
Delvaeye M, De Vriese A, Zwerts F, Betz I, Moons M, Autiero M, Conway EM. (2009). Role
of the 2 zebrafish survivin genes in vasculo-angiogenesis, neurogenesis, cardiogenesis
and hematopoiesis. BMC Dev Biol. 26;9:25.
Denekamp J. (1982). Endothelial cell proliferation as a novel approach to targeting tumour
therapy. Br. J. Cancer. 45: 136-139.
Dennis G, Sherman BT, Hosack DA, Yang J, Baseler MW, Lane HC, Lempicki RA. (2003).
DAVID: Database for Annotation, Visualization, and Integrated Discovery. Genome
Biology. 4(5): p3.
233
Dewhirst MW, Cao Y and Moeller B. (2008). Cycling hypoxia and free radicals regulate
angiogenesis and radiotherapy response. Nat Rev Cancer. 8: 425-437.
Doyon Y, McCammon J, Miller JC, Faraji F, Ngo C, Katibah GE, Amora R, Hocking TD,
Zhang L, Rebar EJ, Gregory PD, Urnov FD and Amacher SL. (2008). Heritable targeted
gene disruption in zebrafish using designed zinc finger nucleases. Nat Biotechnol. 26(6):
702-708.
Dudek AZ, Bodempudi V, Welsh BW, Jasinski P, Griffin RJ, Milbauer L, Hebbel RP. (2007).
Systemic inhibition of tumour angiogenesis by endothelial cell-based gene therapy. Br J
Cancer. 97(4):513-22.
Ekker SC. (2000). Morphants: a new systemic vertebrate functional genomics approach. Yeast
17: 302-306.
Ekker SC. (2008). Zinc finger-based knockout punches for zebrafish genes. Zebrafish. 5(2):
121-123.
Fang K, Bruce M, Pattillo CB, Zhang S, Stone R 2nd, Clifford J and Kevil CJ. (2011). Temporal
genomewide expression profiling of DSS colitis reveals novel inflammatory and
angiogenesis genes similar to ulcerative colitis. Physiol. Genomics. 43: 43-56.
Feil S, Valtcheva N and Feil R. (2009). Inducible Cre mice. Methods Mol Biol. 530:343-63.
Felty Q. (2011). Proteomic 2D DIGE profiling of human vascular endothelial cells exposed to
environmentally relevant concentration of endocrine disruptor PCB153 and
physiological concentration of 17β-estradiol. Cell Biol Toxicol. 27(1):49-68.
Ferrara N. (2002). VEGF and the quest for tumour angiogenesis factors. Nat Rev Cancer. 2:
795-803.

234
Ferrara N and Kerbel RS. (2005). Angiogenesis as a therapeutic target. Nature Insights. 967-
974.
Fischer AH, Jacobson KA, Rose J, Zeller R. (2008). Hematoxylin and eosin staining of tissue
and cell sections. CSH Protoc. doi: 10.1101/pdb.prot4986.
Flamme I, Frolich T and Risau W. (1997). Molecular Mechanisms of Vasculogenesis and
Embryonic Angiogenesis. J Cell Physiol. 173:206–210.
Folkman J. (1971) Tumor angiogenesis: therapeutic implications. N Eng J Med. 285: 1182-
1186.
Folkman J and Klagsbrun M. (1987) Angiogenic factors. Science 235: 442-447.
Fouquet B, Weinstein BM, Serluca FC and Fishman MC. (1997). Vessel Patterning in the
Embryo of the Zebrafish: Guidance by Notochord. Developmental Biology. 183: 37-48.
Friedel RH, Plump A, Lu X, Spilker K, Jolicoeur C, Wong K, Venkatesh TR, Yaron A, Hynes
M, Chen B, Okada A, McConnell SK, Rayburn H and Tessier-Lavigne M. (2005). Gene
targeting using a promoterless gene trap vector. Proc Natl Acad Sci U S A. 102: 13188-
13193.
Fukumura D, Kashiwagi S and Jain R. (2006). The role of nitric oxide in tumour progression.
Nat Rev Cancer. 6: 521-534.
Garcia P, Berlanga O, Watson R and Frampton J. (2005). Generation of a conditional allele of
the B-myb gene. Genesis. 43: 189-195.
Gariano RF and Gardner TW. (2005). Retinal angiogenesis in development and disease. Nature
insights. 960-966.

235
Gering M and Patient P. (2005). Hedgehog signalling is required for adult blood stem cell
formation in zebrafish embryos. Dev. Cell. 8:389-400.
Giganti A, Plastino J, Janji B, Van Troys M, Lentz D, Ampe C, Sykes C, Friederich E. (2005).
Actin-filament cross-linking protein T-plastin increases Arp2/3-mediated actin-based
movement. J Cell Sci. 118(Pt 6):1255-65.
Gilbert SF. (2006). Developmental Biology. 8th Edition. Sinauer Associates, Inc. Sunderland,
Massachussets, USA. 817 pp.
Gomez TS, Kumar K, Medeiros RB, Shimizu Y, Leibson PJ, Billadeau DD. Immunity. (2007).
Formins regulate the actin-related protein 2/3 complex-independent polarization of the
centrosome to the immunological synapse. 26(2):177-90.
Gould GW and Lippincott-Schwartz J. (2009). New roles for endosomes: from vesicular
carriers to multi-purpose platforms. Nat Rev Cancer. 10: 287-292.
Graf T. (2002). Differentiation plasticity of hematopoietic cells. Blood. 99: 3089-3101.
Green AR, Salvaris E and Begley CG. (1991). Erythroid expression of the 'helix-loop-helix'
gene, SCL. Oncogene. 6(3): 475-479.
Greenberg DA and Jin K. (2005). From angiogenesis to neuropathy. Nature Insights. 954-959.
Gustafsson E, Brakebusch C, Hietanen K and Fässler R. (2000). Tie-1-directed expression of
Cre recombinase in endothelial cells of embryoid bodies and transgenic mice. J Cell Sci.
114(4): 671-676.
Harrigan RA and Jones K. (2002). ABC of clinical electrocardiography - conditions affecting
the right side of the heart. BMJ. 324: 1201-1204.

236
Harris BZ and Lim WA. (2001). Mechanism and role of PDZ domains in signalling complex
assembly. J Cell Sci. 114: 3219–3231.
Herbert JM, Stekel D, Sanderson S, Heath VL and Bicknell R. (2008) A novel method of
differential gene expression analysis using multiple cDNA libraries applied to the
identification of tumour endothelial genes. BMC Genomics 9:153-173.
Herbert SP, Huisken J, Kim TN, Feldman ME, Houseman BT, Wang RA, Shokat KM and
Stainier DYR. (2009). Arterial-Venous Segregation by Selective Cell Sprouting: An
Alternative Mode of Blood Vessel Formation. Science. 326 (5950): 294-298.
Hsia N and Zon LI. (2005). Transcriptional regulation of hematopoietic stem cell development
in zebrafish. Exp Hematol. 33(9): 1007-1014.
Hu G., Tang J, Zhang B., Lin Y, Hanai J, Galloway J, Bedell V, BaharyN, Han Z, Ramchandran
R, Thisse B, Thisse C, Zon LI and Sukhatme1 VP. (2006). A novel endothelial-specific
heat shock protein HspA12B is required in both zebrafish development and endothelial
functions in vitro. J Cell Sci. 119: 4117-4126
Huminiecki L and Bicknell R. (2000). In silico cloning of novel endothelial-specific genes.
Genome Res. 10 (11): 1796-1806.
Huttlin EL, Jedrychowski MP, Elias JE, Goswami T, Rad R, Beausoleil SA, Villén J, Haas W,
Sowa ME, Gygi SP. (2010). A tissue-specific atlas of mouse protein phosphorylation and
expression. Cell. 143(7):1174-89.
Ikeda K, Nakano R, Uraoka M, Nakagawa Y, Koide M, Katsume A, Minamino K, Yamada E,
Yamada H, Quetermous T and Matsubara H. (2009). Identification of ARIA regulating
237
endothelial apoptosis and angiogenesis by modulating proteasomal degradation of cIAP-
1 and cIAP-2. Proc Nat Acad Sci USA. 106(20): 8227-8232.
Isogai S, Horiguchi M and Weinstein BM. (2001). The vascular anatomy of the developing
zebrafish: an atlas of embryonic and early larval development. Dev Biol. 230(2): 278-
301.
Isogai S, Lawson ND, Torrealday S, Horiguchi M, Weinstein BM. (2003). Angiogenic network
formation in the developing vertebrate trunk. Development. 130(21):5281-90.
Jaffe, EA, Nachman, RL, Becker CG, and Minick R. (1973). Culture of human endothelial
cells derived from umbilical veins. Identification by morphologic and immunologic
criteria. J Clin Invest. 52(11): 2745-2756.
Jia J, Wang J, Teh M, Sun W, Zhang J, Kee I, Chow PK, Liang RC, Chung MC, Ge R. (2010).
Identification of proteins differentially expressed between capillary endothelial cells of
hepatocellular carcinoma and normal liver in an orthotopic rat tumor model using 2-D
DIGE. Proteomics. 10(2):224-34.
Jones SL and Sharif Y. (2005). Asymmetrical protein kinase A activity establishes neutrophil
cytoskeletal polarity and enables chemotaxis. J Lekocyte Biol. 78
Jong JLO and Zon LI. (2005). Use of the zebrafish system to study primitive and definitive
hematopoiesis. Annu Rev Genet. 39: 481-501.
Kaczmarek E, Erb L, Koziak K, Jarzyna R, Wink MR, Guckelberger O, Blusztajn JK,
Trinkaus-Randall V, Weisman GA and Robson SC. (2005). Modulation of endothelial
cell migration by extracellular nucleotides: involvement of focal adhesion kinase and
phosphatidylinositol 3-kinase-mediated pathways. Thromb Haemost. 93(4):735-42.
238
Kidd KR and Weinstein BM. (2003) Fishing for novel angiogenic therapies. Br. J.Pharmacol.
140: 585-594.
Kim, L and Kimmel AR. (2006). GSK3 at the Edge: Regulation of Developmental
Specification and Cell Polarization. Curr Drug Targets. 7: 1411-1419.
Kimmel CB, Ballard WW, Kimmel SR, Ullmann B and Schilling TF. (1995). Stages of
Embryonic Development of the zebrafish. Developmental Dynamics. 203:253-310.
Koide, M., Ikeda, K., Akakabe, Y., Kitamura, Y., Ueyama, T., Matoba, S., Yamada, H.,
Okigaki, M. and Matsubara, H. (2011). Apoptosis regulator through modulating IAP
expression (ARIA) controls the PI3K/Akt pathway in endothelial and endothelial
progenitor cells. Proc. Natl. Acad. Sci. U.S.A. 108: 9472–9477.
Krupke DM, Begley DA, Sundberg JP, Bult CJ and Eppig JT. (2008). The mouse tumour
biology database. Nat Rev Cancer. 8: 459-465.
Kurosaka S and Kashina A. (2009). Cell Biology of Embryonic Migration. Birth Defects Res
C Embryo Today. 84(2): 102–122.
Lämmermann T, Bader BL, Monkley SJ, Worbs T, Wedlich-Söldner R, Hirsch K, Keller M,
Förster R, Critchley DR, Fässler R, Sixt M. (2008). Rapid leukocyte migration by integrin-
independent flowing and squeezing. Nature. 453(7191):51-5.
Lawley TJ. (1989) Induction to morphologic differentiation of endothelial cells in culture. J.
Invest. Dermatol. 93: 595-615.
Liang CC, Park AY, Guan JL. (2007). In vitro scratch assay: a convenient and inexpensive
method for analysis of cell migration in vitro. Nat Protoc. 2(2):329-33.

239
Liao EC, Paw BH, Oates AC, Pratt SJ, Postlethwait JH and Zon LI. (1998). SCL/Tal-1
transcription factor acts downstream of cloche to specify hematopoietic and vascular
progenitors in zebrafish. Genes Dev. 12(5):621-626.
Liu F and Patient R. (2008). Genome-wide analysis of the zebrafish ETS family identifies three
genes required for hemangioblast differentiation or angiogenesis. Circulation Research.
103: 1147-1154.
Livak KJ, Schmittgen TD. (2001). Analysis of relative gene expression data using real-time
quantitative PCR and the 2(-Delta Delta C(T)) Method. Methods. 25(4):402-8.
Loy CJ, Sim KS and Young EL. (2003). Filamin-A fragment localises to the nucleus to regulate
androgen receptor and coactivator functions. Proc. Natl. Acad. Sci. USA. 100: 4562-4567.
Luo Y, Batalao A, Zhou H and Zhu L. (1997). Mammalian Two-Hybrid System: A
Complementary Approach to the Yeast Two-Hybrid System. BioTechniques. 22:350-
352.
Ma AC, Lin R, Chan PK, Leung JC, Chan LY, Meng A, Verfaillie CM, Liang R, Leung AY.
(2007). The role of survivin in angiogenesis during zebrafish embryonic development.
BMC Dev Biol. 18;7:50.
Ma F, Zhang D, Yang H, Sun H, Wu W, Gan Y, Balducci J, Wei Y, Zhao X and Huang Y.
(2009). Endothelial cell-specific molecule 2 (ECSM2) modulates actin remodelling and
epidermal growth factor receptor signalling. Genes to Cells. 14:281-293.
Maciag T, Cerundolo J, Ilsley S, Kelley PR and Forand R. (1979). An endothelial cell growth
factor from bovine hypothalamus: identification and partial characterization. Proc Natl
Acad Sci U S A. 76(11): 5674-8.
240
Madri JA, Graesser D. (2000). Cell migration in the immune system: the evolving inter-related
roles of adhesion molecules and proteinases. Dev Immunol. 7(2-4):103-16.
Maiti D, Xu Z, Duh EJ. (2008). Vascular endothelial growth factor induces MEF2C and MEF2-
dependent activity in endothelial cells. Invest Ophthalmol Vis Sci. 49(8):3640-8
Mao X, Fujiwara Y, Orkin SH. (1999). Improved reporter strain for monitoring Cre
recombinase-mediated DNA excisions in mice. Proc Natl Acad Sci USA. 96:5037–5042.
Martin, S. and Murray, C. (Eds) (2009). Angiogenesis Protocols. 2nd Edition. Humana Press.
New York, USA. 358pp.
McClatchey AI and Fehon RG. (2009). Merlin and the ERM proteins--regulators of receptor
distribution and signaling at the cell cortex. Trends Cell Biol. 19(5):198-206.
McCormick CJ, Newbold CI, Berendt AR. (2000). Sulfated glycoconjugates enhance CD36-
dependent adhesion of Plasmodium falciparum-infected erythrocytes to human
microvascular endothelial cells. Blood. 96(1):327-33.
Meng X, Noyes MB, Zhu L, Lawson ND, Wolfe, SA. (2008). Targeted gene inactivation in
zebrafish using engineered zinc finger nucleases. Nat Biotechnol. 26(6): 695-701.
Mignatti, P and Rifkin DB. (1996) Plasminogen activators and matrix metalloproteinases in
angiogenesis. Enzyme protein 49 (1-3): 117-137.
Murre C. (2009). Developmental trajectories in early hematopoiesis. Genes and Development.
23: 2366-2370.
241
Naldini L, Blömer U, Gallay P, Ory D, Mulligan R, Gage FH, Verma IM, Trono D. 1996. In
vivo gene delivery and stable transduction of nondividing cells by a lentiviral vector.
Science. 272(5259):263-7.
Neri D and Bicknell R. (2005). Tumour vascular targeting. Nat Rev Cancer. 5: 436-446.
Niethammer M, Kim E and Sheng M. (1996). Interaction between the C terminus of NMDA
receptor subunits and multiple members of the PSD-95 family of membrane-associated
guanylate kinases. J Neurosci 16:2157–2163.
Pandya NM, Dhalla NS and Santan DD. (2006). Angiogenesis—a new target for future therapy.
Vascular Pharmacology. 44: 265-274.
Passman JN, Dong XR, Wu SP, Maguire CT, Hogan KA, Bautch VL, Majesky MW. (2008).
A sonic hedgehog signaling domain in the arterial adventitia supports resident Sca1+
smooth muscle progenitor cells. Proc Natl Acad Sci. 105(27):9349-54.
Pelosi E, Valtieri M, Coppola S, Botta R, Gabbianelli M, Lulli V, Marziali G, Masella B,
Muller R, Sgadari C, Testa U, Bonanno G and Peschle C. (2002) Identification of the
hemangioblast in postnatal life. Blood. 100:3203–3208.
Pettit SJ, Liang Q, Rairdan XY, Moran JL, Prosser HM, Beier DR, Lloyd KC, Bradley A and
Skarnes WC. (2009). Agouti C57BL/6N embryonic stem cells for mouse genetic
resourced. Nat Methods. 6: 493-495.
Piette D, Hendrickx M, Willems E, Kemp CR, Leyns L. (2008). An optimized procedure for
whole-mount in situ hybridization on mouse embryos and embryoid bodies. Nat Protoc.
3(7):1194-201.

242
Poueymirou WT, Auerbach W, Frendewey D, Hickey JF, Escaravage JM, Esau L, Doré AT,
Stevens S, Adams NC, Dominguez MG, Gale NW, Yancopoulos GD, DeChiara TM,
Valenzuela DM. (2007). F0 generation mice fully derived from gene-targeted embryonic
stem cells allowing immediate phenotypic analyses. Nat Biotechnol. 25(1):91-9.
Raffii S, Lyden D, Benezra R, Hattori K and Heissig B. (2002). Vascular and haematopoietic
stem cells: novel targets for anti-angiogenesis therapy? Nat Rev Cancer. 2: 826-835.
Raymond C and Soriano P. (2010). ROSA26Flpo delete mice promote efficient inversion of
conditional gene traps in vivo. Genesis. 48: 603-606.
Reynolds, A, Leake, D, Boese Q, Scaringe S, Marshall WS and Khvorova A. (2004) Rational
siRNA design for RNA interference. Nature Biotechnol. 22: 326-330
Risau W and Flamme I. (1995). Vasculogenesis. Annu Rev Cell Dev Biol. 11: 73-91.
Risau, W. (1997) Mechanisms of angiogenesis. Nature. 386: 671-674.
Roman BL and Weinstein BM. (2000). Building the vertebrate vasculature: research is going
swimmingly. Bioassays. 22: 882-893.
Rouslahti E. (2002). Specialization of tumour vasculature. Nat Rev Cancer. 2002. 2: 83-90.
Rudolph C, Lausier J, Naundorf S, Müller RH, Rosenecker J. (2000). In vivo gene delivery to
the lung using polyethylenimine and fractured polyamidoamine dendrimers. J Gene Med.
2(4): 269–78.
Sacewicz I, Wiktorska M, Wysocki T, Niewiarowska J. (2009). Mechanisms of cancer
angiogenesis. Postepy Hig Med Dosw. 63:159-68.

243
Sambrook J and Russel D. (2001). SDS-Polyacrylamide Gel Electrophoresis of Proteins.
Molecular Cloning. J. Sambrook and D. Russel. New York, Cold Spring Harbor
Laboratory Press. 3: A8.40-A8.45.
Schier AF. 2007. The maternal-zygotic transition: death and birth of RNAs. Science.
316(5823):406-7.
Seol HJ, Chang JH, Yamamoto J, Romagnuolo R, Suh Y, Weeks A, Agnihotri S, Smith CA,
Rutka JT. (2012). Overexpression of CD99 Increases the Migration and Invasiveness of
Human Malignant Glioma Cells. Genes Cancer. 3(9-10):535-49.
Shi C, Lu J, Wu W, Ma F, Georges J, Huang H, Balducci J, Chang Y and Huang Y. (2011)
Endothelial Cell- Specific Molecule 2 (ECSM2) localizes to cell-cell junctions and
modulates bFGF-directed cell migration via the ERK-FAK pathway. PloS ONE. 6(6):
e21482
Sledz C, de Veer M, Silverman R and Williams B. (2003) Activation of the interferon system
by short-interferring RNAs. Nat. Cell Biol. 5: 834-839.
Söldera E, Böckle BC, Nguyen VA, Fürhapter C, Obexer P, Erdel M, Stössel H, Romani N,
Sepp NT. (2012). Isolation and characterization of CD133 + CD34 + VEGFR-2 + CD45
− fetal endothelial cells from human term placenta. Microvascular Research. 84(1): 65–
73.
Soriano P. (1999). Generalized lacZ expression with the ROSA26 Cre reporter strain. Nat
Genet. 21:70–71.

244
Sparwasser T, Gong S, Li JY and Eberl G. (2004). General method for the modification of
different BAC types and the rapid generation of BAC transgenic mice. Genesis. 38 (1):
39-50.
Staton CA, Lewis C and Bicknell, R. (Eds.) (2006). Angiogenesis Assays, a critical appraisal
of current techniques. John Wiley and Sons, Ltd. Chippenham, UK. 390pp.
Stossel TP, Condeelis J, Cooley L, Hartwig JH, Noegel A, Schleicher M and Shapiro SS.
(2001). Filamins as integrators of cell mechanics and signalling. Nat. Rev. Mol. Cell Biol.
2: 138-145.
Sumanas S, Lin S. (2006). Ets1-related protein is a key regulator of vasculogenesis in zebrafish.
PLoS Biol. 4(1):e10.
Sumanas S, Gomez G, Zhao Y, Park C, Choi K and Lin S. (2008). Interplay among Etsrp/ER71,
Scl and Alk8 signalling controls endothelial and myeloid cell formation. Blood. 111:
4500-4510.
Swiers G, Patient R and Loose M. (2006). Genetic regulatory networks programming
hematopoietic stem cells and erythroid lineage specification. Developmental Biology.
294: 525-540.
Testa G, Schaft J, van der Hoeven F, Glaser S, Anastassiadis K, Zhang Y, Hermann T,
Stremmel W and Stewart F. (2004). A reliable lacZ expression reporter cassette for
multipurpose, knockout first alleles. Genesis 38: 151-158.
Thisse C and Thisse B (2008). High resolution in situ hybridization to whole-mount zebrafish
embryos. Nature Protocols. 3(1): 59-69.

245
Thomas P and Smart TG. (2005). HEK293 cell line: a vehicle for the expression of recombinant
proteins. J Pharmacol Toxicol Methods. 51(3):187-200.
Thompson MA, Ransom DG, Pratt SJ, MacLennan H, Kieran MW, Detrich III HW, Vail B,
Huber TL, Paw B, Brownlie AJ, Oates AC, Fritz A, Gates MA, Amores A, Bahary N,
Talbot WS, Her H, Beier DR, Postlethwait JH, Zon LI. (1998). The cloche and spadetail
genes differentially affect hematopoiesis and vasculogenesis. Developmental Biology.
197: 248-269.
Tillement V, Lajoie-Mazenc I, Casanova A, Froment C, Penary M, Tovar D, Marquez R,
Monsarrat B, Favre G and Pradines A.(2008). Phosphorylation of RhoB by CK1 impedes
actin stress fiber organization and epidermal growth factor receptor stabilization. Exp
Cell Res. 314 (15): 2811-2821.
Toledo JR, Prieto Y, Oramas N, Sánchez O. (2009). Polyethylenimine-based transfection
method as a simple and effective way to produce recombinant lentiviral vectors. Appl
Biochem Biotechnol. 157(3):538-44.
Tozer GM, Kanthou C and Baguley, BC. (2005) Disrupting tumour blood vessels. Nature Rev
Cancer. 5: 423-435.
Valle-Perez B, Martinez VG, Lacasa-Salavert C, Figueras A, Shapiro SS, Takafuta T,
Casanovas O, Capella G, Ventura F and Vinals F. (2010). Filamin B plays a key role in
VEGF-induced endothelial cell motility through its interaction with Rac-1 and Vav-2.
JBC. 285(14):10748-60.
Verissimo AR, Herbert JMJ, Heath VL, Legg JA, Sheldon H, Andre M, Swain RK and Bicknell
R. (2009). Functionally defining the endothelial transcriptome, from Robo4 to ECSCR.
Biochem Soc Trans. 37: 1214-1217.

246
Verma A, Bhattacharya R, Remadevi I, Li K, Pramanik K, Samant GV, Horswill M, Chun CZ,
Zhao B, Wang E, Miao RQ, Mukhopadhyay D, Ramchandran R and Wilkinson GA.
(2010). Endothelial cell specific chemotaxis receptor (ecscr) promotes angioblast
migration during vasculogenesis and enhances VEGF receptor sensitivity. Blood.
Visvader JE, Fujiwara Y and Orkin SH. (1998). Unsuspected role for the T-cell leukemia
protein SCL/tal-1 in vascular development. Genes and Development. 12: 473–479.
Wang Y, Kreisberg JI, Bedolla RG, Mikhailova M, de Vere White RW and Ghosh PM. (2007).
A 90kDa fragment of filamin A promotes Caosdex-induced growth inhibition in
Casodex-resistant androgen receptor positive C4-2 prostate cancer cells. Oncogene.
26:6061-6070.
Wang Y, Kaiser MS, Larson JD, Nasevicius A, Clark KJ, Wadman SA, Roberg-Perez SE,
Ekker SC, Hackett PB, McGrail M and Essner JJ. (2010). Moesin1 and Ve-cadherin are
required in endothelial cells during in vivo tubulogenesis. Development. 137(18):3119-
28.
Weinstein B. (2000). Plumbing the mysteries of vascular development using the zebrafish.
Semin. Cell Dev Biol. 13: 515-522.
Wienholds E and Plasterk RH. (2004). Target-selected gene inactivation in zebrafish, in
Methods Cell Biol. 77: 69-90.
Wu W, Shi C, Ma F, Balducci J, Huang H, Ji H-L, Chang Y and Huang Y. (2012) Structural
and functional characterisation of two novel mouse endothelial cell-specific molecule 2
(ECSM2) isoforms. Int J Mol Sci. 13(4): 4920–4936.

247
Wu Y, Wang C, Sun H, LeRoith D and Yakar S. (2009). High-efficient FLPo delete mice in
C57BL/6J background. Plos One. 4:11.
Xia H, Mao Q, Paulson HL and Davidson BL. (2002). siRNA-mediated gene silencing in vitro
and in vivo. Nat. Biotehnol. 20: 1006-1010.
Xian J, Clark KJ, Fordham R, Pannell R, Rabbitts TH and Rabbitts PH. (2001). Inadequate
lung development and bronchial hyperplasia in mice with a targeted deletion in the
Dutt1/Robo1 gene. Proc Natl Acad Sci U S A. 98(26):15062-6.
Xu XZ, Choudhury A, Li X and Montell C. (1998) Coordination of an array of signaling
proteins through homo and heteromeric interactions between PDZ domains and target
proteins. J Cell Biol. 142 (2): 545–555.
Yarrow JC, Periman NJ, Westwood NJ and Mitchison TJ. (2004) A high-throughput cell
migration assay using scratch wound healing, a comparison of image based readout
methods. BMC Biotehnol. 4: 21-30.
Zhao, Xiao-Song, Teresa D. Gallardo, Ling Lin, Jeoffrey J. Schageman, and Ralph V. Shohet.
(2002). Transcriptional mapping and genomic analysis of the cardiac atria and ventricles.
Physiol Genomics.12: 53–60.
Zhong TP. (2005). Zebrafish genetics and formation of embryonic vasculature. Curr Top Dev
Biol. 71: 53-81.
Zhuang X, Cross D, Heath VL and Bicknell R. (2012). Shear stress, tip cells and regulators of
endothelial migration. Biochem Soc Trans. 39: 1571-1575.
Zon, L. (1995). Developmental biology of hematopoiesis. Blood. 86: 2876-2891.