Embed Size (px)
Citation preview

Int. Assoc. for Mathematical Geology XIth International Congress Université de Liège - Belgium
Liège – September, 3rd - 8th 2006 S09-15
MODLEN: A semi-automated algorithm for monitoring small-scale thermal activity at Oldoinyo Lengai Volcano, Tanzania
M. Kervyn1*, A.J.L. Harris 2, F. Belton3, E. Mbede4, P. Jacobs1, G.G.J. Ernst1
1 Mercator & Ortelius Research Centre for Eruption Dynamics, Geology Department, Ghent University, Krijgslaan 281/S8, B-9000 Gent, Belgium.
2 HIGP/SOEST, University of Hawai‘i at Mānoa, 1680 East-West Road, Honolulu, Hawai‘i 96822, USA. 3 Developmental Studies Department, Middle Tennessee State University, Murfreesboro, TN 37132, USA.
4 Department of Geology, University of Dar es Salaam, Tanzania. * Corresponding Author: [email protected]
ABSTRACT: Active and potentially hazardous volcanoes in East Africa (Tanzania, Kenya, Ethiopia) are not currently monitored on a regular basis. Among the most active ones, Oldoinyo Lengai has been almost continuously active since 1983. Activity has been confined to small-scale effusive and explosive eruptions of low temperature (~550°C) natrocarbonatite within the summit crater. Historical eruptions’ accounts illustrate that Oldoinyo Lengai also repeatedly displays much more explosive (i.e. violent strombolian or sub-plinian style) eruptions of silicate magma. Daily MODIS images offer a low-cost route to monitor volcanic thermal activity. Existing methods applied on a worldwide scale, such as the MODVOLC algorithm developed by the University of Hawaii, are insufficiently sensitive to monitor small-scale thermal anomalies. MODLEN is an adapted semi-automated algorithm, using MatLab, which allows daily record of the thermal emission at Lengai and the identification of high intensity activity. MODLEN is calibrated and validated using the activity reports from field visits. Despite the small-scale and low temperature of the eruptive activity at Lengai, MODLEN is able to detect all periods of increased activity observed in the field. A 5-year time-series dataset, resulting from analysis of more than 2500 night-time MODIS scenes, has been acquired as a baseline for future near-real time monitoring. It provides insights on the factors controlling the temporal distribution of high intensity activity events. Improvement of the method, to avoid false detection due to partial cloud coverage and detection of the full extent of thermal alerts are also discussed. Although recent activity has been moderate at Lengai, a more intense explosive eruption is overdue. Monitoring is needed to try and anticipate the transition to more hazardous eruption styles and to gain insights into the controls on eruption intensity at Lengai.
KEYWORDS: Oldoinyo Lengai; thermal monitoring; MODIS; MODVOLC; MODLEN; eruption intensity; lava ponds; lava fountaining; lava flows
1. Introduction
Oldoinyo Lengai (OL) is located in the Gregory rift valley, in NW Tanzania (Fig. 1). OL is the only active volcano on Earth emitting natro-carbonatite lava, with the lowest temperature and viscosity ever recorded on Earth, normally ca. 585 +/-10°C and 0.3 to 120 Pa.s respectively (Dawson et al., 1990). Since 1983, the volcano has emitted regularly carbonatite flows. During the 20th century, OL also underwent several explosive eruptions: in 1917, 1940-41 and 1966-67 that generated 3 to 10 km high sub-plinian-style eruption columns. As many African volcanoes, Oldoinyo Lengai is not monitored at all. Reports are provided by some visitors who climb OL (e.g. GVN, 2005) giving some constraints on eruptive activity
Int. Assoc. for Mathematical Geology XIth International Congress Université de Liège - Belgium
Liège – September, 3rd - 8th 2006 S09-15
0
2
4
6
8
0 2 4 6 8 10 12
Wavelength (µm)
Spec
tral R
adia
nce
(W.m
-².sr
-1.µ
m-1
)
T = 12°C
T1 = 12°C (f1=0.998) T2= 550°C (f2=0.002)
T1 = 12°C (f1=0.9995) T2 = 550°C (f2=0.0005)
T1 = 12°C (f1=0.9995) T2= 1000°C (f2=0.0005)
Carbonatitelava flows
Silicate lava flow Night-time ground
surface IR emission atOldoinyo Lengai summit
Carbonatitelava flows
Silicate lava flow Night-time ground
surface IR emission atOldoinyo Lengai summit
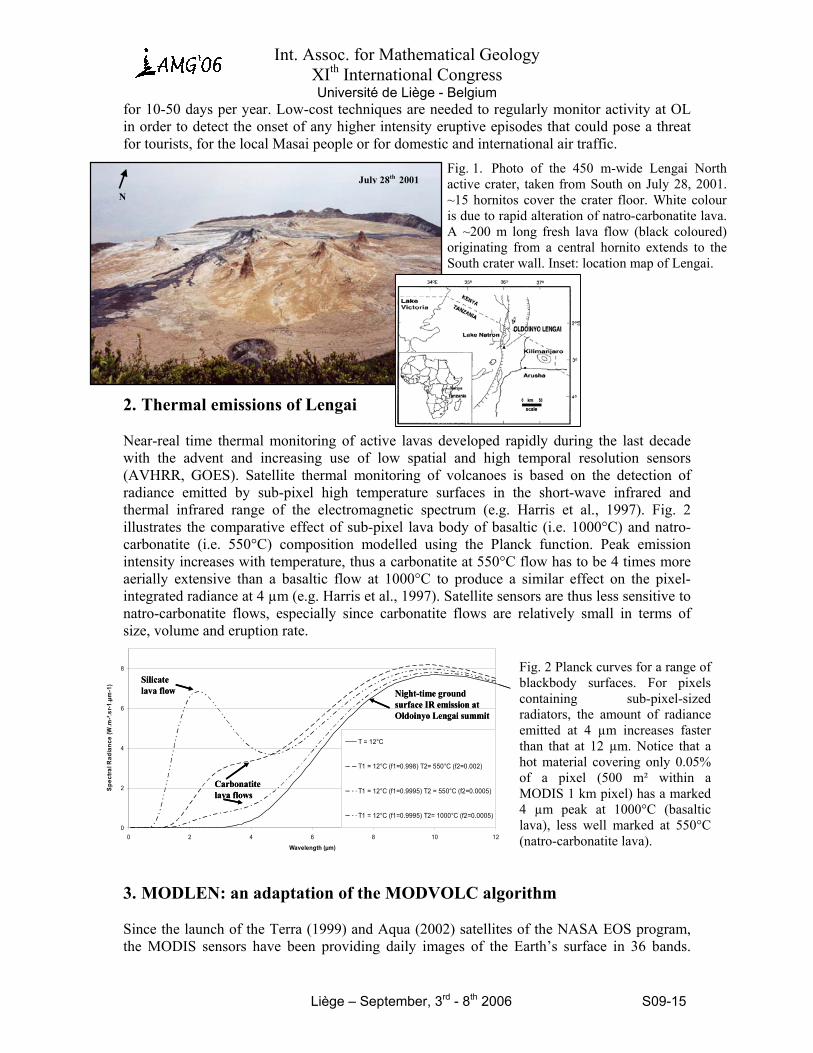
Fig. 2 Planck curves for a range of blackbody surfaces. For pixels containing sub-pixel-sized radiators, the amount of radiance emitted at 4 µm increases faster than that at 12 µm. Notice that a hot material covering only 0.05% of a pixel (500 m² within a MODIS 1 km pixel) has a marked 4 µm peak at 1000°C (basaltic lava), less well marked at 550°C (natro-carbonatite lava).
Fig. 1. Photo of the 450 m-wide Lengai North active crater, taken from South on July 28, 2001. ~15 hornitos cover the crater floor. White colour is due to rapid alteration of natro-carbonatite lava. A ~200 m long fresh lava flow (black coloured) originating from a central hornito extends to the South crater wall. Inset: location map of Lengai.
July 28th 2001
N
for 10-50 days per year. Low-cost techniques are needed to regularly monitor activity at OL in order to detect the onset of any higher intensity eruptive episodes that could pose a threat for tourists, for the local Masai people or for domestic and international air traffic.
2. Thermal emissions of Lengai
Near-real time thermal monitoring of active lavas developed rapidly during the last decade with the advent and increasing use of low spatial and high temporal resolution sensors (AVHRR, GOES). Satellite thermal monitoring of volcanoes is based on the detection of radiance emitted by sub-pixel high temperature surfaces in the short-wave infrared and thermal infrared range of the electromagnetic spectrum (e.g. Harris et al., 1997). Fig. 2 illustrates the comparative effect of sub-pixel lava body of basaltic (i.e. 1000°C) and natro-carbonatite (i.e. 550°C) composition modelled using the Planck function. Peak emission intensity increases with temperature, thus a carbonatite at 550°C flow has to be 4 times more aerially extensive than a basaltic flow at 1000°C to produce a similar effect on the pixel-integrated radiance at 4 µm (e.g. Harris et al., 1997). Satellite sensors are thus less sensitive to natro-carbonatite flows, especially since carbonatite flows are relatively small in terms of size, volume and eruption rate.
3. MODLEN: an adaptation of the MODVOLC algorithm
Since the launch of the Terra (1999) and Aqua (2002) satellites of the NASA EOS program, the MODIS sensors have been providing daily images of the Earth’s surface in 36 bands.

Int. Assoc. for Mathematical Geology XIth International Congress Université de Liège - Belgium
Liège – September, 3rd - 8th 2006 S09-15
32band22band32band22bandNTI
+−
=
Automated hotspot detection has since been implemented by the so-called MODVOLC algorithm (Flynn et al., 2002; Wright et al., 2002, 2004). It is a short algorithm applied to all MODIS scenes to detect global hotspot activity and to record and display the pertinent data on a web interface on a near-real time basis (http://modis.higp.hawaii.edu/). For each pixel of any night-time MODIS scene, the algorithm derives the Normalized Thermal Index (NTI) from radiance values in bands 22 (3.95 µm; band 21 is used if band 22 is saturated) and 32 (12 µm) as follows: A threshold NTI value of (-0.80) is used to discriminate abnormally hot pixels, i.e. NTI greater than the threshold are identified as hotspot. The value of the threshold was set sufficiently high so as to be valid worldwide and to avoid false alerts, which cause true thermal anomaly of relative small intensity might not be recorded.
Analysis of the MODVOLC results over OL since December 1999 returned only 9 hotspot pixels on 6 different days. Hotspots on at least four of these days can be correlated with exceptionally intense levels of activity (Kervyn et al., 2006). The automated MODVOLC method proves useful to monitor most volcanic events but it is not sufficiently sensitive to detect, and thus to routinely monitor, usual thermal activity at Oldoinyo Lengai, as a result of the small size and low temperature of lava flows. Empirical analysis of many MODIS scenes allowed calibration and validation of an adapted MODIS hotspot detection algorithm, called MODLEN, which can be applied locally to MODIS scenes to detect and process low intensity hotspots (Fig. 3). The MODLEN algorithm presents 4 main differences to the original MODVOLC algorithm: 1. Subscene selection and extraction: the MODLEN
algorithm extract from the MODIS scene a subset of the data of ~12x12 km² centred on OL summit for bands 21, 22 and 32. This reduces the amount of data handled by the algorithm in order to minimize processing time and reduce risks of detecting non-volcanic thermal anomalies.
2. The NTI threshold is set at -0.83. Any pixel with a NTI value above this value is regarded as a hotspot. This regionally-valid threshold allows detection of intense thermal anomaly, irrespective of the values of the neighbouring pixels.
3. Spatial derivative: Lower level thermal anomalies do not produce NTI values higher than the NTI threshold, though they can be visually identified because they display values higher that their immediate surrounding pixels. The algorithm estimates a high pass filter spatial derivative between adjacent NTI values, the value of each pixel being compared with the average value of the
Region of interest ? STOPNo
Night time Modis Level 1B Scene
Band 22 saturated?
B32B22B32- B22NTI
+=
B32B21B32B21NTI
+−
=
Bad Data ?
Yes
No
STOPYes
NTI > -0.83 ?
No
neighNTINTINTI
∆x∆y∆NTI neigh−
=
Yes
Hot-spot details written to MODLEN file
STOPNo
?02.0∆x∆y∆NTI&
0.88NTI
−≤
−>
Yes
Region of interest ? STOPNo
Night time Modis Level 1B Scene
Band 22 saturated?
B32B22B32- B22NTI
+=
B32B21B32B21NTI
+−
=
Bad Data ?
Yes
No
STOPYes
NTI > -0.83 ?
No
neighNTINTINTI
∆x∆y∆NTI neigh−
=
Yes
Hot-spot details written to MODLEN file
STOPNo
?02.0∆x∆y∆NTI&
0.88NTI
−≤
−>
Yes
Region of interest ? STOPNo
Night time Modis Level 1B Scene
Region of interest ?Region of interest ? STOPNo
STOPSTOPSTOPNo
Night time Modis Level 1B SceneNight time Modis Level 1B Scene
Band 22 saturated?
B32B22B32- B22NTI
+=
B32B21B32B21NTI
+−
=
Band 22 saturated?Band 22 saturated?
B32B22B32- B22NTI
+=
B32B22B32- B22NTI
+=
B32B21B32B21NTI
+−
=B32B21B32B21NTI
+−
=
Bad Data ?
Yes
No
STOPYes
Bad Data ?
Yes
No
STOPYes
Bad Data ?Bad Data ?
Yes
No
STOPYes
STOPSTOPSTOPYes
NTI > -0.83 ?
No
neighNTINTINTI
∆x∆y∆NTI neigh−
=
Yes
Hot-spot details written to MODLEN file
STOPNo
?02.0∆x∆y∆NTI&
0.88NTI
−≤
−>
YesNTI > -0.83 ?
No
neighNTINTINTI
∆x∆y∆NTI neigh−
=
NTI > -0.83 ?NTI > -0.83 ?
No
neighNTINTINTI
∆x∆y∆NTI neigh−
=neighNTI
NTINTI∆x∆y∆NTI neigh−
=
Yes
Hot-spot details written to MODLEN file
STOPNo
?02.0∆x∆y∆NTI&
0.88NTI
−≤
−>
YesYes
Hot-spot details written to MODLEN fileHot-spot details written to MODLEN file
STOPNo
?02.0∆x∆y∆NTI&
0.88NTI
−≤
−>
STOPNo
STOPSTOPSTOPNo
?02.0∆x∆y∆NTI&
0.88NTI
−≤
−>
?02.0∆x∆y∆NTI&
0.88NTI
−≤
−>
YesYes
Yes- Use B21 data
No - Use B22 data
Region of interest ? STOPNo
Night time Modis Level 1B Scene
Band 22 saturated?
B32B22B32- B22NTI
+=
B32B21B32B21NTI
+−
=
Bad Data ?
Yes
No
STOPYes
NTI > -0.83 ?
No
neighNTINTINTI
∆x∆y∆NTI neigh−
=
Yes
Hot-spot details written to MODLEN file
STOPNo
?02.0∆x∆y∆NTI&
0.88NTI
−≤
−>
Yes
Region of interest ? STOPNo
Night time Modis Level 1B Scene
Band 22 saturated?
B32B22B32- B22NTI
+=
B32B21B32B21NTI
+−
=
Bad Data ?
Yes
No
STOPYes
NTI > -0.83 ?
No
neighNTINTINTI
∆x∆y∆NTI neigh−
=
Yes
Hot-spot details written to MODLEN file
STOPNo
?02.0∆x∆y∆NTI&
0.88NTI
−≤
−>
Yes
Region of interest ? STOPNo
Night time Modis Level 1B Scene
Region of interest ?Region of interest ? STOPNo
STOPSTOPSTOPNo
Night time Modis Level 1B SceneNight time Modis Level 1B Scene
Band 22 saturated?
B32B22B32- B22NTI
+=
B32B21B32B21NTI
+−
=
Band 22 saturated?Band 22 saturated?
B32B22B32- B22NTI
+=
B32B22B32- B22NTI
+=
B32B21B32B21NTI
+−
=B32B21B32B21NTI
+−
=
Bad Data ?
Yes
No
STOPYes
Bad Data ?
Yes
No
STOPYes
Bad Data ?Bad Data ?
Yes
No
STOPYes
STOPSTOPSTOPYes
NTI > -0.83 ?
No
neighNTINTINTI
∆x∆y∆NTI neigh−
=
Yes
Hot-spot details written to MODLEN file
STOPNo
?02.0∆x∆y∆NTI&
0.88NTI
−≤
−>
YesNTI > -0.83 ?
No
neighNTINTINTI
∆x∆y∆NTI neigh−
=
NTI > -0.83 ?NTI > -0.83 ?
No
neighNTINTINTI
∆x∆y∆NTI neigh−
=neighNTI
NTINTI∆x∆y∆NTI neigh−
=
Yes
Hot-spot details written to MODLEN file
STOPNo
?02.0∆x∆y∆NTI&
0.88NTI
−≤
−>
YesYes
Hot-spot details written to MODLEN fileHot-spot details written to MODLEN file
STOPNo
?02.0∆x∆y∆NTI&
0.88NTI
−≤
−>
STOPNo
STOPSTOPSTOPNo
?02.0∆x∆y∆NTI&
0.88NTI
−≤
−>
?02.0∆x∆y∆NTI&
0.88NTI
−≤
−>
YesYes
Yes- Use B21 data
No - Use B22 data
Fig. 3 Flow diagram illustrating the operations of the MODLEN algorithm (adapted from Wright et al. 2004).
∆x∆y∆NTI , NTI , neighNTI stand for the value of the spatial derivative of the NTI values for a given pixel, the NTI value for that pixel and the average of NTI values for the 8 neighbouring pixels, respectively.

Int. Assoc. for Mathematical Geology XIth International Congress Université de Liège - Belgium
Liège – September, 3rd - 8th 2006 S09-15
8 neighbouring pixels. Hotspot pixels are flagged if the spatial derivative is smaller than -0.02 and the NTI value for the hotspot pixel exceeds -0.88, the upper limit for non-anomalous values at OL’s summit.
4. Baseline data record: The details of each identified hotspot are written to a text file including the radiance values in bands 21, 22, 23, 31 and 32 and other data on pixel location and sensor, scene and sun geometry are recorded. The relative distance of the pixel to OL’s summit is also estimated using the latitude and longitude of the pixel to help discrimination of volcanogenic alerts from fire-related hotspots. The algorithm also automatically records data on every scene for OL summit from every image as baseline information order to detect long-term or subtle temperature variations at OL’s summit that would not be identified by alerts,
4. MODLEN Validation
MODLEN algorithm is validated here using two periods for which field data are available.
July 2004: The MODLEN-derived time series show marked peaks on thermal activity on July 4-5th and July 14-15th, 2004. In contrast, MODIS images show no evidence of thermal anomalies in late June, consistent with the low level and intermittent activity (degassing, spattering, average size flows) observed in the field at that time. In agreement with field reports, MODLEN confirms that on July 4th a significantly large eruption (Fig. 4.a), including spattering from several vents and two voluminous lava flows, was occurring that lasted until July 6th. The satellite data confirms that activity level was low from July 7th to 13th. The first anomaly for the July 14-15th events was detected at 2.30 a.m. on July 14th by the AQUA satellite, closely constraining the eruption onset time. This first alert coincides with the greatest lava effusion between 1.00 and 4.00 a.m. on that day. Anomalies on July 15th were very intense on the TERRA scenes, corresponding to lava flood and intense lava fountains seen in the field causing a bush fire on the volcano West flank. The last anomalous NTI value occurred on the AQUA image early on July 16th and marked the end of the intense activity phase. Minor spattering phases and small lava flows observed in the following days are not detected by MODLEN. A new period of higher activity was recorded by MODLEN during the first week of August, with increasing NTI values recorded at summit after July 30th. This is consistent with observations from the volcano base of lava flows extending onto the NW flanks on July 30th, and at least one lava flow in the crater on August 4th.
c. CrH
LN
G
K
OL
Kr
a. 07-04-2004 b. 07-04-2005
Fig. 4 Stretched grey-scaled night-time MODIS band 22 (3.95 µm) over Lengai (identified by the white arrow) for (a) July 4, 2004 (TERRA) and (b) July 4, 2005 (TERRA) North is up in each image; scenes were not geocorrected. (c) Generalized sketch of topographic features visible on the MODIS scenes: the Crater Highlands to the SW (CrH); Lake Natron (LN); Gelai (G) and Ketumbeine (K) shield volcanoes; Oldoinyo Lengai (OL) and Kerimasi strato-volcanoes (Kr); stippled line: rift valley wall.

Int. Assoc. for Mathematical Geology XIth International Congress Université de Liège - Belgium
Liège – September, 3rd - 8th 2006 S09-15
July 2005: Local guides incorrectly reported a large lava flow erupted on July 9th, covering the East part of the crater. Such a large eruption should be detected by MODLEN. However, no such anomaly is detected on this date. Hotspots are detected 5 days earlier (on July 2-5th
, Fig. 3b). A report from a scientific team confirmed that the local guides did in fact lead a visit to Lengai’s summit from July 3rd to 5th. The report describes repetitive lava overflows from a lava pool which ignited a bush fire during the afternoon of July 4th. This example illustrates that the MODLEN alert system can be used as a reliable data source any time during the year to identify or verify the timing of high intensity activity at OL and track its evolution. Three other large eruptions occurred at a single vent on 20th and 21st July. The first eruption occurred around midnight on 20th July and had ended by 1.30 a.m. on the same night, producing a high Hawaiian-type fountain and several lava flows that reached the East flank. This first event coincided with AQUA data acquisition at about 1.25 a.m. on July 21st, on which two pixels are identified as anomalous by MODLEN. After a less intense eruption in the afternoon of July 21st, a third eruption at 9.00 p.m. fed voluminous lava flow surges during the night. Although affected by cloud cover, this third eruption was clearly visible on the MODIS images acquired during the night of July 21st-22nd.
-0.98
-0.94
-0.9
-0.86
-0.82
-0.78
-0.74
06/27/2005
07/02/2005
07/07/2005
07/12/2005
07/17/2005
07/22/2005
07/27/2005
08/01/2005
08/06/2005
08/11/2005
NTI
val
ue
TerraAqua
b.
July-August 2005
-0.96
-0.92
-0.88
-0.84
-0.8
-0.76
-0.72
-0.68
-0.64
06/20/2004
06/30/2004
07/10/2004
07/20/2004
07/30/2004
08/09/2004
NTI
val
ue
TerraAqua
a.
June-August 2004
Fig. 4. Time series of NTI values for Lengai crater, collected using MODLEN, including all MODLEN alerts within 2 km of Lengai summit for (a) June 20 to August 16, 2004 and (b) July 1st to August 10th, 2005. Horizontal black bars denote periods of available field reports. Vertical grey bars mark data acquisition gaps.

Int. Assoc. for Mathematical Geology XIth International Congress Université de Liège - Belgium
Liège – September, 3rd - 8th 2006 S09-15
5. MODLEN Results
All MODIS scenes for a 15-month long period between April 2002 and June 2003 were systematically analysed using MODLEN, as part of an ongoing effort to document activity at Lengai since 2000. All the MODIS scenes (615 scenes) acquired by both AQUA and TERRA platforms were downloaded. The thermal time series (Fig. 6) shows a baseline level with a low amplitude seasonal effect. A total of 27 MODLEN alerts were detected over this period, with an additional 10 pixels being visually identified above the baseline. This time series allowed identification of at least 6 periods of higher activity with duration of one day to several weeks. Despite the fact that the time series is affected by frequent cloud coverage in April-May and October-December 2002, 5 periods of higher eruptive activity that were not or barely witnessed in the field were identified thanks to MODLEN. In absence of field reports, the interpretation of these data in term of type of eruptive activity is limited, and only based on morphological changes observed in the crater after the event (Fig. 6)
6. Discussion and Conclusions
Examples of previous sections showed the ability of MODLEN to identify some periods of moderate-level activity and all periods of high-intensity activity at OL summit crater. It thus has the potential to provide useful time series data for the documentation and analysis of the temporal distribution of higher-intensity eruptions at Lengai. Such analysis would help constrain processes at work in the magmatic system at OL. As part of an ongoing effort to
Fig. 6.Time series data for April 2002 to June 2003 of the Normalised Thermal Index (NTI). Plotted are cloud-free MODIS night-time scenes for pixels covering Lengai, and hotspot pixels detected by MODLEN within 2km of Lengai summit. Cloud coverage is substantially reducing the amount of data available for the periodsApril-May 2002 and the rainy-season of October 2002 to January 2003. Periods for which data are lacking (i.e. either due to cloud coverage or satellite data acquisition gaps) for more than five consecutive days, are markedby the grey vertical bars. The periods of higher activity in August 2002 is confirmed by field reports. A lava flow was observed on the upper flank of Lengai at the start of the period activity in September 2002. Althoughnobody witnessed the eruptions in February-March 2003, guides reported that 2 new hornitos have formed during that period.

Int. Assoc. for Mathematical Geology XIth International Congress Université de Liège - Belgium
Liège – September, 3rd - 8th 2006 S09-15
document activity at Lengai since 2000, more than 2500 night-time MODIS scenes were analysed using the MODLEN algorithm, covering 48 months of data. Over this period MODLEN enabled to detect 63 volcanogenic alerts on 52 different satellite scenes covering 48 different days (Table 2). An additional 41 other scenes were visually identified as anomalies because of their above-baseline NTI values. MODLEN thus detected at least one alert on ~5% of the days for which at least one scene was analysed. This is consistent with the proportion of days with high intensity eruptive activity observed in the field: high volume sustained flows, high lava fountains, and ash explosions, are indeed reported for only 6% of the observation days. This suggests that MODLEN is sensitive to high or very high intensity eruption events at OL. MODLEN application is limited by cloud coverage although most data affected by cloud can be identified and taken out of the analysis (Kervyn et al., 2006). MODLEN is also constrained by the discontinuous data acquisition, disabling detection of short duration or intermittent volcanic activity (e.g. Strombolian explosive phases) that do not produce long lasting thermal anomaly. Interpretation of the source of the thermal alert is helped by the estimation of the distance between the pixel and the volcano summit. Most alerts on the lower volcano flanks can confidently be attributed to bush fires rather than volcanogenic processes. False alert caused by partial cloud coverage of the scene or bad quality data affect 2% of the scenes. Upcoming improvements of the algorithm will allow automatic identification of pixel affected by cloud coverage, facilitating data interpretation and reducing false alerts occurrence. As any significant hazards from OL would be associated with very intense eruptive events, it does appear that the MODLEN system can contribute helpfully to a routine monitoring effort at OL. With the ongoing development of a complete data series since early 2000, MODLEN will provide baseline knowledge of OL’s eruption intensity variation and most intense activity since December 1999, using archive MODIS data. It will permit analysis of the temporal distribution of eruptive events and study of potential environmental controls on eruptive intensity on both long and short timescales (Gordon et al., 2005). MODLEN was developed with the perspective of implementing it for near-real time monitoring of OL’s activity. Our current processing of MODIS raw data relies on level 1B data being available, free of charge for download on the internet, 2 or 3 days after acquisition. While this does not yet permit real-time monitoring of the volcano, it does provide the most continuous and the most rapid way of retrieving information on OL’s activity, in the current absence of ground-based monitoring at the volcano. Although recent activity (e.g. since 1983) has been moderate at Lengai, a more intense explosive eruption is overdue and there is need for routine monitoring in the future. Low-cost thermal monitoring is an essential component of the much-needed monitoring program at several Tanzanian, Kenyan and Ethiopian volcanoes, and especially at OL. The MODLEN algorithm is capable of monitoring the relative thermal activity at OL. Systematic use by local volcanologists will allow identification of high activity periods. Continuous thermal RS monitoring can also provide a baseline from which the onset of abnormal eruptive activity or the beginning of more explosive and hazardous silicate magma eruptions, as occurred in 1917, 1940-41 and 1966-67, can be detected, as it is already the case, e.g. for volcanoes in North Pacific (Dehn et al., 2000). MODLEN was adapted, building upon previous efforts to develop MODVOLC, to be as sensitive as possible to thermal activity at OL and has the advantage of being based on a spatial threshold that is adaptable from image-to-image and case-to-case, thus allowing detection of more subtle anomalies than globally trained thresholds. Such an approach can be useful at other active volcanoes around the world displaying small-scale or low integrated-temperature thermal anomalies.

Int. Assoc. for Mathematical Geology XIth International Congress Université de Liège - Belgium
Liège – September, 3rd - 8th 2006 S09-15
Acknowledgments. M.K. and G.G.J.E. are funded by the Belgian NSF (FWO-Vlaanderen). The MODIS Thermal alert website (http://hotspot.higp.hawaii.edu/) and A.J.L. Harris are currently supported by NASA Grant NNG04G064G. The MODIS data were provided by the Goddard Data Archive Centre. This research was supported by the “Fondation Belge de la Vocation”.
REFERENCES Dawson, J.B., Pinkerton, H., Norton, G.E. & Pyle, D.M. 1990. Physicochemical properties of
alkali carbonatite lavas: Data from the 1988 eruption of Oldoinyo Lengai, Tanzania. Geology, 18, 260-263.
Dehn, J., Dean, K. & Engle, K. 2000. Thermal monitoring of North Pacific volcanoes from space. Geology, 28, 755-758.
Flynn, L.P., Wright, R., Garbeil, H., Harris, A.J.L. & Pilger, E. 2002. A global thermal alert system using MODIS: Initial results from 2000-2001. Advances in Environmental Monitoring and Modelling, 1, 37-69.
Gordon, J., Belton, F., Cribb, W. & Henry, J. 2005. Influences of changing lunar cycle and barometric pressure on the eruption of natrocarbonatite lava, Ol Doinyo Lengai volcano, Tanzania. Geological Society of America Abstracts with Programs, 37, 7.
GVN 2005. Tall hornito almost reaches summit elevations; more lava spills over rim. Bulletin of the Global Volcanism Network, 30
Harris, A.J.L., Butterworth, A.L., Carlton, R.W., Downey, I., Miller, P., Navarro, P. & Rothery, D.A. 1997. Low-cost volcano surveillance from space: case studies from Etna, Krafla, Cerro Negro, Fogo, Lascar and Erebus. Bulletin of Volcanology, 59, 49-64.
Kervyn, M., Harris, A.J.L., Belton, F., Mbede, E., Jacobs, P. & Ernst, G.G.J. 2006. Thermal remote sensing of the low-intensity thermal anomalies of Oldoinyo Lengai, Tanzania. International Journal of Remote Sensing, xxx (submitted).
Wright, R., Flynn, L.P., Garbeil, H., Harris, A.J.L. & Pilger, E. 2002. Automated volcanic eruption detection using MODIS. Remote Sensing of Environment, 82, 135-155.
Wright, R., Flynn, L.P., Garbeil, H., Harris, A.J.L. & Pilger, E. 2004. MODVOLC: Near-real time thermal monitoring of global volcanism. Journal of Volcanology and Geothermal Research, 135, 29-49.
07-21-2005