Embed Size (px)
Citation preview

Models and Metrics forEnergy-Efficient Computer Systems
Suzanne Rivoire
May 22, 2007
Ph.D. Defense
EE Department, Stanford University
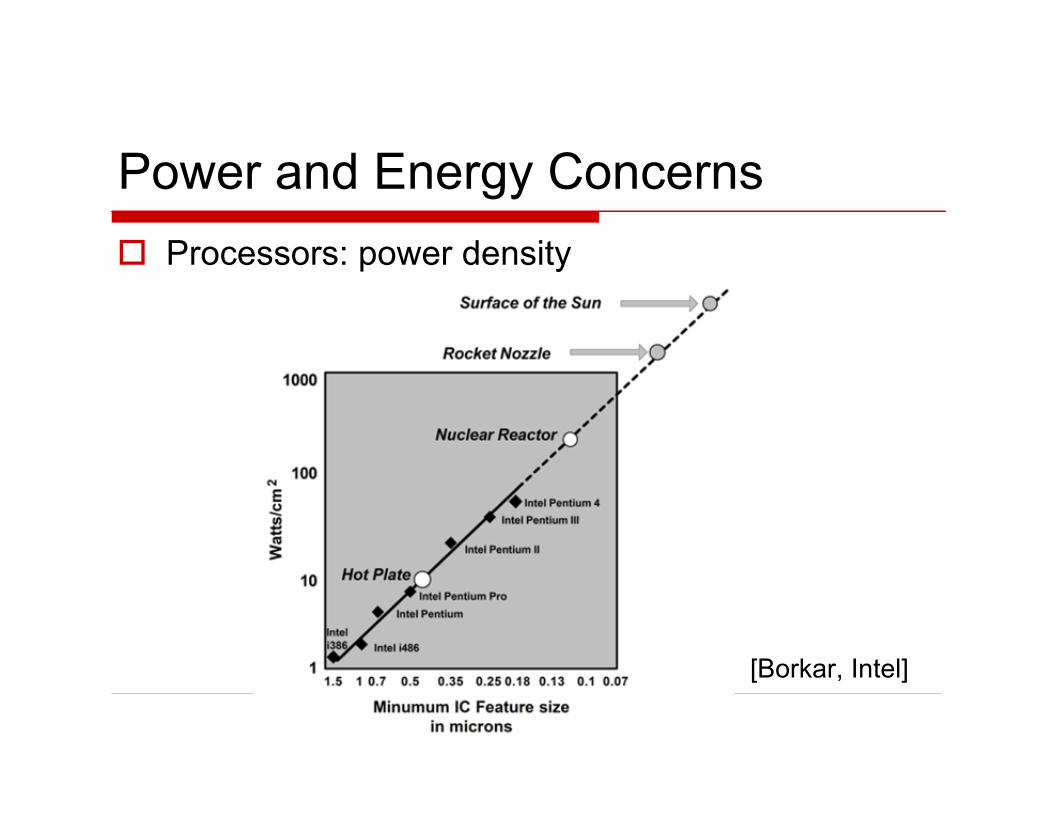
Power and Energy Concerns
! Processors: power density
[Borkar, Intel]

Power and Energy Concerns (2)
! Personal computers
" Mobile devices: battery life/usability
" Desktops: electricity costs, noise
! Servers and data centers
" Power and cooling costs
" Reliability
" Density/scalability
" Pollution
" Load on utilities

Underlying Questions
! Metrics: What are we aiming for?" Compare energy efficiency
" Identify / motivate new designs
! Models: How do we get there?" Understand how high-level properties affect
power
" Improve power-aware scheduling policies /usage

Talk Overview
! Metrics: JouleSort benchmark
" First complete, full-system energy-efficiencybenchmark
" Design of winning system
! Models: Mantis approach
" Generates family of high-level full-systemmodels
" Generic, accurate, portable

JouleSort energy-efficiency benchmark
! JouleSort benchmark specification
" Workload, metric, guidelines
" Rationale and pitfalls
! Energy-efficient system design:2007 “winner”
" 3.5! better than previous best
" Insights for future designs
[S. Rivoire, M. A. Shah, P. Ranganathan, C. Kozyrakis, “JouleSort:A Balanced Energy-Efficiency Benchmark,” SIGMOD 2007.]

Why a benchmark?
! Track progress, compare systems, spurinnovation
! Current benchmarks/metrics
! Limitations of current metrics:
" Under-specified or “under construction”
" Limited to a particular component or domain

Benchmark design goals
! Holistic and balanced: exercises all corecomponents
! Inclusive and representative: meaningfuland implementable on many differentmachines
! History-proof: meaningful comparisonsbetween scores from different years

Benchmark specification overview
! Workload
! Metric
! Rules

Workload: External sort
! Sort randomly permuted 100-byte recordswith 10-byte keys
! From file on non-volatile store to file onnon-volatile store (“external” storage)

External sort workload
! Simple and balanced" Exercises all core components" CPU, memory, disk, I/O, OS, filesystem" End-to-end measure of improvement
! Inclusive of variety of systems" PDAs, laptops, desktops, supercomputers
! Representative of sequential I/O tasks! Technology trend bellwether" Supercomputers to clusters, GPU?

Existing sort benchmarks
! Sort benchmarks used since 1985
! Pure performance" MinuteSort: How many records sorted in 1 min?
" Terabyte: How much time to sort 1 TB?
! Price-performance" PennySort: How many records sorted for $0.01?
" Performance-Price: MinuteSort/$$
More info at http://research.microsoft.com/barc/SortBenchmark/

JouleSort metric choices
! How to weigh power and performance?" Equally (energy)?
! Energy (Joules) = Power (Watts) ! Time (sec.)
" Privilege performance (energy-delay product)?
! What to fix and what to compare?" Fix energy budget and compare records sorted?
" Fix num. records and compare energy?
" Fix time budget and compare records/Joule?

0
2000
4000
6000
8000
10000
12000
14000
16000
18000
1.0E+05 1.0E+06 1.0E+07 1.0E+08 1.0E+09 1.0E+10
Records Sorted
SR
ecs/J
.
Records Sorted
Problem with Fixed Time Budget1-pass sort
< 10 sec(N lg N)
complexity
Sort
edR
ecs/J
oule

Final metric: Fixed input size
! 3 classes: 10GB, 100GB, 1TB
! Winner: minimum energy
! Report (records sorted / Joule)
! Inter-class comparisons imperfect
! Adjust classes as technology improves
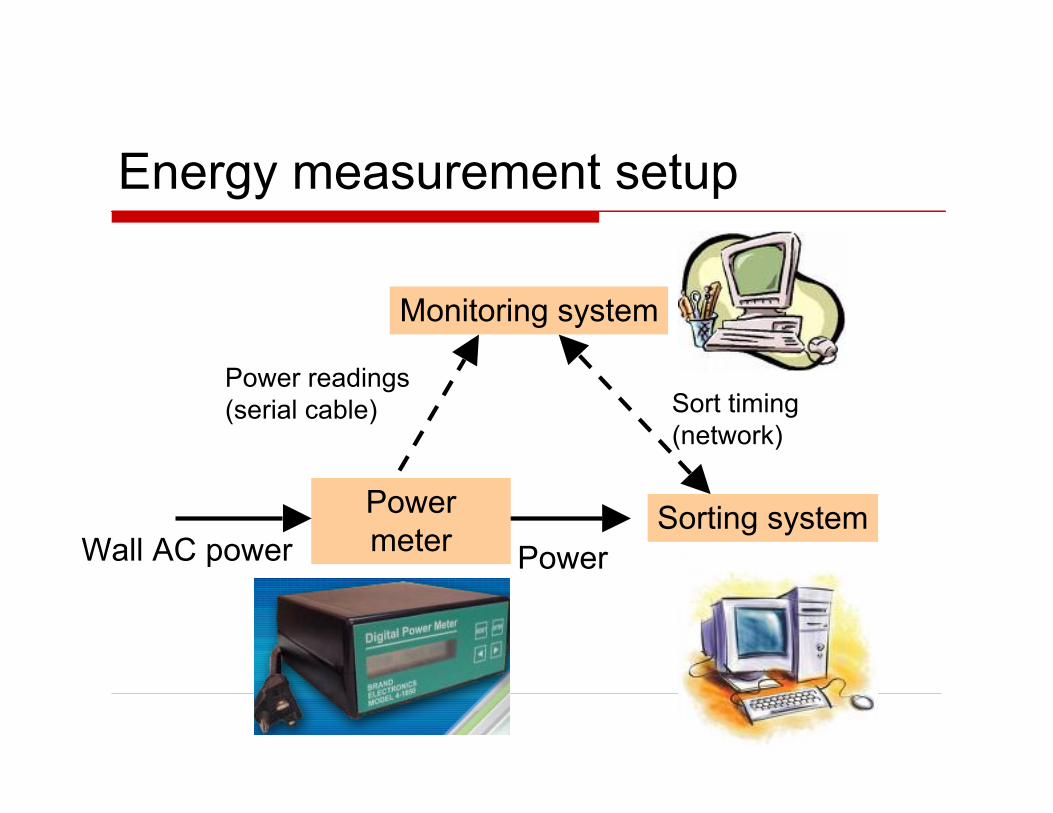
Energy measurement setup
Power
Powermeter
Sorting system
Monitoring system
Wall AC power
Power readings(serial cable) Sort timing
(network)

Talk Overview
! Metrics: JouleSort benchmark
" First complete, full-system energy-efficiencybenchmark
" Design of winning system
! Models: Mantis approach
" Generates family of high-level full-systemmodels
" Generic, accurate, portable

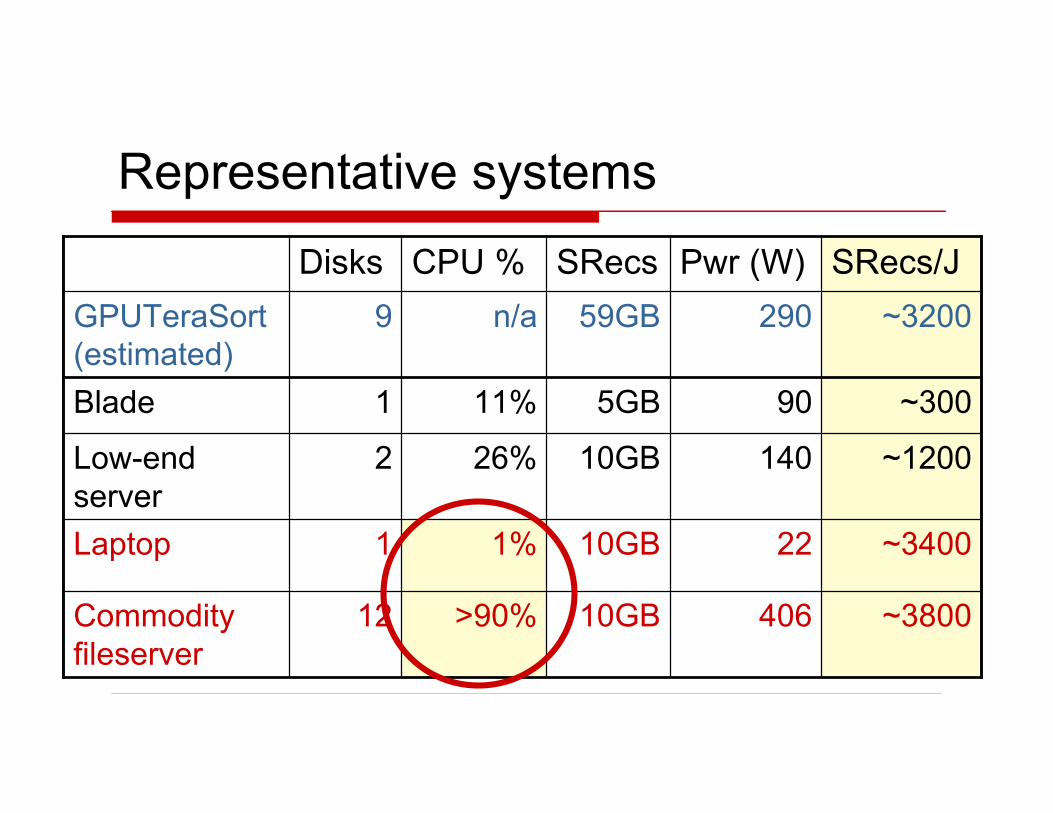
Representative systems
406
22
140
90
290
Pwr (W)
~320059GBn/a9GPUTeraSort(estimated)
~340010GB1%1Laptop
~380010GB>90%12Commodityfileserver
~120010GB26%2Low-endserver
11%
CPU %
~3005GB1Blade
SRecs/JSRecsDisks

Representative systems
406
22
140
90
290
Pwr (W)
~320059GBn/a9GPUTeraSort(estimated)
~340010GB1%1Laptop
~380010GB>90%12Commodity
fileserver
~120010GB26%2Low-endserver
11%
CPU %
~3005GB1Blade
SRecs/JSRecsDisks
Representative systems
406
22
140
90
290
Pwr (W)
~320059GBn/a9GPUTeraSort(estimated)
~340010GB1%1Laptop
~380010GB>90%12Commodityfileserver
~120010GB26%2Low-endserver
11%
CPU %
~3005GB1Blade
SRecs/JSRecsDisks

Energy-Efficient Components:Processor
52% power
75% perf
Fileserver CoolSort
Sort BW: 313 MB/s
65W (peak)
Sort BW: 236 MB/s
34W (peak)

Energy-Efficient Components: Disks
15% power
50% perf
Fileserver Our winner
Seagate Barracuda
Seq. BW: 80MB/s
13W
Hitachi Travelstar
Seq. BW: 40MB/s
2W

CoolSort Design
Asus motherboard:
Mobile CPU + 2 PCI-e slots
RocketRAID Disk Controllers
13 Hitachi TravelStar 160GB

0
2000
4000
6000
8000
10000
12000
2 3 4 5 6 7 8 9 10 11 12 13
Disks Used
So
rte
dR
ec
s/J
ou
le
0
20
40
60
80
100
120
140
So
rte
dR
ec
s/s
ec
(x 1
0E
4)
SRecs/J Perf
Maximizing performance
" Balanced sort: enough disks to fully utilize CPU
" Disks running near peak BW
GPUTeraSort

CoolSort: The 100 GB winner
! 11,300 records sorted per Joule
! 3.5! more efficient than GPUTeraSort
! Average sorting power: 100 W

Insights for future designs
! Low-hanging fruit: use low-power HW" Best power-performance trade-off" Still need to fully utilize resources" Challenge: adequate interfaces and “glue” to bring laptop
components into servers
! Scaledown efficiency" Limited dynamic range" For fixed HW: peak efficiency = peak performance" How can we design machines that perform equally well in
different benchmark classes?

Benchmark limitations
! Tests energy efficiency at high utilization --but most servers are under-utilized
" How efficient is system at 50% utilization?20%?
! Doesn’t measure building power/cooling
! Real goal: TCOSort
" JouleSort and PennySort give pieces of theanswer

JouleSort Conclusions
! Need energy-efficiency benchmark
! JouleSort specification" Simple, representative, full-system benchmark
" Workload, metric, measurement rules
! CoolSort system" 3.5! better than 2006 estimated winner
" Mobile components, server-class interfaces
! Part of the sort benchmark suite" joulesort.stanford.edu
Talk Overview
! Metrics: JouleSort benchmark
" First complete, full-system energy-efficiencybenchmark
" Design of winning system
! Models: Mantis approach
" Generates family of high-level full-systemmodels
" Generic, accurate, portable
Who needs power models?
! Component and system designers
" How do design decisions affect power?
! Users
" How do my usage patterns affect power?
! Data center schedulers
" How will workload distribution decisions affectpower?
Power modeling goals
! Goal: Online, full-system power models
! Model requirements
" Non-intrusive and low-overhead
" Easy to develop and use
" Fast enough for online use
" Reasonably accurate (within 10%)
" Inexpensive
" Generic and portable

Power modeling approaches
! Detailed component models
" Simulation-based
" Hardware metric-based
! High-level full-system models

Detailed models: Simulation-based
! Inexpensive, arbitrarily accurate
! Not full-system
! Slow (not real-time)
! Not portable
Input:
- Current state- Architecture- Circuit parameters
SimulationOutput:
Predicted power(component)

Detailed models: Metric-based
! Highly accurate
! Not full-system
! Complex, require specialized knowledge
! Not portable
Input:
- Design info- HW counters
EquationOutput:
Predicted power(component)
[Contreras and Martonosi, ISLPED 2005][Isci and Martonosi, MICRO 2003]

High-level metrics (Mantis)
! How accurate?
! How portable?
! Tradeoff between model parameters/complexityand accuracy?
Input:
Common util.metrics
EquationOutput:
Predicted power(system)

Power Modeling
! Run one-time calibration scheme(possibly at vendor)" Stress individual components: CPU,
memory, disk
" Outputs: time-stamped performancemetrics & AC power measurements
! Fit model parameters to calibrationdata
! Use model to predict power" Inputs: performance metrics at each
time t
" Output: estimation of AC power ateach time t

Models studied
! Constant power (the null model):
! CPU utilization-based models
!
P = C0
Input:
CPU util. %Equation
Output:
Predicted power(system)

CPU utilization-based models
! Linear in CPU utilization
! Empirical power model
[Fan et al, ISCA 2007]
!
P = C0
+ C1u + C
2u
r
!
P = C0
+ C1u
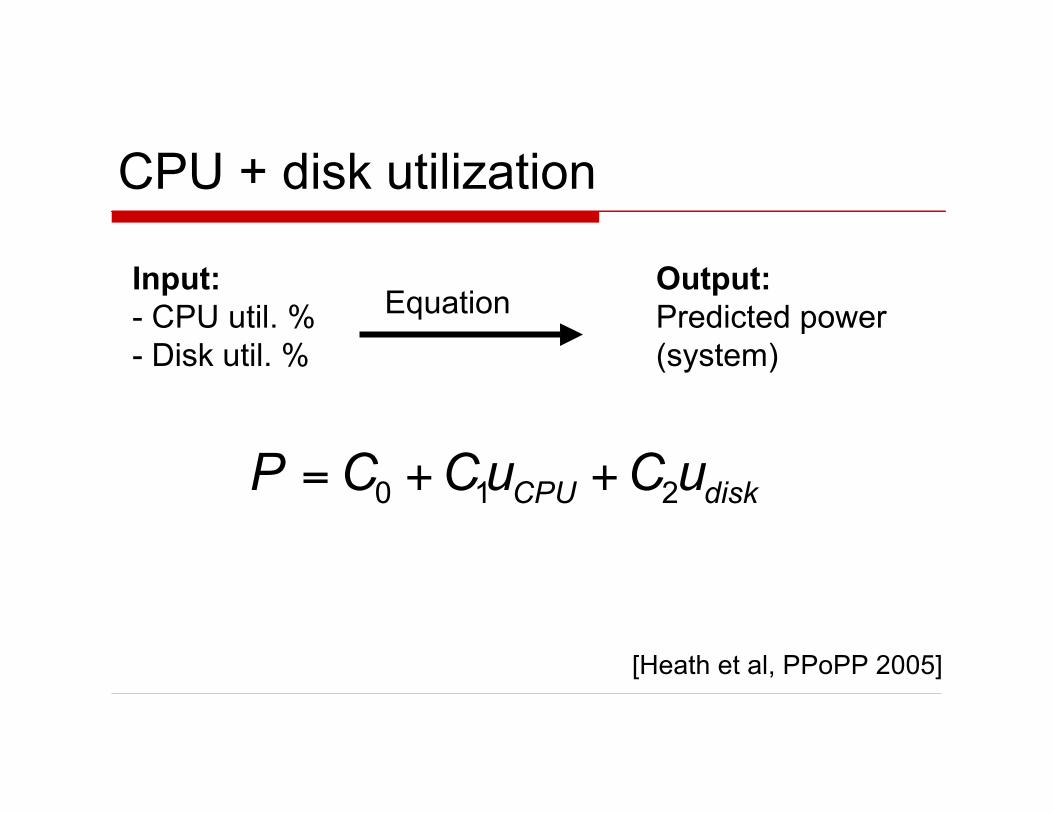
CPU + disk utilization
Input:
- CPU util. %- Disk util. %
EquationOutput:
Predicted power(system)
!
P = C0
+ C1u
CPU+ C
2u
disk
[Heath et al, PPoPP 2005]

CPU + disk util. + performance ctrs
Input:
- CPU util. %- Disk util. %- CPU perfctrs
EquationOutput:
Predicted power(system)
!
P = C0
+ C1u
CPU+ C
2u
disk+ C
iP
i"
[D. Economou, S. Rivoire, C. Kozyrakis,P. Ranganathan, MoBS 2006]

CPU performance counters
! Configurable processor registers to countmicroarchitectural events
! Requires OS modification
! In this study:" Memory bus transactions
" Unhalted CPU clock cycles
" Instructions retired/ILP
" Last-level cache references
" Floating-point instructions

Evaluation methodology
! Run calibration suite and develop modelson a variety of machines
! Run benchmarks, collecting metrics andAC power
! Compare predicted power from metricswith measured AC power

Evaluation machines
! CoolSort with 1 and 13 disks
" Highest and lowest frequencies
! 2005-era AMD laptop
" Highest and lowest frequencies
! 2005-era Itanium server
! 2008-era Xeon server with 32 GB FBDIMM
! Variety in component balance, processor,
domain, dynamic range

Evaluation benchmarks
! SPECcpu int and fp
" Laptop: gcc and gromacs only
! SPECjbb
! Stream
! I/O-intensive programs
" ClamAV
" Nsort (CoolSort-13 only)
" SPECweb (Itanium only)

Overall mean % error

Overall mean % error
Any model is more accurate than none, and
more detail/complexity is better than less.

Overall mean % error
Performance counter model is most accurate
across the board.
Any model is more accurate than none, and
more detail/complexity is better than less.

Overall mean % error
Performance counter model is most accurate
across the board.
Any model is more accurate than none, and
more detail/complexity is better than less.
Simple linear CPU-util. model gets within
10%…with some exceptions.

Best case for empirical CPU model(Xeon server)

Best case for empirical CPU model(Xeon server)
Useful to model shared resources and
bottlenecks

Best case for performance counters(Xeon server and CoolSort-13)

Best case for performance counters(Xeon server and CoolSort-13)
Necessary when dynamic memory power is high

Best case for performance counters(Xeon server and CoolSort-13)
Necessary when dynamic memory power is high
Useful to tell how CPU is being utilized

Modeling conclusions
! Generic approach to power modeling yieldsaccurate results
" Simple models overall have < 10% error
" Same parameters across very different machines
" More information # better models
! Linear CPU util. model not enough for…
" Machines and workloads that are not CPU-dominated
" CPUs with shared resource bottlenecks
" Aggressively power-optimized CPUs
" …all of which reflect hardware trends.

Future work
! Beyond CPU, memory, and disk
" GPUs
" Network (not a factor today)
! Model complexity
" Combine exponential CPU model w/ perfctrs?
" Cooling?

Overall Summary
! Models and metrics needed to improveenergy efficiency
! Metrics:
" JouleSort energy-efficiency benchmarkspecification
" Winning JouleSort machine
! Models:
" Simple, portable high-level modeling technique
" Trade-offs between accuracy and simplicity
Acknowledgments
! Advisor: Christos Kozyrakis
! Mentor: Partha Ranganathan
! Committee: Kunle Olukotun & Dwight Nishimura
! Collaborators: Mehul Shah, Dimitris Economou,Justin Meza
! Assistance: Jacob Leverich, HP Labs, CharlieOrgish, Teresa Lynn
! Defense food! Jayanth and Amin
! Architecture grad students
! Grant Gavranovic, Kelley Rivoire, friends & family