Embed Size (px)
Citation preview
Modelling Seepage and Groundwater Flows from Natural and Replenished beaches
Operational Investigation 582 (Anglian Region)
Contractor:HR Wallingford
Environment Agency Rio House Waterside Drive Aztec West Bristol BS12 4UD
Publishing OrganisationEnvironment Agency Rio House Waterside Drive Aztec West Almondsbury Bristol BS12 4UD
Tel: 01454 624400 Fax: 01454 624409
© Environment Agency 1996
All rights reserved. No part of this document may be produced, stored in a retrieval system, or transmitted, in any form, or by any means, electronic, mechanical, photocopying, recording or otherwise without the prior permission of the publishers.
The views expressed in this document are not necessarily those o f the Environment Agency. Its officers, servants or agents accept no liability whatsoever for any loss or damage arising from the interpretation or use of the information, or reliance upon views contained herein.
Dissemination StatusInternal: Released to Regions External: Public Domain
Statement of useThis report provides information on the prediction of the onset and extent of seepage through natural and replenished shingle banks. Of interest to those involved in Coastal Defence.
Research contractorThis document was produced under Operational Investigation Project 582 by:
Research Contractor name: HR WallingfordResearch Contractor address: Howbery Park
Wallingford Oxon 0X10 8BA
Tel: 01491 835381 Fax: 01491 832233
Environment Agency’s Project ManagerThe Environment Agency’s Project Manager for OI Project 582 was:Richard Nunn - Anglian Region
Contract
Prepared by(name)
Approved by
Gob title)
...........
Date .. A . . ...............
© Environment Agency 1996
Environment Afpncy. Angban RegionOperational Investigation 582 III 20/09/96
Summary
Modelling Seepage and Groundwater Flows from Natural and Replenished beaches
Environment Agency Operational Investigation 582 (Anglian Region)
Report EX 3498 September 1996
This Report describes the work conducted for the National Rivers Authority (now Environment Agency) Anglian Region R&D project 'Modelling seepage and groundwater flows for natural and replenished beaches’. The work was carried out under Topic C06 - Coastal and Estuarine Works/Structures, under the Regional Operational Investigation Reference Number 582. The overall project objective is to provide improved predictions of the onset and extent of seepage through natural and replenished beaches and hence allow more effective deployment of maintenance resources during periods of severe weather.
An existing finite element numerical model has been adapted to simulate seepage through shingle ridge beaches and applied to a site between Salthouse and Blakeney on the North Norfolk coast. This frontage forms part of the Kelling Quay to Cley Coastguards frontage, Coastal Unit 2 in the North Norfolk Shoreline Management Plan Sub-cell 3(a), Snettisham to Sheringham. This has indicated that seepage through the ridge is an important factor in de-stabilising the ridge during extreme events, but it is not the dominant factor. The model is to be used as a predictive tool to assess conditions where failure or severe flooding is likely to occur.
Environment Agency. Anglian RegionOperational Investigation 562 V 2009/96

Environment Agency. Anglian Region Operational Investigation S82
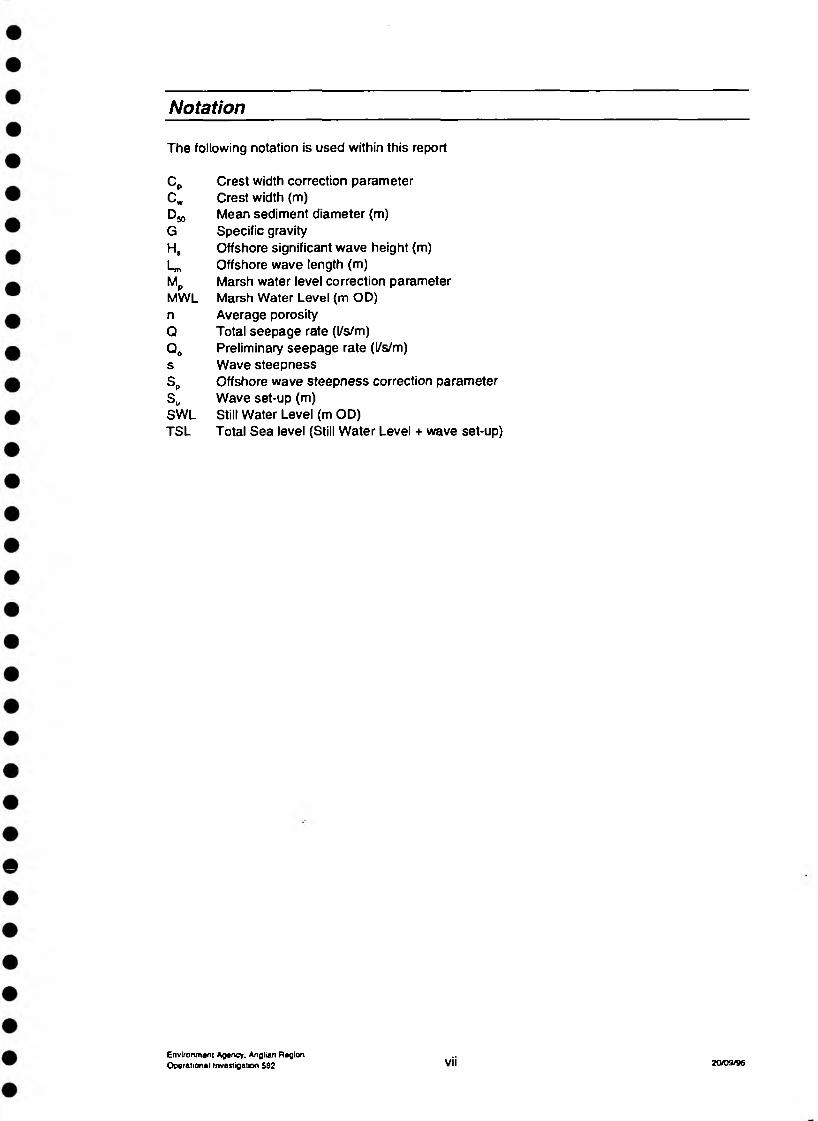
Notation
The following notation is used within this report
Cp Crest width correction parameterCw Crest width (m)Dw Mean sediment diameter (m)G Specific gravityH, Offshore significant wave height (m)Ln, Offshore wave length (m)M P
Marsh water level correction parameterMWL Marsh Water Level (m OD)n Average porosityQ Total seepage rate (l/s/m)Q0 Preliminary seepage rate (l/s/m)s Wave steepnessSp Offshore wave steepness correction parameters. Wave set-up (m)SWL Still Water Level (m OD)TSL Total Sea level (Still Water Level + wave set-up)
Environment Agency. Anglian RegionOperational Investigation 582 vii 2009/96

Environment Agency. Anglian Region Operational Investigation 5B2
Contents
Page
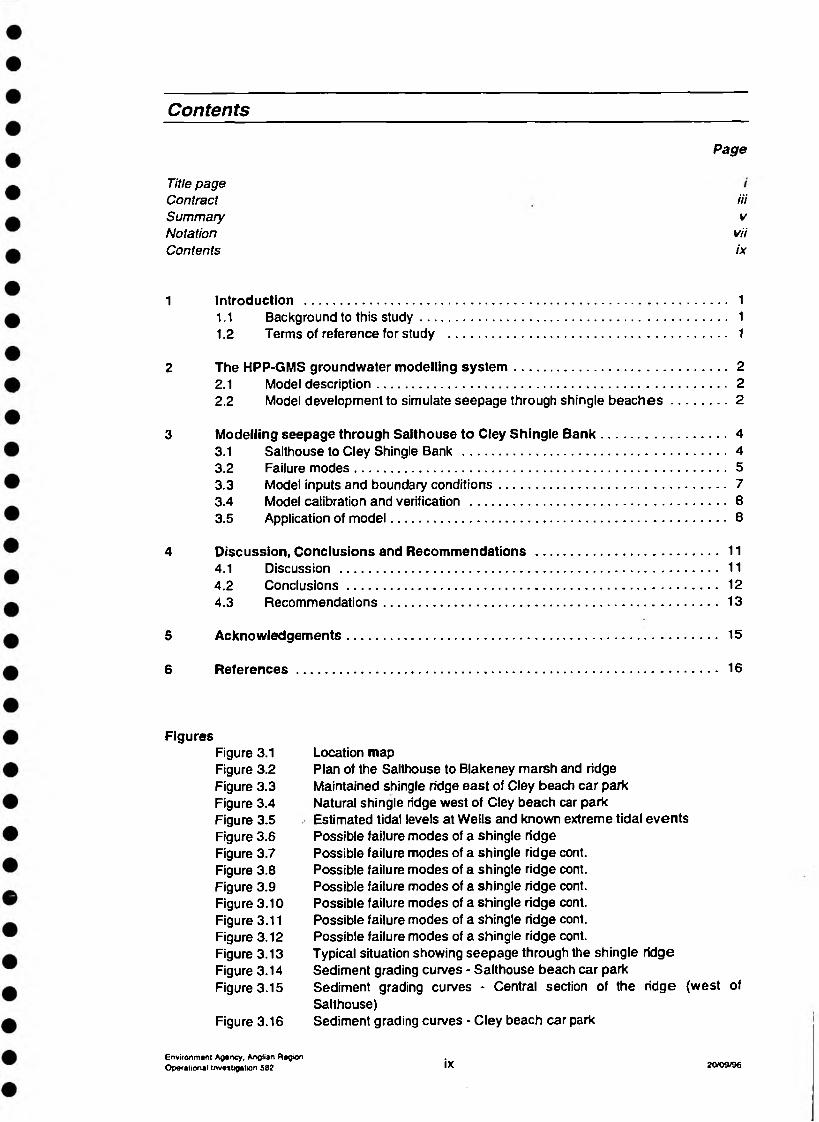
Title pageContract iiiSummary vNotation viiContents ix
1 Introduction ................................................................................................................... 11.1 Background to this s tudy................................................................................... 11.2 Terms of reference for study ............................................................................ 1
2 The HPP-GMS groundwater modelling system .......................................................... 22.1 Model description............................................................................................... 2
2.2 Model development to simulate seepage through shingle beaches...............2
3 Modelling seepage through Safthouse to Cley Shingle B a n k ..................................43.1 Salthouse to Cley Shingle Bank ........................................................................4
3.2 Failure modes..................................................................................................... .53.3 Model inputs and boundary conditions.............................................................. 73.4 Model calibration and verification .......................................................................83.5 Application of model........................................................................................... 8
4 Discussion, Conclusions and Recommendations.................................................. 114.1 Discussion ....................................................................................................... 114.2 Conclusions..................................................................................................... 124.3 Recommendations........................................................................................... 13
5 Acknowledgements..................................................................................................... 15
6 References................................................................................................................... 16
FiguresFigure 3.1 Location mapFigure 3.2 Plan of the Salthouse to Blakeney marsh and ridgeFigure 3.3 Maintained shingle ridge east of Cley beach car parkFigure 3.4 Natural shingle ridge west of Cley beach car parkFigure 3.5 Estimated tidal levels at Weils and known extreme tidal eventsFigure 3.6 Possible failure modes of a shingle ridgeFigure 3.7 Possible failure modes of a shingle ridge cont.Figure 3.8 Possible failure modes of a shingle ridge cont.Figure 3.9 Possible failure modes of a shingle ridge cont.Figure 3.10 Possible failure modes of a shingle ridge cont.Figure 3.11 Possible failure modes of a shingle ridge cont.Figure 3.12 Possible failure modes of a shingle ridge cont.Figure 3.13 Typical situation showing seepage through the shingle ridgeFigure 3.14 Sediment grading curves - Salthouse beach car parkFigure 3.15 Sediment grading curves * Central section of the ridge {west of
Salthouse)Figure 3.16 Sediment grading curves - Cley beach car park
Environment Agency, Anglian RegionOperational investigation 582 ix 2CV09/96

Environment Agency. Anglian Region Operational Investigation 582
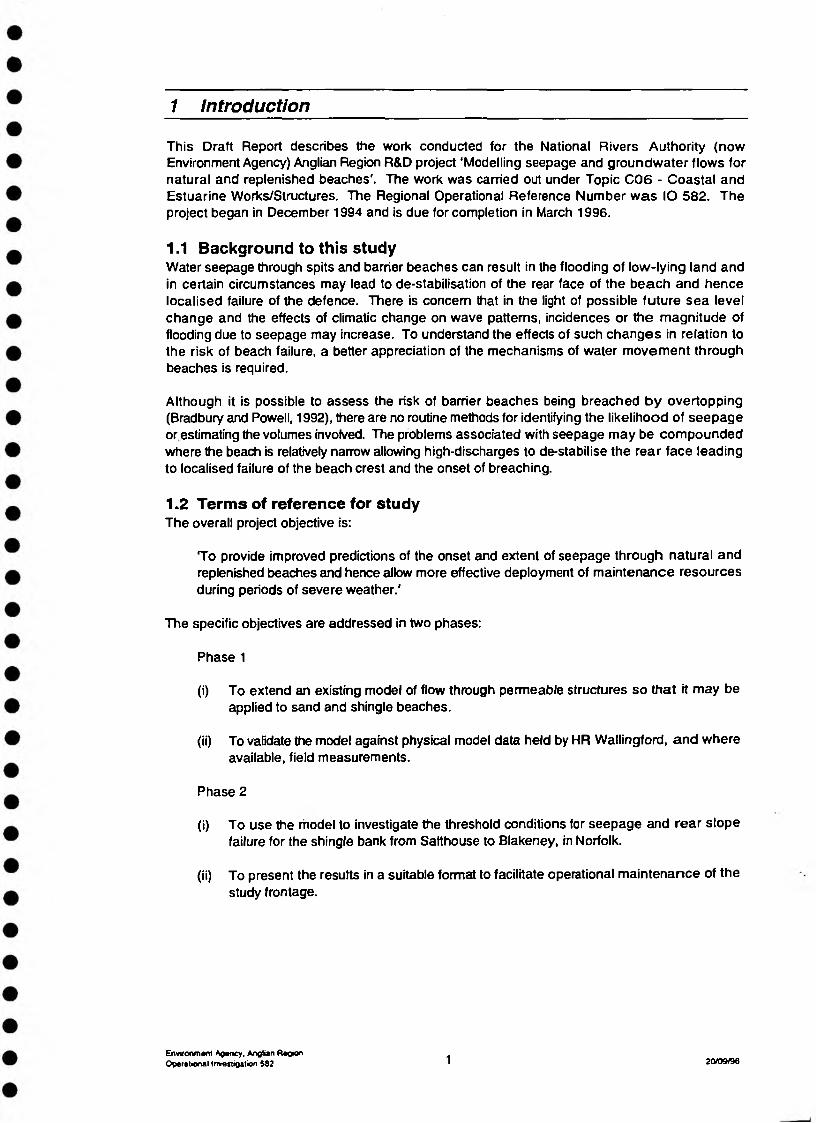
1 Introduction
This Draft Report describes the work conducted for the National Rivers Authority (now Environment Agency) Anglian Region R&D project ‘Modelling seepage and groundwater flows for natural and replenished beaches'. The work was carried out under Topic C06 - Coastal and Estuarine Works/Structures. The Regional Operational Reference Number was IO 582. The project began in December 1994 and is due for completion in March 1996.
1.1 Background to this studyWater seepage through spits and barrier beaches can result in the flooding of low-lying land and in certain circumstances may lead to de-stabilisation of the rear face of the beach and hence localised failure of the defence. There is concern that in the light of possible future sea level change and the effects of climatic change on wave patterns, incidences or the magnitude of flooding due to seepage may increase. To understand the effects of such changes in relation to the risk of beach failure, a better appreciation of the mechanisms of water movement through beaches is required.
Although it is possible to assess the risk of barrier beaches being breached by overtopping (Bradbury and Powell, 1992), there are no routine methods for identifying the likelihood of seepage or estimating the volumes involved. The problems associated with seepage may be compounded where the beach is relatively narrow allowing high-discharges to de-stabilise the rear face leading to localised failure of the beach crest and the onset of breaching.
1.2 Terms of reference for studyThe overall project objective is:
To provide improved predictions of the onset and extent of seepage through natural and replenished beaches and hence allow more effective deployment of maintenance resources during periods of severe weather.'
The specific objectives are addressed in two phases:
Phase 1
(i) To extend an existing model of flow through permeable structures so that it may be applied to sand and shingle beaches.
(ii) To validate the model against physical model data held by HR Wallingford, and where available, field measurements.
Phase 2
(i) To use the model to investigate the threshold conditions for seepage and rear slope failure for the shingle bank from Safthouse to Blakeney, in Norfolk.
(ii) To present the results in a suitable format to facilitate operational maintenance of the study frontage.
Environment Agency, Anglian RagtonOperational Investigation 582 1 20/09/96
Contents Continued
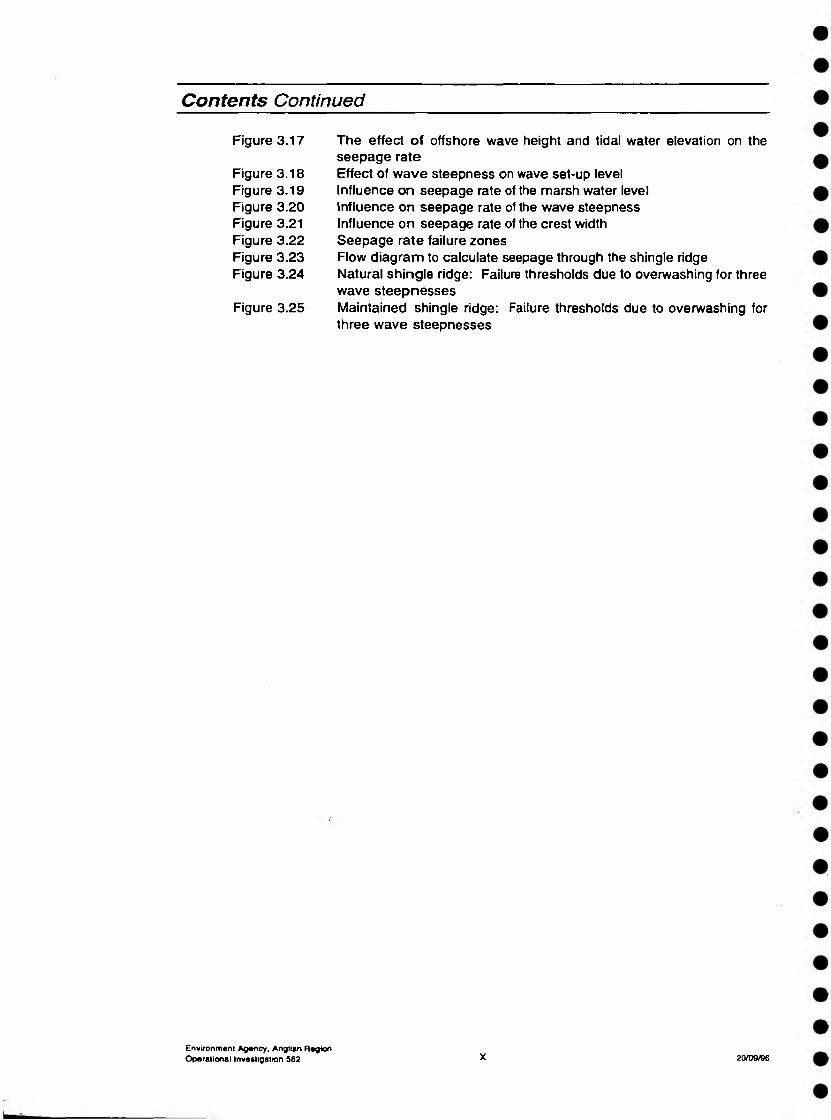
Figure 3.17
Figure 3.18 Figure 3.19 Figure 3.20 Figure 3.21 Figure 3.22 Figure 3.23 Figure 3.24
Figure 3.25
The effect of offshore wave height and tidal water elevation on the seepage rateEffect of wave steepness on wave set-up level Influence on seepage rate of the marsh water level Influence on seepage rate of the wave steepness Influence on seepage rate of the crest width Seepage rate failure zonesFlow diagram to calculate seepage through the shingle ridge Natural shingle ridge: Failure thresholds due to overwashing for three wave steepnessesMaintained shingle ridge: Failure thresholds due to overwashing for three wave steepnesses
Environment Agency. Anglian RegionOperational Investigation 582 X 20/09/96
Initial simulations using the numerical model only considered the static tidal elevation at the seaward boundary (ie no account was taken of wave conditions). Comparisons with the physical model results indicated that when the shingle ridge was relatively narrow, wave conditions would have a significant influence on the seepage rate. However, this influence reduced as the width of the beach increased.
Hence, in situations of restricted beach width the effect of waves is likely to be an important input parameter in modelling seepage through a beach. To account for wave action, a number of methods were investigated. The most effective was found to be where the seaward (tidal level) water boundary was increased by a certain amount based on the wave conditions. This was achieved by adding on the wave set-up on a shingle beach to the still water level. Wave set-up on a shingle beach was defined by Powell (1990) and is described by equation 2.1:
^ = 0.31 - 0.35-^ (2.1)
Assuming a steady-state water level consisting of tidal elevation plus wave set-up was found to be a satisfactory way of representing the actual situation of tidal elevation and oscillating wave action at the seaward boundary.
It was hoped that the comparison of the model and physical model results would help derive values for the likely unknown parameters when applying the model to an actual situation, eg hydraulic conductivity. The initial plan was to calibrate and produce a general groundwater flow model which could then be applied to a wide range of beach scenarios without the need for detailed field information. Unfortunately, little information had been collected during the physical modelling on the distribution of seepage flows through the body of the beach and as such there were too many unknown variables to allow a complete investigation of the sensitivities of each of the input parameters. Hence, each simulation of a particular scenario was required to be set up individually.
Environment Agency. Anglian RegionOperational Investigation 582 3 20/09/96
2 The HPP-GMS groundwater modelling system
2.1 Model descriptionHPP-GMS stands for Hydrological Pre/Post Processing - Groundwater Modelling System. The model was developed by the Department of Hydraulics, Hydrology and Water Resource Management at the Technical University of Vienna. It is an interactive program for simulating two- dimensional groundwater flow and pollutant transport through porous media.
The system is based on the differential equations of two-dimensional flow and is capable of modelling both steady and unsteady conditions. It is also capable of modelling flows in both isotropic/anisotropic and homogeneous/heterogeneous soil conditions. The spatial model domain is defined by a mesh of irregular triangular elements and the governing equations solved spatially using the Galerkin finite element method. For unsteady flow conditions the temporal derivatives are solved by finite difference methods.
The model is contained within a shell (Pre/Post Processor) which controls the input and output of data. The Pre-processor includes an automatic mesh generator and allows all predetermined conditions to be applied to the model domain, (eg boundary conditions, soil attributes). The Post- Processor controls the analysis and presentation of results, (eg stream tines, seepage fluxes).
2.2 Model development to simulate seepage through shingle beachesPhase 1 of this research project was to adapt the existing groundwater flow model described above to represent seepage through a vertical profile of a shingle beach and to validate the model using existing physical model data. For this study, the model was developed using finite-element code to solve a system of equations over an irregular triangular spatial grid. The finite-element code was used, (as opposed to finite-difference code) as it allows a much more precise representation of the beach geometry and variations in the sub-strata of the beach.
The initial validation work concentrated on using physical model data held at HR Wallingford, to define the important parameters required by the model and to derive and check assumed values for certain parameters. The primary physical model data used was from a 2-dimensional physical model study undertaken to investigate seepage through a shingle/clay ridge following completion of a beach renourishment scheme. Comparison with the physical model results allowed the main parameters which would affect seepage through a shingle beach to be identified. The main parameters identified were:
seaward water level wave conditionslandward water level, or groundwater levels internal structure of the beach
• magnitude of hydraulic conductivity• spatial distribution of hydraulic conductivity
A major part of the initial work investigated the effect of waves on the seepage rate. At the seaward boundary the seepage rate is influenced both by the tidal elevation and the action of waves upon the beach. However, the HPP-GMS model cannot account for the constantly varying water level upon the beach due to wave action. This is not a major problem in many cases as any oscillating phreatic surface within a beach due to wave action will be damped out, ie a steady-state approach can be adopted. Where this may become a problem, and where it may be necessary to account for wave action and run-up on the beach, is where the beach material is dominantly coarse shingle with few fines. Individual waves can then result in a constantly varying phreatic surface which will have a significant influence on the rate of seepage through the beach.
Environment Agency, Anglian RegionOperational Investigation 582 2 2009/96
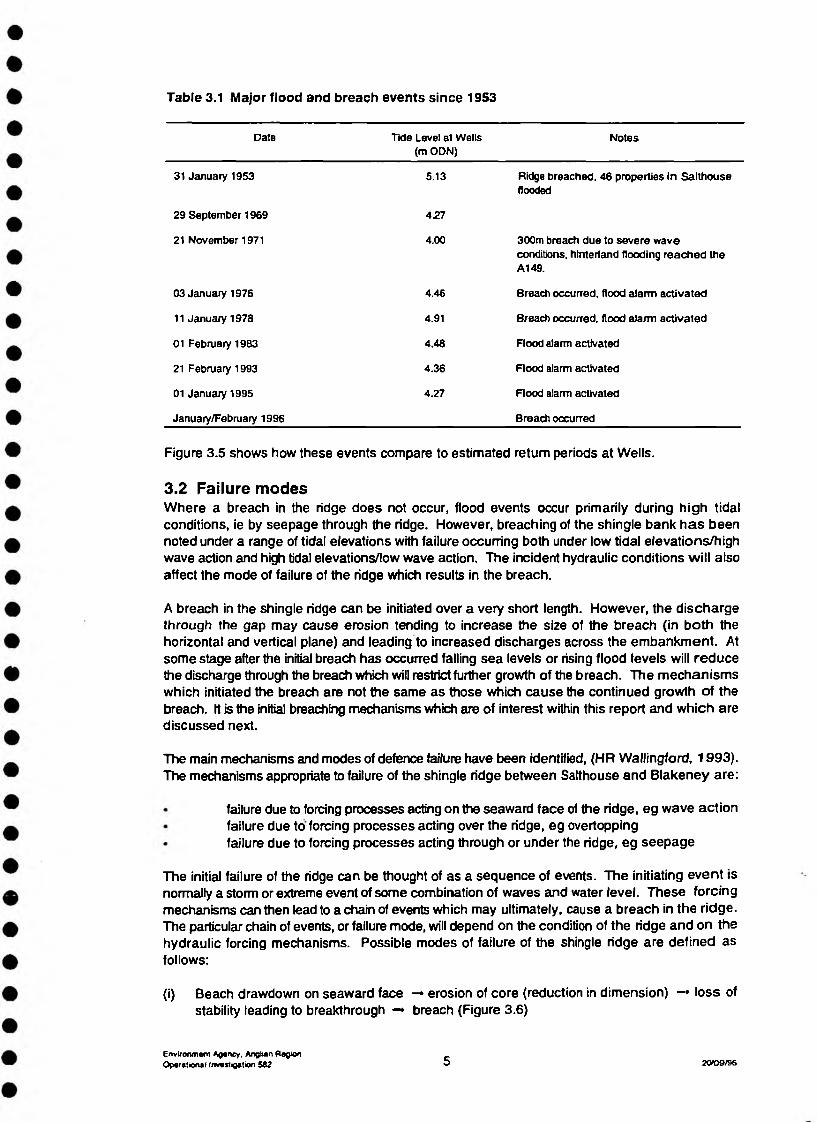
Table 3.1 Major flood and breach events since 1953
Date TkJe Level at Wells (m ODN)
Notes
31 January 1953 5.13 Ridge breached, 46 properties in Salthouse flooded
29 September 1969 427
21 November 1971 4.00 300m breach due to severe wave conditions, hinterland flooding reached the A149.
03 January 1976 4.46 Breach occurred, flood alarm activated
11 January 1978 4.91 Breach occurred, flood aJarm activated
01 February 1983 4.46 Flood alarm activated
21 February 1993 4.36 Flood alarm activated
01 January 1995 4.27 Flood alarm activated
January/February 1996 Breach occurred
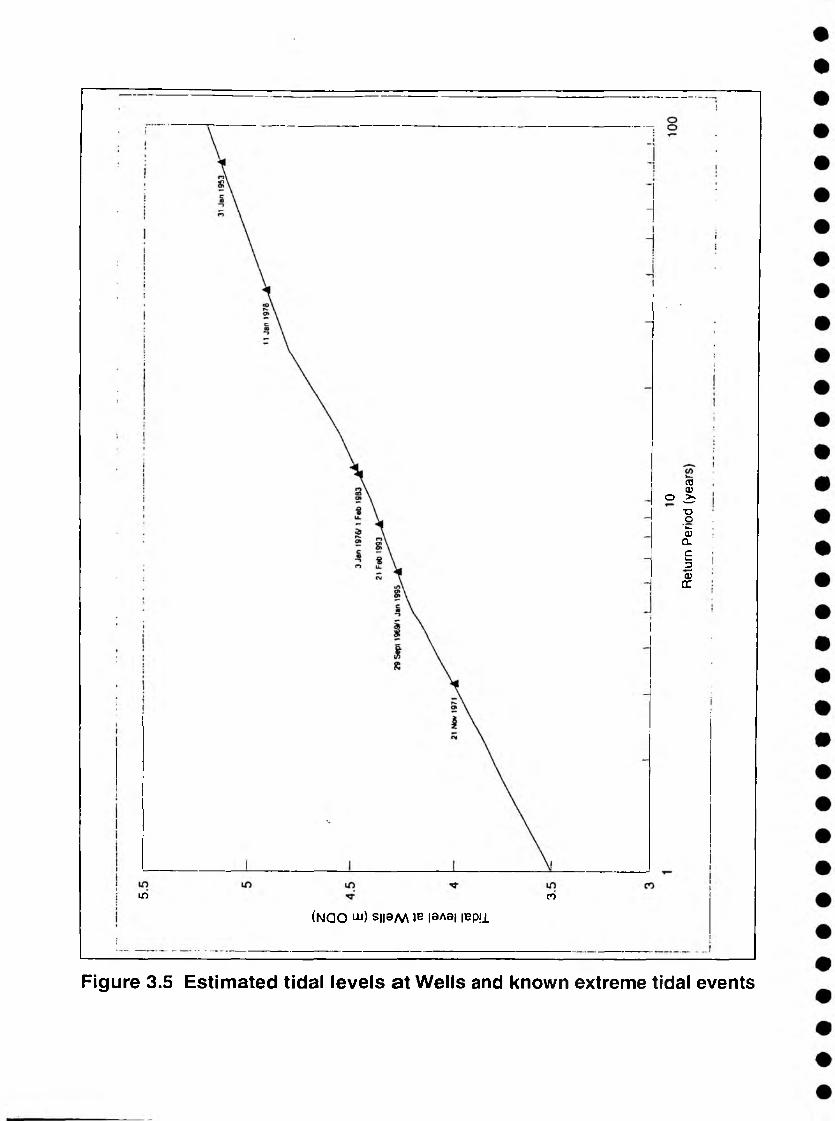
Figure 3.5 shows how these events compare to estimated return periods at Wells.
3.2 Failure modesWhere a breach in the ridge does not occur, flood events occur primarily during high tidal conditions, ie by seepage through the ridge. However, breaching of the shingle bank has been noted under a range of tidal elevations with failure occurring both under low tidal elevations/high wave action and high tidal elevations/low wave action. The incident hydraulic conditions w ill also affect the mode of failure of the ridge which results in the breach.
A breach in the shingle ridge can be initiated over a very short length. However, the discharge through the gap may cause erosion tending to increase the size of the breach (in both the horizontal and vertical plane) and leading to increased discharges across the embankment. At some stage after the initial breach has occurred falling sea levels or rising flood levels will reduce the discharge through the breach which will restrict further growth of the breach. The mechanisms which initiated the breach are not the same as those which cause the continued growth of the breach. It is the initial breaching mechanisms which are of interest within this report and which are discussed next.
The main mechanisms and modes of defence failure have been identified, (HR Wallingford, 1993). The mechanisms appropriate to failure of the shingle ridge between Salthouse and Blakeney are:
failure due to forcing processes acting on the seaward face of the ridge, eg wave actionfailure due to forcing processes acting over the ridge, eg overtoppingfailure due to forcing processes acting through or under the ridge, eg seepage
The initial failure of the ridge can be thought of as a sequence of events. The initiating event is normally a storm or extreme event of some combination of waves and water level. These forcing mechanisms can then lead to a chain of events which may ultimately, cause a breach in the ridge. The particular chain of events, or failure mode, will depend on the condition of the ridge and on the hydraulic forcing mechanisms. Possible modes of failure of the shingle ridge are defined as follows:
(i) Beach drawdown on seaward face -* erosion of core (reduction in dimension) —• loss of stability leading to breakthrough -» breach (Figure 3.6)
Environment Agency. Anglian RegionOperational Investigation 502 5 20/09/96
3 Modelling seepage through Salthouse to Cley Shingle Bank
3.1 Salthouse to Cley Shingle BankThe shoreline of the north Norfolk coast between Sheringham and Blakeney Point, Figure 3.1, is characterised by a natural upper shingle ridge beach. Between Sheringham and Kelling Hard, the shingle beach is backed by glacial cliffs. To the west of Kelling Hard to Blakeney Point, the upper shingle beach is in the form of a ridge which is backed by low lying marshland, (Figure 3.2). This ridge offers the only means of coastal defence to the freshwater marshes at Salthouse and Cley, and to the properties in Salthouse village.
The coastal edge along this frontage been retreating landward for many years with an associated nett loss of beach material resulting in the ridge migrating landward and becoming narrower. At present there appears to be little nett longshore movement of beach material and onshore/offshore movement is dominant Up to pea sized gravel material has been observed to move about 100m offshore during onshore storm events. This material is then moved back onto the beach, over a longer period, by swell wave conditions. The ridge is presently maintained at a crest elevation of 7.5m OD and between 4m and 7m in width by the National Rivers Authority. On a number of occasions the maintained ridge has been breached or storm action has resulted in reduction of the crest width. After such events the ridge is rebuilt by bulldozers. To the west of Cley the ridge is not maintained and is left in a natural condition. Overwashing of the ridge and flooding of the marsh hinterland occurs much more frequently. Figures 3.3 and 3.4 demonstrate the difference in ridge geometry between the maintained and the natural ridge.
The marshland which backs the Satthouse to Cley ridge covers an area of approximately 120ha and is bordered at the eastern end by the Satthouse beach road, (Figure 3.2), to the landward side by the A149 and to the west by Cley East Bank. This bank separates the marsh between Salthouse and Cley from the intertidal saltmarsh to the west, in the lee of Blakeney spit. The marsh is gravitationally drained to the west by a channel known as New Cut via sluices at Cley East Bank. This ditch separates the saline marsh to the north from the freshwater marsh to the south. Normal water levels in the marsh remain fairly constant outwith flood events at about 1.90m OD, with the water level in New Cut approximately 1.27m OD. The marshland is important omithologically, being designated as a National Bird Reserve, and for other ecological attributes.
The marsh between Satthouse and Cley has a history of inundation due to both seepage through the ridge during periods of high tidal levels and due to breaching of the ridge during periods of high tidal levels and/or severe onshore wave action. The major flood events which have occurred since 1949 are detailed in Table 3.1 (Jeavons, 1995). During the storm of 31 January/1 February 1953, 46 properties in Salthouse were flooded (Anglian Water Authority, 1976).
An automatic flood warning system was installed in the early 1980's which activates an audible alarm when water levels in the marsh reach 2.74m OD (Approximately 1m higher than normal marsh levels). This level is just below that of the A149 which is at 2.80m OD.
Environment Agency. Anglian RegionOperational Investigation 582 4 20/09/96
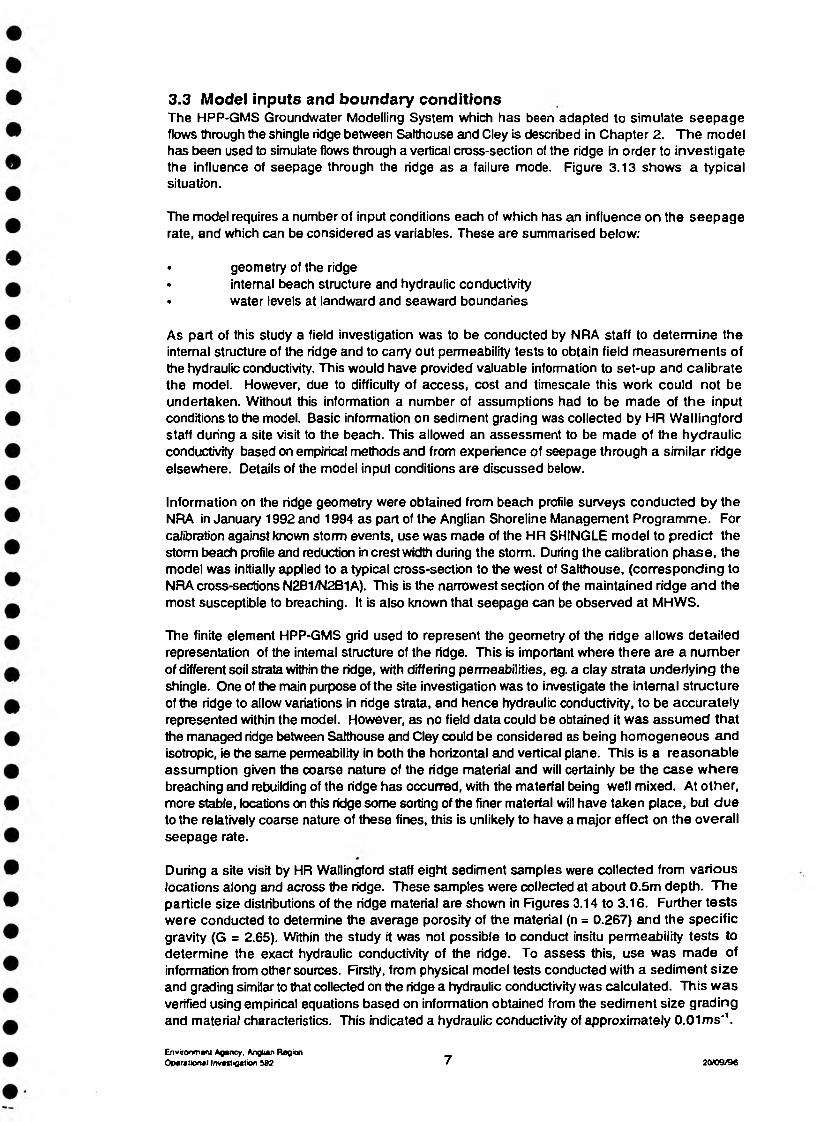
3.3 Model inputs and boundary conditionsThe HPP-GMS Groundwater Modelling System which has been adapted to simulate seepage flows through the shingle ridge between Satthouse and Cley is described in Chapter 2. The model has been used to simulate flows through a vertical cross-section of the ridge in order to investigate the influence of seepage through the ridge as a failure mode. Figure 3.13 shows a typical situation.
The model requires a number of input conditions each of which has an influence on the seepage rate, and which can be considered as variables. These are summarised below:
• geometry of the ridge< internal beach structure and hydraulic conductivity• water levels at landward and seaward boundaries
As part of this study a field investigation was to be conducted by NRA staff to determine the internal structure of the ridge and to carry out permeability tests to obtain field measurements of the hydraulic conductivity. This would have provided valuable information to set-up and calibrate the model. However, due to difficulty of access, cost and timescale this work could not be undertaken. Without this information a number of assumptions had to be made of the input conditions to the model. Basic information on sediment grading was collected by HR Wallingford staff during a site visit to the beach. This allowed an assessment to be made of the hydraulic conductivity based on empirical methods and from experience of seepage through a similar ridge elsewhere. Details of the model input conditions are discussed below.
Information on the ridge geometry were obtained from beach profile surveys conducted by the NRA in January 1992 and 1994 as part of the Anglian Shoreline Management Programme. For calibration against known storm events, use was made of the HR SHINGLE model to predict the storm beach profile and reduction in crest width during the storm. During the calibration phase, the model was initially applied to a typical cross-section to the west of Satthouse, (corresponding to NRA cross-sections N2B1/N2B1 A). This is the narrowest section of the maintained ridge and the most susceptible to breaching. It is also known that seepage can be observed at MHWS.
The finite element HPP-GMS grid used to represent the geometry of the ridge allows detailed representation of the internal structure of the ridge. This is important where there are a number of different soil strata within the ridge, with differing permeabilities, eg. a clay strata underlying the shingle. One of the main purpose of the site investigation was to investigate the internal structure of the ridge to allow variations in ridge strata, and hence hydraulic conductivity, to be accurately represented within the model. However, as no field data could be obtained it was assumed that the managed ridge between Satthouse and Cley could be considered as being homogeneous and isotropic, ie the same permeability in both the horizontal and vertical plane. This is a reasonable assumption given the coarse nature of the ridge material and witi certainly be the case where breaching and rebuilding of the ridge has occurred, with the material being well mixed. At other, more stable, locations on this ridge some sorting of the finer material will have taken place, but due to the relatively coarse nature of these fines, this is unlikely to have a major effect on the overall seepage rate.
During a site visit by HR Wallingford staff eight sediment samples were collected from various locations along and across the ridge. These samples were collected at about 0.5m depth. The particle size distributions of the ridge material are shown in Figures 3.14 to 3.16. Further tests were conducted to determine the average porosity of the material (n = 0.267) and the specific gravity (G = 2.65). Within the study it was not possible to conduct insitu permeability tests to determine the exact hydraulic conductivity of the ridge. To assess this, use was made of information from other sources. Firstly, from physical model tests conducted with a sediment size and grading similar to that collected on the ridge a hydraulic conductivity was calculated. This was verified using empirical equations based on information obtained from the sediment size grading and material characteristics. This indicated a hydraulic conductivity of approximately 0.01ms'1.
Environment Agency. Anglian Rag ionOperational Investigation M 2 7 2CV09/96
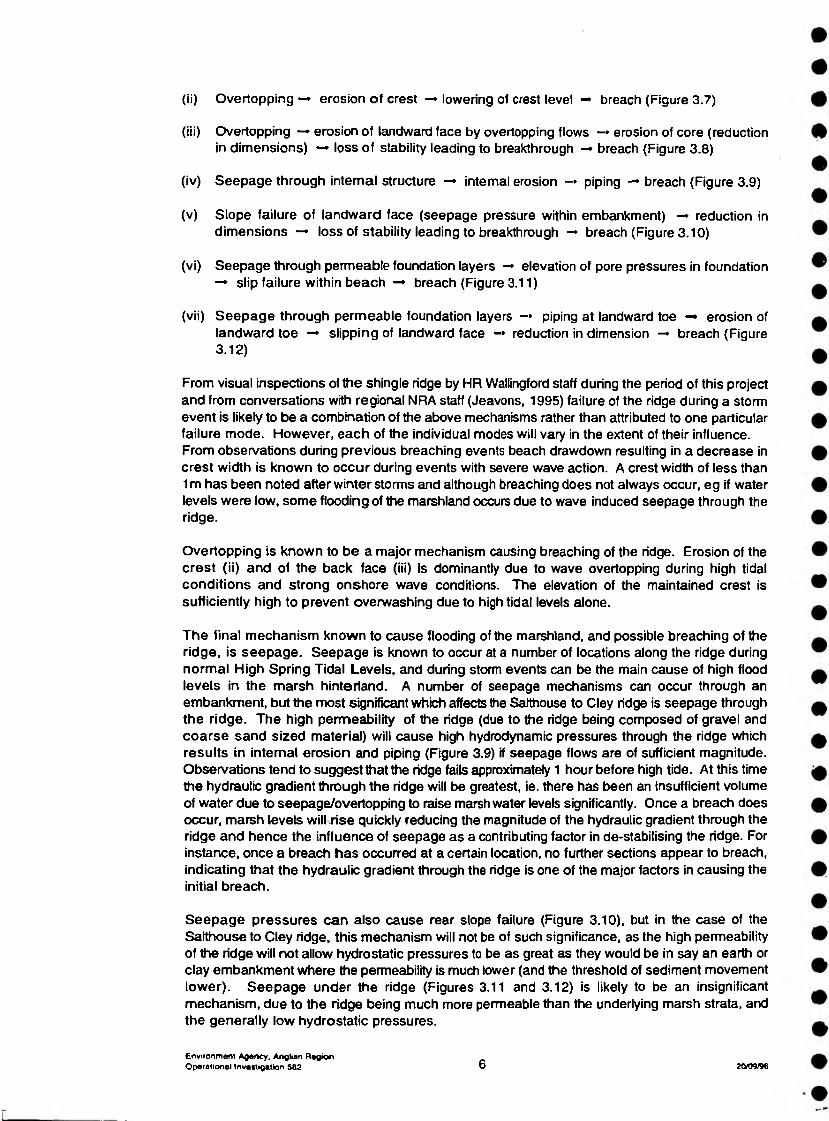
<ii) Overtopping —* erosion o f crest —* lowering of crest level -* breach (Figure 3.7)
(iii) Overtopping —* erosion of landward face by overtopping flows —» erosion of core (reduction jn dimensions) —* loss of stability leading to breakthrough -» breach (Figure 3.8)
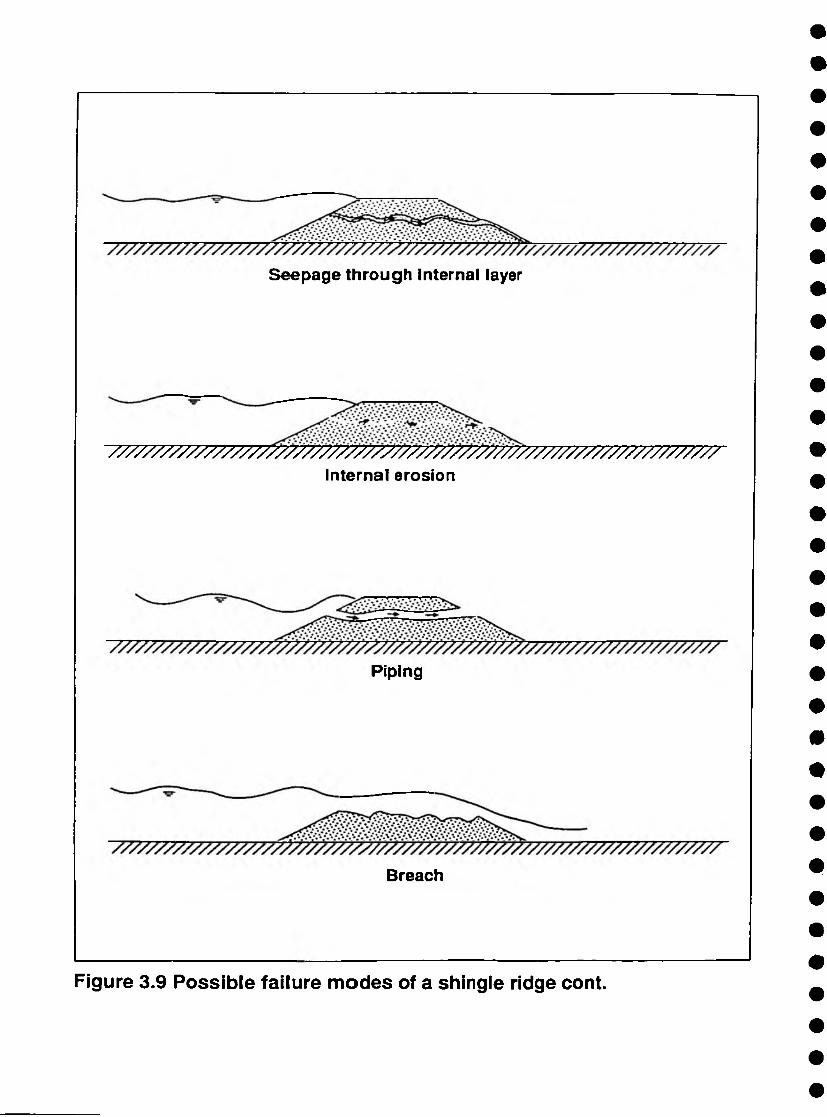
(iv) Seepage through internal structure —* internal erosion -» piping -» breach (Figure 3.9)
(v) Slope failure of landward face (seepage pressure within embankment) -* reduction in dimensions —* loss of stability leading to breakthrough -* breach (Figure 3.10)
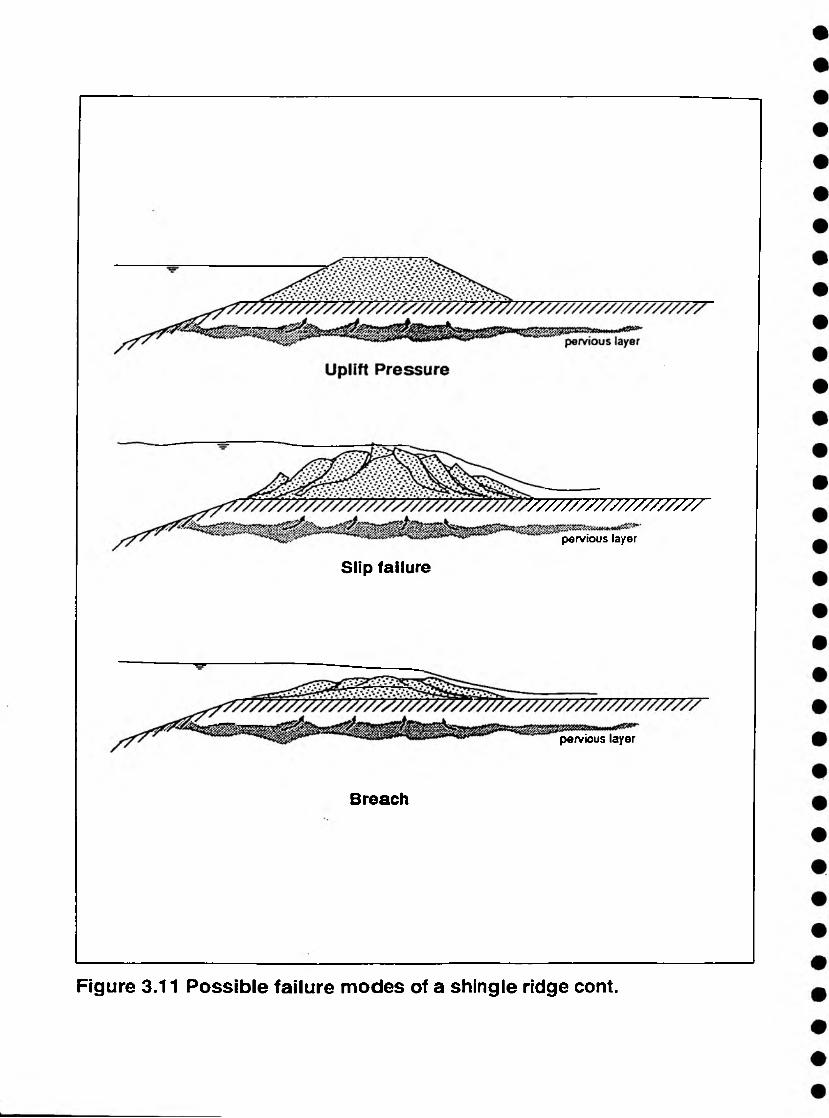
(vi) Seepage through permeable foundation layers -» elevation of pore pressures in foundation —► slip failure within beach -* breach (Figure3.11)
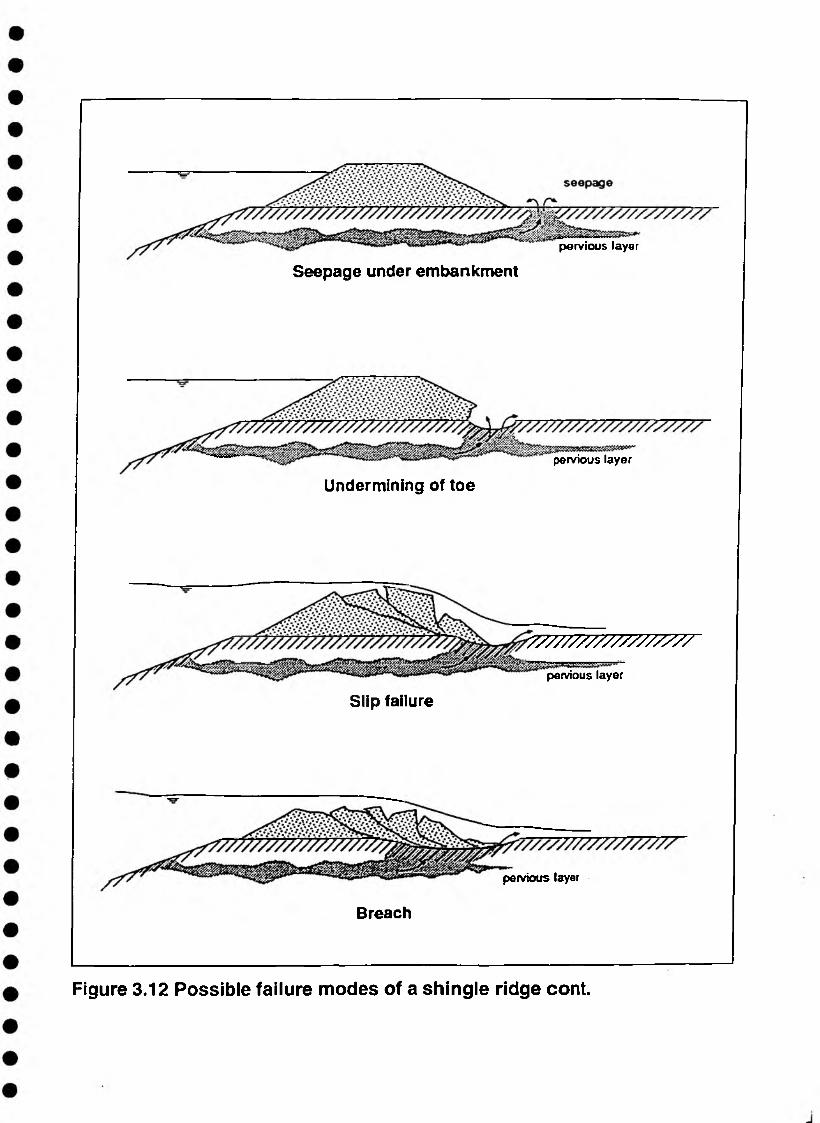
(vii) Seepage through permeable foundation layers -* piping at landward toe -* erosion of landward toe -* slipping of landward face -» reduction in dimension -» breach (Figure 3.12)
From visual inspections of the shingle ridge by HR Wallingford staff during the period of this project and from conversations with regional NRA staff (Jeavons, 1995) failure of the ridge during a storm event is likely to be a combination of the above mechanisms rather than attributed to one particular failure mode. However, each of the individual modes will vary in the extent of their influence. From observations during previous breaching events beach drawdown resulting in a decrease in crest width is known to occur during events with severe wave action. A crest width of less than 1 m has been noted after winter storms and although breaching does not always occur, eg if water levels were low, some flooding of the marshland occurs due to wave induced seepage through the ridge.
Overtopping is known to be a major mechanism causing breaching of the ridge. Erosion of the crest (ii) and of the back face (iii) is dominantly due to wave overtopping during high tidal conditions and strong onshore wave conditions. The elevation of the maintained crest is sufficiently high to prevent overwashing due to high tidal levels alone.
The final mechanism known to cause flooding of the marshland, and possible breaching of the ridge, is seepage. Seepage is known to occur at a number of locations along the ridge during normal High Spring Tidal Levels, and during storm events can be the main cause of high flood levels in the marsh hinterland. A number of seepage mechanisms can occur through an embankment, but the most significant which affects the Satthouse to Cley ridge is seepage through the ridge. The high permeability of the ridge (due to the ridge being composed of gravel and coarse sand sized material) will cause high hydrodynamic pressures through the ridge which results in internal erosion and piping (Figure 3.9) if seepage flows are of sufficient magnitude. Observations tend to suggest that the ridge fails approximately 1 hour before high tide. At this time the hydraulic gradient through the ridge will be greatest, ie. there has been an insufficient volume of water due to seepage/overtopping to raise marsh water levels significantly. Once a breach does occur, marsh levets will .rise quickly reducing the magnitude of the hydraulic gradient through the ridge and hence the influence of seepage as a contributing factor in de-stabilising the ridge. For instance, once a breach has occurred at a certain location, no further sections appear to breach, indicating that the hydraulic gradient through the ridge is one of the major factors in causing the initial breach.
Seepage pressures can also cause rear slope failure (Figure 3.10), but in the case of the Salthouse to Cley ridge, this mechanism will not be of such significance, as the high permeability of the ridge will not allow hydrostatic pressures to be as great as they would be in say an earth or clay embankment where the permeability is much lower (and the threshold of sediment movement lower). Seepage under the ridge (Figures 3.11 and 3.12) is likely to be an insignificant mechanism, due to the ridge being much more permeable than the underlying marsh strata, and the generally low hydrostatic pressures.
Environment Agency. Anglian RegionOperational Investigation £82 6 20AJ9/96
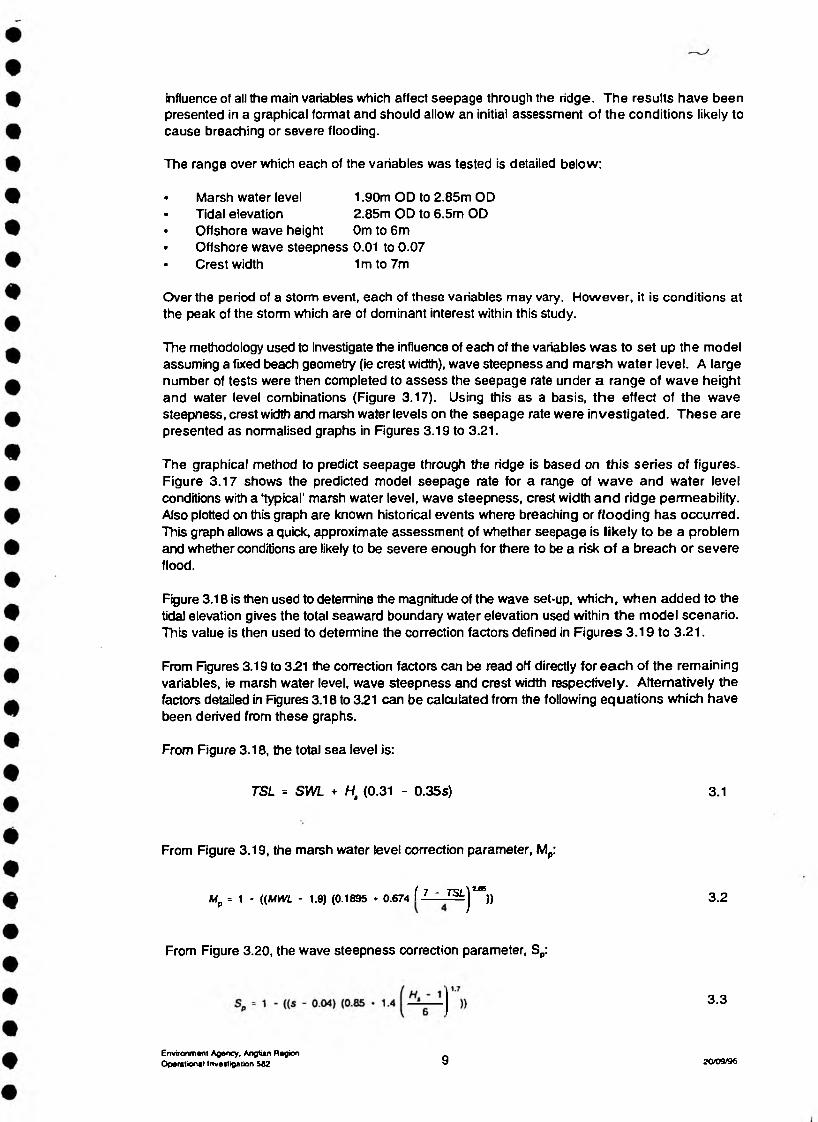
influence of all the main variables which affect seepage through the ridge. The results have been presented in a graphical format and should allow an initial assessment of the conditions likely to cause breaching or severe flooding.
The range over which each of the variables was tested is detailed below:
Marsh water level Tidal elevation
1.90m OD to 2.85m OD 2.85m OD to 6.5m OD
Offshore wave height 0m to 6m Offshore wave steepness 0,01 to 0.07Crest width 1 m to 7m
Over the period of a storm event, each of these variables may vary. However, it is conditions at the peak of the storm which are of dominant interest within this study.
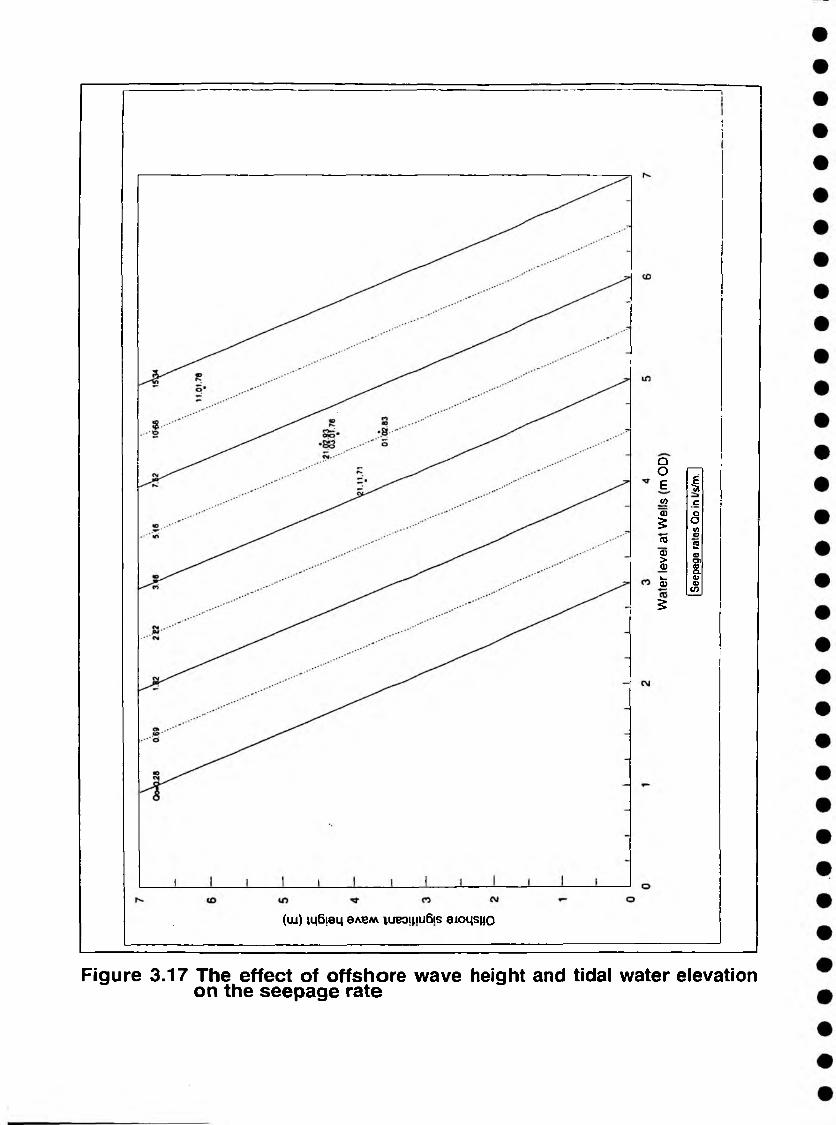
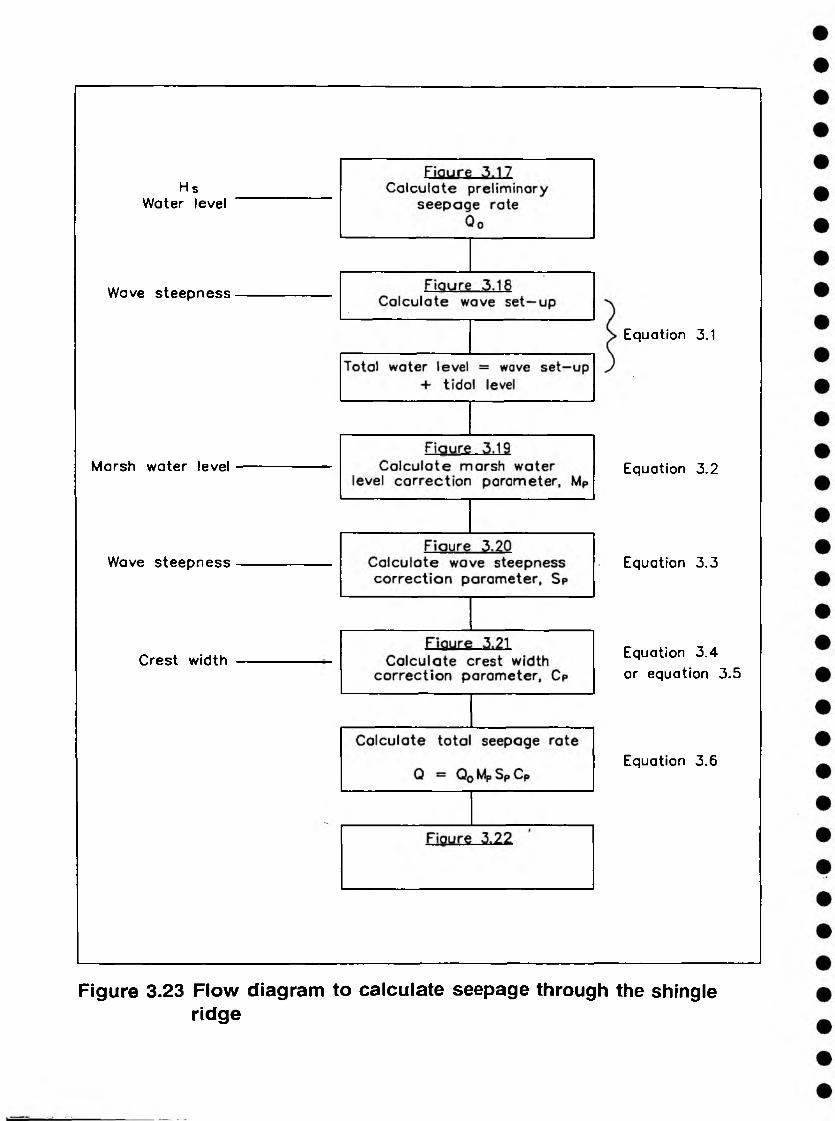
The methodology used to investigate the influence of each of the variables was to set up the model assuming a fixed beach geometry (ie crest width), wave steepness and marsh water level. A large number of tests were then completed to assess the seepage rate under a range of wave height and water level combinations (Figure 3.17). Using this as a basis, the effect of the wave steepness, crest width and marsh water levels on the seepage rate were investigated. These are presented as normalised graphs in Figures 3.19 to 3.21.
The graphical method to predict seepage through the ridge is based on this series of figures. Figure 3.17 shows the predicted model seepage rate for a range of wave and water level conditions with a 'typical’ marsh water level, wave steepness, crest width and ridge permeability. Also plotted on this graph are known historical events where breaching or flooding has occurred. This graph allows a quick, approximate assessment of whether seepage is likely to be a problem and whether conditions are likely to be severe enough for there to be a risk o f a breach or severe flood.
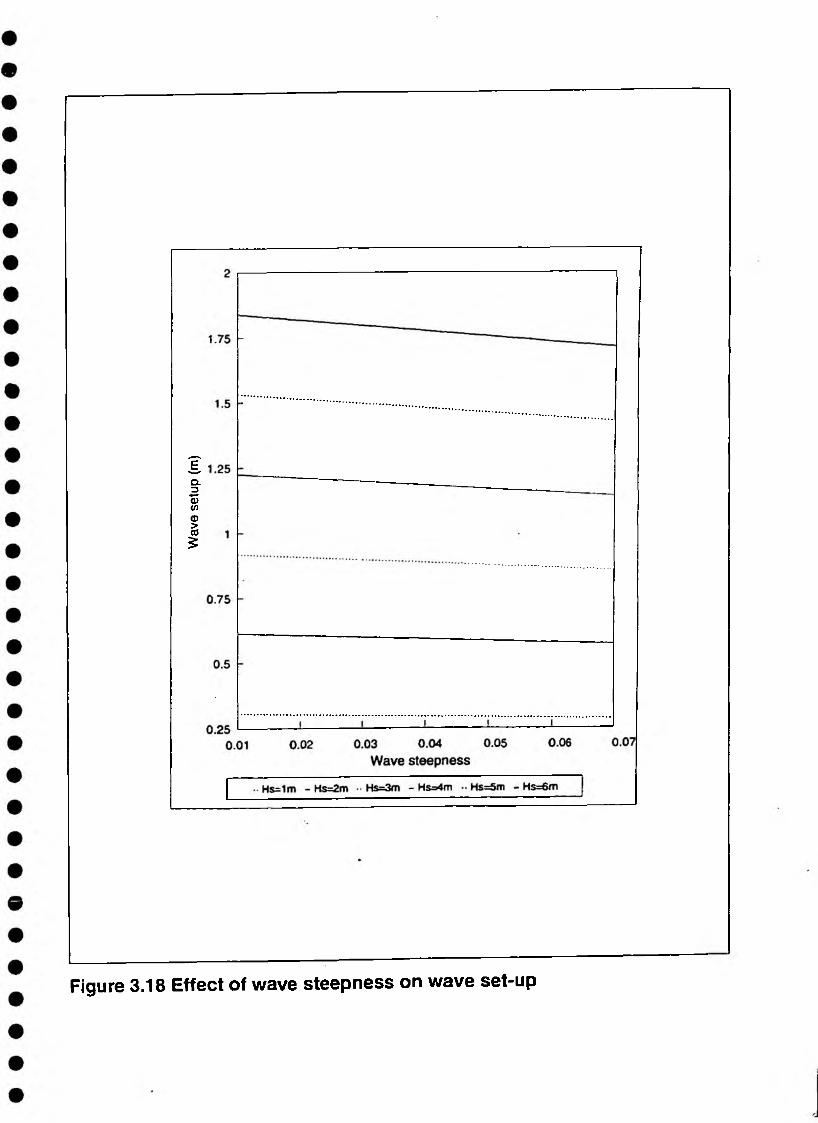
Figure 3.18 is then used to determine the magnitude of the wave set-up, which, when added to the tidal elevation gives the total seaward boundary water elevation used within the model scenario. This value is then used to determine the correction factors defined in Figures 3.19 to 3.21.
From Figures 3.19 to 3.21 the correction factors can be read off directly for each of the remaining variables, ie marsh water level, wave steepness and crest width respectively. Alternatively the factors detailed in Figures 3.18 to 321 can be calculated from the following equations which have been derived from these graphs.
From Figure 3.18, the total sea level is:
TSL = SWL + H$ (0.31 - 0.35s) 3.1
From Figure 3.19, the marsh water level correction parameter, Mp:
JMp = 1 - ({MWL - 1.9) (0.1895 ♦ 0.674 f -L-2-Z^J “ “)) 3.2
From Figure 3.20, the wave steepness correction parameter, Sp:
3.3
Environment Agency. Angtien RegionOperational Investigation M2 9 20/09/96
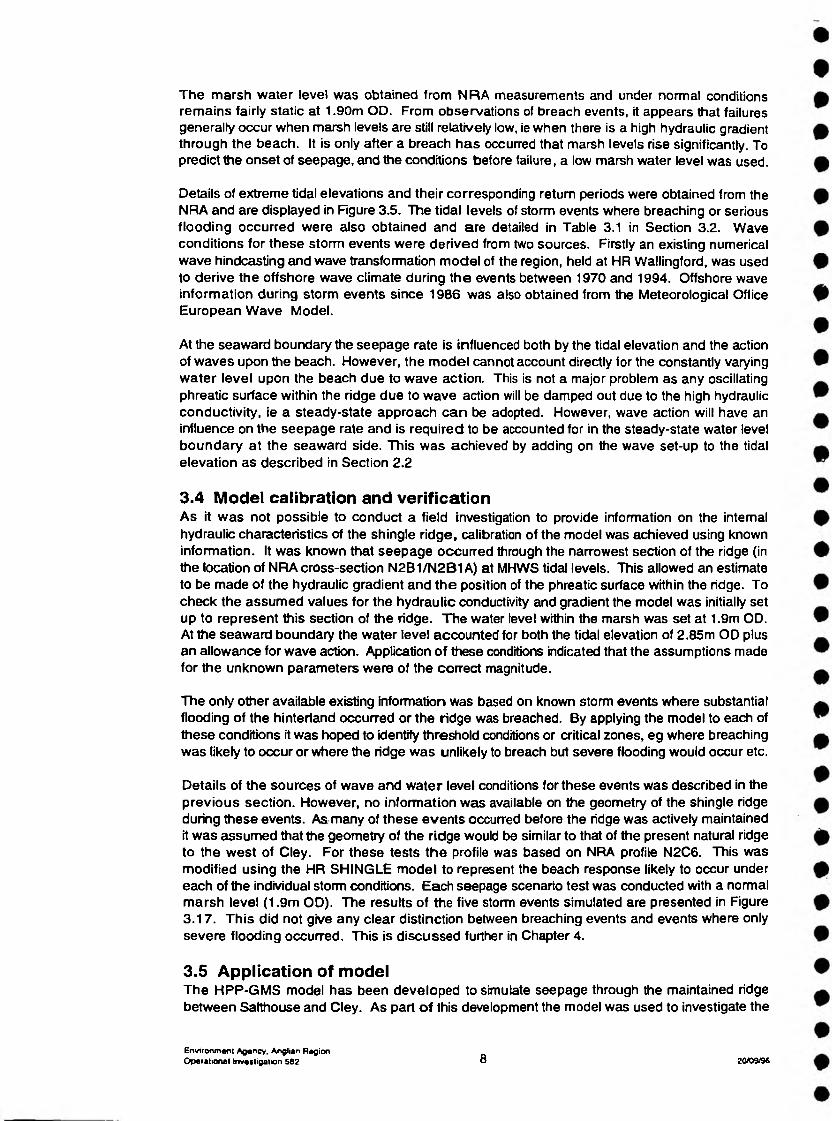
The marsh water level was obtained from NRA measurements and under normal conditions remains fairly static at 1.90m OD. From observations of breach events, it appears that failures generally occur when marsh levels are still relatively low, ie when there is a high hydraulic gradient through the beach. It is only after a breach has occurred that marsh levels rise significantly. To predict the onset of seepage, and the conditions before failure, a low marsh water level was used.
Details of extreme tidal elevations and their corresponding return periods were obtained from the NRA and are displayed in Figure 3.5. The tidal levels of storm events where breaching or serious flooding occurred were also obtained and are detailed in Table 3.1 in Section 3.2. Wave conditions for these storm events were derived from two sources. Firstly an existing numerical wave hindcasting and wave transformation model of the region, held at HR Wallingford, was used to derive the offshore wave climate during the events between 1970 and 1994. Offshore wave information during storm events since 1986 was also obtained from the Meteorological Office European Wave Model.
At the seaward boundary the seepage rate is influenced both by the tidal elevation and the action of waves upon the beach. However, the model cannot account directly for the constantly varying water level upon the beach due to wave action. This is not a major problem as any oscillating phreatic surface within the ridge due to wave action will be damped out due to the high hydraulic conductivity, ie a steady-state approach can be adopted. However, wave action will have an influence on the seepage rate and is required to be accounted for in the steady-state water level boundary at the seaward side. This was achieved by adding on the wave set-up to the tidal elevation as described in Section 2.2
3.4 Model calibration and verificationAs it was not possible to conduct a field investigation to provide information on the internal hydraulic characteristics of the shingle ridge, calibration of the model was achieved using known information. It was known that seepage occurred through the narrowest section of the ridge (in the location of NRA cross-section N2B1/N2B1A) at MHWS tidal levels. This allowed an estimate to be made of the hydraulic gradient and the position of the phreatic surface within the ridge. To check the assumed values for the hydraulic conductivity and gradient the model was initially set up to represent this section of the ridge. The water level within the marsh was set at 1.9m OD. At the seaward boundary the water level accounted for both the tidal elevation of 2.85m OD plus an allowance for wave action. Application of these conditions indicated that the assumptions made for the unknown parameters were of the correct magnitude.
The only other available existing information was based on known storm events where substantial flooding of the hinterland occurred or the ridge was breached. By applying the model to each of these conditions it was hoped to identify threshold conditions or critical zones, eg where breaching was likely to occur or where the ridge was unlikely to breach but severe flooding would occur etc.
Details of the sources of wave and water level conditions for these events was described in the previous section. However, no information was available on the geometry of the shingle ridge during these events. As many of these events occurred before the ridge was actively maintained it was assumed that the geometry of the ridge would be similar to that of the present natural ridge to the west of Cley. For these tests the profile was based on NRA profile N2C6. This was modified using the HR SHINGLE model to represent the beach response likely to occur under each of the individual storm conditions. Each seepage scenario test was conducted with a normal marsh level (1.9m OD). The results of the five storm events simulated are presented in Figure 3.17. This did not give any clear distinction between breaching events and events where only severe flooding occurred. This is discussed further in Chapter 4.
3.5 Application of modelThe HPP-GMS model has been developed to simulate seepage through the maintained ridge between Satthouse and Cley. As part o f this development the model was used to investigate the
Environment Agency, Anglian RegionOperational Investigation 502 8 20/ 09/96
4 Discussion, Conclusions and Recommendations
4.1 DiscussionThe HPP-GMS groundwater model has been set up to allow an estimate of the seepage rate through the shingle ridge between Salthouse and Blakeney. "This has allowed an evaluation of the importance of seepage as a breaching mechanism, it has also enabled an assessment of the sensitivity of the various parameters which affect the seepage rate.
As was discussed in Section 3.2 there are a number of possible failure modes of a shingle ridge such as is found along the Salthouse to Blakeney frontage. The modelling has indicated that seepage is unlikely to be dominantly responsible for breaching of the ridge. Instead seepage mechanisms will act in addition to other mechanisms such as wave overtopping to cause breaching. The relative influence of each of these mechanisms will depend on the particular hydraulic conditions and ridge characteristics at that particular time.
in determining whether a breach will occur, use can be made of Figure 3.17 which indicates that all breaches and severe flood events have occurred during high tidal conditions when larger wave conditions can be experienced closer to the shoreline. It is these more severe wave conditions that are probably the most important factor in determining the severity of the flood event and are likely to be the dominating factor in promoting breaching due to crest cutdown and overtopping. High tidal events, despite having the potential to cause severe flooding of the hinterland, are unlikely to destabilise the ridge and cause breaching if incident wave conditions are not significant.
Establishing critical seepage rates, where failure of the ridge would occur was not possible due to the comptex interaction of different failure mechanisms which in turn depended on the incident conditions at that particular time. Plotting each of the particular historical storm events, where both wave conditions and water levels were known (Figure 3.17) allowed no distinction to be made between events where breaching occurred and events where only severe flooding occurred. Too many other variables, eg exact timing of breach relative to tidal level, wave direction, ridge geometry, marsh water levels etc, are unknown. However, from the figure it is clear that severe flooding and breaching can occur where an offshore wave height of between 3.5 and 4m occurs, (which is less than the one year return period offshore wave height for this region), in combination with a tidal level of above 4m ODt (approximately a three year return period).
The results from the model stress the importance of maintaining as wide a beach crest as possible, to reduce both the seepage rate and maintain the stability of the ridge. However, the limited supply of sediment and the tendency for drawdown of the ridge during storm conditions leave little scope for improvement of the natural defence without substantial capital investment. Instead, the model can be used to improve flood warning events. Positive surge levels can be estimated a couple of days in advance, and from knowing the probable water levels an estimate can be made based on weather conditions and wind patterns as to whether wave conditions will be of a sufficient magnitude (and occurring in an onshore direction) to promote severe flooding or breaching.
From Figures 3.19 to 3.21 the relative influence of the various parameters which affect the seepage rate can be seen. Perhaps the most important in influencing the seepage rate is the marsh water level, with the rate reducing significantly as water levels in the marsh increase. This can explain, why after a breach does occur, further breaching at other sections of the ridge does not appear to occur. The crest width does have some effect on the seepage rate, but not as much as would be expected. It is considered that this is a limitation of the model and that the seepage rate in reality would increase more exponentially as the crest width decreases. As the crest width decreases the wave effect, which is only approximated within the model, becomes more significant. This is discussed in the next paragraph.
The use of a steady-state approximation at the seaward water level boundary appears to be satisfactory for estimating the seepage rate under most conditions. Where it becomes less reliable
Environment Agency. Asigtian RegionOperational Investigation 582 11 20/09/96
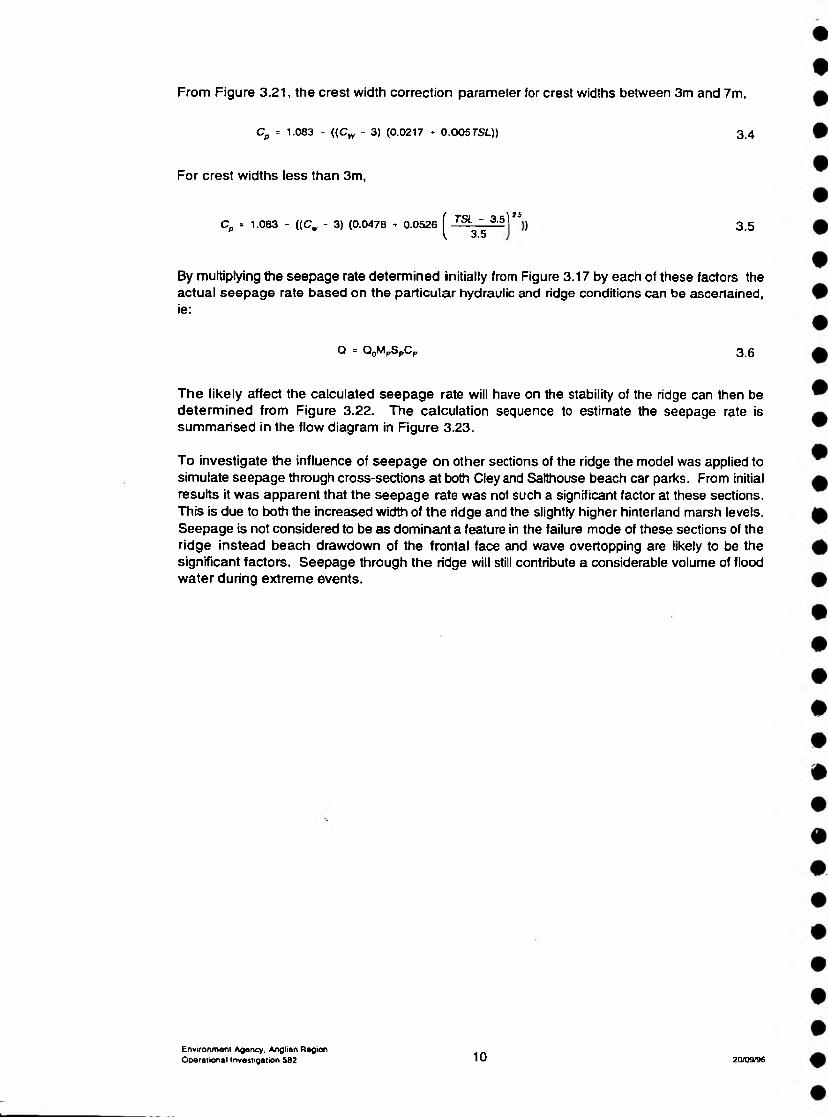
From Figure 3.21, the crest width correction parameter for crest widths between 3m and 7m,
Cp - 1.083 - ((C * - 3) (0.0217 ♦ 0.00575/-)) 3.4
For crest widths less than 3m,
Cp = 1.083 - ((C„ - 3) (0.0478 - 0.0526 ( TSL - 3.5) “ j3.5 3.5
By multiptying the seepage rate determined initially from Figure 3.17 by each of these factors the actual seepage rate based on the particular hydraulic and ridge conditions can be ascertained, ie:
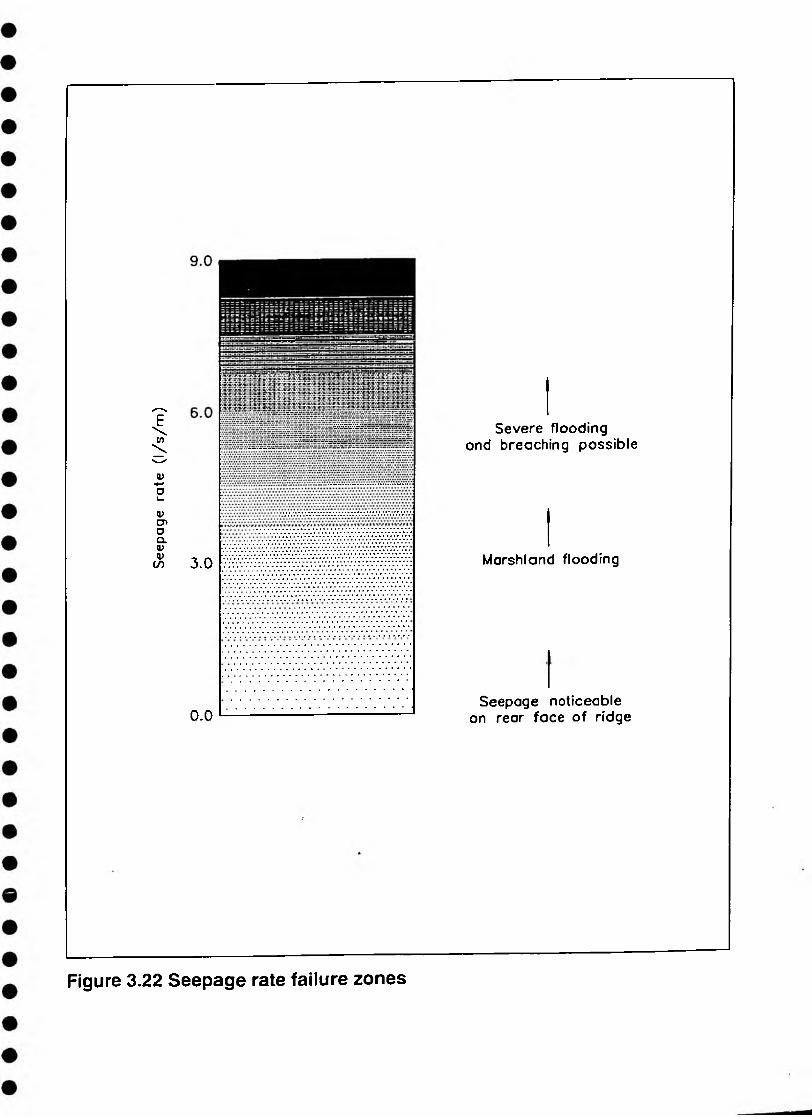
The likely affect the calculated seepage rate will have on the stability of the ridge can then be determined from Figure 3.22. The calculation sequence to estimate the seepage rate is summarised in the flow diagram in Figure 3.23.
To investigate the influence of seepage on other sections of the ridge the model was applied to simulate seepage through cross-sections at both Cley and Satthouse beach car parks. From initial results it was apparent that the seepage rate was not such a significant factor at these sections. This is due to both the increased width of the ridge and the slightly higher hinterland marsh levels. Seepage is not considered to be as dominant a feature in the failure mode of these sections of the ridge instead beach drawdown of the frontal face and wave overtopping are likely to be the significant factors. Seepage through the ridge will still contribute a considerable volume of flood water during extreme events.
Q = QnMpSpC,iQlVlpOplsp 3.6
Environment Agency, Anglian RegionOperational Investigation 502 10 20/09/96
%
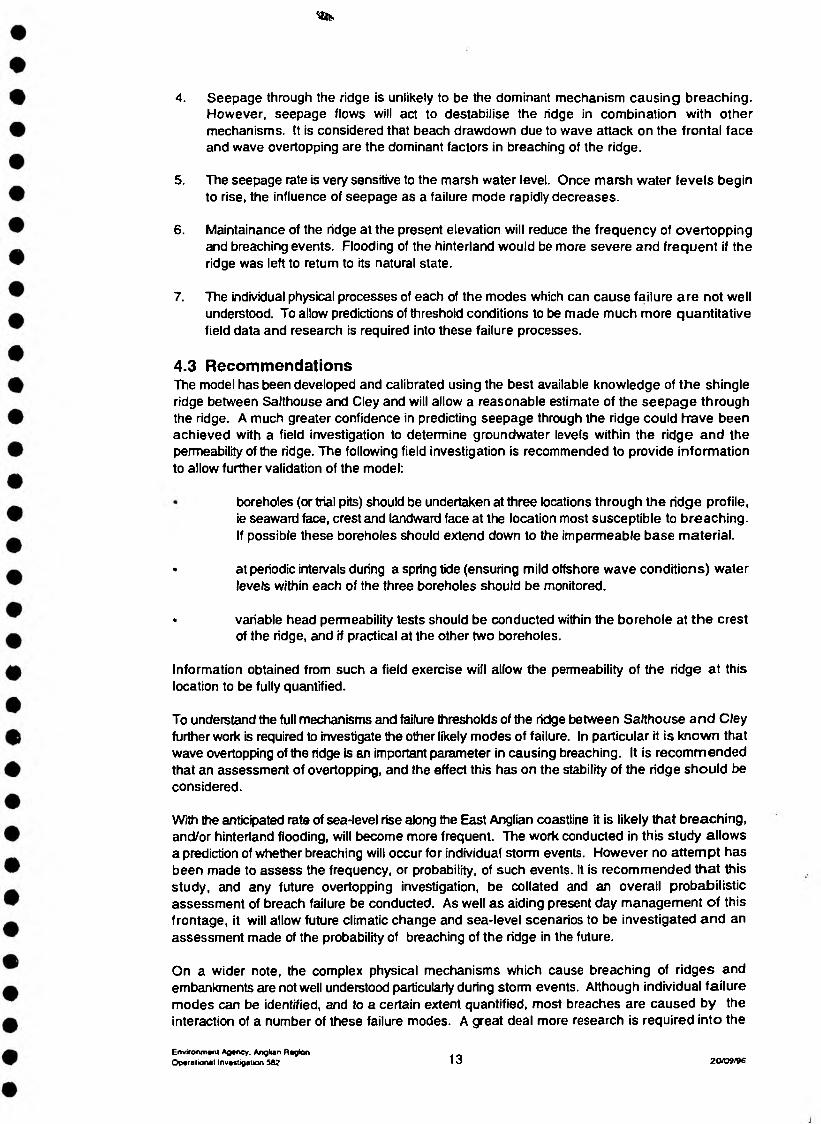
4. Seepage through the ridge is unlikely to be the dominant mechanism causing breaching. However, seepage flows will act to destabilise the ridge in combination with other mechanisms, It is considered that beach drawdown due to wave attack on the frontal face and wave overtopping are the dominant factors in breaching of the ridge.
5. The seepage rate is very sensitive to the marsh water level. Once marsh water levels begin to rise, the influence of seepage as a failure mode rapidly decreases.
6. Maintainance of the ridge at the present elevation will reduce the frequency of overtopping and breaching events. Flooding of the hinterland would be more severe and frequent if the ridge was left to return to its natural state.
7. The individual physical processes of each of the modes which can cause failure are not well understood. To allow predictions of threshold conditions to be made much more quantitative field data and research is required into these failure processes.
4.3 RecommendationsThe model has been developed and calibrated using the best available knowledge of the shingle ridge between Salthouse and Cley and will allow a reasonable estimate of the seepage through the ridge. A much greater confidence in predicting seepage through the ridge could have been achieved with a field investigation to determine groundwater levels within the ridge and the permeability of the ridge. The following field investigation is recommended to provide information to allow further validation of the model:
boreholes (or trial pits) should be undertaken at three locations through the ridge profile, ie seaward face, crest and landward face at the location most susceptible to breaching. If possible these boreholes should extend down to the impermeable base material.
• at periodic intervals during a spring tide (ensuring mild offshore wave conditions) water levels within each of the three boreholes should be monitored.
• variable head permeability tests should be conducted within the borehole at the crest of the ridge, and if practical at the other two boreholes.
Information obtained from such a field exercise will allow the permeability of the ridge at this location to be fully quantified.
To understand the full mechanisms and failure thresholds of the ridge between Salthouse and Cley further work is required to investigate the other likely modes of failure. In particular it is known that wave overtopping of the ridge is an important parameter in causing breaching. It is recommended that an assessment of overtopping, and the effect this has on the stability of the ridge should be considered.
With the anticipated rate of sea-level rise along the East Anglian coastline it is likely that breaching, and/or hinterland flooding, will become more frequent. The work conducted in this study allows a prediction of whether breaching will occur for individual storm events. However no attempt has been made to assess the frequency, or probability, of such events. It is recommended that this study, and any future overtopping investigation, be collated and an overall probabilistic assessment of breach failure be conducted. As well as aiding present day management of this frontage, it will allow future climatic change and sea-level scenarios to be investigated and an assessment made of the probability of breaching of the ridge in the future.
On a wider note, the complex physical mechanisms which cause breaching of ridges and embankments are not well understood particularly during storm events. Although individual failure modes can be identified, and to a certain extent quantified, most breaches are caused by the interaction of a number of these failure modes. A great deal more research is required into the
Environment Agency. Anglian RegionOperational Investigation 582 13 20/09/96
,-5S!
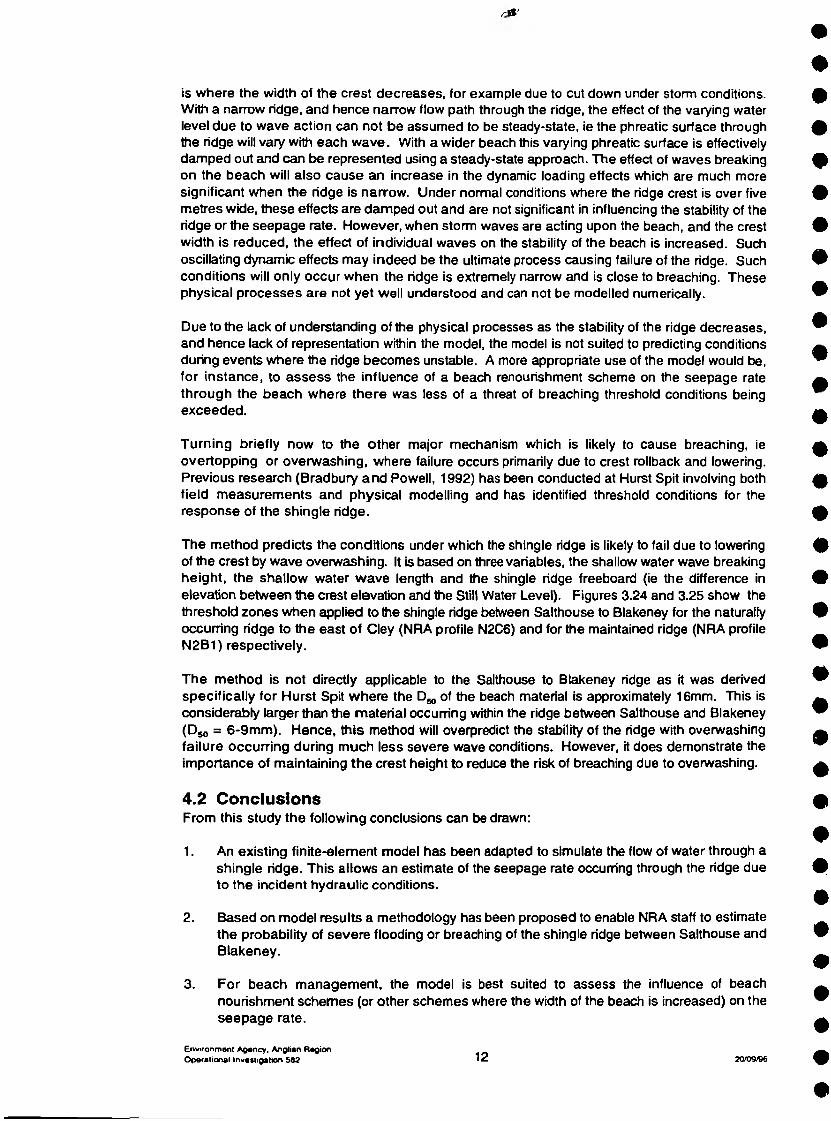
is where the width of the crest decreases, for example due to cut down under storm conditions. With a narrow ridge, and hence narrow flow path through the ridge, the effect of the varying water level due to wave action can not be assumed to be steady-state, ie the phreatic surface through the ridge will vary with each wave. With a wider beach this varying phreatic surface is effectively damped out and can be represented using a steady-state approach. The effect of waves breaking on the beach will also cause an increase in the dynamic loading effects which are much more significant when the ridge is narrow. Under normal conditions where the ridge crest is over five metres wide, these effects are damped out and are not significant in influencing the stability of the ridge or the seepage rate. However, when storm waves are acting upon the beach, and the crest width is reduced, the effect of individual waves on the stability of the beach is increased. Such oscillating dynamic effects may indeed be the ultimate process causing failure of the ridge. Such conditions will only occur when the ridge is extremely narrow and is close to breaching. These physical processes are not yet well understood and can not be modelled numerically.
Due to the lack of understanding of the physical processes as the stability of the ridge decreases, and hence lack of representation within the model, the model is not suited to predicting conditions during events where the ridge becomes unstable. A more appropriate use of the model would be, for instance, to assess the influence of a beach renourishment scheme on the seepage rate through the beach where there was less of a threat of breaching threshold conditions being exceeded.
Turning briefly now to the other major mechanism which is likely to cause breaching, ie overtopping or overwashing, where failure occurs primarily due to crest rollback and lowering. Previous research (Bradbury and Powell, 1992) has been conducted at Hurst Spit involving both field measurements and physical modelling and has identified threshold conditions for the response of the shingle ridge.
The method predicts the conditions under which the shingle ridge is likely to fail due to lowering of the crest by wave overwashing. It is based on three variables, the shallow water wave breaking height, the shallow water wave length and the shingle ridge freeboard (ie the difference in elevation between the crest elevation and the Still Water Level). Figures 3.24 and 3.25 show the threshold zones when applied to the shingle ridge between Salthouse to Blakeney for the naturally occurring ridge to the east of Cley (NRA profile N2C6) and for the maintained ridge (NRA profile N2B1) respectively.
The method is not directly applicable to the Salthouse to Btakeney ridge as it was derived specifically for Hurst Spit where the Dw of the beach material is approximately 16mm. This is considerably larger than the material occurring within the ridge between Salthouse and Blakeney (D50 = 6*9mm). Hence, this method will overpredict the stability of the ridge with overwashing failure occurring during much less severe wave conditions. However, it does demonstrate the importance of maintaining the crest height to reduce the risk of breaching due to overwashing.
4.2 ConclusionsFrom this study the following conclusions can be drawn:
1. An existing finite-element model has been adapted to simulate the flow of water through a shingle ridge. This allows an estimate of the seepage rate occurring through the ridge due to the incident hydraulic conditions.
2. Based on model results a methodology has been proposed to enable NRA staff to estimate the probability of severe flooding or breaching of the shingle ridge between Salthouse and Blakeney.
3. For beach management, the model is best suited to assess the influence of beach nourishment schemes (or other schemes where the width of the beach is increased) on the seepage rate.
Environment Agency. Anglian RegionOperational investigation 562 12 20/09/B6

5 Acknowledgements
The Project Leader is Richard Nunn and the Budget Manager is Robert Runcie both of Environment Agency Anglian Region. The assistance provided by Stan Jeavons at Anglian Environment Agency Norwich office is gratefully acknowledged.
The project is under the management of Douglas Ramsay of HR Wallingford. The main author was Douglas Ramsay with contributions from Charles Reeve and Marco Cesare. Charles Reeve provided important guidance to the report and to the direction of the project. The authors would also like to thank Keith Powell (HR) for reviewing and commenting on the text.
Environment Agency, Anglian RegionOpera! tonal Investigainn 502 15 2CV09/96
interaction and relative influence of each of these modes before confident predictions of failure thresholds can be provided.
Environmem Agency. Anglian RegionOperational Investigation 582 14 20/09/96

Figures
Environment Agency. Anglian Region Opmationat Investigation 582
20/09/96
6 References
Anglian Water Authority, (1976) Report on site investigation for sea defence feasibility study.
Bradbury, A.P., and Powell, K.A. (1992) The short term profile response of shingle spits to storm wave action. Int. Conf. on Coastal Engineering. Ch. 206, 2694-2707.
HR Wallingford and Sir William Halcrow & Partners, (1993) Risk assessment for sea and tidal defence schemes. First technical progress report. Report No. 459/2/Y.
Jeavons, S. (1995) Pers. Comm.
Powell, K.A., (1990) Predicting short term profile response for shingle beaches. HR Wallingford Report SR 219.
Environment Agency, Anglian RegionOperational Investigation 562 16 20/09/96
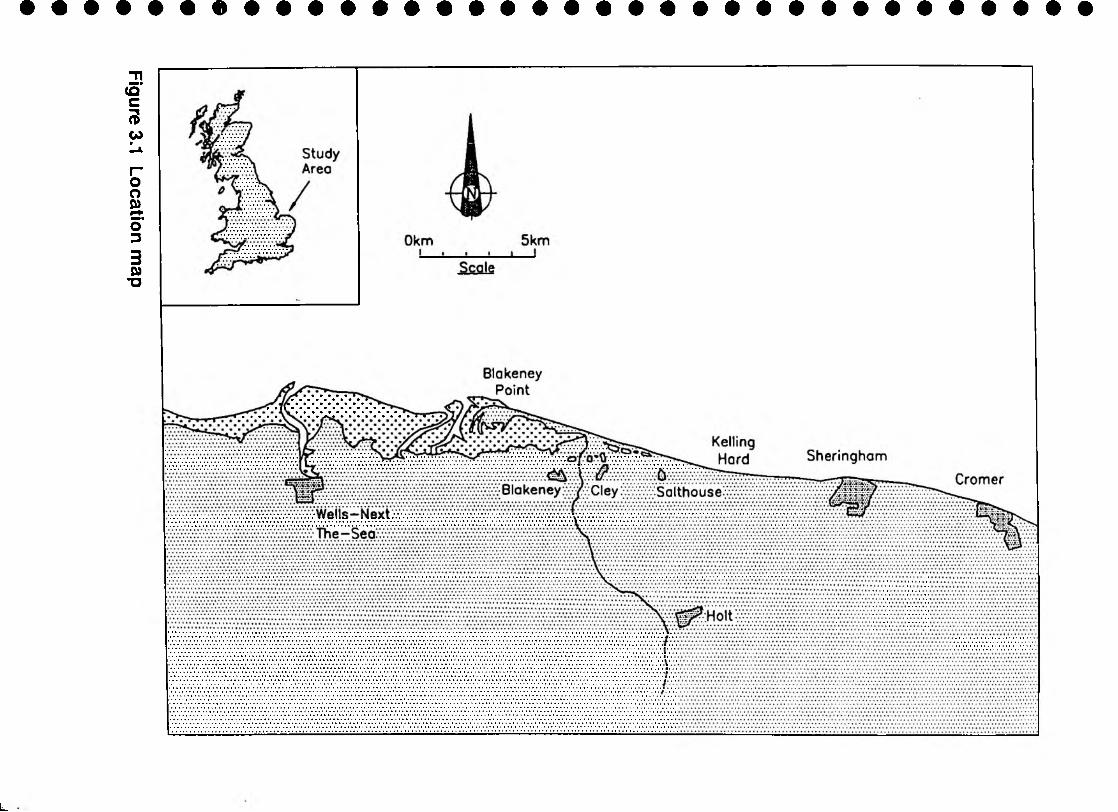
Figure 3.1
Location m
ap
L
Figure 3.4
Natural shingle ridge
west of Cley beach
car park
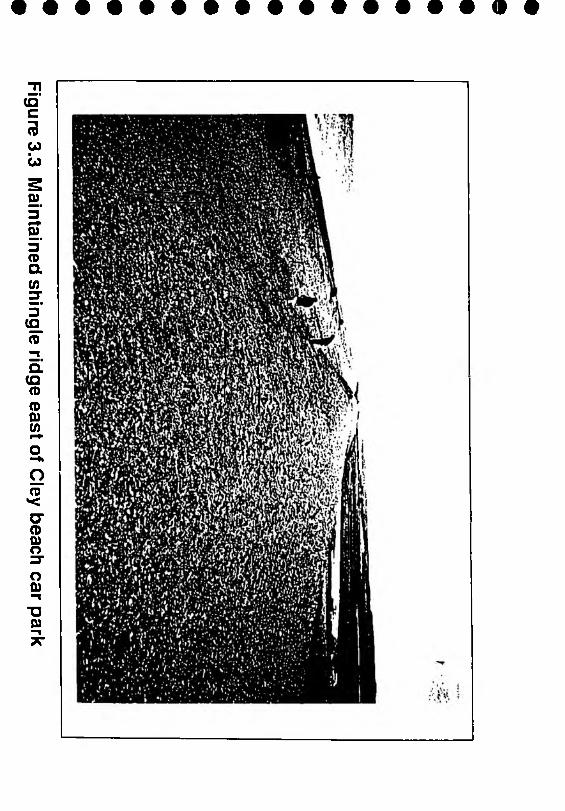
Figure 3.3
Maintained
shingle ridge
east of Cley beach
car park
4» •
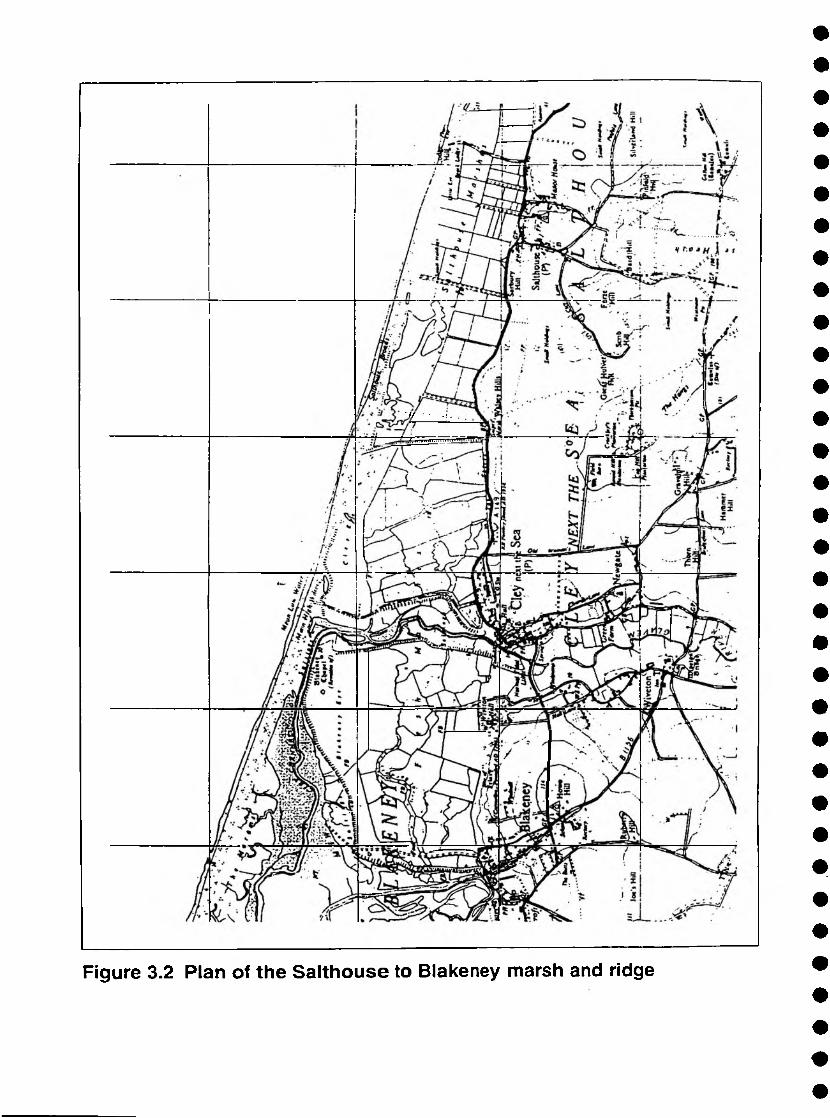
Figure 3.2 Plan of the Salthouse to Blakeney marsh and ridge
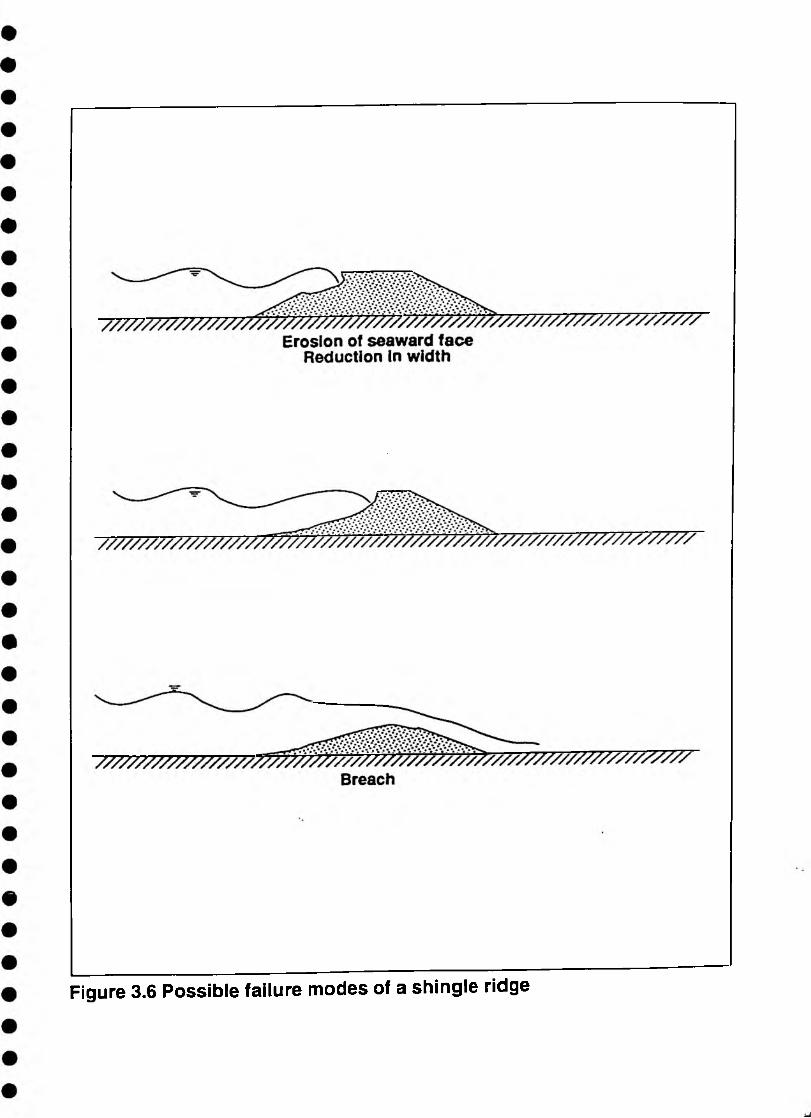
Figure 3.6 Possible failure modes of a shingle ridge
ca0)° i
■oo ' k_ CD
CLCt—3qJ£E
in to
(N Q O w ) S||0M IB |9A9| |Bp!l
Figure 3.5 Estimated tidal levels at Wells and known extreme tidal events
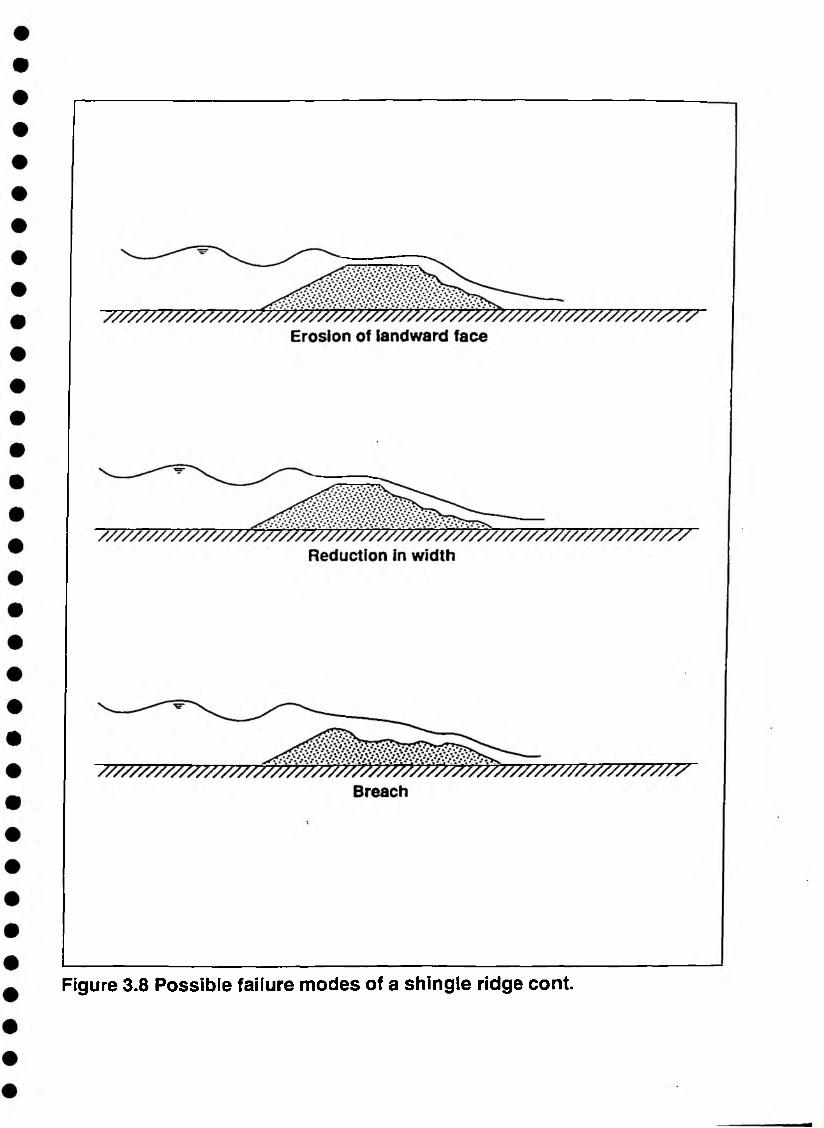
Figure 3.8 Possible failure modes of a shingle ridge cont.
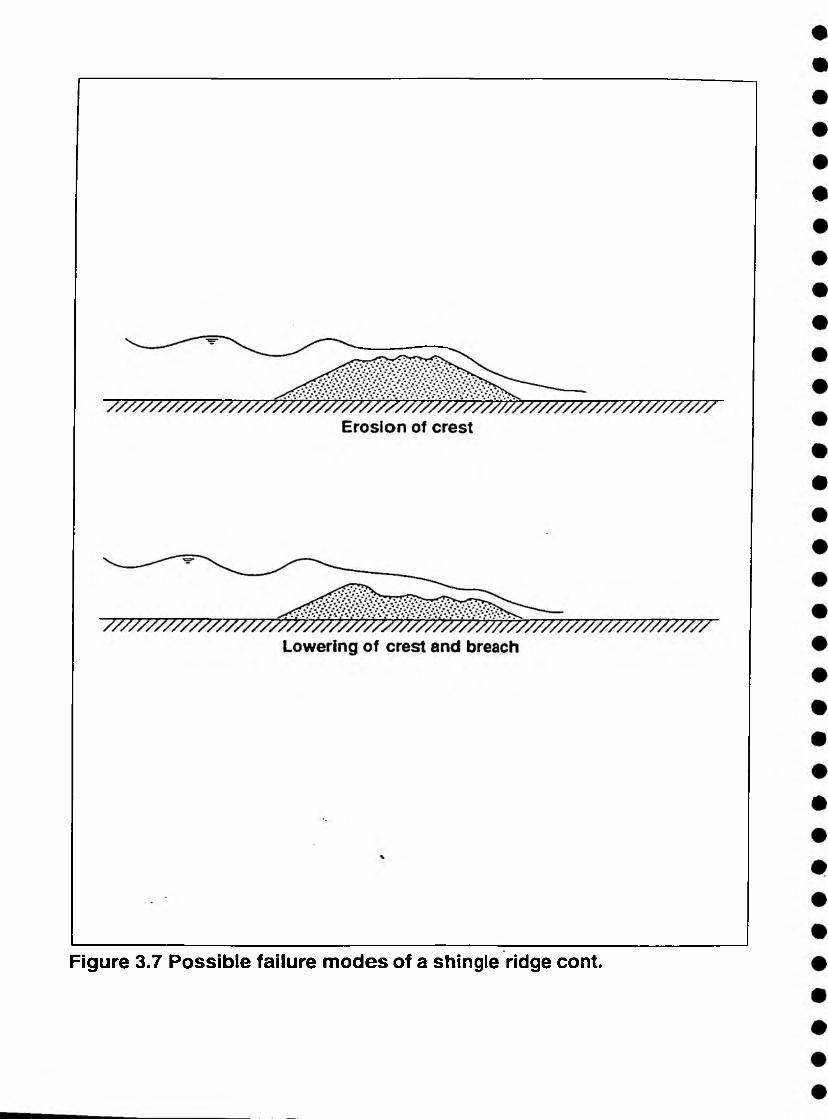
Figure 3.7 Possible failure modes of a shingle ridge cont.
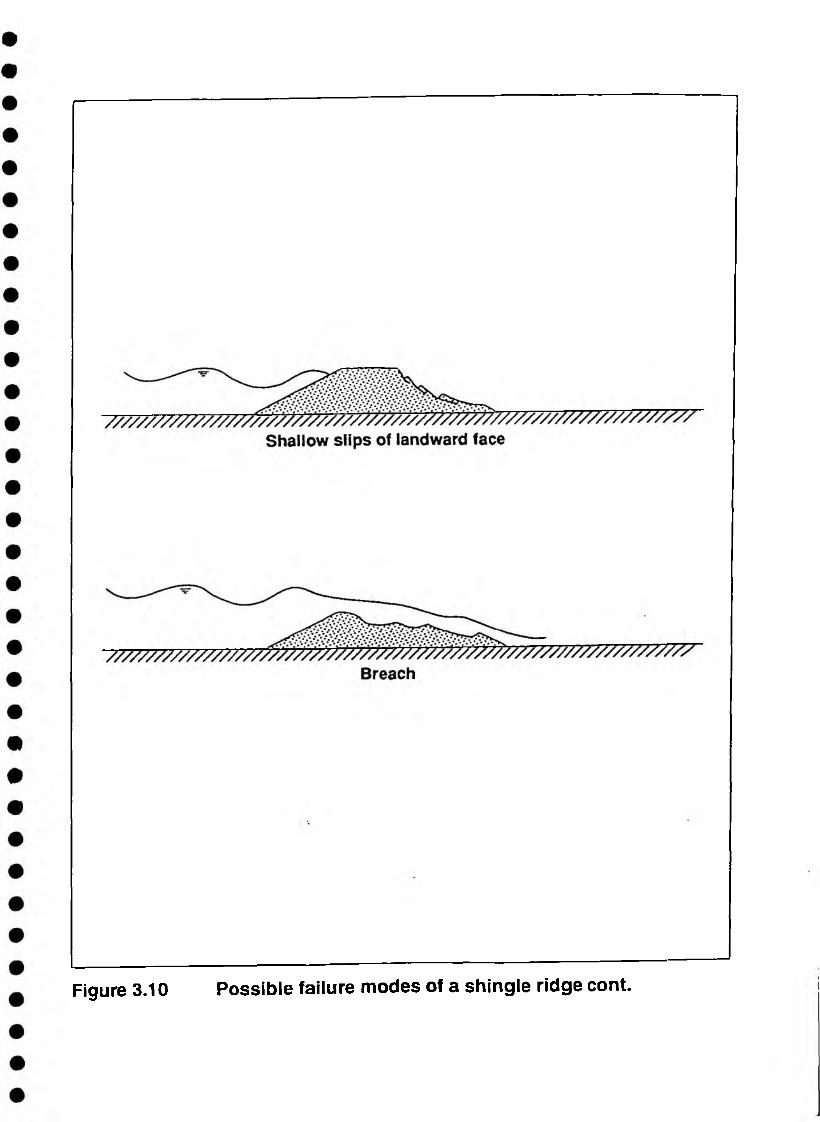
Figure 3.10 Possible failure modes of a shingle ridge cont.
Seepage through internal layer
///////////////////////////////y ////7 //7 7 7 7 /////////////y /7 7 ///7 7 7 7 7 7 //Internal erosion
Piping
Breach
Figure 3.9 Possible failure modes of a shingle ridge cont.
pervious layer
Seepage under embankment
pervious layer
Undermining of toe
'7 ///////////////S 7 7pervious layer
Slip failure
pervious layer
Breach
Figure 3.12 Possible failure modes of a shingle ridge cont.
777777777777777777777pervious layer
Slip failure
pervious layer
Breach
Figure 3.11 Possible failure modes of a shingle ridge cont.
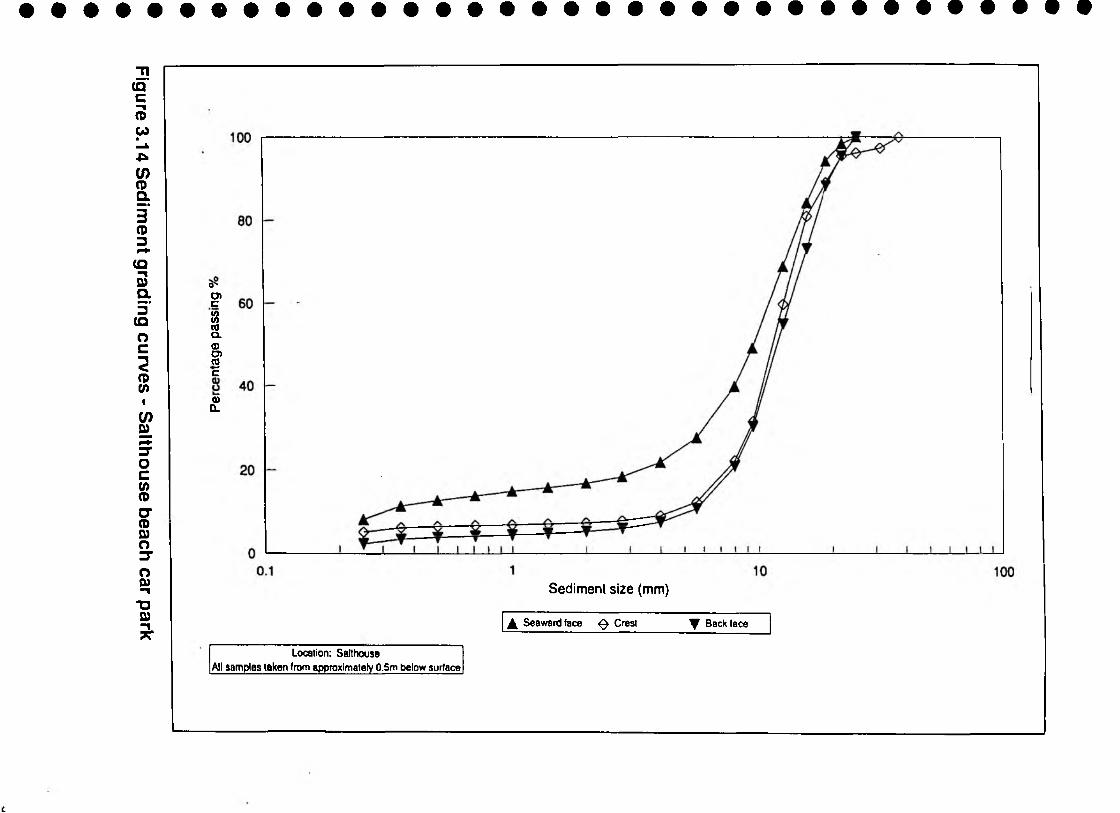
Figure 3.14
Sediment grading
curves - Salthouse
beach car park
O''O)c8<0Q.ffiO)tgc
Q>CL
Sediment size (mm)
A Seaward face 0 Crest ^ Back face
Location: Satthouse All samples taken from approximately O.Sm below surface
t
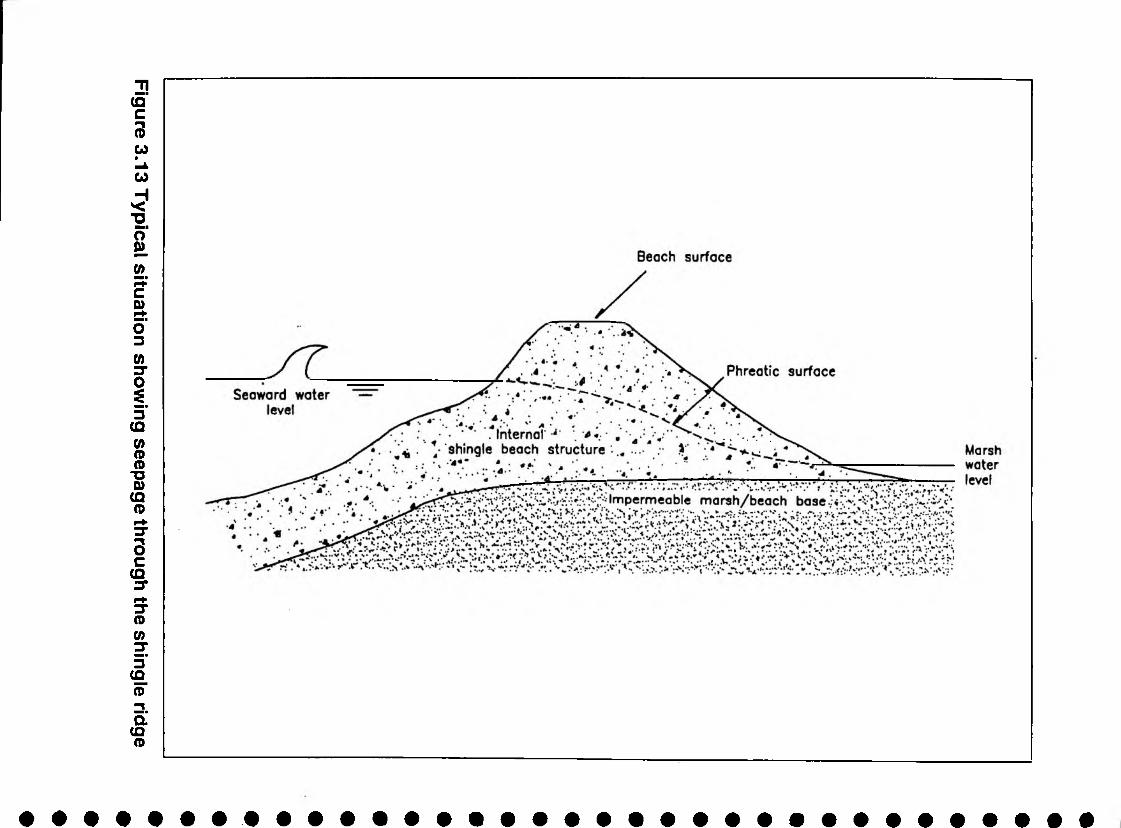
Figure 3.13
Typical situation showing
seepage through
the shingle
ridge
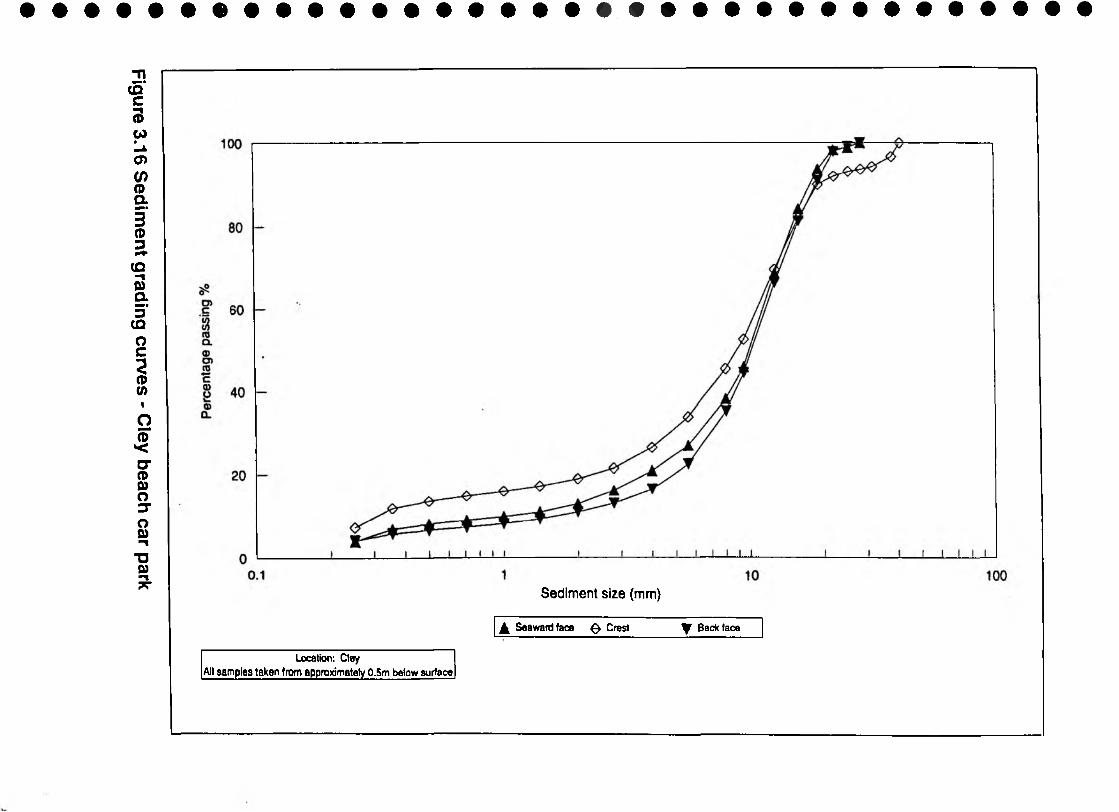
Figure 3.16
Sediment grading
curves - Cley
beach car park
Sediment size (mm)
A Seaward face 0 Crest y Back face
Location: Cley All samples taken from approximately 0.5m below surface
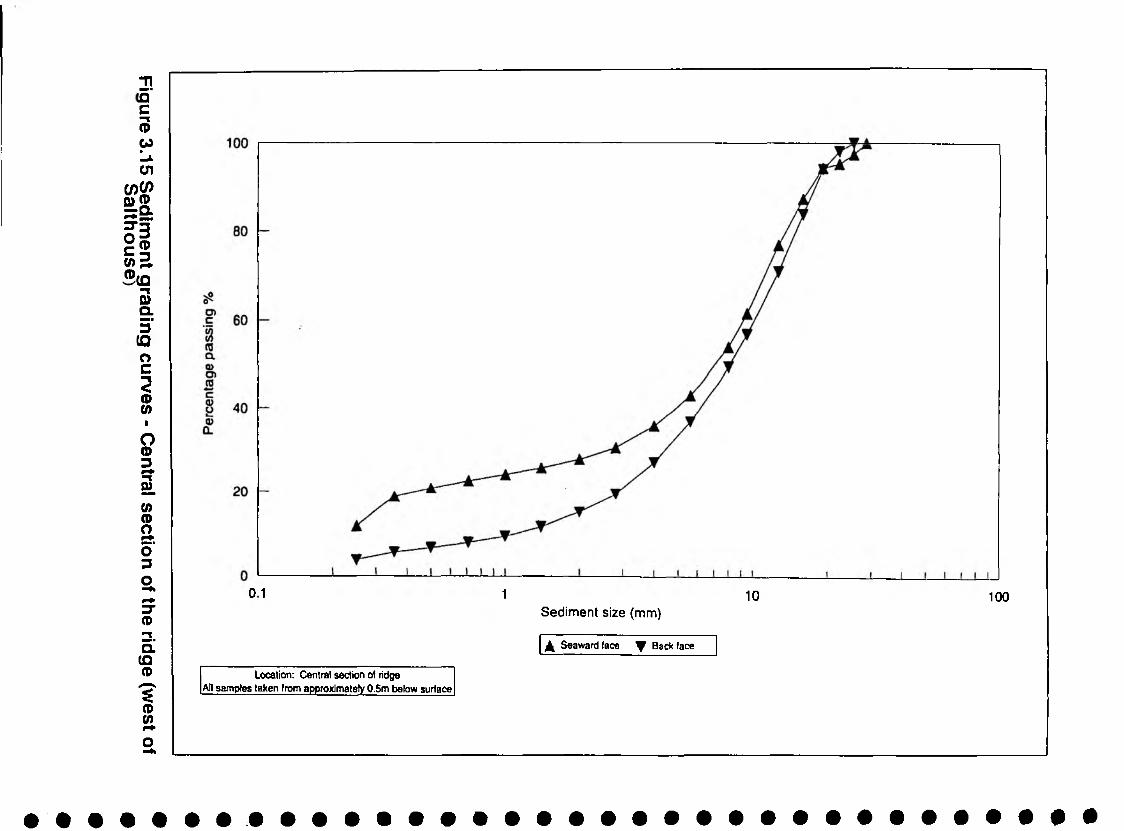
Figure 3.15
Sediment grading
curves • Central section
of the ridge
(west of Salthouse)
01 1 10 100Sediment size (mm)
A Seaward (ace ^ Back face
Location: Central section of ridge All samples laken from approximately O.Sm below surface
Wav
e se
tup
(m)
Figure 3.18 Effect of wave steepness on wave set-up
Ii
(lu) il|6|8L| a ABM lUEOjJIUfrs 8JOL|SU0
ooE Iw c0) o5 Otoo(0 2a5 O> ai0) <0Q.k_ aa> aCO3
Figure 3.17 The effect of offshore wave height and tidal water elevation on the seepage rate
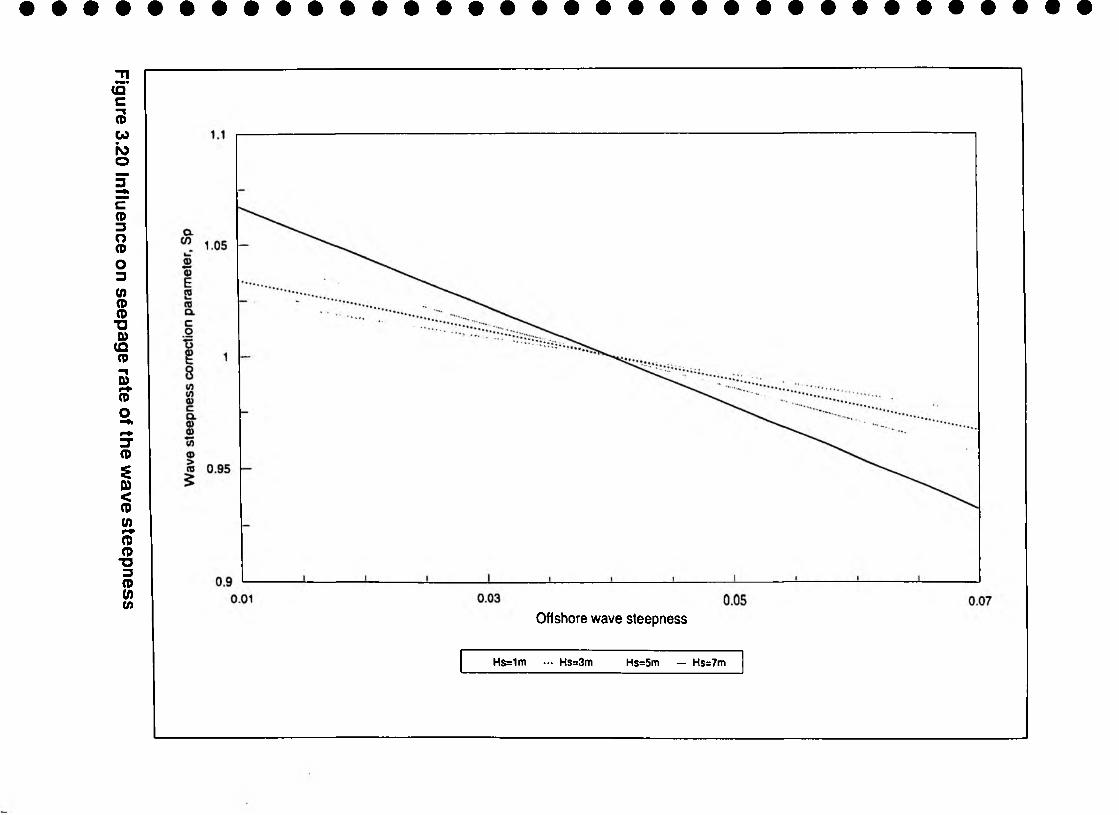
Figure 3.20
Influence on
seepage rate
of the wave
steepness
Offshore wave steepness
Hs=1m ... Hs=3m Hs=5m — Hs=7m
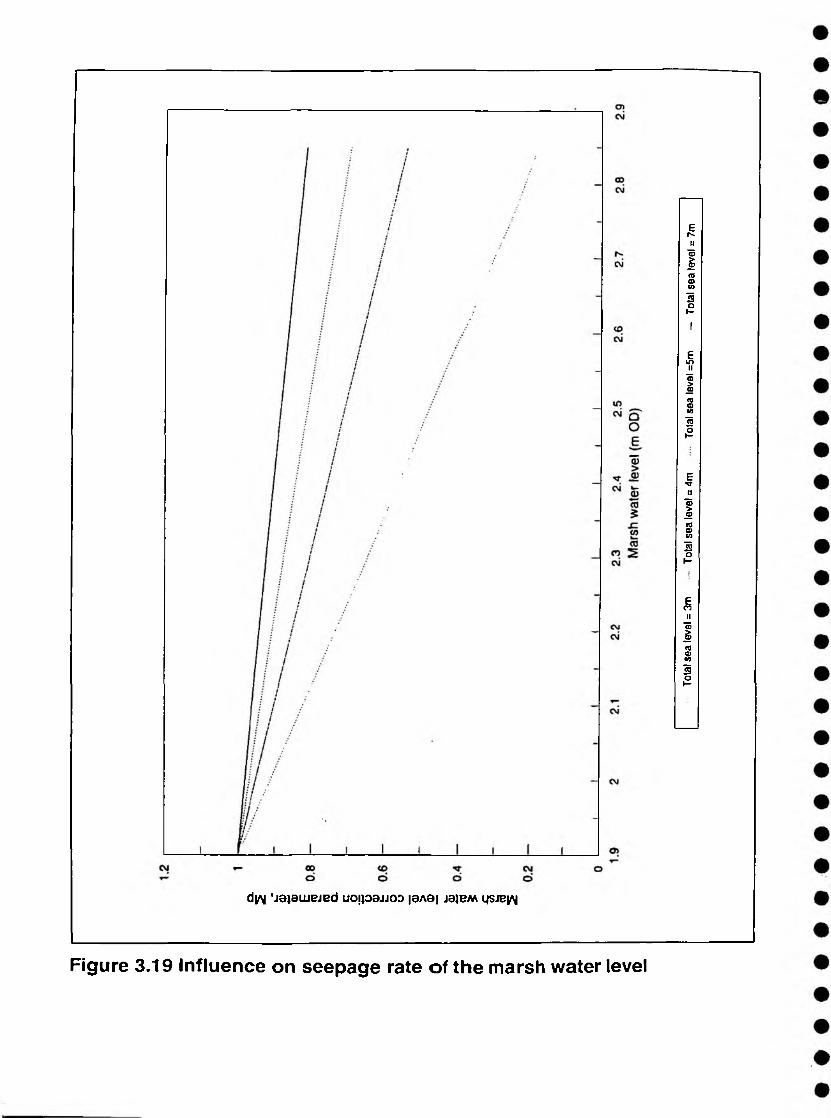
dyy ‘jajaiuejed uojpauoo |OAai jbjbm gsje^
Figure 3.19 Influence on seepage rate of the marsh water level
Tota
l sea
level
= 3m
Tota
l sea
level
= 4m
Tota
l sea
level
=5m
— To
tal s
ea lev
el =
7m
Seep
age
rate
(l
/s/m
)
3 .0
0.0
Severe flood ing and breaching possible
Marshland flood ing
Seepage noticeable on rear face o f ridge
Figure 3.22 Seepage rate failure zones
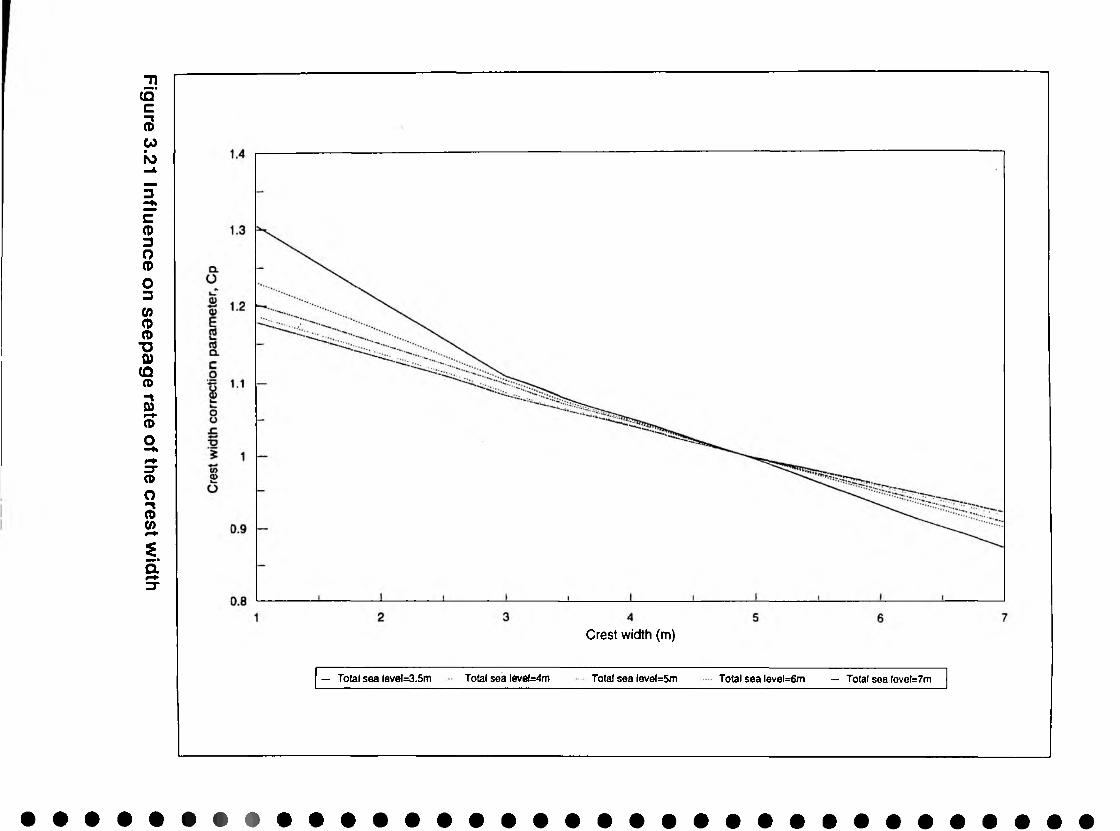
Figure 3.21
Influence on
seepage rate
of the crest w
idth
Crest width (m)
— Total sea level=3.5m Total sea leveMm Total sea level=5m Total sea level=6m — Total sea fevel=7m
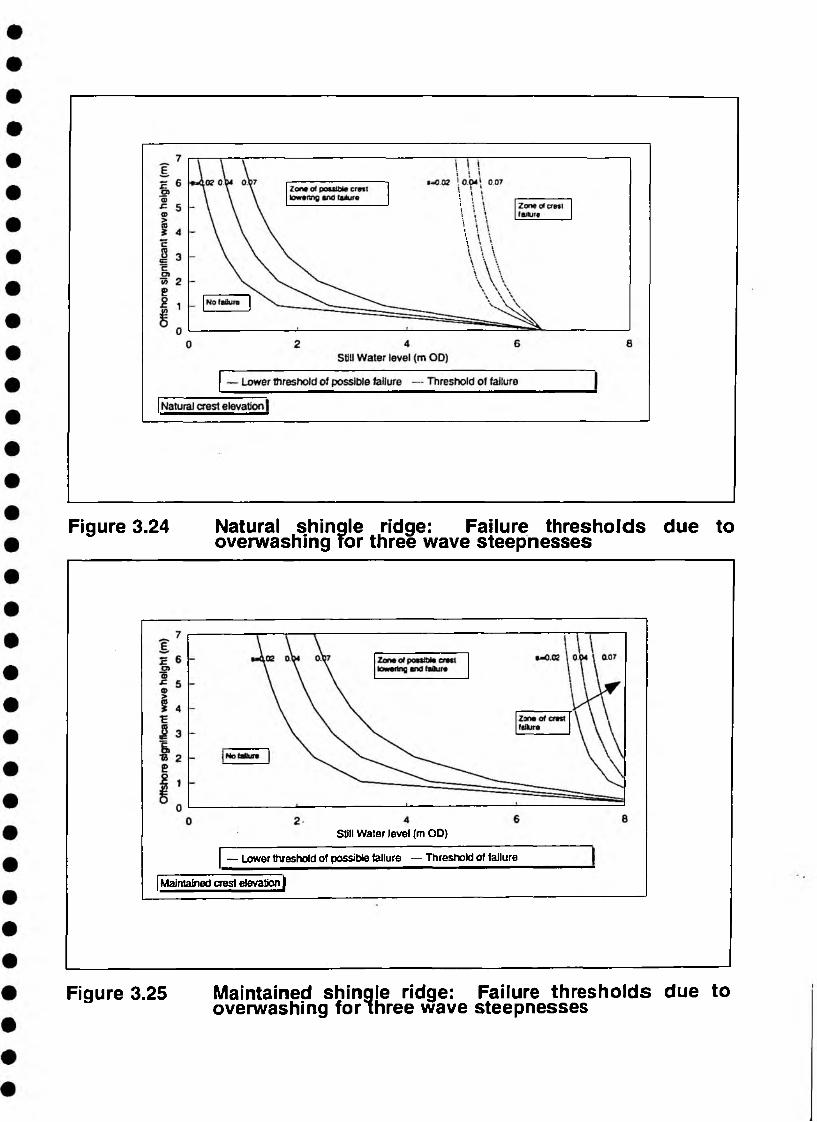
Figure 3.24 Natural shingle ridge: Failure thresholds due tooverwashing Tor three wave steepnesses
Still Water level (mOD)
— Lower threshold of possible failure — Threshold of failure
Maintained crest elevation |
Figure 3.25 Maintained shingle ridge: Failure thresholds due tooverwashing for three wave steepnesses
HsWater level
Wave steepness
Marsh water level
Wave steepness
Crest width
Equation 3.1
Equation 3.2
Equation 3.3
Equation 3.4 or equation 3.5
Equation 3.6
Figure 3.23 Flow diagram to calculate seepage through the shingle ridge

MANAGEMENT AND CONTACTS:The Environment Agency delivers a service to its customers, w ith the emphasis on authority and accountability at the most local level possible. It aims to be cost-effective and efficient and to offer the best service and value for money.
Head Office is responsible for overall policy and relationships w ith national bodies including government.
Rivers House, Waterside Drive, Aztec West, Almondsbury, Bristol BS12 4UD Tel: 01454 624 400 Fax: 01454 624 409
E N V IR O N M E N T AGENCY ANGLIAN Kingfisher House Goldhay Way Orton Goldhay Peterborough PE2 5ZR Tel: 01733 371 81 1 Fax: 01733 231 840
N ORTH EAST Rivers House 21 Park Square South Leeds LSI 2QG Tel: 0113 244 0191 Fax: 0113 246 1889
N ORTH WEST Richard Fairclough House Knutsford Road Warrington WA4 1 HG Tel: 01925 653 999 Fax: 01925 415 961
MIDLANDSSapphire East 550 Streetsbrook Road Solihull B91 1QT Tel: 0121 71 1 2324 Fax: 0121 711 5824
R E G IO N A L O F F IC E S SOUTHERN Guildbourne House Chatsworth Road WorthingWest Sussex BN11 1 LD Tel: 01903 820 692 Fax: 01903 821 832
SOUTH WEST Manley House Kestrel Way Exeter EX2 7LQ Tel: 01392 444 000 Fax: 01392 444 238
THAMESKings Meadow House Kings Meadow Road Reading RG1 8DQ Tel: 01734 535 000 ^Fax: 01734 500 388
WELSHRivers House/Plas-yr-Afon St. Mellons Business Park St. Mellons >Cardiff CF3 0LT Tel: 01222 770 088 *Fax: 01222 798 555
f South West
The 24-hour emergency hotline number for reporting all environmental incidents relating to air, land and water
E N V I R O N M E N T A G E N C Y E M E R G E N C Y H O T L I N E
0800 80 70 60E n v ir o n m e n tA g e n c y
Printed on Cydus - a 100% recycled TCF paper