Embed Size (px)
Citation preview
114 Telektronikk 1.2008
1 IntroductionIn recent times, the design of many real-world appli-cations has changed from a monolithic structure tomodular, yet highly customizable services. As animplementation from scratch is usually too time-consuming and expensive, these services are super-imposed on an already existing underlay infrastruc-ture as an overlay.
A well-known example arises in logistics. The high-ways and streets we use every day constitute a hugetransport network. However, traffic in this network isfar from structured. In fact, countless companies andinstitutions rely on this network to accomplish theirregular shipping of commodities and services, andby doing so they cause the traffic on the road networkto develop in certain patterns. In technical terms theroad network constitutes an underlay network whilethe commodity exchange network of a set of compa-nies implicitly building upon this network forms anoverlay network. The overlay network uses the under-lay to actually realize its tasks.
Another underlay network of prime interest is theInternet, which serves as the workhorse of countlessdata transfers, multimedia services and file sharingprotocols. Almost any time we use the Internet, weparticipate in some overlay network that uses thephysical Internet (comprised of routers, links, cables,wires) to actually convey the data packets. Interest-ingly, the Internet itself is an overlay built over thetelephone network underlay. Within the Internet, aparticular breed of overlays that has received a lot ofattention lately are peer-to-peer (P2P) applications[17], which range from file-sharing systems likeGnutella and Bittorrent, to real-time multimedia
streaming, and VoIP phone systems like Skype andGoogleTalk.
Clearly, there is a crucial interdependence betweenoverlay and underlay networks. In particular, theemergence of overlay networks heavily affects andposes new requirements on the underlay. The majoradvantage of overlays is that they provide high-levelfunctionality while masking the intrinsic complexityof the underlay structure. However, this abstractionentails a certain trade-off, namely independence ver-sus performance. To gain a deeper understanding ofthe interdependency between the overlay and theunderlay, this trade-off needs to be included in thecorresponding analysis.
Due to the explosive growth of P2P file sharing appli-cations with respect to total Internet traffic [17], therehas been an unprecedented interest in their analysis[1, 2, 15]. There have also been attempts at investi-gating the overlay-underlay correlations in P2P sys-tems. Using game theoretic models, Liu et al. studiedin [10] the interaction between overlay routing andtraffic engineering within an Autonomous System(AS), which is a network under a single administra-tive entity, normally corresponding to an Internet Ser-vice Provider (ISP). An analysis of routing aroundlink failures [15] finds that tuning underlay routingparameters improves overlay performance. Mostinvestigations tend to point out that the overlay topol-ogy does not appear to be correlated with the under-lay (e.g. [1]), but the routing dynamics of the under-lay do affect the overlay in ways not yet well under-stood. To address the apparent lack of overlay-under-lay correlation, some schemes, e.g. [11, 12], havebeen proposed. More recently, [2] has made a case
Modelling Overlay-Underlay Correlations Using Visualization*)
V I N A Y A G G A R W A L , A N J A F E L D M A N N , R O B E R T G Ö R K E , M A R C O G A E R T L E R ,D O R O T H E A W A G N E R
Vinay Aggarwal
is PhD student
at Deutsche
Telekom
Laboratories,
TU Berlin,
Germany
Anja Feldmann
is Professor
at Deutsche
Telekom
Laboratories,
TU Berlin,
Germany
Robert Görke
is a PhD student
at Universität
Karlsruhe,
Germany
Marco Gaertler
is a PostDoc at
Universität
Karlsruhe,
Germany
Overlay applications are popular as they provide high-level functionality by masking the intrinsiccomplexity of the underlay network. However, overlays rely on the underlay to provide them with basicconnectivity. Therefore, the intrinsic features of the underlay network determine the efficiency of theoverlay. Accordingly, studying the interdependency of the overlay and underlay networks leads to abetter understanding of overlay application behavior. We present a visualization-driven analysistechnique for evaluating the overlay architecture with respect to the underlay, driven by the goalof overlay engineering. Using Gnutella as a case study, our analysis confirms that Gnutella topologydiffers from a randomly generated network and that there is an implicit correlation between theoverlay and underlay topologies.
*) The authors gratefully acknowledge financial support from the European Commission within FET Open Projects DELIS (contractno. 001907) and the DFG under grant WA 654/13-3.
ISSN 0085-7130 © Telenor ASA 2008
115Telektronikk 1.2008
for collaboration between ISPs and P2P systems asa win-win solution for both.
In this paper, we approach the problem of modellingoverlay-underlay correlations using a unique visual-ization-driven approach [4] which relies on the con-cept of cores, to analyze the overlay in the context ofthe underlay network. We introduce our theoreticalmodel with examples in Section 2, followed by theintroduction of a new technique for analytic visual-ization in Section 3. We then demonstrate the appli-cation of our technique on a case study to study thecorrelation of Gnutella with the AS network, as wellas to compare Gnutella with a random network inSection 4. We first explain how we sample the P2Pnetwork, followed by a comparison of the P2P net-work with random networks. After a sensitivity anal-ysis of the random network to generate and betterunderstand P2P network models, we conclude inSection 5.
2 Modelling Underlays and OverlaysIn this section, we introduce our model and method-ology for analyzing the relation between under- andoverlays as well as a first discussion about differentmodelling aspects.
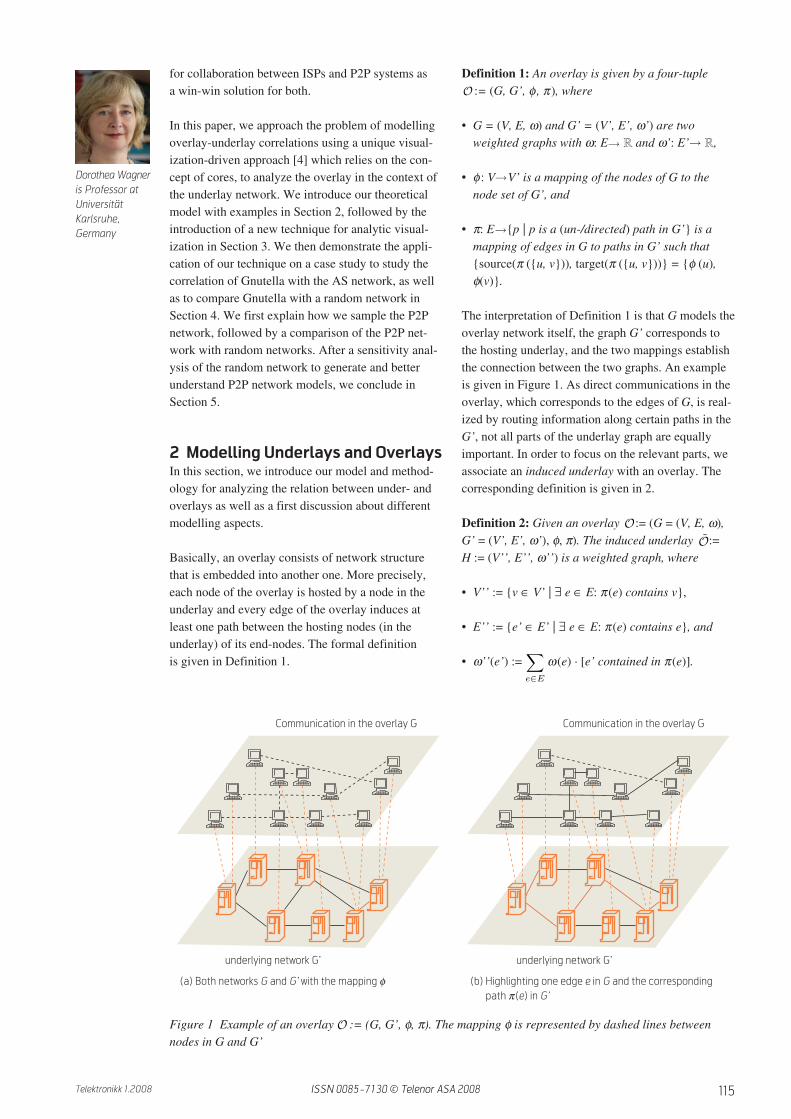
Basically, an overlay consists of network structurethat is embedded into another one. More precisely,each node of the overlay is hosted by a node in theunderlay and every edge of the overlay induces atleast one path between the hosting nodes (in theunderlay) of its end-nodes. The formal definitionis given in Definition 1.
Definition 1: An overlay is given by a four-tuple:= (G, G’, φ , π), where
• G = (V, E, ω) and G’ = (V’, E’, ω’) are twoweighted graphs with ω: E RR and ω’: E’ RR,
• φ : V V’ is a mapping of the nodes of G to thenode set of G’, and
• π: E {p | p is a (un-/directed) path in G’} is amapping of edges in G to paths in G’ such that{source(π ({u, v})), target(π ({u, v}))} = {φ (u),φ(v)}.
The interpretation of Definition 1 is that G models theoverlay network itself, the graph G’ corresponds tothe hosting underlay, and the two mappings establishthe connection between the two graphs. An exampleis given in Figure 1. As direct communications in theoverlay, which corresponds to the edges of G, is real-ized by routing information along certain paths in theG’, not all parts of the underlay graph are equallyimportant. In order to focus on the relevant parts, weassociate an induced underlay with an overlay. Thecorresponding definition is given in 2.
Definition 2: Given an overlay := (G = (V, E, ω),G’ = (V’, E’, ω’), φ, π). The induced underlay :=H := (V’’, E’’, ω’’) is a weighted graph, where
• V’’ := {v ∈ V’ | ∃ e ∈ E: π(e) contains v},
• E’’ := {e’ ∈ E’ | ∃ e ∈ E: π(e) contains e}, and
• ω’’(e’) := ω(e) · [e’ contained in π(e)].
Figure 1 Example of an overlay := (G, G’, φ, π). The mapping φ is represented by dashed lines betweennodes in G and G’
→ →
→
→
O
O
O
O
∑
e∈E
Communication in the overlay G Communication in the overlay G
underlying network G’ underlying network G’
. . . . . .. . . . . .. . . . . . . .. . . . . . . .
. . . . . .. . . . . .. . . . . . . .. . . . . . . .
. . . . . .. . . . . .. . . . . . . .. . . . . . . .. . . . . .. . . . . .. . . . . . . .. . . . . . . .
. . . . . .. . . . . .. . . . . . . .. . . . . . . .
. . . . . .. . . . . .. . . . . . . .. . . . . . . . . . . . . .. . . . . .. . . . . . . .. . . . . . . .
. . . . . .. . . . . .. . . . . . . .. . . . . . . . . . . . . .. . . . . .. . . . . . . .. . . . . . . . . . . . . .. . . . . .. . . . . . . .. . . . . . . .
. . . . . .. . . . . .. . . . . . . .. . . . . . . .
. . . . . .. . . . . .. . . . . . . .. . . . . . . .
. . . . . .. . . . . .. . . . . . . .. . . . . . . .
. . . . . .. . . . . .. . . . . . . .. . . . . . . .. . . . . .. . . . . .. . . . . . . .. . . . . . . .
. . . . . .. . . . . .. . . . . . . .. . . . . . . .
. . . . . .. . . . . .. . . . . . . .. . . . . . . . . . . . . .. . . . . .. . . . . . . .. . . . . . . .
. . . . . .. . . . . .. . . . . . . .. . . . . . . . . . . . . .. . . . . .. . . . . . . .. . . . . . . . . . . . . .. . . . . .. . . . . . . .. . . . . . . .
. . . . . .. . . . . .. . . . . . . .. . . . . . . .
Dorothea Wagner
is Professor at
Universität
Karlsruhe,
Germany
(a) Both networks G and G’ with the mapping φ (b) Highlighting one edge e in G and the corresponding
path π(e) in G’
ISSN 0085-7130 © Telenor ASA 2008

116 Telektronikk 1.2008
The weight function ω’’ is also called appearanceweight.
The definition of ω’’ is given in the Iverson Notation[9]. The term inside the squared parentheses is a logi-cal statement and depending on its value, the termevaluates to 1, if its value is true, and to 0 otherwise.In other words, the induced underlay corresponds tothe subgraph of the underlay graph that is requiredto establish the communication in the overlay graph.Note that the defined weight can be interpreted as theload caused by the communication and thus is per seindependent of a weighting in the underlay network.
2.1 Analysis
In the analysis of overlays, we focus on two impor-tant aspects: the identification of key features with
respect to the underlay and the comparison of differ-ent overlays.
The first part, the identification of key features, con-sists of standard tasks of network analysis, e.g. deter-mining important and relevant nodes or edges, clus-tering nodes with similar patterns, and detectingunusual constellations. As existing techniques canbe applied to the overlay network and the inducedunderlay, these standard tasks are reasonably wellunderstood in the case of the analysis of a single net-work. However, these techniques do not incorporatethe relationship between the two networks. An exam-ple showing such dependencies is given in Figure 2with the corresponding information about the degreesin Table 1. We use the degree, which is a popularfeature, for illustration. However, in our studies wenoted that these observations carry over to othercharacteristics. First note that the number of hostingnodes and the number of communications a node inthe underlay participates in gives a first impressionabout its role in the network. Both pieces of informa-tion can be read off the overlying graph G. However,they are completely independent from the routingstructure in the underlay. As the example illustrates,the degree of a node (in the induced underlay) heavilydepends on the routing structure. In the case of thestar topology, both the weighted degree in the under-lying network and in the induced underlay are fairlysimilar, here they are even proportional and clearlyidentify the centre node of the star to be central forthe network. The situation drastically changes whenusing a path topology. Although all communications
Figure 2 Examples of two overlays where only the topology in the underlay network G’ changes. Nodes in theoverlay network are numbered with integers, and edges are dashed, while nodes in the underlay network arelabelled with characters, and edges are unbroken lines. In both cases the routing π is done via shortest-pathscheme
property A B C D E
number of hosting nodes 1 1 1 1 8
number of edge in the overlay network having
an end-node in the node 3 3 3 3 12
UN weighted degree (star top.) 1 1 1 1 4
UN weighted degree (path top.) 1 2 2 2 1
IU weighted degree (star top.) 3 3 3 3 12
IU weighted degree (path top.) 3 9 15 21 12
Table 1 Degree information of the examples given in Figure 2. Theweighted degree corresponds to the weighted degree in the underlaynetwork (UN) and the induced underlay (IU), respectively
12 11
109
1
8
7
6
5
24
3
A B
D C
E
12 11
109
1
8
7
6
5
24
3
A B
D C
E
ISSN 0085-7130 © Telenor ASA 2008
117Telektronikk 1.2008
start/terminate at node E, it is not very central. Thenodes C and D take on very active roles, due to thefact that most/all communication has to be routedthrough them. In many cases, the information pro-vided by the induced underlay sufficiently codes therelation between the overlay and underlay networks,while still enabling us to use standard notation of net-work analysis. On the other hand, there are some sce-narios where the provided view is too coarse. Forexample, it could make a difference whether a heavyedge is caused by a single heavy communication orby a multitude of small communications or, con-versely, whether all communications of a node in theinduced underlay have only one target in the overlayor are distributed over many targets.
One motivation for identifying key features is tobuild a proper model that can be used for extensivesimulations. For example, simulations are used topredict scaling behaviour or to experimentally vali-date heuristics, enhancements, or novel techniques.As such, it is a major issue to structurally comparedifferent overlays with each other. On the one hand,our model already reflects all dependencies betweenthe underlay and the overlay network and, thus, itdoes not require the underlay network, embedding,or routing to be fixed for different instances. On theother hand, due to this elaboration of our model, asimple matching of nodes or edges will not suffice.Our idea is to match key features. For example, onecan try to match the appearance weight of an edgewith structural properties of its end-nodes. If bothoverlays have a sufficient number of such matches,it is reasonable to assume that they are created bythe same mechanism.
Both parts, the identification of key features and thecomparison of overlays, benefit from proper analyticvisualizations that emphasize relevant aspects of thecorresponding networks and make them easier per-ceivable. Before presenting two visualization tech-niques (Section 3), we briefly demonstrate our modeland methodology with some experimentally gener-ated examples.
2.2 Examples
In the following, we demonstrate our model andmethodology with simple examples. Before lookingat a specific overlay, we give two further intuitions.
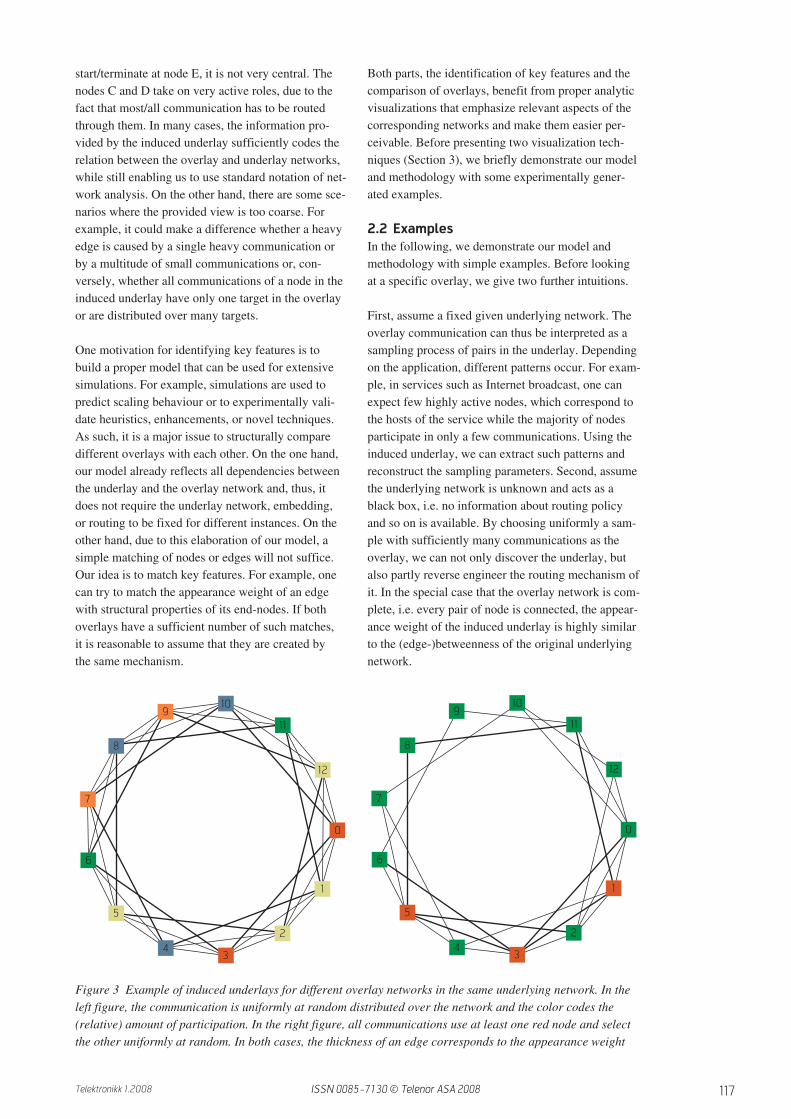
First, assume a fixed given underlying network. Theoverlay communication can thus be interpreted as asampling process of pairs in the underlay. Dependingon the application, different patterns occur. For exam-ple, in services such as Internet broadcast, one canexpect few highly active nodes, which correspond tothe hosts of the service while the majority of nodesparticipate in only a few communications. Using theinduced underlay, we can extract such patterns andreconstruct the sampling parameters. Second, assumethe underlying network is unknown and acts as ablack box, i.e. no information about routing policyand so on is available. By choosing uniformly a sam-ple with sufficiently many communications as theoverlay, we can not only discover the underlay, butalso partly reverse engineer the routing mechanism ofit. In the special case that the overlay network is com-plete, i.e. every pair of node is connected, the appear-ance weight of the induced underlay is highly similarto the (edge-)betweenness of the original underlyingnetwork.
Figure 3 Example of induced underlays for different overlay networks in the same underlying network. In theleft figure, the communication is uniformly at random distributed over the network and the color codes the(relative) amount of participation. In the right figure, all communications use at least one red node and selectthe other uniformly at random. In both cases, the thickness of an edge corresponds to the appearance weight
8
910
11
12
0
1
2
34
5
6
7
8
910
11
12
0
1
2
34
5
6
7
ISSN 0085-7130 © Telenor ASA 2008
118 Telektronikk 1.2008
As an example, we consider an underlying networkwith 13 nodes and a 3-cycle topology, i.e. nodes arecyclic-ordered and each node is connected to 3 of itsimmediate predecessors and successors. Traffic isrouted using shortest path scheme. For simplicity, weset the node-set of the overlay network to the node-set of the underlay and thus φ to be the identity func-tion. We define two overlays: the first one (uni-form sampling) uses uniformly at random selectedpairs of nodes for communication, while in the sec-ond overlay (star-like sampling) the communica-tion takes place between three predefined nodes andall other nodes chosen uniformly at random. Theresulting induced underlays are displayed in Figure 3.As can be clearly seen, the short-cuts, i.e. edges thatconnect two nodes that have a distance of order two,have the largest appearance weight and all otheredges have relatively small weights for the uniformsampling. This is not surprising as the appearanceweight resembles the betweenness of edges. The situ-ation drastically changes when modifying the sam-pling mechanism. As in the case of the inducedunderlay of , the edges relatively close to the ini-tial set have large weights, and edges far away havesmall weights or do not appear at all. For example,
the non-existence of the edges {9, 10} is due to thefact that no shortest path between a red node and anyother node uses that edge. On the other hand, theedge {6, 7} is contained in a shortest path, namelybetween 3 and 7. However, its absence reveals certainaspects of the underlay routing, i.e., the routingbetween 3 and 7 will either use the path (3, 4, 7) or(3, 5, 7), but never the path (3, 6, 7).
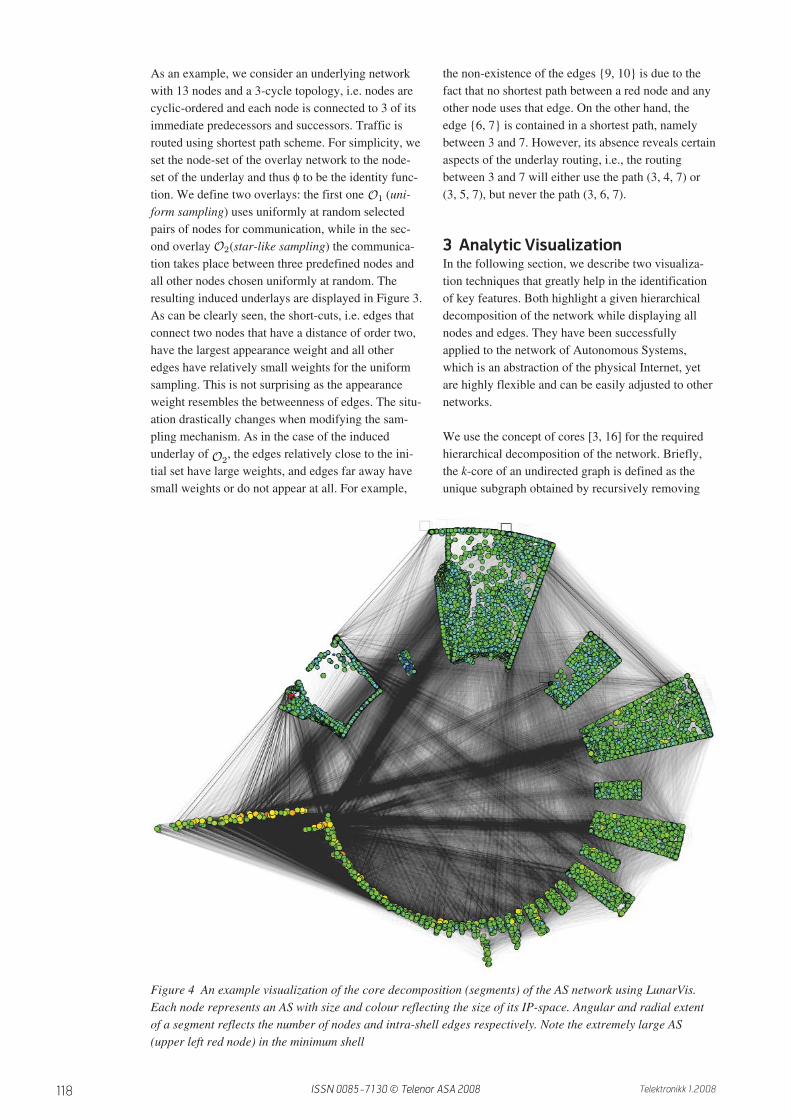
3 Analytic VisualizationIn the following section, we describe two visualiza-tion techniques that greatly help in the identificationof key features. Both highlight a given hierarchicaldecomposition of the network while displaying allnodes and edges. They have been successfullyapplied to the network of Autonomous Systems,which is an abstraction of the physical Internet, yetare highly flexible and can be easily adjusted to othernetworks.
We use the concept of cores [3, 16] for the requiredhierarchical decomposition of the network. Briefly,the k-core of an undirected graph is defined as theunique subgraph obtained by recursively removing
O2
O2
Figure 4 An example visualization of the core decomposition (segments) of the AS network using LunarVis.Each node represents an AS with size and colour reflecting the size of its IP-space. Angular and radial extentof a segment reflects the number of nodes and intra-shell edges respectively. Note the extremely large AS(upper left red node) in the minimum shell
O1
ISSN 0085-7130 © Telenor ASA 2008

119Telektronikk 1.2008
all nodes of degree less than k. A node has coreness,, if it belongs to the -core but not to the ( + 1)-
core. The -shell is the collection of all nodes havingcoreness . The core of a graph is the non-empty k-core such that the (k + 1)-core is empty. Generally thecore decomposition of a graph results in disconnectedsub-graphs, but in the case of the AS network weobserve that all k-cores stay connected, which is agood feature regarding connectivity. Cores have beenfrequently used for network analysis, e.g. [5, 6].
The first technique employing the concept of coreswas proposed by Baur et al. in [4]. More precisely,their algorithm lays out the graph incrementally start-ing from the innermost shell, iteratively adding thelower shells. Their implementation uses core decom-position and a combination of spectral and force-directed layout techniques. A successful applicationof this visualization technique compares actual ASgraphs with generated AS graphs. The obtained lay-outs clearly reveal structural differences between thenetworks.
The nature of the above layout technique is popularlyreferred to as a network fingerprint. Such pseudo-abstract visualizations offer great informative poten-tial by setting analytic characteristics of a networkinto the context of its structure, revealing numeroustraits at a glance. A fingerprint drawing techniquethat focuses on the connectivity properties of a net-work decomposition has been presented in [8]. Thisapproach, coined LunarVis lays out each set of adecomposition – which are the shells in our case –individually inside the segments of an annulus. Therough layout of LunarVis is defined by analytic prop-erties of the decomposition, allowing the graph struc-ture to determine the details. By virtue of a sophisti-cated application of force-directed node placement,individual nodes inside annular segments reflectglobal and local characteristics of adjacency whilethe inside of the annulus offers space for the exhibi-tion of the edge distribution. Combined with well-perceivable attributes, such as the size and the colourof a node, these layouts offer remarkable readabilityof the decompositional connectivity and are capableof revealing subtle structural characteristics.
4 Case Study: Overlay Graphs ofP2P systems
In this section, we exemplify our analysis techniquewith a case study of a P2P overlay. For our analysiswe choose Gnutella [7], an unstructured file-sharingsystem which relies on flooding connectivity pingsand search queries to locate content. Each messagecarries a TTL (time to live) and message ID tag. Toimprove scalability, nodes are classified in a two-
level hierarchy, with high-performance ultrapeernodes maintaining the overlay structure by connect-ing with each other and forwarding only the relevantmessages to a small number of shielded leaf nodes.Responses to pings and queries are cached, and fre-quent pinging or repeated searching can lead to dis-connection from network. More details aboutGnutella can be found at [7].
4.1 Sampling and Modelling the P2P
Network
In order to analyze the overlay structure, we firstneed to identify a representative set of connections,called edges, between nodes in the P2P network.To reduce the bias in our sample, we identify edgeswhere neither of the two end-nodes is controlled byus. We refer to such nodes as remote neighbour ser-vents.
Due to message caching and massive churn in P2Pnetworks (we measured the median incoming/out-going connection duration to be 0.75/0.98 seconds),a simple crawling approach using pings, e.g. asemployed in [14], is not sufficient. However, pingsidentify nodes that should have been remote neigh-bour servents at some point.
We thus deploy a combination of active and passivetechniques to explore the Gnutella network [1]. Ourpassive approach consists of an ultrapeer that partici-pates in the network and is attractive to connect to. Itshares 100 randomly generated music files (totalling300 MB in size) and maintains 60 simultaneousconnections to other servents. The passive approachgives us a list of active servents. The active approachconsists of a multiple-client crawler that uses pingwith TTL 2 to obtain a list of candidate servents.Since queries are difficult to cache, we use querieswith TTL 2 to obtain a set of remote neighbour ser-vents. These servents are then contacted activelyto further advance the network exploration. Thisapproach allows us to discover P2P edges that existedat a very recent point of time. When interacting withother servents, our crawler pretends to be a long-run-ning ultrapeer, answering incoming messages, shar-ing content, and behaving non-intrusively. This prag-matic behaviour avoids bans. The client uses querymessages with broad search strings, e.g. mp3, avi, rar,to obtain maximum results. We then combine activeand passive approaches by integrating the crawlerinto the passive ultrapeer.
Using this setup, we sample the Gnutella network forone week starting April 14, 2005. The ultrapeer logs352, 396 sessions and the crawler discovers 234, 984remote neighbour servents, a figure significantlyhigher than most reported results during this period.
� �
�
�
�
ISSN 0085-7130 © Telenor ASA 2008

120 Telektronikk 1.2008
For each edge of the Gnutella network we map theIP addresses of the Gnutella peers to ASes using theBGP table dumps offered by Routeviews [13] duringthe week of April 14, 2005. This results in 2964unique AS edges involving 754 ASes, after duplicateelimination and ignoring P2P edges inside an AS. Forthe random graph we pick end-points at the IP levelby randomly choosing two valid IP addresses fromthe whole IP space. These edges are then mapped toASes in the same manner as for the Gnutella edges.This results in 4975 unique edges involving 2095ASes for the random network at the AS graph level.The different sizes of the graphs are a result of thegeneration process: we generate the same number ofIP pairs for random network as observed in Gnutella,and apply the same mapping technique to both datasets, which abstracts the graph of IPs and direct com-munication edges to a graph with ASes as nodes andthe likely underlay communication path as edges.This way, the characteristics of Gnutella are betterreflected than by directly generating a random ASnetwork of the same size as Gnutella network.
For our analysis, we apply the model and methodol-ogy from Section 2 as follows. The overlay = (G,G’, φ, π) as given in Definition 1 uses the direct com-munication in Gnutella as graph G, the graph G’ cor-responds to the hosting Internet, in our case the ASlevel. The mapping φ corresponds to the IP to ASmapping, while π is the routing in the AS network.Apart from the already introduced induced underlay,we also investigate the network of direct overlaycommunication, yet abstracted to the level of ASes inorder to be comparable to the induced underlay. Note
that in a simplified model, where each communica-tion causes uniform costs, the appearance weight inthe induced underlay (ω’’) corresponds to the totalload caused by the overlay routing in the underlaynetwork. As exact traffic measurements on eachunderlay link are non-trivial, this can be interpretedas an estimate of the actual load on underlay linksdue to the overlay traffic.
4.2 Overlay-Underlay Correlation
in a P2P system
Figure 5 shows visualizations of the direct overlaycommunication of both the Gnutella network and arandom network. Employing the LunarVis [8] tech-nique described in Section 3, these drawings focus onthe decompositional properties of the core hierarchy.Numerous observations can be made by comparingthe two visualizations. Note, first, the striking lack ofintra-shell edges for all but the maximum shell in theGnutella network (small radial extent). This is alsotrue for edges between shells, as almost all edgesare incident to the maximum shell. This means thatalmost always at least one communication partner isin the maximum shell, a strongly hierarchical patternthat the random network does not exhibit to thisdegree. Note furthermore that in Gnutella, between-ness centrality (size of a node) correlates well withcoreness, a consequence of the strong and deep corehierarchy, whereas in the random network the two-and even the one-shell already contain nodes withhigh centrality, indicating that many peerings heavilyrely on low-shell ASes. The depth of the Gnutellahierarchy (26 levels) is a weighty suggestion of astrongly connected network kernel of ultrapeers,
Figure 5 Visualization of the core decomposition of the overlay communication networks. Core-shells aredrawn into annular segments, with the 1-shell at the upper left. Angular and radial extent of a segment reflectsthe number of nodes and intra-shell edges respectively. Inside, each shell node is drawn towards its adjacen-cies. Colours represent the degree of a node while the size represents their betweenness centrality. Edges aredrawn with 10 % opacity and range from blue (small weight) to red (large weight)
O
(a) P2P network (b) Random network
ISSN 0085-7130 © Telenor ASA 2008
121Telektronikk 1.2008
which are of prime importance to the connectivity ofthe whole P2P network. However, note that the distri-bution of degrees (node colours) does not exhibit anyunusual traits and that no heavy edges are incident tolow-shell ASes, in either network.
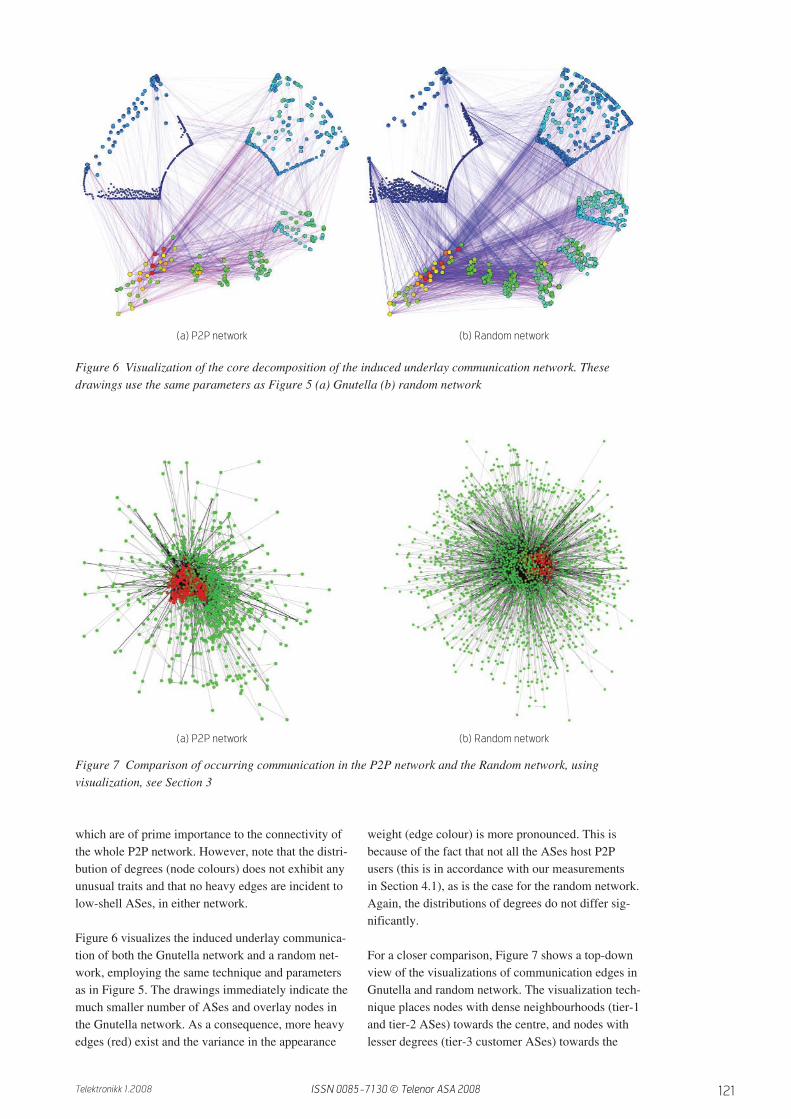
Figure 6 visualizes the induced underlay communica-tion of both the Gnutella network and a random net-work, employing the same technique and parametersas in Figure 5. The drawings immediately indicate themuch smaller number of ASes and overlay nodes inthe Gnutella network. As a consequence, more heavyedges (red) exist and the variance in the appearance
weight (edge colour) is more pronounced. This isbecause of the fact that not all the ASes host P2Pusers (this is in accordance with our measurementsin Section 4.1), as is the case for the random network.Again, the distributions of degrees do not differ sig-nificantly.
For a closer comparison, Figure 7 shows a top-downview of the visualizations of communication edges inGnutella and random network. The visualization tech-nique places nodes with dense neighbourhoods (tier-1and tier-2 ASes) towards the centre, and nodes withlesser degrees (tier-3 customer ASes) towards the
Figure 6 Visualization of the core decomposition of the induced underlay communication network. Thesedrawings use the same parameters as Figure 5 (a) Gnutella (b) random network
Figure 7 Comparison of occurring communication in the P2P network and the Random network, usingvisualization, see Section 3
(a) P2P network (b) Random network
(a) P2P network (b) Random network
ISSN 0085-7130 © Telenor ASA 2008

122 Telektronikk 1.2008
periphery. We can observe that while both networkshave many nodes with large degrees in the centre, therandom network possesses several nodes with largedegree in the periphery. Gnutella, on the other hand,has almost no nodes with large degree in the periph-ery in both models. Moreover, this pattern is morepronounced for Gnutella in the direct overlay com-munication model, while the random network islargely similar in both models. In other words, itappears that Gnutella peering connections tend to liein ASes in the core of the Internet where there maybe high-bandwidth links available.
To further corroborate our observations, we investi-gate structural dependencies between the inducedunderlay communication model and the actual under-lay network, by comparing the appearance weightwith node-structural properties of the correspondingend-nodes in the original underlay. We focus on theproperties degree and coreness, as both have beensuccessfully applied for the extraction of customer-provider relationship as well as visualization [18,5],due to the ability of these properties to reflect theimportance of ASes. We systematically compare theweight of an edge with the minimum and maximumdegree and coreness of its end-nodes. Figure 8 showsthe corresponding plots.
From the plots of minimum and maximum degree itis apparent that the appearance weight of an edge andits end-nodes’ degrees are not correlated in both theGnutella and the random network, as no pattern isobservable. Also, the distributions are similar as themajority of edges are located in the periphery of thenetwork where the maximum degree of the end-nodes
is small. We thus hypothesize that the relation of loadin the P2P network and node degree in the underlyingnetwork is the same in both the Gnutella and the ran-dom network. In other words, the Gnutella networkdoes not appear to be significantly affected by thenode degree of underlay nodes.
However, considering the coreness reveals interestingobservations. From the networks of minimum andmaximum coreness in Figure 8, we can observe thatalthough there is no correlation in either of the twonetworks, their distributions are different. In therandom network the distributions are very uniform,which reflects its random nature. But in the case ofGnutella almost no heavy edge is incident to a nodewith small coreness, as can be seen in the minimumcoreness diagram. Positively speaking, most edgeswith large appearance weights are incident to nodeswith large minimum coreness. Interpreting corenessas importance of an AS, these Gnutella edges arelocated in the backbone of the Internet, an importantobservation. The same diagram for the random net-work does not yield a similar significant distribution,thus denying a comparable interpretation. Forinstance, in the random network, there exist edgeslocated in the periphery that are heavily loaded. Asan aside, backbone edges need not necessarily beheavily loaded in either network.
All these observations and analysis show that theGnutella network differs from random networks andthere appears to be some correlation of Gnutellatopology with the Internet underlay.
Figure 8 Comparing appearance weight with minimum (first column) and maximum (second column) degreeand coreness (third and fourth columns) of the corresponding end-nodes in Gnutella (top row) and the randomnetwork (bottom row). Each data point represents an edge, the x-axis denotes the appearance weight and they-axis reflects the degrees (coreness) of the end-nodes. All axes use logarithmic scale
ISSN 0085-7130 © Telenor ASA 2008
123Telektronikk 1.2008
4.3 Sensitivity Analysis to Refine the Model
The analyses conducted in Section 4.2 and the con-clusions drawn, solely rely on analytic visualizations.Based on these we now aim at a deeper understandingof the properties of the underlay communication theP2P network induces. Modifying the generation pro-cess for the random networks in ways suggested byour observation, we are now able to conduct a sensi-tivity analysis, in order to find parameters for the ran-dom network that lead to a more aligned edge core-ness distribution with the observed P2P network.
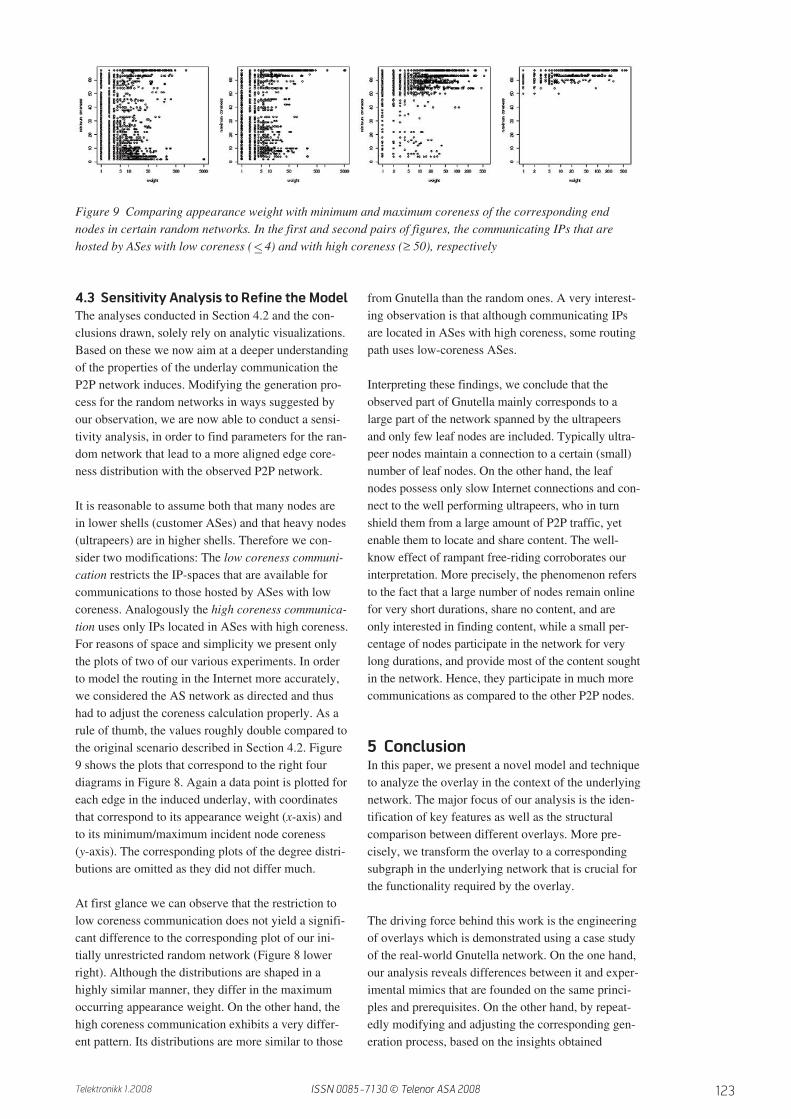
It is reasonable to assume both that many nodes arein lower shells (customer ASes) and that heavy nodes(ultrapeers) are in higher shells. Therefore we con-sider two modifications: The low coreness communi-cation restricts the IP-spaces that are available forcommunications to those hosted by ASes with lowcoreness. Analogously the high coreness communica-tion uses only IPs located in ASes with high coreness.For reasons of space and simplicity we present onlythe plots of two of our various experiments. In orderto model the routing in the Internet more accurately,we considered the AS network as directed and thushad to adjust the coreness calculation properly. As arule of thumb, the values roughly double compared tothe original scenario described in Section 4.2. Figure9 shows the plots that correspond to the right fourdiagrams in Figure 8. Again a data point is plotted foreach edge in the induced underlay, with coordinatesthat correspond to its appearance weight (x-axis) andto its minimum/maximum incident node coreness(y-axis). The corresponding plots of the degree distri-butions are omitted as they did not differ much.
At first glance we can observe that the restriction tolow coreness communication does not yield a signifi-cant difference to the corresponding plot of our ini-tially unrestricted random network (Figure 8 lowerright). Although the distributions are shaped in ahighly similar manner, they differ in the maximumoccurring appearance weight. On the other hand, thehigh coreness communication exhibits a very differ-ent pattern. Its distributions are more similar to those
from Gnutella than the random ones. A very interest-ing observation is that although communicating IPsare located in ASes with high coreness, some routingpath uses low-coreness ASes.
Interpreting these findings, we conclude that theobserved part of Gnutella mainly corresponds to alarge part of the network spanned by the ultrapeersand only few leaf nodes are included. Typically ultra-peer nodes maintain a connection to a certain (small)number of leaf nodes. On the other hand, the leafnodes possess only slow Internet connections and con-nect to the well performing ultrapeers, who in turnshield them from a large amount of P2P traffic, yetenable them to locate and share content. The well-know effect of rampant free-riding corroborates ourinterpretation. More precisely, the phenomenon refersto the fact that a large number of nodes remain onlinefor very short durations, share no content, and areonly interested in finding content, while a small per-centage of nodes participate in the network for verylong durations, and provide most of the content soughtin the network. Hence, they participate in much morecommunications as compared to the other P2P nodes.
5 ConclusionIn this paper, we present a novel model and techniqueto analyze the overlay in the context of the underlyingnetwork. The major focus of our analysis is the iden-tification of key features as well as the structuralcomparison between different overlays. More pre-cisely, we transform the overlay to a correspondingsubgraph in the underlying network that is crucial forthe functionality required by the overlay.
The driving force behind this work is the engineeringof overlays which is demonstrated using a case studyof the real-world Gnutella network. On the one hand,our analysis reveals differences between it and exper-imental mimics that are founded on the same princi-ples and prerequisites. On the other hand, by repeat-edly modifying and adjusting the corresponding gen-eration process, based on the insights obtained
Figure 9 Comparing appearance weight with minimum and maximum coreness of the corresponding endnodes in certain random networks. In the first and second pairs of figures, the communicating IPs that arehosted by ASes with low coreness ( 4) and with high coreness (≥ 50), respectively≤
ISSN 0085-7130 © Telenor ASA 2008
124 Telektronikk 1.2008
through detailed analysis and visualization, we areable to deepen our understanding of the real-worldinstance. In addition, we identify certain artefacts thatincite further research. More precisely, our extensivecase study incorporates existing visualization tech-niques for the underlying Internet and establishes thatwhile overlay networks like Gnutella use an arbitraryneighbourhood selection process, their topology dif-fers from randomly generated networks.
Our methodology of analyzing the overlays andunderlays supported by analytic visualizations, offersa powerful and flexible tool in the general engineer-ing process of overlays.
References1 Aggarwal, V, Bender, S, Feldmann, A, Wich-
mann, A. Methodology for Estimating NetworkDistances of Gnutella Neighbors. In: INFOR-MATIK 2004 – GI Jahrestagung, 219–223, 2004.
2 Aggarwal, V, Feldmann, A, Scheideler, C. CanISPs and P2P Systems Cooperate for ImprovedPerformance? In: ACM SIGCOMM ComputerCommunication Review, 37(3), 2007.
3 Batagelj, V, Zaversnik, M. Generalized Cores.Preprint 799, IMFM Ljublana, Ljubljana, 2002.
4 Baur, M, Brandes, U, Gaertler, M, Wagner, D.Drawing the AS Graph in 2.5 Dimensions. In:Proceedings of the 12th International Symposiumon Graph Drawing (GD’04). Springer-Verlag,January 2005. Lecture Notes in ComputerScience, 3383, 43–48.
5 Gaertler, M, Patrignani, M. Dynamic Analysisof the Autonomous System Graph. In: IPS 2004– Inter-Domain Performance and Simulation,13–24, March 2004.
6 Gkantsidis, C, Mihail, M, Zegura, E W. SpectralAnalysis of Internet Topologies. In: Proceedingsof Infocom’03, 2003.
7 Gnutella. Wikipedia, the free encyclopedia.[online] – URL:http://en.wikipedia.org/wiki/Gnutella. Accessed31 August 2007
8 Görke, R, Gaertler, M, Wagner, D. LunarVis -Analytic Visualizations of Large Graphs. In: Pro-ceedings of the 15th International Symposium onGraph Drawing (GD’07). Springer-Verlag, 2008.Lecture Notes in Computer Science. To appear.
9 Knuth, D E. Two notes on notation. AmericanMathematical Monthly, 99, 403–422, 1990.
10 Liu, Y, Zhang, H, Gongi, W, Towsley, D. On theinteraction between overlay routing and trafficengineering. In: Proceedings of the 24th AnnualJoint Conference of the IEEE Computer andCommunications Societies (Infocom), 4, 2543-2553. IEEE Computer Society Press, March 2005.
11 Nakao, A, Peterson, L, Bavier, A. A RoutingUnderlay for Overlay Networks. In: SIGCOMM’03: Proceedings of the 2003 conference onApplications, technologies, architectures, andprotocols for computer communications, 11-18.ACM Press, 2003.
12 Ratnasamy, S, Handley, M, Karp, R M, Shenker,S. Topologically-aware overlay construction andserver selection. In: Proceedings of the 21stAnnual Joint Conference of the IEEE Computerand Communications Societies (Infocom), 1,1190-1199. IEEE Computer Society Press, 2002.
13 University of Oregon Routeviews Project.October 17, 2007 [online] – URL:http://www.routeviews.org/.
14 Saroiu, S, Gummadi, P K, Gribble, S D. A mea-surement study of peer-to-peer file sharing sys-tems. In: Proceedings of SPIE/ACM Conferenceon Multimedia Computing and Networking(MMCN) 2002, January 2002.
15 Seetharaman, S, Ammar, M. On the interactionbetween dynamic routing in native and overlaylayers. In: Proceedings of the 25th Annual JointConference of the IEEE Computer and Communi-cations Societies (Infocom), 1-12. IEEE SocietyPress, April 2006.
16 Seidman, S B. Network Structure and MinimumDegree. Social Networks, 5, 269–287, 1983.
17 Steinmetz, R, Wehrle, K (Eds.). Peer-to-Peer Sys-tems and Applications. Lecture Notes in Com-puter Science, 3485. Springer, 2005.
18 Subramanian, L, Agarwal, S, Rexford, J, Katz, RH. Characterizing the Internet Hierarchy fromMultiple Vantage Points. In: Proceedings of Info-com’02, 618–627, 2002.
ISSN 0085-7130 © Telenor ASA 2008

125Telektronikk 1.2008
Anja Feldmann is a Professor at the Deutsche Telekom Laboratories at the Technical University Berlin. Previously she was a
Professor in the computer science department at the Technical University of Munich and at the computer science department
at University of Saarbrücken in Germany. Before that, she was a member of the IP Network Measurement and Performance
Department at AT&T Labs. Her current research interest is network performance debugging.
email: [email protected]
Robert Görke studied technical mathematics at Universität Karlsruhe, Germany, and received his Diplom in 2005. Since then he
has been a PhD student at the chair of Algorithmics I of the Faculty of Informatics in Karlsruhe. His research focuses are the
clustering of graphs both in a static and in an evolving environment and the analytic visualization of networks.
email: [email protected]
Marco Gaertler studied mathematics at Universität Konstanz, Germany, and received his Diplom in 2002. In 2007 he received
his PhD in computer science at the chair of Algorithmics I of the Faculty of Informatics in Karlsruhe. His research focuses as a
PostDoc are fingerprinting and the analytic visualization of static and evolving networks as well as graph clustering.
email: [email protected]
Dorothea Wagner received the Diplom and PhD degrees in mathematics from the Rheinisch-Westfälische Technische
Hochschule at Aachen, Germany, in 1983 and 1986, respectively. In 1992, she received the Habilitation degree from the
Department for Mathematics of the Technische Universität Berlin. Until 2003 she was a Full Professor of computer science at
the University of Konstanz, and since then holds this position at Universität Karlsruhe. Her research interests include discrete
optimization, graph algorithms, and algorithm engineering. Alongside numerous positions in editorial boards she is vice president
of the German Research Foundation (DFG) since 2007.
email: [email protected]
Vinay Aggarwal received a Bachelor of Engineering (BE) degree from Gujarat University in 2001, India, and his Masters in
Computer Science at the Max-Planck-Institut für Informatik (MPI), Universität des Saarlandes, Saabrücken, Germany. Today
he is a PhD student at the Deutsche Telekom Laboratories, TU Berlin, researching innovation solutions that will enable ISP
performance improvements, cost savings and end-user experience.
email: [email protected]
ISSN 0085-7130 © Telenor ASA 2008