Embed Size (px)
Citation preview

Modelling of Energy
Production from Alternative Fuels
Christina Andreadou
SID: 3302140003
SCHOOL OF SCIENCE & TECHNOLOGY
A thesis submitted for the degree of
Master of Science (MSc) in Energy Systems
NOVEMBER 2015
THESSALONIKI – GREECE

[1]
Modelling of Energy
Production from alternative fuels
Christina Andreadou
SID: 3302140003
Supervisor: Dr G. Martinopoulos
Supervising Committee Members:
Dr. HeracleousAssist.
Dr. Sardi
SCHOOL OF SCIENCE & TECHNOLOGY
A thesis submitted for the degree of
Master of Science (MSc) in Energy Systems
NOVEMBER 2015
THESSALONIKI – GREECE

[2]
Acknowledgement
This dissertation would not have been possible without the guidance and support of
several individuals who in one way or another contributed and provided their valuable
assistance in the preparation and completion of this work.
First and foremost, my ultimate gratitude to my supervisor, Dr. Georgios
Martinopoulos, academic associate at the International Hellenic University, who
offered me the opportunity to work on this theme and whose inspirational guidance,
great patience and constant encouragement supported me through the whole process
and propelled me to complete this work.
A lot of my gratitude goes to Dr. Eleni Heracleous, Assistant Professor at the
International Hellenic University, for the significant guidance and cheerful
encouragement for the specific accomplishment.

[3]
Abstract
This dissertation was written as a part of the MSc in Energy Systems at the
International Hellenic University.
The constant increase of Municipal Solid Waste (MSW) as a result of the population
increase, urbanisation as well as human development is a severe global issue
threatening human health, environmental sustainability. The uncontrolled deposition
of MSW in landfills without specific treatment is a serious pollution source. Although
many European countries have already conformed to the Waste Framework Directive
of the EU Parliament, which order an integrated municipal waste treatment including
Waste-to-Energy (WtE) facilities for energy recovery, Greece still faces the
uncontrolled solid waste deposition without pre-treatment and energy recovery
operations.
The aims of this thesis work are to study the modelling of a Fluidized Bed
Combustion Boiler CHP plant for energy production from MSW of Thessaloniki,
Greece, by using the COCO simulation software. Three cases with three different
pressure types of fluidized boilers have been examined. The boilers pressures that
have been studied are 2MPa, 5MPa and 10MPa. Apart from the boiler, each potential
CHP plant consists of a high and a low pressure turbine, a condenser and a low
pressure pump. Simulation models for these different cases have been developed and
validated against available experimental data.
In the first chapter of this work, an introduction takes place, concerning the main
reasons of the growth rate of Municipal Solid Waste production through years as well
as its environmental footprint and impacts on human health. Additionally, this chapter
includes the effectiveness of WtE plants of many countries in the world, not only in
waste reduction but in energy production as well. In the second chapter, a presentation
of the integrated waste treatment was developed, in conjunction with the differences
between the Greek and European waste management methods and facilities. In the
third and fourth chapter a detailed presentation of biomass conversion to energy
technologies and COCO Simulator software was manifested, respectively. Whilst, in
the fifth chapter, the parts and operation of a common FBB Biomass Combined Heat

[4]
and Power Generation (CHP) facility was presented. In the final part of this thesis,
three cases for the simulation of a FBB CHP plant for energy production from MSW
in Thessaloniki through COCO were analytically developed. The COCO results
indicated that the first case covers the total energy needs of 13.73% of the city’s
households, the second serves the 14.9%, while the third the 15.43%.

[5]
Contents 1. Introduction ............................................................................................................ 7
2. Municipal Wastes ................................................................................................. 15
2.1 Municipal Waste Definition ............................................................................... 15
2.1.1 Municipal Solid Waste .................................................................................... 15
2.1.2 Municipal Liquid Waste .................................................................................. 16
2.2 Municipal Waste Treatment ............................................................................... 17
2.2.1 Municipal Solid Waste Treatment................................................................... 17
2.2.2 Municipal Wastewater Treatment ................................................................... 19
2.3 Municipal Wastes in Europe and Greece ........................................................... 21
2.3.1 Municipal Solid Waste Treatment in Greece .................................................. 29
2.3.2 Municipal Wastewater Treatment in Greece ................................................... 30
2.4 Energy from Waste in Europe ............................................................................ 31
3. Renewable Biomass Energy ................................................................................. 34
3.1 Biomass to Energy Conversion Technologies ................................................... 36
3.1.1 Thermochemical Conversion .......................................................................... 38
3.1.1.1 Biomass Combustion ................................................................................... 39
3.1.1.2 Biomass Gasification ................................................................................... 43
3.1.1.3 Biomass Pyrolysis ........................................................................................ 47
3.1.2 Biochemical Conversion ................................................................................. 49
3.1.2.1 Anaerobic Digestion ..................................................................................... 50
3.1.2.2 Fermentation................................................................................................. 53
4. COCO Simulator .................................................................................................. 54
4.1 The Software and its Components ..................................................................... 54
4.1.1 COFE: CAPE-OPEN Flowsheeting Environment .......................................... 56
4.1.2 TEA: Thermodynamics for Engineering Applications ................................... 57
4.1.3 COUSCOUS: CAPE-OPEN Library of Unit operations ................................ 58
4.1.4 CORN: CAPE-OPEN Reaction Numeric Package ......................................... 58
4.1.5 CAPE-OPEN Applications ............................................................................. 59
5. Combined Heat and Power Generation (CHP) ..................................................... 61
5.1 Simulation Overview.......................................................................................... 62
5.1.1 Fixed Bed Boiler ............................................................................................. 62

[6]
5.1.2 Fluidized Bed Boiler ....................................................................................... 63
5.1.3 Pulverized Bed Boiler ..................................................................................... 64
5.1.4 Efficiency ........................................................................................................ 64
5.1.5 Operating Availability ..................................................................................... 64
5.2 Power Generation Technologies ........................................................................ 65
5.2.1 Steam Turbine Technologies ........................................................................... 65
6. Case Study ............................................................................................................ 68
6.1 The situation in Greece ...................................................................................... 68
6.2 The case of Thessaloniki .................................................................................... 69
6.2.1 Physical and Chemical Characteristics of MSW in Thessaloniki ................... 71
6.2.2 MSW Combustion ........................................................................................... 72
6.3 Fluidized Bed Boiler CHP in Thessaloniki ........................................................ 75
6.3.1 Fluidized Bed Boiler ....................................................................................... 75
6.3.2 Steam Turbines ................................................................................................ 76
6.3.3 Condenser ........................................................................................................ 77
6.4 Fluidized Bed Boiler CHP in Thessaloniki-COCO Simulation ......................... 78
6.5 COCO Simulation Results ................................................................................. 96
7. Conclusion ............................................................................................................ 99
Bibliography .............................................................................................................. 102

[7]
1. Introduction
Energy supports human life and it has great significance for the preservation of
human’s evolution. Energy is a convertible technological currency on which societies
depend and without which the whole system of society would collapsed. During the
evolutionary process of humanity, the upward trend of energy demand was obvious.
This demand still experiences and it will continue to meet major increase in the near
future. For centuries, fossil fuels such as oil, coal and natural gas, constitute the main
source of energy and the driving force for evolution. However, the fact that these
sources are not regenerated in short period of time in conjunction with the constant
raise of their consumption result in their rapid depletion. Despite of their exhaustion,
fossil fuels are also origins for climatic changes, greenhouse gas emissions, the global
warming of the planet, pollution of the environment and degradation of human health.
In order to struggle this situation, human turned to the RES (Renewable Energy
Sources). RES are renewable and abundant in nature and their use is considered to
contribute to the sustainable development in a variety of aspects (environmental,
economic and social). The objective is to succeed the substitution of fossil fuels by
RES as alternative and sustainable fuels. The last decades, solar energy, wind power,
hydro power, geothermal energy and bioenergy meet great development. Although to
most people solar and wind energy sound more popular, biomass is the most
renewable, sustainable and efficient in energy production source. Biomass, a term
which introduced for the first time from Eugene Adam and referred as the quantity of
every living organism from the five kingdoms in biology sector: plants, fungi, protists
(unicellular organisms like fees and micro-algae) and monerans (cells without core
like bacteria and blue-green algae), describe, today, all organic matter produced by
photosynthesis, existing on the earth’s surface. It includes all water- and land-based
vegetation and trees, and all waste biomass such as Municipal Solid Waste (MSW),
municipal biosolids (sewage), and animal wastes, forestry and agricultural residues,
and certain types of industrial wastes [1][2][3][4]. Efforts to produce energy from
second generation biofuels are made, in order to avoid the conflict between the first
generation biofuels and food supplies as well as to restrict the uncontrolled waste
disposal and volume of wastes.

[8]
The battle with human made waste is dated back many centuries, since the dawn of
civilization. When human left his wild nature and started to live in communities fulfill
his everyday activities, the issue of waste management began to take form and be the
source of severe for the humanity and environment impacts.
In many stages of human’s evolution, wastes have been a significant factor of grave
events in history. A characteristic example of the role of wastes is the plague that
struck Europe the Middle Age (1348-1350), that took a pandemic form and decimated
over one third of the European population. The so called “Black Death” was caused
mainly by a bacterium which was transported to humans by rats that were living in
wastewaters and solid wastes accumulated in the cities. From the grave plague of
Justinian in Egypt in 542AD to this in Athens in 430BC and from this to the second
pandemic in Middle East and Europe in 134AD, the grave fire in London, to Vietnam
in 1960AD, the effects of non-proper treatment of wastes are visible during the whole
historical path of humanity [5] [6].
Waste management was first introduced in Knossos, in the Greek island of Crete, in
3000BC where big fosses as well as a sewer system for rain and waste water, were
constructed in order for the solid wastes of the city to be disposed of and the waste
waters to be drained, respectively. Similarly, in Athens in 500BC, a specific law
commanded that wastes should be deposited more than a mile out of the town because
the piles of rubbish next to the city walls provided an opportunity for invaders to scale
up and over the walls [7]. Rome had similar problems, and eventually developed a
waste collection program in 14 AD [8].
For the upcoming centuries until our days, people tried to employ methods for an
integrated waste management. With the passage of time, the technics of waste
treatment have been changed in accordance with the development of consuming
products and consequently the change of the wastes’ composition with the increase of
inorganic materials such as paper, paper packaging, plastics and ferrous metals [9].
A recent report indicates that the intensive increase of urbanisation coupled with the
increase of consuming demands and technological evolution of modern societies, the
increase of industrialization, are considered to be the basic reasons for the extensive
production of municipal wastes [10]. Furthermore, it has been noticed that this the
waste production varies among countries according to their national income, GDP,

[9]
stage of development, culture, geographical and climatic conditions. More
specifically, countries with income lower than US$ 5000 generate an also low amount
of MSW (Municipal Solid Wastes) which ranges between 0.3 and 0.9 kg/capita/day.
While in higher income countries this amount ranges between 1.4 and 2.0
kg/capita/day. The linear relation between the GDP and the daily waste production
per capita for low income countries, such as India and Egypt, to medium and high
income countries like USA, is presented in Figure 1 [11].
Figure 1. Countries income and the rate of generated MSW (UNDESA, 2010).
The composition of MSW is another factor that varies among the developed and
developing countries, with the amount of organic matter, in the former, not exceeding
the average of 30% of the total produced waste, while the respective amount in the
latter reaches 58% of the total generated MSW based on the Figure 2, where the
different composition of MSW in the OPEC and non-OPEC countries is indicated
[11].

[10]
Figure 2. Characteristics of MSW streams depending on income (UNDESA, 2010).
Municipal Solid Wastes (MSW) along with Liquid Wastes consist a serious
environmental problem worldwide, because of the extensive pollution of the
atmosphere, the soil and the surface and underground aquatic systems contamination.
First of all, MSW landfills and Wastewaters can easily be infectious agents as severe
diseases such as typhus, cholera, malaria, yellow fever, hepatitis, encephalitis,
gastroenteritis, and dysentery which grow in these areas can be transmitted via
mosquitoes, flies and rats to human.
Additionally, combustible and toxic materials, such as oils, fertilizers, solvents which
produce SO2, hydrocarbons and polycyclic aromatic hydrocarbons and other
hazardous gas emissions which include methane and volatile organic compounds,
mostly hydrocarbons, feature these areas as totally carcinogenic, mutagenic and toxic
for the human health and environment. For instance, according to USEPA, in 2008
landfills contribution to total world methane production, which is a powerful
greenhouse gas, was 23% [12].
Moreover, water, groundwater and soil contamination is a consequence of the
uncontrolled leaks and disposal waste in landfills and waters that contributes in
biodegradation as well. The levels of this pollution depend on the composition of both
solid waste and sewage sludge and mostly the BOD (Biological Oxygen Demand) and
COD (Chemical Oxygen Demand) amounts. High levels of BOD determine that water
and solid quality is rapidly decomposed of biodegradable organic matter and the
0%
10%
20%
30%
40%
50%
60%
High-IncomeCountries
Middle-IncomeCountries
Low-IncomeCountries
36%
15%
5%
28%
58%
41%
9% 11%
4% 8%
3% 1%
7%
2% 2%
12% 11%
47%
Paper Organic Plastics Metals Glass Other

[11]
depletion of dissolved oxygen, while COD monitors the total organic matter [13] [14].
More specifically, Table 1 indicates the compositional ranges for numerous leachates
from MSW landfills, where the BOC, COD, TOC (Total Organic Carbon) and TDS
(Total Dissolved Solids) levels of municipal solid waste range is 480-72,500mg/l, 0-
195,000mg/l, 335,000mg/l and 584-55,000mg/l respectively. This amount of
components tends to increase over time [15] [16] [17] [18] [19].
Table 1. Chemical composition of leachate from municipal solid waste.
Parameter Concentration
range (mg/l) Parameter
Concentration range
(mg/l)
Alkalinity (as CaCO3) 0–20,850 Nitrogen (ammonia) 0–1250
Aluminum 0.5–85.0 Nitrogen (nitrate) 0–9.8
Antimony 0–3.19 Nitrogen (nitrite) 0–1.46
Arsenic 0–70.2 Nitrogen (organic) 0–1,000
Barium 0–12.5 Nitrogen (Kjeldahl) 0–3,320
Beryllium 0–0.36 Nickel 0–7.5
BOD 480–72,500 Phenol 0.17–6.6
Boron 0.413 Phosphorus (total) 0–234
Cadmium 0–1.16 Phosphate 0.01–154
Calcium 5–4,080 pH 1.5–9.5
Chloride 11,375 Potassium 0.16–3,370
Chromium 0–22.5 Selenium 0–1.85
COD 0–195,000 Silver 0–1.96
Conductivity (μmho/cm) 480–72,500 Sodium 0–8,000
Copper 0–9.9 Thallium 0–0.32
Cyanide 0–6 Tin 0–0.16
Fluoride 0.1–1.3 TDS 584–55,000
Hardness (as CaCO3) 0.1–225,000 TSS 140,900
Iron 0–42,000 TOC 335,000
Lead 0–14.2 TVA(as acetic acid) 0–19,000
Magnesium 0–115,600 Turbidity 40–500
Manganese 0.05–1,400 Sulfate 0–1,850
Mercury 0–3 Zinc 0–1,000
Organic halides 0.320–3.5 Phenols 0–4
Benzene 0.1–0.6 Toluene 0–3.2
Research also summarizes that many chemical compounds have been also detected in
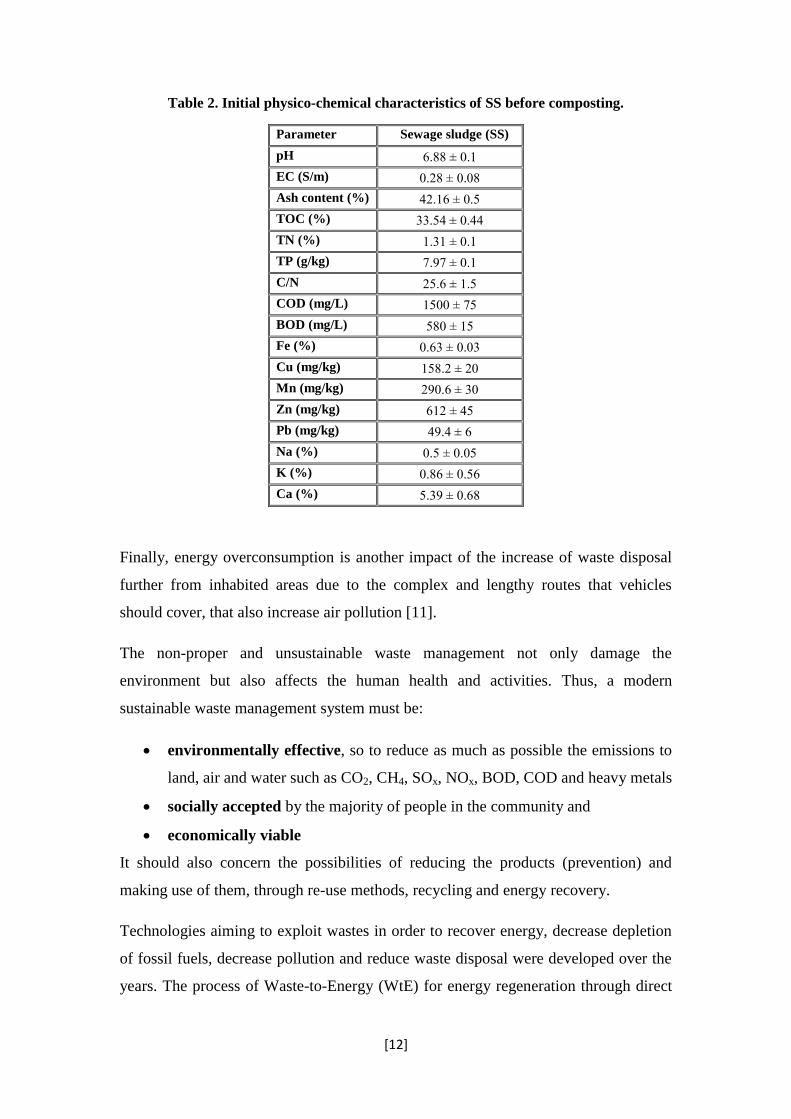
Sewage Sludge (SS) procured from sewage treatment plants. Table 2 presents the
initial physicochemical characteristics of SS, with BOD and COD to be about
580mg/l and 1,500mg/l, respectively [20].
[12]
Table 2. Initial physico-chemical characteristics of SS before composting.
Parameter Sewage sludge (SS)
pH 6.88 ± 0.1
EC (S/m) 0.28 ± 0.08
Ash content (%) 42.16 ± 0.5
TOC (%) 33.54 ± 0.44
TN (%) 1.31 ± 0.1
TP (g/kg) 7.97 ± 0.1
C/N 25.6 ± 1.5
COD (mg/L) 1500 ± 75
BOD (mg/L) 580 ± 15
Fe (%) 0.63 ± 0.03
Cu (mg/kg) 158.2 ± 20
Mn (mg/kg) 290.6 ± 30
Zn (mg/kg) 612 ± 45
Pb (mg/kg) 49.4 ± 6
Na (%) 0.5 ± 0.05
K (%) 0.86 ± 0.56
Ca (%) 5.39 ± 0.68
Finally, energy overconsumption is another impact of the increase of waste disposal
further from inhabited areas due to the complex and lengthy routes that vehicles
should cover, that also increase air pollution [11].
The non-proper and unsustainable waste management not only damage the
environment but also affects the human health and activities. Thus, a modern
sustainable waste management system must be:
environmentally effective, so to reduce as much as possible the emissions to
land, air and water such as CO2, CH4, SOx, NOx, BOD, COD and heavy metals
socially accepted by the majority of people in the community and
economically viable
It should also concern the possibilities of reducing the products (prevention) and
making use of them, through re-use methods, recycling and energy recovery.
Technologies aiming to exploit wastes in order to recover energy, decrease depletion
of fossil fuels, decrease pollution and reduce waste disposal were developed over the
years. The process of Waste-to-Energy (WtE) for energy regeneration through direct

[13]
combustion of waste or production of combustible fuels such as methane,
hydrocarbons and other synthetic fuels via incineration and gasification technologies,
is used efficiently in a worldwide scale. Until 2003, 130 million tons of MSW were
combusted every year in 600 WtE facilities all around the world [21]. Today, there are
1600 WtE facilities around the world [22].
In 2012, a World Bank’s evaluation assessed that the annual global MSW production
was 1.3 billion tons which corresponds to 1.2 kg/capita/day. This was a rough
estimation without taking into account the fact that the per capita waste generation
depends on the urbanisation and GDP levels, as it was referred above [23]. The Afval
Energie Bedrijf CHP plant in Amsterdam is a great example of WTE incineration
technology. This type of plant, which has been operated since 2007, is the largest of
its kind around the world, with 114.2 MW installed capacity, up to 30% electricity
production efficiency and with the ability to cope with large quantities of MSW that
reach the 1.5 million tons/year [24]. Likewise, China, that suffers from an atrocious
air quality motivated by the rapid ascend of population, which rised by 43% from
1978 to 2008 and subsequently the increase of the MSW generation by 55% during
the same period, succeeded 0.15 tons net emission reduction of carbon equivalent per
each ton of MSW due to WtE management of waste in 2003 [23]. Today, the 17%
China’s total amount of produced MSW (23 million tons) is processed in the
approximately 100 WtE plants that the country occupies [25] [26]. Regarding the
emissions generated, According to a field study in various major cities in the country,
the WTE plants have significantly low emissions of dioxins and mercury, which were
far beneath the EU 2010 standards [26].
In general, since 17th
of June 2008, the EU Parliaments considers the WTE as an
energy recovery operation, with Switzerland, Sweden, Netherlands, Denmark,
Germany, France and Belgium being the first countries applied this method. [27].
This technology is confirmed to be an effective solution for the waste management
issue and environmental friendly, in the same time [27].
As reported by the Confederation of European Waste to Energy Plants (CEWEP), in
2009, 70 million of MSW were preceded in WtE facilities all around Europe,
producing electricity of 28 billion kWh and heat of 70 billion kWh, which estimated
to substitute 7 to 38 million tons of fossil fuels (gas, oil, hard coal and lignite).
[14]
Replacing these fossil fuels, WtE plants are able to provide with electricity and heat
about 13 million and 12 million inhabitants per year, respectively [28]. On the
contrary, Greece is quite behind the evolution. In our country, nearly the only method
of MSW management is the disposal to waste landfills. Hence, we must conform to
the new EU Directive 2008/98 which prescribes that WTE must be included in the
Waste Treatment process in all Europe [27].
Greece lacks of development not only in waste treatment but in energy production
from biomass as well. The uncontrolled disposal of huge amounts of solid and liquid
wastes burdens the country environmentally, socially and also economically.
Contamination of soil, water and air along with the jeopardization of people’s health
and also the expenses of energy imports and fines charged due to non-conforming
with the European’s regulations, are considerable issues society has to cope with. In
2010, the contribution of biomass in the total energy production from RES was
1.13%, with 0.81TWh produced energy. The country aims is reach the goal of
generating of 1,745GWh of electricity, 1,222,000 toe (tons of oil equivalent) for
heating and cooling and 617,000 toe of biofuels, until 2020 [29] [30]. These
promising steps, in the energy sector intent to exploit agricultural, animal, industrial,
forestry residues and industrial and municipal wastes in order to produce biofuels and
energy of about 23TWh until 2020 as well as contributing to the energy requirements
of the country, which were reported to be approximately 56.4TWh, in 2012, in sectors
of industry, household, agriculture and electricity production [29].
Hence, in response to these ambitions the objective of the thesis is to identify the
current situation of Waste Management in Greece and evaluate the potential of energy
production from municipal wastes and other alternative fuels, in Greece via WTE
technology, which, as in many countries in the world, should be a major part of the
modern integrated waste management system, in order to generate renewable energy
for use and contribute to the reduction of the waste amount and the pollution volume,
as well. The case study of the thesis concerns the modelling of an energy production
system from alternative fuels through the COCO (CAPE-OPEN to CAPE-OPEN)
Simulator software for the design and operation of chemical processes and finally the
presentation and assessment of those results.

[15]
2. Municipal Wastes
2.1 Municipal Waste Definition
Municipal Wastes are either solid or liquid wastes produced in urban areas,
commercial facilities and institutions. The term “waste” depicts an unwanted and
undesirable material [31] [32].
The organic portion of municipal solid wastes as well as the dried sludge resulting
from the biological waste water treatment is characterized as municipal waste
biomass, which is biodegradable [33] [34]. As reported by Eurostat in 2012, the
definition of Municipal Waste describes the wastes generated by households as well
as other similar waste sources such as the commercial sector, offices and public
institutions. The amount of municipal waste produced consists of waste collected by
or on behalf of municipal authorities and disposed of via the waste management
system of the society [35].
2.1.1 Municipal Solid Waste
Municipal Solid Waste (MSW), due to its composition, can be classified into (a)
Organic Solid Waste (OSW) and (b) Inorganic Solid Waste (ISW). Organic Solid
Waste or Biodegradable Municipal Solid Waste (BMSW) is waste from households
and commercial activities that can undergo a biological decomposition process. This
category includes food and garden wastes, paper and cardboard. Inorganic Solid
Waste is characterized by non-biodegradable matter, which on the other hand can be
combusted depending on the nature of the material they constitute. This category
constitutes rocks, plastics, metals, glasses etc. [31] [32].
Solid wastes can generally be categorised in municipal solid waste, construction waste
and special waste as Figure 3 demonstrates. These groups can also be categorised
further. According to the Directive 99/31/EC, the Municipal Solid Waste term
includes the household and other waste of similar nature and composition, such as
waste from commercial activities, offices and institutions (schools, hospitals,
government buildings etc.). It also includes bulky waste (mattresses, furniture etc.)
and garden waste, leaves, twigs, vegetables, as well as waste from cleaning the streets.

[16]
Manure and dry sludge from sewage treatment also are included in urban waste [34]
[35].
Figure 3. Solid Waste Classification.
2.1.2 Municipal Liquid Waste
Municipal Liquid Wastes, also known as wastewaters or sewage are produced from
the urban environment and consist of:
(a) Sanitary Sewage which is the domestic sewage that includes human wastes from
toilets, baths, laundry, lavatory, and kitchen wastes from homes, public buildings ,
commercial and industrial facilities. Sanitary Sewage consists of 99.9% of water
and 0.1% of impurities. In general, the pre-treated Sanitary Sewage is
characterized by a BOD at 200-250 mg/l, a COD at around 500 mg/l and TSS at
220-240 mg/l along with 35 mg/l of N and 10 mg/l of P and a great amount of
pathogenic bacteria.
(b) Industrial Sewage which is produced from manufacturing activities and it contains
360-14,000 mg/l BOD, 1,400-21,100 mg/l, a COD and 540-1,250 mg/l TSS. The
range of the concentrating values depends on the type of industry that generates the
wastewaters.
(c) Storm Sewage which is wastewaters by rainfalls, and which transports organics,
suspended and dissolved solids, and other ferrous substances [36] [37].
[17]
2.2 Municipal Waste Treatment
Due to the excessive air and soil pollution as well as the surface water and ground
water contamination along with the overconsumption of water and energy the
European Parliament introduced two critical Directives. In 23 October 2000,
European Parliament established the EU Water Framework Directive (Directive
2000/60/EEC) in the field of water policy in order to secure good quality and quantity
of all water bodies, including marine waters up to one nautical mile from shore, by
2015. Additionally, in 17 June 2008 the Waste Framework Directive (Directive
2008/98/EEC) was introduced and it inserted the term of “waste hierarchy” in order to
promote and set as priority the waste prevention and as ultimate step the waste
disposal, and mainly landfilling, of an amount of wastes as reduced as possible [35]
[38] [39].
2.2.1 Municipal Solid Waste Treatment
The integrated municipal waste management system that was defined with the Waste
Framework Directive, includes an optimized collection system, the reduce of waste
production, implemented transportation systems, sorting at source, recycling of the
separated materials, economically effective transshipping system with the ultimate
goal the energy recovery, the reuse of the materials and the final disposal of the
residual and the reduced volume materials to contemporary Residues Landfills (RL).
The “waste hierarchy” and the connection between these processes are presented in
Figure 4 [40].
According to Ministerial Law 29407/3508 “the waste disposal in SL, with no further
processing, is not permitted”. In accordance with this waste processing is defined as
the sorting at source, the mechanical sorting in centers of sorting of recyclable
materials, the transshipping and packaging, the thermochemical and biochemical
conversion technologies and the final disposal at landfills [33] [34]. In general the
basic steps for an integrated municipal solid waste treatment are:

[18]
Figure 4. Connection between the subsystems of a solid waste treatment system.
(a) Prevention and Reduction
Prevention is one of the most important methods to reduce the quantity of waste
produced in its source. It contributes to the minimization of the quantity, the cost of
the subsequent management and environmental impacts of uncontrolled waste
disposal. Prevention and reduction can be succeeded by being applied during the
whole life cycle process of products, through the design, production, packaging and
distribution of products with the lowest possible volume, toxicity and highest life time
[32] [40].
(b) Reuse
With reuse process discard materials can be reproduced for use and consequently the
quantity of wastes is decreased. It more preferable to recycling as it does not require
the same material to undergo through a detailed treatment process thus reducing the
needs for energy and material usage [32] [40].
(c) Recycling
Recycling includes a treatment of discard waste materials in order to be reused in an
advanced or their initial form. Although it concerns the treatment of organic wastes
for reuse it excludes energy recovery. The advantage of this process is that there is a
variety of material that can be recycled [32] [40].

[19]
(d) Energy Recovery
Energy recovery from wastes is the process of producing energy in the form of
electricity, heat and fuels. This process offers the possibility to reduce significantly
the volume of waste disposed in landfills, pollution and secure energy supplies. The
last few decades waste to energy technologies have been developed for integrated
municipal waste treatment. Biomass from waste can be used to meet energy needs
such as heating, cooling, electricity, etc. either by direct combustion, either by
transforming into gases, liquids and/or fossil fuels through thermochemical or
biochemical processes [41] [42].
1. Thermochemical Conversion
Biomass Combustion/Incineration
Biomass Gasification
Pyrolysis
2. Biochemical Conversion
Anaerobic Digestion
Aerobic Digestion
In the following chapter these conversion technologies will be explained.
(e) Disposal/Landfilling
The final stage of an integrated municipal waste treatment is the residue disposal in
landfills. There are wastes no more but residues generated from the whole treatment.
The reduced, non-toxic and remediated residues are disposed in residue landfills with
fewer impacts.
2.2.2 Municipal Wastewater Treatment
The methods of wastewater treatment are divided in four main categories and
illustrated in Figure 5:
(a) The Preliminary Treatment

[20]
During this stage, the removal of coarse solids and other large materials in most cases
found in wastewaters, takes place. Coarse screening and grit removal are the
operations occur in this first stage for medium to large wastewaters treatment plants.
In case of smaller facilities the latter activity is not included. The solid materials are
removed in the form of sludge and disposed in landfills.
(b) Primary treatment
During primary treatment, sedimentation and skimming occur in order to remove
sedimentary organic and inorganic solids and floating materials respectively. In most
cases this primary unit includes biological treatment via anaerobic digestion process,
during which gases are produced and contain approximately 60-65% methane that can
be used as energy recovery source. The advantage of this stage treatment is the
removal of 25-50% of BOD, 50-70% TSS and 65% TOC.
(c) Secondary/Biological treatment
Primary treatment could be considered sufficient in case of wastewaters from
irrigation. However, in case of human liquid wastes a secondary treatment, for a
further treatment, is requisite. In essence, this second unit is a subsequent biological
process to the former aiming to remove organic matter and solids residues via an
aerobic digestion process. The combination of primary sedimentation and secondary
biological treatment offers a final effluent free of organic and inorganic sediments,
material and heavy metals. A typical combined unit discards approximately 85% of
BOD and TSS.
(d) Tertiary/Advanced Treatment
Activated sludge consisted of components that are not removed through the secondary
treatment, such as nitrogen, phosphorus, additional suspended solids, refractory
organics, heavy metals and dissolved solids can be discharged in the tertiary
treatment. Sometimes, tertiary treatment can be a combination of the two preceding or
used to replace the secondary one.
Final step of municipal wastewater treatment is the disinfection of the sludge by
injecting chlorine solution at the head end of a chlorine contact basin. The final dried

[21]
sludge disposed eventually in landfills or reused as fertilizers, or as forests, parks and
gardens recreation. [31] [37] [43] [44].
Figure 5. Municipal Wastewater Treatment.
2.3 Municipal Wastes in Europe and Greece
Since 1995, the application of the waste policy and the introduction of an advanced
municipal waste system in accordance with the technology developments have
resulted in great performances, in the waste management sector, in the majority of the
countries all around the world. More specifically, according Eurostat’s data
publication, given in Table 3, the evolution of municipal waste production in Europe
from 1995 to 2013, the progress in waste reduction in many countries in Europe is
obvious. More conveniently, Figure 6 places in decreasing order countries by their
municipal waste generation for the 2003 to 2013 period [35] [45].

[22]
Table 3. Municipal waste generated by country in selected years (kg per capita).
1995 1999 2003 2007 2010 2013
change (%)
1995-2013
EU28 523 503 481
EU27 473 511 514 524 504 481 2%
Belgium 455 465 468 494 455 439 -4%
Bulgaria 694 598 603 553 554 432 -38%
Czech Republic 302 327 280 294 318 307 2%
Denmark 521 577 598 707 673 747 43%
Germany 623 638 601 582 602 617 -1%
Estonia 371 412 414 449 305 293 -21%
Ireland 512 577 730 772 624 586 14%
Greece 392 427 448 531 506 51%
Spain 510 613 646 578 510 449 -12%
France 475 507 506 543 533 530 12%
Croatia 399 379 404
Italy 454 498 524 557 547 491 8%
Cyprus 595 620 670 704 696 624 5%
Latvia 264 256 304 391 324 312 18%
Lithuania 426 351 389 419 404 433 2%
Luxembourg 587 646 678 695 679 653 11%
Hungary 460 483 464 457 403 378 -18%
Malta 395 476 580 654 601 570 44%
Netherlands 539 582 586 606 571 526 -2%
Austria 437 563 607 597 562 578 32%
Poland 285 319 260 322 316 297 4%
Portugal 352 433 449 471 516 440 25%
Romania 342 314 353 391 324 272 -20%
Slovenia 596 550 418 525 490 414 -31%
Slovakia 295 261 281 294 319 304 3%
Finland 413 484 466 506 470 493 19%
Sweden 386 428 464 493 445 458 19%
United Kingdom 498 569 591 567 509 482 -3%
Iceland 426 454 484 558 306 345 -19%
Norway 624 594 402 491 469 496 -21%
Switzerland 600 635 667 720 708 702 17%

[23]
As it is noticeable from Table 3 and Figure 6 above, there is a significant variation of
the amount of municipal waste produced between the countries. For instance
Denmark displays a waste production of 747kg/capita while Romania exhibits an
amount of 272kg/capita for the same year period, 2013 [45].
Figure 6. Municipal waste generated by country in 2003 and 2013, sorted by 2013 level
(kg/capita).
These variations mainly reflect differences in consumption motives and economic
growth between the countries, but also depend on the way that municipal waste is
collected and managed. These variations are due to a combination of reasons such as
the different composition of municipal waste. This means that a country with high
bulky or garden waste content in its municipal waste composition will appear to
produce more wastes than another country which excludes these parts. Moreover, the
differences regarding the sources of wastes are also an explanation for these
variations. For example, some countries include only waste from households, while
other countries include waste from commercial activities, trade, administration and
offices collected and managed along with households’ waste. Additionally, the
collecting and managing system also varies from place to place, so some countries
may include separately packaging waste from households, in contrast with other
countries which do not [35] [45].

[24]
Table 4. Municipal waste generated by country in selected years (kg/capita).
GEO/TIME 2005 2006 2007 2008 2009 2010 2011 2012 2013
Denmark 662 666 707 741 693 673 789 759 747
Cyprus 688 694 704 728 729 696 683 670 624
Ireland 731 792 772 718 651 624 617 587 586
Luxembourg 672 683 695 697 679 679 666 652 653
Malta 623 624 654 674 649 601 589 588 570
Netherlands 599 597 606 600 589 571 568 549 526
Austria 575 597 597 600 590 562 573 579 578
Bulgaria 588 577 553 599 598 554 508 460 432
Germany 565 564 582 589 592 602 614 619 617
Italy 546 559 557 552 543 547 529 504 491
Spain 588 590 578 551 542 510 485 468 449
Slovenia 494 516 525 542 524 490 415 362 414
France 530 536 543 541 535 533 538 535 530
United Kingdom 581 583 567 541 522 509 491 477 482
European Union
(28 countries) 516 522 524 521 511 504 498 489 481
Finland 478 494 506 521 480 470 505 506 493
Portugal 452 465 471 518 520 516 490 453 440
Norway 426 459 491 487 470 469 485 477 496
Sweden 477 490 486 483 470 439 451 452 453
Belgium 483 485 494 479 467 456 456 450 439
Greece 437 443 448 454 461 531 503 506 510
Hungary 461 468 457 454 430 403 382 402 378
Lithuania 387 405 419 428 381 404 442 445 433
Croatia 336 384 399 415 405 379 384 391 404
Romania 383 396 391 411 381 324 268 271 272
Estonia 433 398 449 392 339 305 301 280 293
Latvia 320 343 391 345 352 324 350 301 312
Poland 319 321 322 320 316 316 319 317 297
Slovakia 273 284 294 313 307 319 311 306 304
According to Table 3 and Figure 6, we can observe that 18 of the 31 countries
displayed an increase in municipal waste produced per capita from 1995 to 2013,
whereas 6 of them had a relatively steady raise. Greece’s data stars from 1996, where
it recorded the highest average annual growth rates at 2.3%, followed by Malta and
Denmark at 2.1% and 2.0% respectively. For the remaining countries the total
increasing trend was stabilized around 2003 and 2007. For instance, in Austria,
Ireland and Sweden, the amounts were stabilized around 2003 and start falling
slightly between 2003 and 2013. The fluctuation in waste generation observed these
years is due to the economic situation, the population growth and the operation of an
efficient or inefficient waste management system [35] [45]. Additionally, as the
technics for a municipal waste management system were completed after 2004, we
notice such dissimilarities over the years. The data from 2005 to 2013 in Table 4 are
defined more accurate [35].
[25]
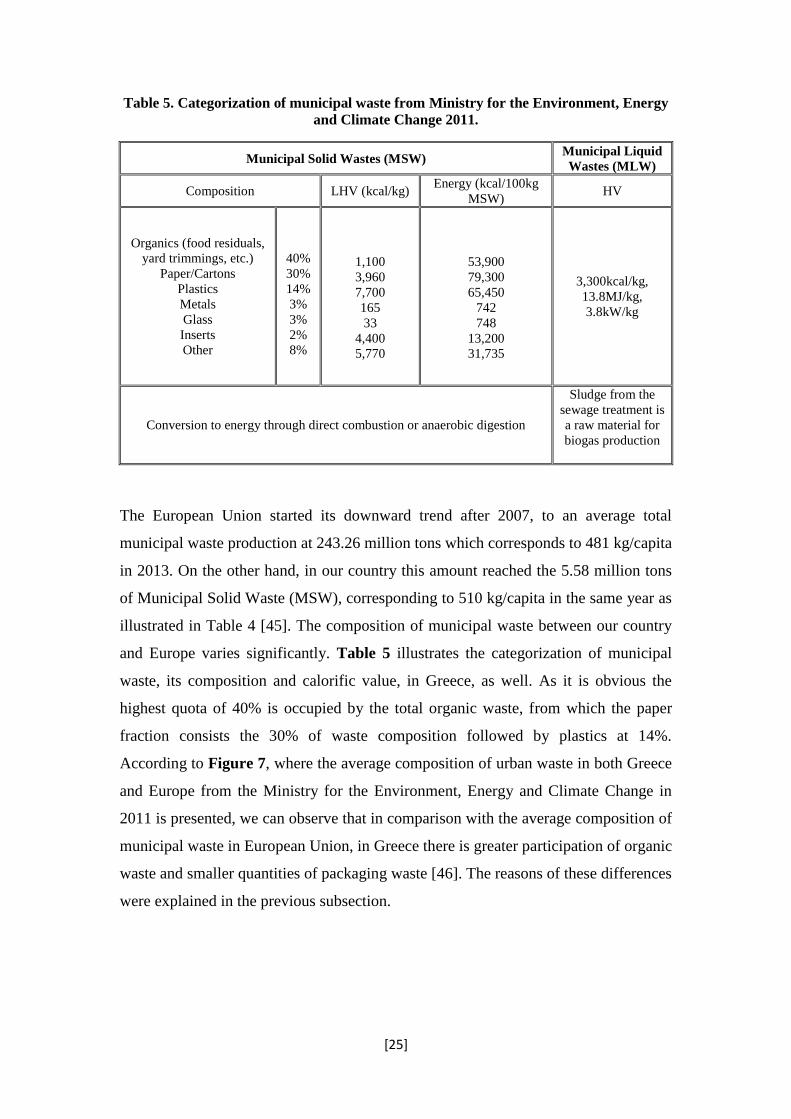
Table 5. Categorization of municipal waste from Ministry for the Environment, Energy
and Climate Change 2011.
Municipal Solid Wastes (MSW) Municipal Liquid
Wastes (MLW)
Composition LHV (kcal/kg) Energy (kcal/100kg
MSW) HV
Organics (food residuals,
yard trimmings, etc.)
Paper/Cartons
Plastics
Metals
Glass
Inserts
Other
40%
30%
14%
3%
3%
2%
8%
1,100
3,960
7,700
165
33
4,400
5,770
53,900
79,300
65,450
742
748
13,200
31,735
3,300kcal/kg,
13.8MJ/kg,
3.8kW/kg
Conversion to energy through direct combustion or anaerobic digestion
Sludge from the
sewage treatment is
a raw material for
biogas production
The European Union started its downward trend after 2007, to an average total
municipal waste production at 243.26 million tons which corresponds to 481 kg/capita
in 2013. On the other hand, in our country this amount reached the 5.58 million tons
of Municipal Solid Waste (MSW), corresponding to 510 kg/capita in the same year as
illustrated in Table 4 [45]. The composition of municipal waste between our country
and Europe varies significantly. Table 5 illustrates the categorization of municipal
waste, its composition and calorific value, in Greece, as well. As it is obvious the
highest quota of 40% is occupied by the total organic waste, from which the paper
fraction consists the 30% of waste composition followed by plastics at 14%.
According to Figure 7, where the average composition of urban waste in both Greece
and Europe from the Ministry for the Environment, Energy and Climate Change in
2011 is presented, we can observe that in comparison with the average composition of
municipal waste in European Union, in Greece there is greater participation of organic
waste and smaller quantities of packaging waste [46]. The reasons of these differences
were explained in the previous subsection.

[26]
Figure 7. Composition of MSW in Greece and EU from Ministry for the Environment,
Energy and Climate Change.
MSW differ in terms of quantity and quality. The main factors affecting this variety
are the demographic characteristics of each region, the macroeconomic data, such as
GDP and consumption, the technological development, the seasoning and the standard
of living [47] [48]. A great example of this variation is evident in Figure 8 with the
percentage of the participation of regions in the national production of municipal
waste. According to this, the highest MSW production occurs in Attica and especially
in the capital city, Athens, where the daily production is around 6,500 tons. Attica
produces a total of 2.4 million tons annually, from which 95% is deposited in the Ano
Liosia Sanitary Landfill, which is already overloaded and which, despite the decision
and studies in order to be abolished, is still in arbitrary operation. In fact there is a
supplementary landfill, the Filis Sanitary Landfill, which is adjacent to the former,
thus the problem continues to exist [49] [50] [51]. Attica produces the highest amount
of MSW, at 43.75%, in the whole country, followed by Central Macedonia at 16.39%
[34] [50].

[27]
Figure 8. Percentage of the participation of regions in the national production of municipal
waste from Ministry of Environment, Planning and Public Works, 2012.
Today, in Greece, the daily generation of MSW is about 15.000 tons which
corresponds to about 5.58 million tons of Municipal Solid Waste (MSW) that are
produced annually [52] [53]. This amount is higher than the predicted amount of 5.2
million tons that our country would have reached in 2016 [51] [54]. Hence we can
understand that the problem of the MSW rise is still crucial despite the efforts for
reduction through recycling.
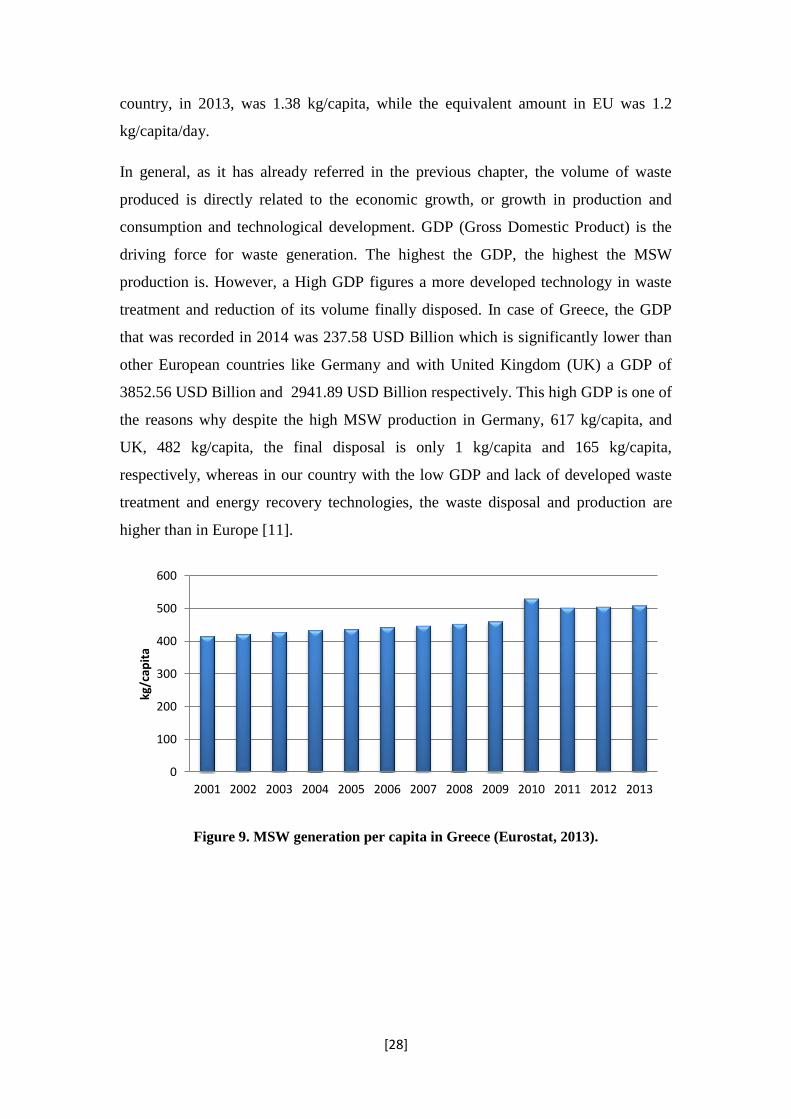
Over time, the increase of urbanisation, the evolution of the great urban centers and
the rise of living standards result in increasing consumers’ habits and demands which
leads to an aggressive growth of MSW production. In essence, since 2001 to 2009 the
production of MSW in Greece displayed a constant increase of about 75,000 tons per
year, which corresponds to 1.5% increase annually. As Figure 9 indicates, there has
been recorded an increase from 416 kg of MSW/capita in 2001 to 531 kg MSW/capita
in 2010 [50]. According to Eurostat in 2013, the total MSW production in European
Union was 219 million tons annually with 481 kg per year per inhabitant, while
Greece generated annually 5.2 million tons of MSW, with an average production of
506 kg MSW/capita/year [55]. This means that the production of municipal solid
waste in our country corresponds to 7.4% of the total production in Europe [47]. More
specifically, the average daily production of municipal waste per capita in our
0%
5%
10%
15%
20%
25%
30%
35%
40%
45%
[28]
country, in 2013, was 1.38 kg/capita, while the equivalent amount in EU was 1.2
kg/capita/day.
In general, as it has already referred in the previous chapter, the volume of waste
produced is directly related to the economic growth, or growth in production and
consumption and technological development. GDP (Gross Domestic Product) is the
driving force for waste generation. The highest the GDP, the highest the MSW
production is. However, a High GDP figures a more developed technology in waste
treatment and reduction of its volume finally disposed. In case of Greece, the GDP
that was recorded in 2014 was 237.58 USD Billion which is significantly lower than
other European countries like Germany and with United Kingdom (UK) a GDP of
3852.56 USD Billion and 2941.89 USD Billion respectively. This high GDP is one of
the reasons why despite the high MSW production in Germany, 617 kg/capita, and
UK, 482 kg/capita, the final disposal is only 1 kg/capita and 165 kg/capita,
respectively, whereas in our country with the low GDP and lack of developed waste
treatment and energy recovery technologies, the waste disposal and production are
higher than in Europe [11].
Figure 9. MSW generation per capita in Greece (Eurostat, 2013).
0
100
200
300
400
500
600
2001 2002 2003 2004 2005 2006 2007 2008 2009 2010 2011 2012 2013
kg/c
apit
a

[29]
2.3.1 Municipal Solid Waste Treatment in Greece
In Greece, until the end of 1990, we could meet an uncontrolled disposal of MSW in
waste disposal sites. Few years later the first system of collection and transportation
of MSW was introduced, while the first waste management sites started to be
constructed. Today, the majority of Greece’s regions occupy integrated collection and
transportation waste systems.
The problem is that in Greece, as in many other European countries, the most
common and basically the dominant method of Municipal Solid Waste management
still remains the territorial disposal, with no further processing. More accurately, the
main projects constructed in the country, for this purpose, are the Sanitary Landfills
(SL) and the Uncontrolled Waste Disposal Sites (UWDS). In 2001, the total amount
of MSW landfilled was the 91%, while only the 8% was recycled. More recently, in
2010, this amount was decreased by 10% and reached the 81% as recycling, was
increased, after 2007, at 20% of the total produced MSW [33] [34] [52]. From 2007 to
2013 the 81% of MSW ends up to the 71 SL that the country occupies [56] [57].
In case of UWDS, the open dumping of wastes causes adverse effects on the
environment, the human’s health as long as other disturbances (aesthetic, fumes etc.).
Thus, according to the institutional framework the operation of UWDS was
characterized as extremely hazardous and it should be prohibited. The Ministry for the
Environment, Energy and Climate Change established the National Plan of Solid
Waste Management, which was instituted by Ministerial Law 50910/2727/03 (FEK
1909B’) and set a clear timetable for this elimination until 2008. Hence, the UWDS
started to be replaced gradually by modern SL, with an initial goal of the temporary
operation of a single uncontrolled disposal space per Municipality and eventually the
gradual elimination by 2008. The program of replacement of UWDS is still in full
progress with 293 UWDS still operating, for which the fine from the EU is 54.450 per
day, and 2.291 in restoration process [56] [58] [59] [60].
According to Eurostat 2012, in Europe, the 27% and 15% of the treaded municipal
waste was recycled and composted respectively, while the 34% was landfilled and the
24% was incinerated. The highest amounts of municipal waste treatment are recorded
in Germany (65%), Austria (62%), Belgium (57%) and Netherland (50%). Regarding
[30]
incineration of waste, dominant countries are Denmark and Sweden (52%), followed
by Netherland (49%), Belgium (42%) and Luxembourg (36%) [61].
2.3.2 Municipal Wastewater Treatment in Greece
Today, in Greece, it is estimated approximately 350 Municipal Wastewater Treatment
Plants (MWTP) to be occupied and serve about 65% of the permanent inhabitants of
the country. From this amount about the 88% are activated sludge plants, 10% natural
systems, and 2% attached growth while 1% provides primary treatment. From the
activated sludge plants the 85% are extended aeriation systems, 10% are conventional
systems and 5% are sequencing batch reactors. Extended aeriation is the technology
the most dominant and suitable to the climate of our country in order to succeed
efficient sludge decomposition. Regarding the disposal of the treated effluent, in
Greece for many decades, sea outfalls were being used, as the majority of MWTPs
was built in short distances from the sea shores. Depending on the location of plants
the discharge occurs either in rivers and lakes or in agricultural and forest lands. The
80% of treated sludge from MTWPs is disposed to landfills, including 10% curtilage,
6% reuse for agriculture and 4% forestry. From statistic surveys the production of dry
sludge in Greece reaches the 43 g DS/capita/day. As it is obvious, landfilling is the
most dominant method for sludge treatment as well. There is no specific legislation in
order for reuse or further treatment to be promoted.
The sludge produced from the anaerobical stabilization MWTPs, consists more than
80% of the total sludge. As studies have indicated this amount of sludge could be
reused for agricultural activities. Also through anaerobic digestion, biogas could be
produced [62] [63] [64] [65].
But this situation resulted in Greece facing European Union Court of Justice due to
the failure of ensuring that municipal wastewaters are properly treated and complying
with Directives. In European Union, all Member States must conform to the
Municipal Wastewater Treatment Directive (91/271/EEC), which requires sufficient
collection and treatment systems for municipal sewage. In 2010, our country received
the first warning about this case concerning areas with population range from 2,000 to
15,000. From 1991, when the legislation was introduced to 2000 member states
should ensure adequate urban wastewater treatment from large towns and until 2005
[31]
from smaller ones. Greece did not accomplish to present complete reports as eight
areas (Prosotsani, Doxato, Eleftheroupoli, Galatista and VagiaPolichronou, Chanioti
and Desfina) were still lacking of desirable treatment facilities. This was considered
by the Commision as a failure [66] [67].
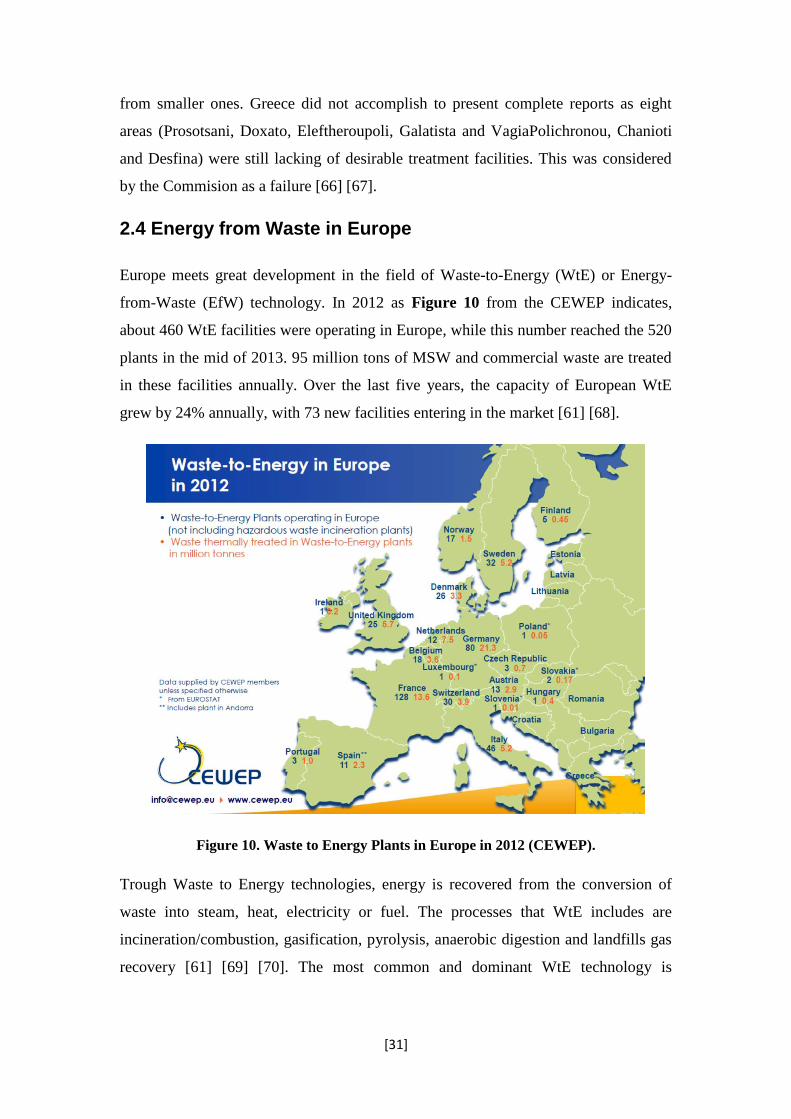
2.4 Energy from Waste in Europe
Europe meets great development in the field of Waste-to-Energy (WtE) or Energy-
from-Waste (EfW) technology. In 2012 as Figure 10 from the CEWEP indicates,
about 460 WtE facilities were operating in Europe, while this number reached the 520
plants in the mid of 2013. 95 million tons of MSW and commercial waste are treated
in these facilities annually. Over the last five years, the capacity of European WtE
grew by 24% annually, with 73 new facilities entering in the market [61] [68].
Figure 10. Waste to Energy Plants in Europe in 2012 (CEWEP).
Trough Waste to Energy technologies, energy is recovered from the conversion of
waste into steam, heat, electricity or fuel. The processes that WtE includes are
incineration/combustion, gasification, pyrolysis, anaerobic digestion and landfills gas
recovery [61] [69] [70]. The most common and dominant WtE technology is

[32]
incineration. Thermal technologies of gasification and pyrolysis are not so popular
and wide used and are still in initial stages of evolution [23] [69] [70].
Waste incineration plants exploit the energy content of MSW to produce electricity,
steam, heating and fuels while both reducing waste’s volume by 90%. The aim of
technology is to reduce the biodegradable content of municipal waste, eliminate the
production of methane, reduce dependence on energy imports, enhance economy and
secure the energy supply by replacing the use of fossil fuels from conventional power
plants with waste as alternative fuel [61] [69] [70].
An example of the way that this technology contributes in all these aims is
Netherland. Regarding the CEWEP Country Report for Netherland for the period
2012-2013, the country produced totally 9.5 million tons of MSW, from which the
50% was recycled, the 23% was incinerated and less than 0.5% was landfilled.
Netherlands occupies 12 WtE units and 6 dedicated RDF units that treated thermally
7.48 million tons of waste in 2013 and produced 4.67TWh/year. The country exported
3.95TWh of electricity and 2.02TWh of heat in the same year period. Due to the flue
gas cleaning system and the bottom ash system of this technology the total residues
production was 1.7 million tons from which the 100% was recycled and reused in
road construction, cement production, construction block fabrication, and landfill [61]
[71].
Table 6 demonstrates reported results of Eurostat in order to comprehend the scale of
discrepancy between Europe and Greece regarding waste management and energy
recovery potential. It is noticeable that the development of an integrated municipal
waste management in Europe reduced the volume of wastes by approximately 7%
from 2005 to 2013, while the waste disposal was reduced by 34%, and the total
incineration including energy recovery was increased by 25.5% during the same
period. However the adverse situation was observed in our country, where the waste
generation was increased by 17%, the waste disposal by 7%, while no exploiting for
energy recovery occurred [45].

[33]
Table 6. Waste Management in EU and Greece.
Waste generated (kg/capita)
2005 2006 2007 2008 2009 2010 2011 2012 2013
European Union 516 522 524 521 511 504 498 489 481
Greece 437 443 448 454 461 531 503 506 510
Landfill / disposal (kg/capita)
European Union 221 220 214 200 193 184 168 156 146
Greece 387 386 358 374 374 440 412 408 412
Total waste treatment (kg/capita)
European Union 483 495 502 501 497 491 485 476 471
Greece 439 443 448 454 461 531 503 506 510
Total incineration (including energy recovery) (kg/capita)
European Union 98 104 105 110 112 114 120 118 123
Greece 0 0 0 0 0 0 0 0 0
According to CEWEP a WtE plant saves CO2 between 100 and 450 kg CO2 eq /ton of
waste processed, depending on the waste composition, the amount of heat and
electricity supplied and the country energy substitution mix. In case of WtE replacing
landfilling, there would be further savings of 200-800 kg CO2/ton wastes. The
environmental effect of the WtE plants is the reduction of carbon emissions. Although
the emission of MSW incineration is 1,671 kg CO2/MWh, which is greater than this
of coal at 1,020 kg of CO2/MWh, less than 50% of those carbon emissions contribute
to climate change. In fact only 835.5 kg CO2/MWh considered to be emitted and
correspond to emissions from biogenic sources [72].

[34]
3. Renewable Biomass Energy
Article 3 of the RES Directive (2009/28/EC), of the European Parliament and the
Council on the promotion of the use of energy from renewable sources and amending
and subsequently repealing Directives 2001/77/EC and 2003/30/EC, contains the
definition of biomass. The definition defines: “Biomass means the biodegradable
fraction of products, waste and residues from biological origin from agriculture
(including vegetal and animal substances), forestry and related industries including
fisheries and aquaculture, as well as the biodegradable fraction of industrial and
municipal waste; it includes bio-liquids and biofuels.” This definition is
supplemented by two new definitions, also taken from the RES-D: “bio-liquids means
liquid fuel for energy purposes other than for trans-port, including electricity and
heating and cooling, produced from biomass.” and “'biofuels means liquid or
gaseous fuel for transport produced from biomass”.
Biomass is a term used to describe all organic matter produced by photosynthesis,
existing on the earth’s surface. It includes all water- and land-based vegetation and
trees, and all waste biomass such as municipal solid waste (MSW), municipal
biosolids (sewage), and animal wastes (manures), forestry and agricultural residues,
and certain types of industrial wastes. The world's energy markets have relied heavily
on fossil fuels. Biomass is the only alternative natural energy-containing carbon
resource with such large quantity that can be used as a substitute for fossil fuels [73].
Energy from biomass has always been a significant factor in the evolutionary root of
human. For many decades biomass was, and still is for many countries, the main
energy source of the basic domestic needs such as cooking, heating water and air,
mainly in the form of wood. Today, biomass is considered to correspond to the 10-
14% of the world’s energy production [74] [75].
Although there are more developed technologies in order to extract biomass and
convert it into useful energy, the intrusion of fossil fuels with their high economic
advantages and energy efficiencies caused the reduction of biomass energy usage. But
the eventual depletion of fossil fuels coupled with their severe impacts on the
environment, brought biomass back to the fore [73].

[35]
Biomass, in comparison with fossil fuels, is considered to be a totally renewable
source of energy as it can be replenished in a relatively short period of time [74].
Moreover, the burning of biomass, due to its life cycle and origins, does not
contribute to the greenhouse effect –zero balance CO2– as the amount of CO2 released
during this process has already been captured from the atmosphere to generate
biomass as presented in Figure 11. Biomass, consists mainly of carbohydrates, and is
produced by the reaction of CO2 in air, water and sunlight, through the photosynthesis
process. The energy stored in biomass can be extracted through a variety of
conversion technologies that cause the oxidization of its components in order to
produce CO2 and H2O. The process is cyclical, as the CO2 is then available to produce
new biomass [75].
Figure 11. Life Cycle of Biomass.
The usage of biomass for energy production also contributes to in avoiding the
emission of Sulphur dioxide (SO2) generated during the combustion of fossil fuels
that contributes to the phenomenon of "acid rain". The Sulphur content of biomass is
practically negligible [73].
The reduction of energy dependency from third countries, by decreasing fuel imports
of fuel, with a corresponding foreign exchange savings, is also one of the advantages

[36]
of the exploitation of energy from biomass. Biomass, finally, contributes to regional
development by securing and avoiding de-population of rural areas in border and
other agricultural areas [75].
Today, the use of biomass to recover energy is extremely widespread in both OPEC
and non-OPEC countries. Developing countries produce about one third of their
energy from biomass. About 2.5 billion people depend essentially on biomass to meet
their needs for heating, lighting and cooking [73] [74] [76].
Furthermore, biomass covers a significant part of the energy needs in developed
countries as well. Hence, in U.S. biomass covers about 4% of its primary energy
needs, in Sweden 13% and in Canada 7-8% of the final energy demands [76].
3.1 Biomass to Energy Conversion Technologies
The energy that derives from the specialized treatment of biomass resources is the so
called “bioenergy”. Bioenergy includes all forms of fuel produced by the conversion
of biomass, liquid, solid and gaseous. Liquid fuels allow their direct use in
transportation means and also in engines and turbines for electricity generation. On
the other hand, solid and gaseous fuels can be used in power plants for electricity
production [41] [42].
Renewable biomass sources are divided in three categories, primary, secondary and
tertiary sources. Primary biomass sources include the woody source of biomass,
(lignocelluloses) produced by photosynthesis and taken directly from the land, like
forest, agricultural and landscape residues, waste wood residues, energy wood
plantations, industrial wood residues and residues from food and more specifically the
biodegradable fraction of municipal wastes. Secondary biomass sources is the non-
woody biomass, oil, sugar and starch, such as residues from the primary biomass
sources process, agricultural energy plants, straw and other harvesting agricultural
residues, landscape residues food industry residues etc. Tertiary biomass resources are
post-consumer residue streams including animal fats and greases, farm slurry,
slaughter waste, organic waste from households and industry, used vegetable oils,
packaging wastes, construction and demolition debris [41] [42] [77].

[37]
Biofuels are divided into different categories as well, according to the feedstock they
are coming from. Thus, we can distinguish three basic generations of biofuels. First
generation biofuels are produced from the available raw material such as oil seeds,
cereal grains, agroindustry and other organic residues, energy corps, agricultural and
forest residues. This category of biofuels includes biodiesel, bioethanol, biogas and
pellets. Second generation biofuels derive from the use of the primary material that
cannot be used as food. These materials could be waste and residues from vegetable
and animal fats, cellulosic plants that are not used as food, agroindustry and other
organic waste and residues and municipal waste. The products resulting from this
category are biodiesel, bioethanol, bio-methanol, bio-hydrogen, biogas, syngas,
synthetic diesel and synthetic kerosene. The production of the third generation
biofuels is based on microalgae. The technics for this conversion are still in initial
stages but with great expectations for the future [41] [42] [77] [78].
Figure 12. Biomass conversion processes.
This thesis aims to examine the energy recovery from the second generation biofuels
and mainly from municipal waste.
Biomass can be used to meet energy needs such as heating, cooling, electricity, etc.
either by direct combustion, or by transformation into gases, liquids and/or fossil fuels
through thermochemical or biochemical processes as Figure 12 illustrates [41] [42]
[79]. The selection of the biomass conversion technology, in each case, depends on
Waste
Thermochemical Processes
Incineration Electricity
Gasification Gas to Fuel
Pyrolysis Heavy Oil
Biochemical Processes
Anaerobic Digestion
Biogas
Fermentation Ethanol
[38]
various factors such as the form of energy that is required, the environmental issues,
the type and quantity of feedstock that is available and economic factors [42].
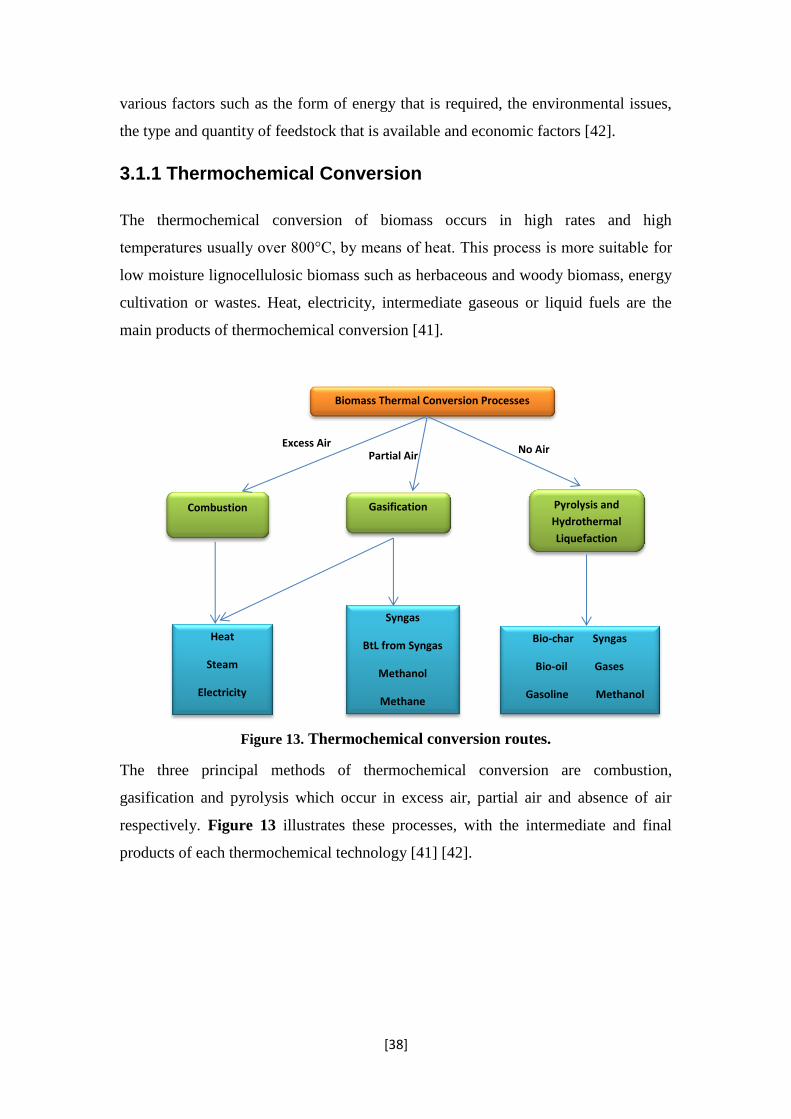
3.1.1 Thermochemical Conversion
The thermochemical conversion of biomass occurs in high rates and high
temperatures usually over 800°C, by means of heat. This process is more suitable for
low moisture lignocellulosic biomass such as herbaceous and woody biomass, energy
cultivation or wastes. Heat, electricity, intermediate gaseous or liquid fuels are the
main products of thermochemical conversion [41].
Figure 13. Thermochemical conversion routes.
The three principal methods of thermochemical conversion are combustion,
gasification and pyrolysis which occur in excess air, partial air and absence of air
respectively. Figure 13 illustrates these processes, with the intermediate and final
products of each thermochemical technology [41] [42].
Biomass Thermal Conversion Processes
Pyrolysis and
Hydrothermal
Liquefaction
Gasification Combustion
Bio-char Syngas
Bio-oil Gases
Gasoline Methanol
Syngas
BtL from Syngas
Methanol
Methane
Heat
Steam
Electricity
No Air Partial Air
Excess Air

[39]
3.1.1.1 Biomass Combustion
Combustion might be the most common and simplest technology in order to extract
energy -both heat and electricity- from biomass. It is the thermal conversion of
biomass using excess air, where the components of biomass are converted to their
respective oxidized form. There is a high variation concerning the feedstock that
should be used in biomass combustion. It is a process that can includes many types of
biomass fuels such as wood, agricultural residues, wood pulping liquor, municipal
solid waste (MSW) and refuse-derived fuel (RDF).
During combustion of biomass warm gases (steam) are produced at high
temperatures of around 800°C to 1000 °C. This process is preferred mostly for raw
materials with a moisture content that does not exceed the 50%, unless they are pre-
dried. The scale of combustion facilities ranges from household (very small) to
industrial 100-3000MW, which is another reason for its wide dissemination. The
relative efficiency of biomass combustion to electricity in power plants, which is a
combination of the efficiencies of the Rankine cycle, the boiler and the turbine, ranges
from 20% to 40% and it is higher in case of co-combustion of biomass in coal-fired
power plants [74].
The incoming biomass fuel is burned directly in a boiler to turn water into steam,
which contains 60 to 85% of the potential energy in the biomass fuel. The steam
produced, turns a steam turbine which drives a generator which in its turn produces
electricity and heat so to be used in homes, businesses, institutions and industries.
Afterwards, the steam is condensed trough wet cooling or once-through cooling and it
returns back to the boiler. Residues of biomass combustion consist of bottom ash and
fly ash from the combustion chamber as well as residue from flue gas cleaning system
[41] [79]. An example of a typical biomass combustion method is demonstrated in
Figure 14.
The main products of biomass combustion are carbon dioxide (CO2) and water vapor
(H2O), though tars, smoke and alkaline ash particles are produced as well. Thus, a
proper and environmentally acceptable biomass system with diminished emissions is
required. In order for a proper and sufficient combustion to occur three requirements
must be fulfilled. These three requirements are (a) high temperatures for ignition, (b)

[40]
sufficient turbulence for the proper mixture of oxygen with all components of biomass
fuels and finally (c) plenty of time in order for a complete oxidization reaction to be
succeeded.
The most common type of biomass boiler is the grate furnace which is based on a
grate with a bed of fuel that is mixed with a controlled amount of combustion air,
which usually enters from beneath the grate. Biomass fuel enters from the one end of
the grate and it is burned in the fuel bed which moves progressively down the grate, in
most cases with mechanical assistance or gravity. The fuel bed leads to the ends of the
grate where there is an ash removal system. In general the whole combustion process
consists of four main steps:
1) The initial fuel drying, where the biomass fuel is heated up to 100oC in order to
remove the water
2) Pyrolysis or De-volatilization, where the chemical decomposition of biomass
occurs in anaerobic condition in order for the volatile gasses such as HC, CO,
CO2, H2, CH4 and char to be removed.
3) Gasification or Flame Combustion, where the emitted gasses from pyrolysis are
mixed with atmospheric air and burned in high temperatures in order to produce
CO2 and H2O.
4) Combustion, where the remaining from the previous phases matter, mainly char,
is burned in lower temperatures and produces ash.
During each step of combustion the amount of biomass fuel decreases significantly to
finally reach even 90% reduction of the initial amount that entered into the system.
The main drawback of this technology is that there is creation of ash slagging that,
inevitably, causes a decrease in efficiency and increases costs. Thus, the range of
materials that can be used in direct combustion is relatively limited.
The advantage of grate furnace is that it is has high tolerance in moisture content and
particle size of biomass, it is less sensitive to slagging and it can comply with a high
variation of different fuels. It is considered to be a very efficient system recovering
65-90% of the energy content in the biomass fuel with a capacity range from 100kW
to 50MW. However, all energy contained in biomass fuels is not converted to useful

[41]
energy; there is also an amount of heat losses to the exiting flue gases, the ash leaving
the boiler as well as heat losses during the evaporation of biomass’ water.
Additionally, radiation heat losses and incomplete combustion of char and gases is
another reason that reduces the efficiency of the system. Hence, the total efficiency of
energy recovery depends on the Rankine, boiler and turbine efficiencies which range
between 30-45% , 75-85% and 5-30%, respectively [41] [80] [81].
Figure 14. Example of Direct Combustion Power Generation Method.
In commercial biomass combustion systems, used worldwide, there is a variety of
direct combustion technologies which are used and which are formed primarily
according to the local availability of raw materials. In general, there is no particular
restriction concerning the raw material. Exclusive biomass combustion plants can
burn a wide range of fuels, including wastes.
Combustion of solid wastes is the most common and worldwide method of waste
treatment with numerous facilities around the world, a great number of which exceeds
the capacity of 1.000.000 tons/year. In combustion, the components of solid wastes
undergo in high temperatures with the presence of flame and air in order to be

[42]
converted to heir oxidized form. The municipal solid waste combustion systems can
operate with two different types of fuels.
1. The commingled solid waste, mass-fired, facilities, where there is no
requirement for any pretreatment of the waste
2. Facilities that operate with treated RDF, refuse-derived fuel, as fuel.
Primers are the most commonly used combustion systems. Their great advantage is
that it is more convenient, as wastes are imported with no treatment in the combustion
facility. In any case supervising of the incoming materials is prerequisite.
The latter category, the RDF units in comparison with the mass-fired units, comply
more efficiently with the energy recovery and distribution network as the RDF has
higher heating value and much smaller fluctuations in energy content. Moreover,
these facilities are of smaller scale and their control is simpler. Finally, the removal of
metals, plastics, PVC etc. assists the production of less dangerous waste gases. The
RDF units are comprehensively fewer than the mass-fired units, as they require a
supplementary unit for RDF production [41] [48] [82] [83] [84].
The whole combustion process takes place in special incinerators whose capacities
can vary from 8 to 25Mg/h. The most widespread types of incinerators are:
Fixed-bed Combustion
Grate furnaces and underfeed stokers are included in these systems. The biomass
processing phases, drying, gasification and charcoal combustion take place on a fixed
bed though which the air passes. Secondary air is introduced in a separate combustion
zone and used in order to burn the combustible gases. Grate furnaces have high
flexibility concerning moisture and ash content and particle size as well as low
sensitivity to slagging. They are susceptible in mixing of different wood fuels.
However, the different combustion behavior, the low moisture content and the low
ash melting point of some wood types, such as straw, cereals and grasses, cause
malfunctions. In most cases the capacity of fixed- bed combustion system reach the
20 MWth. On the other hand, underfeed stokers are a lower cost technology applied
mainly in smaller or medium scale facilities with capacities around 6 MWth. This
technology is more suitable for lower moisture and ash content biomass and smaller
particle sizes [41] [85].

[43]
Fluidized bed Combustion
In fluidized bed systems, air is introduced from beneath and burns biomass fuels in a
self-mixing suspension of gas and solid bed material, mostly silica sand and dolomite.
Fluidized bed combustors have high flexibility concerning moisture and ash content
and particle size as well. The high turbulence of the system provides a high heat
transfer capacity, thus, complete combustion with low recess oxygen occurs and
increases combustion efficiency whilst it decreases flue gas flow. However, they are
not able to comply with ash slagging. Fluidized bed combustion is more suitable for
large scale facilities, usually more than 30 MWth capacities, as they have high
operational costs [41] [85].
Dust Combustion/ Pulverized Fuel Combustion
Dust combustion or pulverized fuel combustion technology is more suitable for low
moisture and small particle size biomass fuels in the form of dust or powder. In these
combustors air is introduces along with the fuel into the chamber. Secondary air is
also introduced in order to burn the gases. The combustion takes place under medium
excess oxygen conditions increasing the efficiency. However, there is a need of a
supplementary burner in order to start up the process. This combustion technology is
addressed to facilities with 2 MW to 8 MW capacities [41] [85].
3.1.1.2 Biomass Gasification
Gasification is the thermal conversion process of partial combustion of biomass,
where the organic fraction of the biomass fuel is converted into a mixture of gas fuel,
the also called syngas, a synthetic gas consisted of CO, CO2, H2, H2O and CH4, under
partial air (oxygen) and high temperatures, greater than 800oC. The produced gas has
a low calorific value (CV), lower than 10 MJ/Nm3, usually around 4-6 MJ/Nm
3. The
produced combustible gas can be used as a fuel in boilers, internal combustion
engines or gas turbines. Gasification is particularly suitable to treat industrial wastes
but there are some problems with municipal [41] [86] [87].
The gasification method is a recent entry in the waste management treatment with the
Integrated Gasification Combine Cycle (IGCC) meeting high potentiality in the near
future. The advantage of IGCC is that it combines Brayton and Rankine cycle, with
the improved final efficiencies. In the Brayton cycle the typical exit temperature of

[44]
the gas (400-600°C) is high enough in order to generate steam, which can produce
electricity through a Rankine cycle and run a combined cycle which increases the
efficiencies that range between 30% and 40% [41] [86] [87].
In comparison with combustion, gasification of biomass fuels is an exothermic
process with partial oxidization and it has higher efficiencies due to the IGCC. The
energy needed is supplied mainly externally but also internally through the
combustion of part of the inserting biomass fuel. Regarding the oxygen supply, in
case of gasification reaches the 1.5-1.8 kg air/kg biomass, whilst in combustion this is
around 7 kg air/ kg biomass. It has also the ability to produce chemicals and liquid
hydrocarbons with lower emissions of NOx (sulfur) and particulates, while it
eliminates dioxins and furans. However, there are some restrictions that must be
fulfilled in this process, aiming high efficiencies of gasification biomass conversion.
It is a process more suitable for low moisture and ash content, less than 15% and 5%,
respectively, as high moisture and ash reduce the Heating Value (HV) of the fuel,
create slagging problems and decrease the total efficiency of the process.
Additionally, medium size of particles is required to secure proper movement of the
feed and high pressures [41] [86] [87].
The whole process of gasification is divided in four main phases which are the
following:
1) Heating and Drying, where the excess moisture content is removed in order to
reach to the limits of 10-15%.
2) Pyrolysis, which occurs under 280-500oC of temperature for charcoal and tar to
be removed.
3) Partial Combustion/Oxidization of gases, steam and charcoal which are converted
into CO2 and H2O, under high temperature (1500oC) and partial air conditions, by
a gasifying agent, usually oxygen.
4) Gasification/Reduction of charcoal from the previous phase and production of
CO, CH4 and H2 [41] [86] [87].

[45]
Figure 15. Biomass Gasification Process.
Biomass gasifiers are classified, depending on the type of gasifying agent, operational
pressure, reactor type and heat requirements. The gasifying agents are:
1. Oxygen/air
2. Steam and
3. Carbon dioxide
In case of an oxidant gasification agent, partial combustion/oxidization of biomass for
heat supply of gasification occurs and the temperature remains up (direct
gasification). On the contrary, in case of steam as gasifying agent indirect gasification
occurs, thus, external heat supply for the gasification is required. In the second case,
the produced gas (syngas) has a heating value that ranges between 15 and 20 MJ/Nm3
and which is higher than this in direct gasification [41] [87] [88].
There are three types of reactors where the conversion occurs:
Fixed-bed/Moving bed reactors
In fixed-bed reactors, biomass moves slow through the reactor. This type of reactor is
divided in two further types as presented in Figure 16: (a) the updraft or
countercurrent and (b) the downdraft or co-current. In the former, biomass is
introduced from the top and the produced gases also pass upwards, whilst he gasifying
agent enters from the bottom of the reactor. In the pyrolysis zone biomass is
converted into condensable and non-condensable gases and charcoal. Part of char is
burned through combustion and the heat produced is used to the whole process. In the
latter, biomass is also introduced from the top, whereas the gasifying agents is

[46]
injected from the bottom, from one side and passes through the pyrolysis zone where
it is mixed with pyrolysis products, gases and solids (charcoal and tar) and which
move downwards. A part of gases produced from pyrolysis are burned through the
gasification zone and provides with heat energy for the operation of all phases.
Downdraft reactors have an overall lower energy efficiency, lower gas and tar content
and higher particulate content than the updraft reactors [41] [87] [88].
Figure 16. Fixed bed reactors (a) downdraft (b) updraft
Fluidized bed reactors
There are two main types of fluidized bed, the bubbling and the circulating fluidized
bed. In general, in fluidized bed reactors the biomass fuel is inserted from the top,
whilst the gasifying agent, in the form of fluidized gas, is introduced from the bottom
in a continuous pace and exits from the top. The phases of drying and pyrolysis occur
when the incoming fuels are mixed with the hot solids on the grate and charcoal and
gases are produced. However, this continuous mixing of fuels prohibits the
acceleration of a complete conversion of char and high efficiencies. The advantage is
that the constant mixture of solids offers the stabilization of temperature in specific
ranges between 800oC and 1000
oC which prevents slagging. Nevertheless, this
mixture of already gasified and partially gasified particles results in the production of
partially gasified char which in its turn causes losses in the reactor. In case of
bubbling fluidized bed reactors oxygen is inserted in the form of bubbles and heat is
produced by the partial combustion of volatile matter and char. The problem of this
reactor is the low dissemination of oxygen from bubble to the emulsion phase which
leads to the combustion during the fluidized phase causing the reduction of efficiency
of gasification. Circulating fluidized bed reactors, also heated by the partial
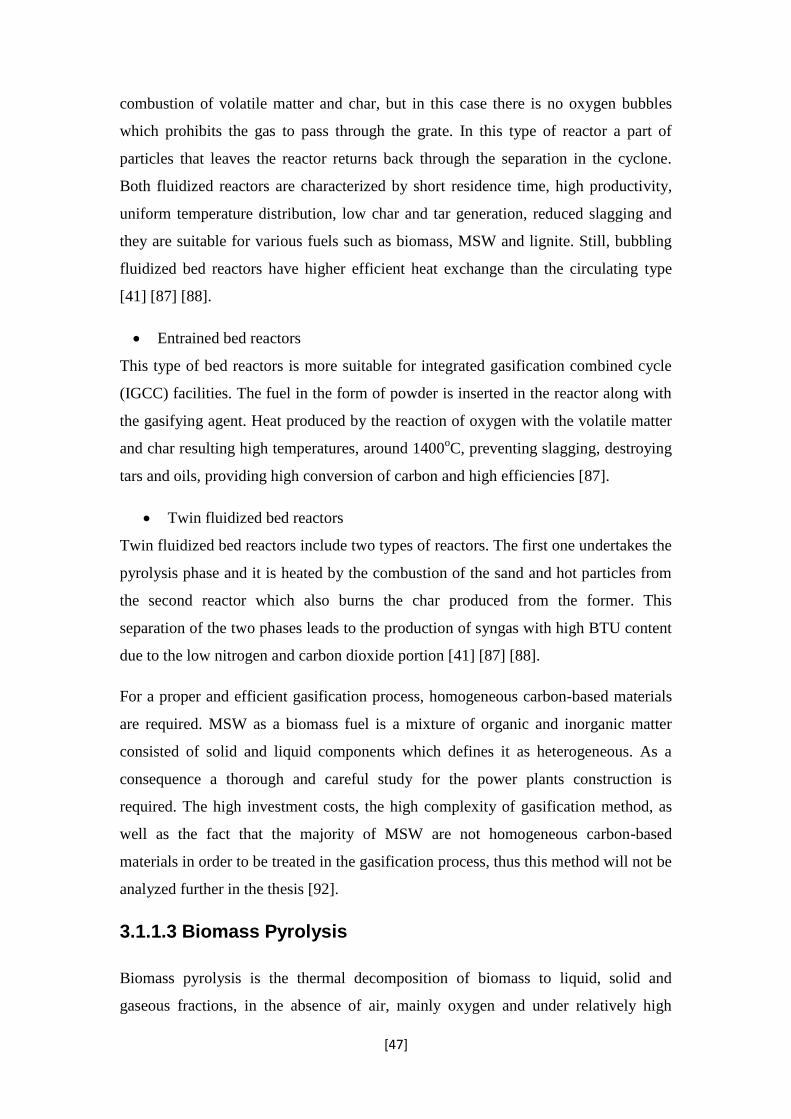
[47]
combustion of volatile matter and char, but in this case there is no oxygen bubbles
which prohibits the gas to pass through the grate. In this type of reactor a part of
particles that leaves the reactor returns back through the separation in the cyclone.
Both fluidized reactors are characterized by short residence time, high productivity,
uniform temperature distribution, low char and tar generation, reduced slagging and
they are suitable for various fuels such as biomass, MSW and lignite. Still, bubbling
fluidized bed reactors have higher efficient heat exchange than the circulating type
[41] [87] [88].
Entrained bed reactors
This type of bed reactors is more suitable for integrated gasification combined cycle
(IGCC) facilities. The fuel in the form of powder is inserted in the reactor along with
the gasifying agent. Heat produced by the reaction of oxygen with the volatile matter
and char resulting high temperatures, around 1400oC, preventing slagging, destroying
tars and oils, providing high conversion of carbon and high efficiencies [87].
Twin fluidized bed reactors
Twin fluidized bed reactors include two types of reactors. The first one undertakes the
pyrolysis phase and it is heated by the combustion of the sand and hot particles from
the second reactor which also burns the char produced from the former. This
separation of the two phases leads to the production of syngas with high BTU content
due to the low nitrogen and carbon dioxide portion [41] [87] [88].
For a proper and efficient gasification process, homogeneous carbon-based materials
are required. MSW as a biomass fuel is a mixture of organic and inorganic matter
consisted of solid and liquid components which defines it as heterogeneous. As a
consequence a thorough and careful study for the power plants construction is
required. The high investment costs, the high complexity of gasification method, as
well as the fact that the majority of MSW are not homogeneous carbon-based
materials in order to be treated in the gasification process, thus this method will not be
analyzed further in the thesis [92].
3.1.1.3 Biomass Pyrolysis
Biomass pyrolysis is the thermal decomposition of biomass to liquid, solid and
gaseous fractions, in the absence of air, mainly oxygen and under relatively high

[48]
temperatures of 500°C to 800°C, but lower than in the gasification process. The basic
products generated from this process are bio-chat, bio-oil and gases such as CH4, H2,
CO, CO2. The yield of conversion process as well as the amount of the produced
materials depends on the method of pyrolysis, the type of biomass fuel and the
reaction parameters. Due to the various components of biomass, cellulose,
hemicellulos, lignin and organics, there are different pyrolysis processes for each one.
For instance, lignin is decomposed in a slower pace under a wide range of
temperatures, whilst cellulose and hemicellulose are decomposed faster in a limited
range of temperatures. Thus, the whole process is divided in two stages. In the first
one, a slow pyrolysis takes place. In this stage biomass is heated and the fixed carbon
component result in char generation. In fast pyrolysis, biomass is heated rapidly under
high temperatures, of around 450°C to 500°C, low resident time, less than 1 to 5
seconds and in the absence of air, generating vapors, aerosols and charcoals. In this
stage the volatile portion of the organic matter is converted to produce bio-oil and
gases [41] [88] [89]. The use fast pyrolysis provides the ability to convert biomass to
bio-crude with an efficiency of 75-80%. Fast biomass pyrolysis is used in order to
augment either liquid or gas production [41] [42].
Pyrolysis is the thermal conversion of biomass to mainly bio-oil and not electricity.
Bio-crude is commonly used as fuel in engine and turbines. In general, pyrolysis and
gasification are considered to be two alternative methods to combustion in waste to
energy recovery. The generation of gases and liquids from waste conversion are used
in later incineration processes, such as boilers or gas engines.
Despite the high efficiency of bio-oil production, it meets some disadvantages as an
alternative transportation fuel, such as the high oxygen and water content which
results in low heating values and thermal stability of the fuel. Additionally, bio-crude
is low quality oil, due to the oxygen content and it is not bendable with conventional
fossil fuels [41] [88]. These difficulties can be overcome through bio-oil upgrading,
by decreasing the oxygen content and through removing alkalis, by hydrogenation and
catalytic cracking of it [41] [42].

[49]
3.1.2 Biochemical Conversion
In biochemical conversion, biomass decomposition to its molecules occurs. This
degradation of biomass takes place through biochemical reaction with the use of
biocatalysts, such as bacteria, enzymes or micro-organisms in addition to heat and
other chemicals. This biochemical breakdown of the carbohydrate fraction of
biomass, meaning the hemicellulose and cellulose, leads to the generation of gaseous
or liquid fuels, such as biogas or bioethanol.
Biochemical decomposition of biomass is a slower method of biomass conversion
than thermochemical and also takes place under lower temperatures. In comparison
with thermochemical, biochemical conversion is more suitable to high moisture
biomass such as municipal solid waste, algae etc. The most widely distinguished
biochemical technologies are anaerobic digestion to biogas and fermentation to
ethanol.
In general the whole biochemical process can be divided into seven steps as
demonstrated in Figure 17. After the feedstock supply of biomass fuel, it must
undergo a pretreatment process where it is heated, along with steam and acid, in order
to weaken the strong bonds between its cells and set the next step of hydrolysis of
cellulose and hemicellulose easier. In hydrolysis, enzymes or other catalysts are
injected to separate the sugars from cellulose and hemicellulose. Then the
biochemical conversion takes place, either anaerobic digestion or fermentation,
depending mostly on the feedstock origination. Afterwards, the products are separated
from water, solvents, and the residual solids and distributed blending units or refining
facilities. The solids remaining from the previous processes, mostly lignin residue, are
combusted to produce heat and power [41] [80] [90] [91] [92].
Figure 17. Phases of biochemical process.
Feedstock Supply
Pretreatment Hydrolysis Biochemical Conversion
Product Recovery
Product Distribution
Heat and Power

[50]
Biochemical is considered to be a non-pollutant method of biomass conversion and
also it is characterized by low energy consumption. Mostly biogas, ethyl alcohol,
compost and protein production have met high development in the last decades.
Biochemical conversion of biomass is the most environmentally sustainable
alternative for fuel and energy production as well as for the reduction of CO2 amount
in the atmosphere. Biomass is an abundant resource of carbon and it can act as a
sustainable substitute for conventional fossil fuels [92].
3.1.2.1 Anaerobic Digestion
Anaerobic digestion is the biochemical conversion of the organic matter of biomass to
methane via chemical reactions of microorganisms under a non-oxygenic
environment. Through this process bacterium decomposes the carbon in organic
matter generating biogas, liquid digestate and solid fiber digestate. The main
components in produced biogas are methane (CH4) and carbon dioxide (CO2) with a
portion of 60-65% and 30-35%, respectively. Ammonia, hydrogen and hydrogen
sulfide can also be found in biogas but in lesser amount. Liquid digestate consists of
mostly valuable nutrient nitrogen and small quantities of phosphorus and potassium
and it can be used as fertilizer, whilst solid fiber digestate contains, mainly,
phosphorous and as compost it can be used as soil conditioner.
As it has already been mentioned in the previous chapter, anaerobic digestion is the
most common method to organic waste treatment. The combination of waste
treatment and energy production via anaerobic digestion met development the last
decades and constitutes a significant part in the integrated municipal waste treatment
for many European countries as it can process both wet and dry biomass. Feedstock
for anaerobic digestion include manure, municipal solid wastes and organic waste
from households, wastewater sludge, harvest surplus, vegetable oil residues and
specific energy corps.
For anaerobic digestion the biochemical process, explained above, after hydrolysis, is
divided in four more steps. The first one is acidogenesis during which acetate
(CH3COO-), carbon dioxide, volatile fatty acids and hydrogen are produced. The
volatile fatty acids produced are decomposed in the next step, acetogenesis, where
acetate and hydrogen along with carbon dioxide are composed. Methanogenesis is the

[51]
final step of this process and concerns the conversion of acetate and hydrogen to
methane and carbon dioxide [41] [80] [88] [91] [92].
The exploitation of the generated biogas provides energy with high efficiency and
environmentally sustainable due to the low emission of pollutants. Additionally it
does not need high amounts of energy although it is not an exothermic reaction. The
amounts of heat needed to maintain the high temperatures and produce sufficient
energy is obtained by the combustion of biogas that is produced [88] [93]. The
produced biogas is usually used in Combined Heat and Power (CHP) units. CHP
installations produce electricity and heat production, simultaneously, with typical
efficiencies of about 33% and 45%, respectively [93] [94] [95]. A typical installation
of municipal waste exploitation via anaerobic digestion is presented in Figure 18.
Figure 18. Anaerobic municipal waste conversion facility.
In comparison with combustion, which is the most prevailing technology nowadays,
anaerobic digestion has numerous advantages. First of all, it can process both wet and
dry biomass which contributes to the efficient municipal solid waste and wastewater
treatment, the reduction of waste volume, the water, ground water and soil
contamination and the reduction of odors by about 80%. It also limits, significantly,
the emission of hazardous pollutants such as volatile organic compounds (VOCs) as
almost 99% of volatile compounds undergo a complete oxidization during
combustion. In the contrary, during combustion emissions of dioxins and other

[52]
pollutants cannot be restricted in such a high level, and so flue gas purification is
required. Moreover, biogas can be upgraded to bio-methane, by removing mainly CO2
and H2S and other S-containing compounds through scrubbing and it can be injected
in any methane use, such as natural gas grid [41] [93] [94] [95].
Regarding MSW, in case that there is a source separation of the biodegradable
fraction from the not biodegradable, the anaerobic treatment is achievable. However,
in case of not separated MSW, a pre-sorting is required in order to remove the non-
biodegradable compounds which are not suitable for this process, such as heavy
metals, so to recover high quality sludge. The consequence of this pretreatment is the
increase of the increase of the operation costs. As for the methane yield of anaerobic
digestion of MSW, it is characterized by a great variation and depends on MSW
composition of each region, season and lifestyle. Each type of MSW components has
a different methane yield as it is illustrated in Table 7 [93] [96].
Table 7. Methane yield, obtained through anaerobic digestion of municipal solid waste
(MSW) types.
Type of MSW Methane yield (m3/kg ODS)
Mechanically sorted (fresh) 0.22
Mechanically sorted (dried) 0.22
Hand sorted 0.21
Grass 0.21
Leaves 0.12
Branches 0.13
Mixed yard waste 0.14
Office paper 0.37
Corrugated paper 0.28
Printed newspaper 0.10
As for municipal wastewaters (MWW), the disposal of huge amounts of sludge
resulting from current sewage treatment plants, does not contribute to the objective of
reducing the amount of waste disposal. It also does not represent a sustainable method
of treatment and it has high operating costs which rise up to 50% of operating costs of
a sewage treatment plant. Today, typical amounts of this sludge are considered to
reach the 60-90 g of Dry Solids (DS)/population equivalent which corresponds to an
annual total production of around 10 million tons of dry sludge in Europe. This
problem can be constricted efficiently enough via anaerobic digestion, as almost 40%

[53]
of the biosolids fraction of sludge can removed before the final disposal. Anaerobic
digestion is not only an environmental friendly method of wastewater treatment but it
is considered to be a way of reducing the operating costs of wastewater treatment
plants as well. As in MSW so in MWW too, the methane yield via anaerobic digestion
depends on the composition of sludge. However, this technology has the highest
biogas production on an international scale, with a typical average methane yield
being around 0.590m3/kg ODS [41] [93] [94] [95] [96].
In general, anaerobic digestion outweighs the other technologies in environmental,
economic and efficiency approaches. In terms of combustion, there is still a
significant issue with the emission of pollutant gasses such as dioxins that sets a gas
purification system mandatory. As regards pyrolysis and gasification technologies,
they are still in pilot phase without great scale of such facilities worldwide.
Nonetheless, anaerobic digestion technology needs further development in various
fields such as the pre-treatment methods so to enhance the anaerobic bio-degradability
of feedstock and the upgrading and purification of the generated biogas [93].
3.1.2.2 Fermentation
Fermentation is the aerobic conversion of biomass sugars to alcohol via chemical
reactions of microorganisms, mainly yeast, under oxygenic conditions. The principal
product of this process is bioethanol which is the most prominent biofuel. Sugar and
starch crops and in general cellulosic feedstock are used in large commercial scale in
numerous countries in the world in order to produce bioethanol through fermentation.
Today, bioethanol is used as engine fuel, as alternative fuel to gasoline in modified
gasoline engines and as fuel mixed with fossil gasoline in conventional vehicles.
Additional product of the anaerobic digestion of biomass is high quality compost that
can be used as soil improver and the generation of carbon dioxide and water.
Nevertheless, it is not considered to be a method for energy regeneration [41] [42]
[88].

[54]
4. COCO Simulator
The main objective of the thesis is the modelling of an energy production system that
uses alternative fuels. Hence, a simulation software is applied, so to design the whole
operational process of biomass conversion system. The purpose is build, step by step,
the entire biomass conversion process including the environmental conditions, the
intermediate and final products of each phase along with their quantities and
conversion efficiencies. Furthermore, the simulation process will act as an indicator
for the conversion technology that should be used in order to exploit more efficiently
the type of available biomass providing optimum energy production. The software
used for this purpose, is called COCO (CAPE-OPEN to CAPE-OPEN) simulator.
CAPE-OPEN is a product of collaboration of various operating companies, such as
Air Liquide, BP, DOW Chemical Company, Shell Global Solutions and others,
software suppliers and Universities with the support of EU. It is accurate software
with well-established unit operations and high variety of implementations [97] [98].
4.1 The Software and its Components
The COCO (CAPE-OPEN to CAPE-OPEN) simulator software consists of an
accumulation of software components aiming to enable modelling of steady state
chemical engineering flowsheets. It includes four main constituents which are
presented in Figure 19 [99] [100]. In COCO simulator a graphical representation,
called Process Flow Diagram (PFD), is used in order to define the simulated process.
It also provides the ability to edit the unit operation parameters defined via the CAPE-
OPEN standard, which is a compliant steady-state simulation environment consisting
of these sub-models. In essence, it is about a flowsheet modelling environment
enabling user to add new unit operations or thermodynamics packages [100] [101].

[55]
Figure 19. The sub-models components of COCO Simulator.
The CAPE-OPEN sub-models that are usually used are thermodynamic models, unit
operation models and a class of models enabling the specification of reactions, such as
stoichiometry, reaction rates, heats of reaction, etc. It is a steady state flowsheet
simulator including several unit operations linked together by material and energy
streams in combination with thermodynamic and physical property models, in order to
model complete chemical processes. It is used for designing and operating chemical
processes [100] [101] [102].
Figure 20. Illiustration of imulation eenvironments with thermodynamic models and
unit operations of COCO.
Regarding the setup of COCO, it is totally modelled around CAPE-OPEN and it
operates as demonstrated in Figure 20. Thus, COFE can be run with TEA which is
the COCO’s thermodynamics library, or with any third-party CAPE-OPEN compliant

[56]
thermodynamic components there is no requirement of built-in sub models or
thermodynamics or proprietary interfaces. Furthermore, COFE can be run with
COUSCOUS which is the COCO’s unit operation models, with any other third-party
CAPE-OPEN compliant unit operation models. In similar way TEA and COUSCOUS
can be used not only in COFE but in any other third-party CAPE-OPEN compliant
simulation environment, as well [97] [103] [104].
4.1.1 COFE: CAPE-OPEN Flowsheeting Environment
COFE features a graphical flowsheet editor, a built-in property calculator, a compact
display of stream information and Windows features like graphical printing and print
preview, as Figure 21 displays. COFE also provides the ability to combine flowsheets
in a Microsoft Excel workbook, and perform thermodynamic calculations as well as
access stream and unit operation data [97] [103] [104].
Figure 21. COFE features.
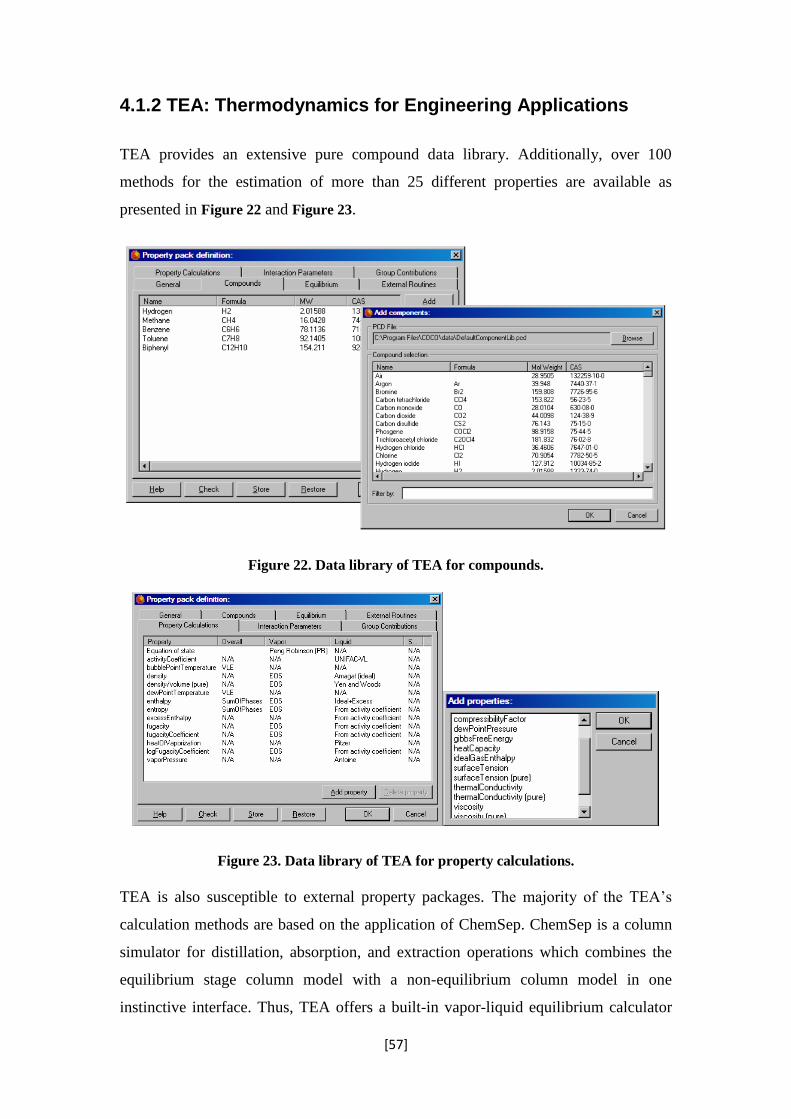
[57]
4.1.2 TEA: Thermodynamics for Engineering Applications
TEA provides an extensive pure compound data library. Additionally, over 100
methods for the estimation of more than 25 different properties are available as
presented in Figure 22 and Figure 23.
Figure 22. Data library of TEA for compounds.
Figure 23. Data library of TEA for property calculations.
TEA is also susceptible to external property packages. The majority of the TEA’s
calculation methods are based on the application of ChemSep. ChemSep is a column
simulator for distillation, absorption, and extraction operations which combines the
equilibrium stage column model with a non-equilibrium column model in one
instinctive interface. Thus, TEA offers a built-in vapor-liquid equilibrium calculator

[58]
using inside-out flash calculations, with an auxiliary Newton solution to flash
calculations [97] [103] [104].
4.1.3 COUSCOUS: CAPE-OPEN Library of Unit operations
COUSCOUS provides a library of unit operations allowing engineering calculation
process as Figure 23 and Figure 24 demonstrate. The unit operations that
COUSCOUS includes are compressors, pumps, turbines, expanders, simple reactor
models, flash unit operations, heaters, coolers, heat-exchangers, mixers and splitters.
COUSCOUS also includes a unit operation for testing property package
implementation which has the ability to calculate all derivative properties.
COUSCOUS unit operations can be combined with external unit operations. Although
there is a limitation regarding the number of unit operations in COUSCOUS, users
has the possibility to add their own unit operation models. A distillation column is not
included in COUSCOUS. However, there is a LITE version of ChemSep with a
limited number of compounds and stages that can be used for this purpose [97] [103]
[104].
Figure 24. Unit operation library of COUSCOUS.
4.1.4 CORN: CAPE-OPEN Reaction Numeric Package
CORN features kinetic and equilibrium reactions. For kinetic reaction, pressure,
temperature, concentration and mole fraction define the equilibrium constant and
heats of reaction formulas [97] [103] [104].

[59]
4.1.5 CAPE-OPEN Applications
CAPE-OPEN meets international use in activities of various grave companies, such as
SHELL and PDVSA INTEVEP. SHELL supports that via CAPE-OPEN, “they are
able to use in-house unit in two commercial simulation platforms without
customization and so ensures consistency across the simulation platforms”. Whereas,
PDVSA INTEVEP asserts that CAPE-OPEN provides them the ability “to run the
refinery reactor technology models and the in-house equilibrium calculation models
in different process modeling environments” [98] [105]. Moreover, there are
numerous industrial and governmental applications of CAPE-OPEN, such as in Air
Liquide that uses Simulis Thermodynamics and DIPPR database of pure substances as
R&D thermodynamic standard allowing the cohabitation of four simulators, HYSYS,
Belsim, Prosim, and AspenPlus. The objective of using in-house CO reactor and
membrane models is to reduce development and maintenance cost. Additionally,
BASF uses MultiFlash (InfoChem) as external thermodynamics server for the in-
house CHEMASIM simulator, IFP and Total use an integrated approach of dynamic
fluid flow modeling from the reservoir to the topside process, BP uses the ChemSep
rate-based column simulator, whilst Sasol has used CO interfaces to make reactor
models independent from the process simulator. Last but not least, the US
Environmental Agency has integrated CAPE-OPEN’s unit operations in their
Pollution Prevention Toll [106] [107].
One other application of CAPE-OPEN software is in the evaluation of process
sustainability. The objective is to develop a simulation process, the COWAR, resulted
from the implementation of Waste Reduction (WAR) Algorithm to a CAPE-OPEN
unit operation, in order to obtain environmental information and evaluate the
friendliness of a chemical process. This tool has been applied to numerous processes,
such as the phthalic anhydride (C8H4O3) production, in order to estimate
environmental impacts and select the best environmental process design for a
chemical plant [108] [109].
Furthermore, CAPE-OPEN software has been applied in the industrial production of
methanol by integrating a strict kinetic model in the simulation using the CAPE-
OPEN standard. The flexibility and the accuracy of the software provide the

[60]
possibility of modeling a system by using various approaches that finally can be
compared and offer the best possible solution. In case of a study of modelling a
conventional methanol synthesis reactor in order to test the final composition of
methanol, three different approaches were used: molar homogeneous, molar
heterogeneous and mass homogeneous models, concluding similar results with
previous studies [110].
The structure of the CAPE–OPEN software as well as all these applications presented
above, display why to use this software in the specific occasion. First of all, it is
compatible with multiple simulation environments that a company uses. It offers the
ability to write code that will be adaptable to all these simulation environments,
reducing the coding and software. Moreover, it enables confirmation of simulation
results across simulation platforms, hence the results are not depend on the kind of
software is used. Regarding the simulation environment, it provides high flexibility
and consequently better bargaining position in purchasing simulation platform.
Flexibility is also provided concerning the selection of simulation environment by
various users. Finally, it is of free charge and easily accessible software with no
significant difficulties in use [97] [103] [104].
Therefore, COCO simulation software, along with its sub-models, is going to be the
main instrument of this case study in order to model a complete solid waste
combustion system for energy production, which will be analyzed further in the next
chapter.

[61]
5. Combined Heat and Power
Generation (CHP)
Combined Heat and Power (CHP) is the simultaneous production of electricity and
heat from a single fuel source and it provides distributed generation of electrical and
mechanical power, waste-heat recovery for heating, cooling, or process applications
and seamless system integration for a variety of technologies, thermal applications,
and fuel types into existing building infrastructure. CHP is an efficient and clean
technology achieving total efficiencies of 60% to 80% for electricity and thermal
energy production. CHP facilities are located at or near end-user’s site in order for the
heat released from power production to meet the user’s thermal requirements and for
the power generated to meet all or a portion of the electricity needs. There are
numerous benefits of combined heat and power for facility operators such as reduced
energy related costs (providing direct cost savings), high reliability and low risk of
power outages due to the addition of a separate power supply as well as increased
economic competitiveness due to lower cost of operations. Additional benefits of
CHP technology are:
Increased energy efficiency: providing useful energy services to facilities with less
primary energy input.
Economic development value: allowing businesses to be more competitive in a
global market thereby maintaining local employment and economic health.
Reduction in emissions that contribute to global warming: high efficiency of
energy use allows facilities to achieve the same levels of output or business activity
with lower levels of fossil fuel combustion and reduced emissions of carbon
dioxide.
Reduced emissions of air pollutants: CHP systems can reduce air emissions of
carbon monoxide (CO), nitrogen oxides (NOx), and sulfur dioxide (SO2) especially
when state-of-the-art CHP equipment replaces outdated and inefficient boilers at
the site.
Resource adequacy: low need for regional power plant as well as transmission and
distribution infrastructures.

[62]
In order to reduce the environmental impacts of energy production and use, the
implementation of biomass-fueled CHP facilities has been introduced as a great and
sustainable solution. The advantages of using biomass instead of fossil fuels in order
to meet energy needs depend upon the intended use and the substituted fuel source.
Furthermore, biomass has higher flexibility, as it can generate both power and heat,
and it is more reliable, as it is an abundant resource, as an energy option than many
other renewable energy resources [84].
5.1 Simulation Overview
The COCO software is going to be applied for a biomass CHP system in
Thessaloniki, using as feedstock the amount of the city’s MSW that are yearly
disposed in a landfill. However, before applying the software, we must select the most
suitable combustion technology for the available feedstock type.
There are three main incineration technologies that are widely used: (a) the fixed bed,
(b) fluidized bed and (c) dust combustion as well as the feedstock characteristics, will
be examined. There are differences between these incinerators concerning the
operation and effectiveness in biomass combustion.
5.1.1 Fixed Bed Boiler
In fixed bed combustors through which primary air passes, the processes of drying,
gasification, and charcoal combustion take place. The combustible gases produced via
gasification process are burned in the combustion zone after the secondary air
injection. The high endurance of this type of combustors, in moisture and ash slagging
allows high temperatures between 900oC and 1200
oC. The air supply to the system is
of great importance in order to have a combustion as complete as possible. For this
reason, a progressive combustion is required, which is divided in two separate phases.
In the primary combustion, the primary air supply must be secured at about 25%, for
low NOx operation. However this combustion is not optimal because of the low
mixing quality of air and flue gases. Thus the secondary combustion occurs in order
to guarantee a better possible mixture in order to provide high efficiencies. In most
cases, excess air for biomass fuels is set at 25%. Nonetheless, due to the highly
volatility on a dry basis and heterogeneity in size of biomass fuels, biomass

[63]
combustion air systems are designed to provide more air. Modern designs use excess
air of 40% and 60%, respectively [84] [111].
5.1.2 Fluidized Bed Boiler
The fluidized bed combustion process provides an efficient mixture of fuels and air
for combustion. In this type of boilers, biomass is burned in a self-mixing process of
gas and bed materials with air entering from below. The air and fuel supply into the
bed is controlled in order for a continuous combustion to be realized. The typical
excess air in fluidized beds is 20% or higher. Fluidized bed combustion (FBC)
process is optimal for fuels with high ash sulfur, and nitrogen concentration while
meeting stringent emission limitations in the same time [84] [111] [112].
Fluidized bed boilers are well known for their high flexibility concerning moisture
content and their inherent biomass fuel flexibility which is incomparable to any other
combustion technology. Fluidized bed combustion (FBC) can burn fuels with a wide
range of calorific values, ash and moisture content. During combustion the primary air
keeps fluidized the bed of sand, while secondary air is injected higher up in the
furnace to achieve a staged and more complete combustion. The fluidized bed’s
operation temperature between 800°C and 950°C, about 100oC to 200
oC less than in
fixed bed boilers, are considerably lower than those in grate and pulverized systems.
These lower temperatures prohibit the formation of nitrogen oxides (NOx) from the
air combustion and allow fuels with lower ash melting temperatures to be combusted.
Additionally, this process also permits the removal of sulphur dioxide (SO2) from
combustion of high-sulphur fuels simply by addition of sulphur absorbents such as
limestone or dolomite in the bed. Furthermore, the fluidized bed technology reaches
high capacity ranges between 20MW and 100MW, while fixed and pulverized bed
combustors’ capacities range from 100kW to 50MW and from 500kW to 100MW(co-
firing), respectively.
Since this technology allows handling of high-ash fuels, it is therefore capable of
treating a large variety of agricultural biomass residue and mixed MSW with high
moisture content and extremely low heating values and can be adopted by developing
countries with limited budgets and low quality waste [113] [114].
[64]
5.1.3 Pulverized Bed Boiler
The pulverized bed combustor is more suitable for wood and agricultural residues
powder for large plant facilities. This type of incinerators for wood powder is
available in the range of 1 MW to 30 MW. In pulverized combustors, the fuel is
injected with air in the combustion chamber where combustion takes place while fuel
is in suspension. Rapid and efficient combustion in pulverized bed combustors is
succeeded only for small size particles (generally below 1 mm). Boilers equipped
with oil burners or coal powder burners can be converted to use biomass powder fuel,
or blends of biomass and fossil fuels. However, the pulverized bed combustion
process is difficult to control and may suffer from too high combustion temperatures,
above 1200°C which may result in high emissions of nitrogen oxides (NOx).
5.1.4 Efficiency
Boiler efficiency is defined as the percentage of the fuel energy that is converted to
steam energy. Significant factors that affect the efficiency of biomass combustion are
the moisture content of the fuel, the excess air injected into the boiler as well as the
percentage of non-combusted or partially combusted fuels. The Council of Industrial
Boiler Owners (CIBO) defines that the typical efficiency of fixed and fluidized bed
combustors ranges between 65% and 85%. However, fixed bed combustors usually
cannot succeed high efficiencies, with boiler efficiencies of 65%-75%. On the other
hand, fluidized bed boilers as more technologically advanced can reach high
efficiencies between 80% and 82% [112].
5.1.5 Operating Availability
The availability of a power generation system is the percentage of time that it is
available to operate. According to the literature, a typical operating efficiency for
continuous operation of both fixed and fluidized bed combustors is in around 90%. It
is understandable that the feedstock availability and quality which varies seasonally
also affect the plant availability. However, this is not an issue that determines the
design performance of the boiler. In most cases, a well-designed biomass steam
system is expected to operate with 92% to 98% availability [112].

[65]
5.2 Power Generation Technologies
CHP systems consist of specific individual components, such as prime mover (heat
engine), generator, heat recovery, and electrical interconnection, configured into an
integrated system. For CHP systems, prime movers usually are steam turbines, gas
turbines, spark ignition engines, diesel engines, micro-turbines, and fuel cells. These
prime movers can combust various types of fuels, including biomass, natural gas and
coal to produce shaft power or mechanical energy. A complete CHP system consists
also of additional technologies such as boilers, absorption chillers, desiccants, engine-
driven chillers, and gasifiers.
Mechanical energy from the prime mover, that it is most often used to drive a
generator to produce electricity, can also be used to drive rotating equipment such as
compressors, pumps, and fans. Thermal energy from the system can be used in direct
process applications or indirectly to produce steam, hot water, hot air for drying, or
chilled water for process cooling.
Currently, the industrial sector produces both thermal energy and electricity from
biomass in CHP facilities in the paper, chemical, wood products, and food processing
industries. In these applications, the typical CHP system configuration consists of a
biomass-fired boiler whose steam is used to generate a steam turbine in addition to the
extraction of steam or heat for process use [84] [115].
5.2.1 Steam Turbine Technologies
Steam turbine is a thermodynamic device that converts the energy in high pressure
and temperature steam into shaft power which can in sequence be used to turn a
generator and produce electricity. In gas turbines and reciprocating engine CHP
systems heat is a byproduct of power generation. On the contrary, steam turbine CHP
systems generate electric power as a byproduct of steam generation. In a steam
turbine CHP system, the turbine requires a separate heat source and does not directly
convert fuel to electricity. The energy produced during fuel combustion is transferred
from the boiler to the turbine through high pressure steam, which in turn provides
movement to the turbine and generator, while steam at lower pressure is extracted
from the steam turbine and used directly or is converted to thermal energy. Rankine
cycle as presented in Figure 25, is the thermodynamic cycle usually employed. In this

[66]
cycle, water, in liquid form, is converted into high-pressure steam in the boiler and
transferred to the steam turbine. The steam rotates the turbine blades, creating power
that is turned into electricity through a generator. Afterwards, a condenser and pump
collect the steam exiting the turbine, and feed it into the boiler completing the cycle.
Figure 25. Boiler/Turbine System (Simple Steam Turbine Power Cycle).
There are several types of steam turbines, each one for a different purpose:
(a) Condensing steam turbines, such as those in Figure 25 and Figure 26, are only
used for power applications and expand the pressurized steam to a low pressure point
where a steam and liquid water mixture is exhausted to a condenser at vacuum
conditions.
Figure 26.Condensing Steam Turbine.

[67]
(b) Back-pressure turbines, as shown in Figure 27 exhaust the entire flow of steam to
the process or facility at the required pressure.
Figure 27. Back-pressure (non-condensing) Steam Turbine.
(c) Extraction turbines, as shown in Figure 28, have openings in their casings for
extraction of a portion of the steam at some intermediate pressure for use in other
processes or space heating.
Figure 28. Extraction Steam Turbine.
Steam turbine power generation has been in use for about 100 years, when they
replaced reciprocating steam engines due to their higher efficiencies and lower costs
and they are widely used in CHP facilities. The capacity of steam turbines can range
from 50 kW to several hundred MW for large utility power plants [84] [115].

[68]
6. Case Study
6.1 The situation in Greece
Land disposal of MSW still remains a crucial issue in Greece. Although 18% of MSW
is recycled at source, the remaining 82% is disposed without any prior treatment, from
which the 52% ends up in landfills, whilst the 40% is disposed illegally in non-
approved sites. Currently, Greece produces approximately 5.58 million tons of MSW
annually in which the contribution of the greater area of Athens is 39%, while this of
the city of Thessaloniki reaches 9% of the total production [46] [116] [117].
According to Table 8 and Table 9, which illustrate the chemical composition as well
as the heating values in a dry basis of MSW generated in Greece, the total High
(HHV) and the Low Heating (LHV) values, recorded in 2010, are 11.69 and 9.75
respectively [118].
Table 8. Chemical Waste Composition, HHV and LHV Values in a dry basis, in Greece.
Waste Fraction Moisture
(%)
C
(%)
H
(%)
O
(%)
N
(%)
S
(%)
Ash
(%)
HHV
(MJ/kg)
LHV
(MJ/kg)
Paper/cardboard 70 48 6.4 37.6 2.6 0.4 5 7.08 3.96
Food waste 6 43.5 6 44 0.3 0.2 6 14.49 13.03
Plastic 2 60 7.2 22.8 0 0 10 26.11 24.48
Textile 10 55 6.6 31.2 4.6 0.2 2.5 20.17 18.47
Metals 3 4.5 0.6 4.3 <0.1 0 90.5 1.55 1.35
Glass 2 0.5 0.1 0.4 <0.1 0 98.9 0.23 0.16
Wood waste 20 49.5 6 31.2 4.6 0.2 2.5 15.96 14.16
Yard waste 60 47.8 6 38 3.4 0.3 4.5 7.94 5.16
Others 20.5 20.91 2.39 12.78 0.4 0.1 42.93 6.27 5.69
Total calorific values 11.69 9.75
Table 9. Waste Heating Value and Physical Waste Composition, in Greece.
Waste Fraction Composition (%)
Organics 40
Paper/cardboard 30
Plastic 14
Metals 3
Glass 3
Leather-Wood-Textile 2
Inert 3
Other 6

[69]
6.2 The case of Thessaloniki
Thessaloniki is the second largest city of Greece located in the northern part of the
country in the region of Central Macedonia. It occupies an area of 18,811 km2 with
1,881,869 inhabitants. The Greater Metropolitan area of Thessaloniki consists of 14
Municipalities, most of which have high population density, with the amount of
inhabitants in the greater area reaching 1,110,312 people, whilst approximately
352,000 people live in Municipality of Thessaloniki [116] [119].
For the last 30 years, the whole area of Thessaloniki, regarding MSW management, is
served by only one sanitary landfill located 35 km southeast of the city with a total
area of 100 ha, the greater part of which has already been covered.
Table 10 demonstrates the annual generation of MSW in the greater area of
Thessaloniki, in conjunction with the rise of its population through the years. From
this table, there is a noticeable decrease of the rate of waste production from 2006 to
2012 which results in a decrease of the total amount of solid wastes in 2012 regardless
of the population increase [116].
Table 10. Generation of MSW in the Greater Area of Thessaloniki.
Year 1987 1998 2006 2012
Population 750,000 1,000,000 1,100,000 1,110,000
MSW production
(kg/person/year) 280 460 560 402
Total MSW production
(kg/year) 210,000,000 460,000,000 616,000,000 447,000,000
More analytically Figure 29 displays the variation of solid waste collection in the
Municipality of Thessaloniki for the 2001-2014 time period. Despite the fact that
there were no data for the year 2007, in general, there is a prominent increase of the
waste amount from 2005 to 2009 with a pick of 195,282 tons of solid waste collected
in 2009. Nevertheless, a significant decrease of this amount occurs after 2010 to be
almost stabilized in the last two years (2013-2014) between 112,000 and 113,000 tons
[119].

[70]
Figure 29. Thessaloniki’s Variation of Solid Waste Collection Data 2001-2014.
Figure 30 illustrates the monthly variation of solid waste production from the city,
that was finally disposed to the landfilled facility during the 2012-2013 period [119]
[120]. The maximum waste disposal was recorded in September, whilst there are no
substantial differences between the monthly landfilled waste amounts, as Thessaloniki
is a high residential city either of constant habitants or tourists, during the whole year.
Additionally, while the total amount of solid waste for the region of Thessaloniki,
consisting of 14 Municipalities, was almost 407,000 tons in 2012, the disposed solid
waste only from the city itself was approximately 123,000 tons. However, in 2014 the
total amount of MSW of the city was diminished at about 112,000 tons.
Figure 30. Solid Wastes to Landfilled Facility per month in 2012 for the City of
Thessaloniki.
2001 2002 2003 2004 2005 2006 2007 2008 2009 2010 2011 2012 2013 2014
Tons 110,424 111,286 108,280 112,136 157,756 162,386 0,000 160,209 195,282 152,774 146,878 123,486 113,597 112,281
0,000
50,000
100,000
150,000
200,000
250,000To
ns
Jan Feb Mar Apr May Jun Jul Aug Sep Oct Nov Dec
Tons 10,243 9,231 10,575 10,061 10,771 10,978 10,243 9,505 11,300 11,135 9,328 10,112
0,000
2,000
4,000
6,000
8,000
10,000
12,000
Ton
s

[71]
6.2.1 Physical and Chemical Characteristics of MSW in
Thessaloniki
Regarding the composition of Thessaloniki’s MSW, according to a specific study, the
results of which are presented in Table 11, there are significant fluctuations and
differences in the waste composition from 1987 to 2012. Between these years an
increase in the organics fraction and a decrease in paper and plastic were observed, as
a result of recycling and population increase [119] [120].
Table 11. Composition of Thessaloniki’s MSW from 1987 to 2012.
Waste Fraction 1987 1998 1999 2004 2006 2012
Organics (%) 61.1 35.75 47 38.34 36.13 47.6
Paper (%) 17.7 29.21 23 26.66 25.86 21.9
Plastic (%) 7.2 17.9 13 17.9 19.71 12.1
Glass (%) 4.1 4.61 3 3.61 3.66 3.5
Metals (%) 5.9 3.4 4 4.03 3.39 3.9
Other (%) 4 9.13 10 9.46 11.25 11
Furthermore, the average composition of Thessaloniki’s MSW, which is presented in
Figure 31, appears to be similar to that of other European cities with a similar
population [119] [120].
Figure 31. Composition (% by weight) of Thessaloniki’s MSW in 2012.
22%
3%
4%
12%
2%
46%
11%
Paper & cardboard
Glass
Metal
Plastic
Textiles
Organics
Other

[72]
In general, MSW are divided in two categories according to their combustion ability:
the combustible wastes such as fermentable materials, plastic, paper, wood, rubber,
leather, fabrics, etc. and the incombustible wastes like glass, metals, aggregates etc.
The moisture and ash content of MSW as well as the combustible material content
depend on their composition. Combustion and more specifically energy recovery of
waste is coupled with the amount of heat that can be released during combustion. The
amount of heat emitted during combustion of unit mass of a material is expressed as
calorific value of this material. Depending on the physical state of water vapor
produced during combustion, the calorific value is referred to as higher (water vapor
condense into liquid) and lower (the steam remains in vapor phase). The calorific
value of a material depends on the content of the basic fuel elements, which are
carbon and hydrogen and to a lesser extent sulfur. Important parameters for the
combustion of a material constitute the moisture and ash content. Moisture contained
in the waste is an obstacle for an efficient combustion as it requires a significant
amount of energy to be removed in order to enable the waste to be burned and to
perform the containing thermal load. On the other hand, the ash consists of minerals
contained in waste (metal, glass, and other aggregates such as soil) which cannot be
burned and must be removed from the site of waste combustion [121]. Wastes are
burned when the moisture content does not exceed 50%, ash content 60% and the fuel
must be at least 25%, more specifically, when the lower calorific value is 3,350kJ/kg.
6.2.2 MSW Combustion
Waste Combustion is the process of oxidation of waste at high temperature in the
presence of oxygen. During this process the waste decomposes thermally in the
presence of excess air. The heat treatment process of waste is affected by the
following parameters:
Homogeneity,
The size of the particles,
Thermal conductivity,
The ignition temperature,
Specific weight,
Calorific value of fuel,
The quantitative composition of flammable material, ash and water,

[73]
The volatile content,
Hazardous substances content and
The melting point of ash,
The specific surface and conduction affect the speed of the thermal process. The
effect of these parameters is difficult to determine, due to the heterogeneity of the
materials. The ignition temperature is calculated at 400°C. The density of the waste
depends on the containing humidity and varies between 150-350kg/m3. The ash
content of MSW ranges from 26% to 33%wt. Moisture is 25-50%wt. [121].
According to previous studies the chemical characteristics of MSW for Thessaloniki
is presented in Table 12, moisture content is 27.7%, the ash content 29% while the
HHV is 21.58MJ/kg and the LHV is 8.42MJ/kg. The physical and chemical
characteristics of Thessaloniki’s MSW indicate that the MSW is suitable for energy
recovery. The high concentration of paper, plastic and other combustible materials
indicate incineration as a feasible treatment solution [115] [116] [120].
Table 12. Chemical Composition of MSW in Thessaloniki.
Parameter Average mean values (wet weight)
Moisture (%) 27.7 %
Ash (%) 29 %
C (%) 43.6 %
O (%) 19.7 %
H (%) 5.9 %
N (%) 1.8 %
C/N 27
Higher Heating Value (Ho) (kJ/kg) 21,580 kJ/kg
Lower Heating Value (Hu) (kJ/kg) 8,420 kJ/kg
Considering that the total feedstock of the city in 2014 was around 112,000 tons and
according to the MSW composition, the total solid biodegradable fraction of
Thessaloniki’s MSW for the specific year period was 104,000 tons. Thus, regarding
the composition in 100 kg of dry and ash free biomass, in 104,000 tons of input
biomass the quantity of C, H and O will be 45,300 tons, 6,100 tons and 20,500 tons,
respectively, as Table 13 demonstrates.

[74]
Table 13. Chemical Combustion Processes.
Dry-ash free
biodegradable biomass
Input Output
C H O CO2 H2O
100 kg 43.6 % 5.9 % 19.7 %
104,000 tons 45,300 tons 6,100 tons 20,500 tons 166,100 tons 55,000 tons
Through the stoichiometry of combustion process (1) and (2), 166,100 tons 55,000
tons of CO2 and H2O are produced, respectively, while the total quantity of O2
required for this process is 160,000 tons as it is presented in Table 14Table 14.
(1) 𝐶 + 𝑂2 → 𝐶𝑂2 (2) 2𝐻 + 12⁄ 𝑂2 → 𝐻2𝑂
1 𝑚𝑜𝑙 + 1 𝑚𝑜𝑙 → 1 𝑚𝑜𝑙 2 𝑚𝑜𝑙 + 1/2 𝑚𝑜𝑙 → 1 𝑚𝑜𝑙
Table 14. Total Oxygen Requirement for Combustion.
(1) O2 120,800 tons
(2) O2 48,800 tons
O2 existed 20,500/2= 10,250 tons
Total O2 needed for combustion 160,000 tons

[75]
6.3 Fluidized Bed Boiler CHP in Thessaloniki
According to similar biomass CHP facilities, the specific project presents the
simulation of a Fluidized Bed Boiler CHP facility in Thessaloniki, through the COCO
simulator software. Apart from the fluidized bed combustor, the facility consists of a
steam back-pressure steam turbine, a low-pressure steam turbine, a condenser and a
low-pressure pump. The annual feedstock of the city that is available for processing is
104,000 tons/year. Thus, considering a typical utilization of the plant at 90% annually,
as referred in Chapter 5, the biomass fuel feed is about 316 tons/day. Biomass fuel
characteristics are presented in Table 15 [84] [115].
Table 15. Biomass Fuel Characteristics.
Biomass Fuel Characteristics
Biomass Fuel Feed 316 tons/day
Moisture content 27.7 %
Energy content (LHV as received) 8.42 MJ/kg
6.3.1 Fluidized Bed Boiler
The fluidized bed combustion process has been in use for more than 25 years and it is
considered to be now an efficient and environmentally friendly technique. The
advantages of this combustion process outweigh the other combustion technologies,
regarding efficiency, energy production, capacity ranges and environmental
sustainability [113] [114].
Fluidized Bed Combustion technology is the dominant combustion process for MSW
treatment with the lowest emissions, worldwide. Great Waste-to-Energy facilities in
the world are based in this type of technology. Among these plants are: the Robbins
Resource Recovery Facility (Robbins, IL), the Toshima Incineration Plant (Tokyo,
Japan), the TIR Madrid Plant (Madrid, Spain), the Valene Plant (Mantes la Jolie,
France), the DERL Energy-from-Waste Facility (Dundee, Scotland), and the
Lidköping Waste-to-Energy Plant (Lidköping, Sweden) [122].
Thus, the low temperatures of the fluidized bed combustor, the high capacity ranges,
the flexibility concerning the moisture and fuel type, the ability to burn biomass with
a low ash melting temperature which normally makes the combustion chamber, the

[76]
boiler heating surface and the lining sticky, the efficient mixing action of the bed as
well as the low excess air result in a suitable and efficient method for Energy
Recovery from Thermal Conversion of Municipal Solid Waste (MSW) and Refuse
Derived Fuel (RDF) [41] [122] [123].
For the specific input rate of biomass the energy requirement of the incinerator for an
efficient combustion is 30 MW, based on the LHV of biomass feedstock.
For the CHP simulation in COCO simulator we choose to compare three different
pressure types of fluidized steam generators. More specifically subcritical boilers of
2MPa, 5MPa and 10 MPa are going to be examined. Moreover, a relatively new
technology of supercritical steam generators exists and it is used for the production of
electricity at supercritical pressures. In contrast to subcritical boilers, supercritical
boilers operate at high pressures, over 22 MPa, where the physical turbulence of
boiling does not occur and the fluid is neither liquid nor gas but a super-critical fluid.
On the other hand, typical subcritical fluidized boilers operate between 1 MPa and 10
MPa. Although supercritical boilers are more expensive than similar sized subcritical
boilers, the higher initial capital investment can be offset by the lifecycle savings
yielded by the technology’s improved efficiency, reduced emissions, and lower
operating costs, as a result of the higher steam temperature and pressure parameters
[122]. However, existing supercritical steam generator technologies are used only for
pulverized-coal-fired power plants and not for biomass yet. Hence, in this project we
are going to examine the application of these different pressure boilers in a CHP
plant.
Taking into account other similar projects of Fluidized Bed CHP plants, the
characteristics of three boilers selected for the specific project are presented in Table
16.
6.3.2 Steam Turbines
Regarding the steam turbines for the specific simulation, taking into account the
relative bibliography, it was decided to use two sequential steam turbines. The first
one is a High Pressure (HP) and back-pressure steam turbine which receives the high
pressure steam produced from the boiler, while the second one is a Low Pressure (LP)
condensing turbine which exhausts the low pressure mixture of saturated vapor and

[77]
liquid water directly to the condenser [41] [122] [123]. The characteristics of these
turbines are presented in Table 16.
Table 16. Characteristics of FBB CHP in Thessaloniki.
Fluidized Bed Boiler CHP in Thessaloniki
Biomass Fuel Characteristics
Biomass Fuel Feed (tons/day) 316
Moisture content (%) 27.7
Energy content (LHV as received) (MJ/kg) 8.42
Biomass Conversion
Boiler efficiency (zero moisture) (%) 84-95
Boiler efficiency (moisture adjusted) (%) 80
Heat input to boiler (MW) 30
Plant availability factor 0.9
Boiler Steam Conditions 2MPa Boiler 5MPa Boiler 10MPa Boiler
Boiler output pressure (MPa) 2 5 10
Boiler output temperature (°C) 540 540 540
Nominal steam flow (tons/hr) 31.4 31.7 32.2
CHP Back-Pressure High Pressure Turbine
Process steam conditions (MPa [saturated]) 1 1 1
Process steam flow (tons/hr) 31.4 31.7 32.2
HP-Turbine Efficiency (%) 90 90 90
CHP Low Pressure Turbine
Process steam conditions (MPa [saturated]) 0.1 0.1 0.1
Process steam flow (tons/hr) 31.4 31.7 32.2
LP-Turbine Efficiency (%) 90 90 90
Condenser-Heat Exchanger
Liquid Water output Temperature (°C) 48
Feed Pump
Liquid Water output Pressure (MPa) 2 5 10
Feed Pump Efficiency (%) 80 80 80
6.3.3 Condenser
After the condensing turbine the mixture of saturated vapor and liquid water passes
through an array of tubes, cooled by water from a river, lake or cooling tower, and it
is condensed into liquid water. The vacuum conditions in the condenser are caused by
the near ambient cooling water causing condensation of the steam turbine exhaust
steam in the condenser. For this case it is elected a typical temperature for condenser
at 48oC at constant pressure because of the Rankine cycle in Figure 32 [41] [122]
[123].

[78]
Figure 32. Rankine Cycle of a CHP unit.
The temperature-entropy (T-s) diagram, given in Figure 32, operates in the following
steps:
1-2 Isentropic Compression in the Pump. The feed pump raises the pressure of the
condensate. Due to the low specific volume of liquids, the pump input work is
relatively small.
2-3 Isobaric Heat Addition in the Boiler. In this stage the high pressure liquid enters
into the boiler from the feed pump, it is heated and converted into saturated vapor.
3-4 Isentropic Expansion in the Turbine. The vapor expansion produces work which
can be converted to electricity.
4-1 Isobaric Heat Rejection. The saturated mixture of vapor and liquid leaves the
turbine and it is condensed at low pressure in the condenser. The vapor’s pressure
remains below atmospheric pressure and it approaches the saturation pressure of the
operating fluid at the cooling water temperature [41].
6.4 Fluidized Bed Boiler CHP in Thessaloniki-COCO
Simulation
As it has already been referred the three different pressure types of fluidized bed
boiler will be examined in COCO. The characteristics of thee three fluidized bed
boiler CHP are introduced as data in COCO simulator that provides a graphical
simulation of the biomass CHP plants as well as the amount of energy production of

[79]
each facility. At this point a step-by-step presentation of the COCO process
simulation is going to be illustrated.
The first step, after opening COFE flowsheet programme, as presented in Figure 33.,
is to define the components for the simulation. In the specific occasion, water is the
only component of the cycle. Thus, clicking the “Settings” button on the left side of
the COFE window, in Figure 34, the “Flowsheet Configuration” window will open.
With the tab “Water” selected, in Figure 35, click the Add button.
Figure 33. COFE Flowsheet
Figure 34. Flowsheet Configuration.

[80]
Figure 35. Selection of Package or Package Manager.
Now we have our new property pack “Water” configured for use, as presented in
Figure 36 and the simulation is about to begin.
Figure 36. Property Configuration.

[81]
Now we will add the units of the CHP installation to the flowsheet. Under the “Insert”
menu, in Figure 37 and selecting “Unit Operation” we have the ability to insert any
unit for the process. The first unit must be added is the boiler as it is obvious in
Figure 38.
Figure 37. Insert Unit Operation.
Figure 38. Insert of Boiler.
Then clicking again the “Insert” menu and selecting “Stream” we can insert a material
stream and then clicking on the left side of the boiler, we connect a feed stream to the
boiler unit. Repeating the same process and then clicking on the right side of the
boiler, we can insert the terminate stream, as Figure 39, shows.

[82]
Figure 39. Insert of Streams.
Now we need to define conditions in the feed stream. Double-click or right-click on
stream 1 and select Edit/view streams. A window, like this in Figure 40, opens that
allows us to specify stream 1. Here we define the pressure, temperature and flow units
in MPa, oC and tons/hr respectively, as Figure 41 shows. For the specific example we
use the 10MPa fluidized boiler, thus, the flow rate of water, in 25 oC, that corresponds
to 30MW of boiler capacity is 32.2 tons/hr.
Figure 40. Stream Specification.

[83]
Figure 41. Stream Specification.
Next step is to specify conditions for the boiler, as presented in Figure 42. Double-
click or right-click on boiler and select Edit unit operation in order to enter conditions
for the unit: Pressure drop of 0 MPa, Temperature of 540 °C and Heat duty of 30MW.
Note that with the “Show GUI” (graphical user interface) button at the bottom of the
Unit operation window, we could interface to specify the unit.
Figure 42. Unit Operation Boiler Specification.

[84]
We must be sure that we have specified enough conditions so that the stream 1 and
boiler unit are turn into black as in Figure 43. Then, under the “Flowsheet” menu, we
select the “Solve” button. When the system is turn into green then it is solved and we
can observe the situation of the outflow stream in Figure 44.
Figure 43. Solution of the specified system.
Figure 44. Solution of the system.
Afterwards, we have to insert the HP and LP turbines. As previously, under the
“Insert” menu, and selecting “Unit Operation” we add an expander unit as Figure 45
and Figure 46 show.

[85]
Figure 45. Insert Unit Operation Expander.
Figure 46. Insert Expander.
We rename the Expander to HP-Turbine and we define its conditions as we did
previously, in case of the boiler. We specify conditions for the HP-Turbine, as
presented in Figure 47. Double-click or right-click on boiler and select Edit unit
operation in order to enter conditions for the unit: Pressure drop of 9MPa, Pressure of
1Mpa and Efficiency of 0.9. After we add the stream 3 and when the unit turns to
black, as in Figure 48, we can solve the system.

[86]
Figure 47. Unit Operation Expander Specification.
Figure 48. Specified HP-Turbine.
When the system is turn into green then it is solved and we can observe the situation
of the outflow stream in Figure 49. In this stage, saturated vapor exits from the
turbine at 233.756oC, 1MPa, with a constant flow rate.

[87]
Figure 49. Solution of the system.
Repeating the same process, we add the LP-Turbine, as shown in Figure 50, whose
conditions are: Pressure drop of 0.9MPa, Pressure of 0.1MPa and Efficiency of 0.9.
Figure 51 illustrates the solution of the new system, where some condensation occurs
resulting a saturated mixture of vapor and liquid water at 0.1MPa and 99.60oC.
Figure 50. Insert LP-Turbine.

[88]
Figure 51. Solution of the system.
Figure 52 and Figure 53 show that the same process is followed for the condenser
unit as well. Here, the outlet temperature is defined, according to similar facilities, at
48oC, while heat is rejected at constant pressure. The wet vapor exiting from the LP-
Turbine enters to the condenser to become a saturated liquid.
Figure 52. Insert and Specify Condenser.
Figure 53. Solution of the system.

[89]
After the condenser, we insert the LP-Pump following the same process. The
saturated liquid enters to the feed pump, where pressure rises at 10MPa with a small
increase of temperature at 48.95oC, to finally close the cycle and end up to the boiler.
However, in actual steam power cycle, which is quite different from the ideal Rankine
cycle there are heat losses as well as losses in the amount of liquid, during the
process, which is usually replaced after the condenser, in a feed water heater before
entering into the boiler. Here, for our convenience, we assume an ideal cycle without
any losses. Thus as we assume that there is no feed water heater, the amount of liquid
exiting the condenser will insert immediately to the boiler without being mixed with
additional water amount. Hence, the cycle starts from stream 6 where the water is
compressed liquid at 48.95oC and 10MPa, as presented in Figure 56.
Figure 54. Insert Unit Operation LP Pump.

[90]
Figure 55. Solution of the specified system.
Figure 56. Simulation and Solution of the Cycle.

[91]
After the cycle design, COCO simulator offers the possibility to calculate the energy
production and demand of the system. More specifically, the heat duty of boiler and
condenser, the energy generation from turbines and the energy demand of the pump.
Under the “Insert” menu, in Figure 37 and selecting “Energy stream” we have the
ability to calculate the work outputs and inputs for the two turbines and the pump
respectively. In the same way we calculate the heat duty of the boiler ad condenser as
presented in Figure 58. After “Solve” button the whole system turns into green and it
is finally solved.
Figure 57. Insert of energy streams.
Figure 58. Solution of the Integrated System.

[92]
Now, in order to have the whole process and parameters for both streams and unit
accumulated, we insert a “Stream report” and a “Unit parameter report” as shown in
Figure 59. As a result we have two table reports showing analytically the stream and
unit conditions, in Figure 60.
Figure 59. Insert of Stream and Unit Operation Report.
Figure 60. Integrated Simulation of the 10MPa FBB CHP.
We follow the same steps for the other two cases, for both 2MPa and 5MPa boiler.
The stream and unit operation reports from COCO simulation for these three cases are
presented in Table 17 and Table 18.

[93]
From the results, it is obvious that the higher the steam pressure from the boiler the
higher the energy production from the high pressure turbine is. On the other hand
when the steam pressure is low the low pressure turbine is more advantageous in
energy production. This is the reason why in the 2MPa boiler system energy
generation is almost 1.93MW while in the 10MPa boiler, 5.26MW are produced from
the first turbine. Additionally a slight but not significant difference is observed in heat
production between the different systems. It is understandable that the higher the
temperature difference between the steam and the water in heat exchanger is, the
higher the amount of heat exchange is. The cool water passes through the heat
exchanger at 15oC and 0.1MPa. Thus, as in the 2MPa boiler system the steam
temperature is 171.75oC, 23.5MW of heat exchange occur, while in the 10MPa boiler
system the smallest temperature difference produces 21.47MW of heat, in order to
exit from the heat exchanger at 48oC.
Table 17. Stream Report.
Stream 2 3 4 5 6
2 MPa Fluidized Bed Boiler CHP
Pressure (MPa) 2 1 0.1 0.1 2
Temperature (oC) 540 436.36 171.75 48 48.18
Flow rate (ton/hr) 32.3 32.3 32.3 32.3 32.3
5 MPa Fluidized Bed Boiler CHP
Pressure (MPa) 5 1 0.1 0.1 5
Temperature (oC) 540 315.19 99.60 48 48.47
Flow rate (ton/hr) 32.6 32.6 32.6 32.6 32.6
10 MPa Fluidized Bed Boiler CHP
Pressure (MPa) 10 1 0.1 0.1 10
Temperature (oC) 540 233.76 99.60 48 48.95
Flow rate (ton/hr) 33.2 33.2 33.2 33.2 33.2
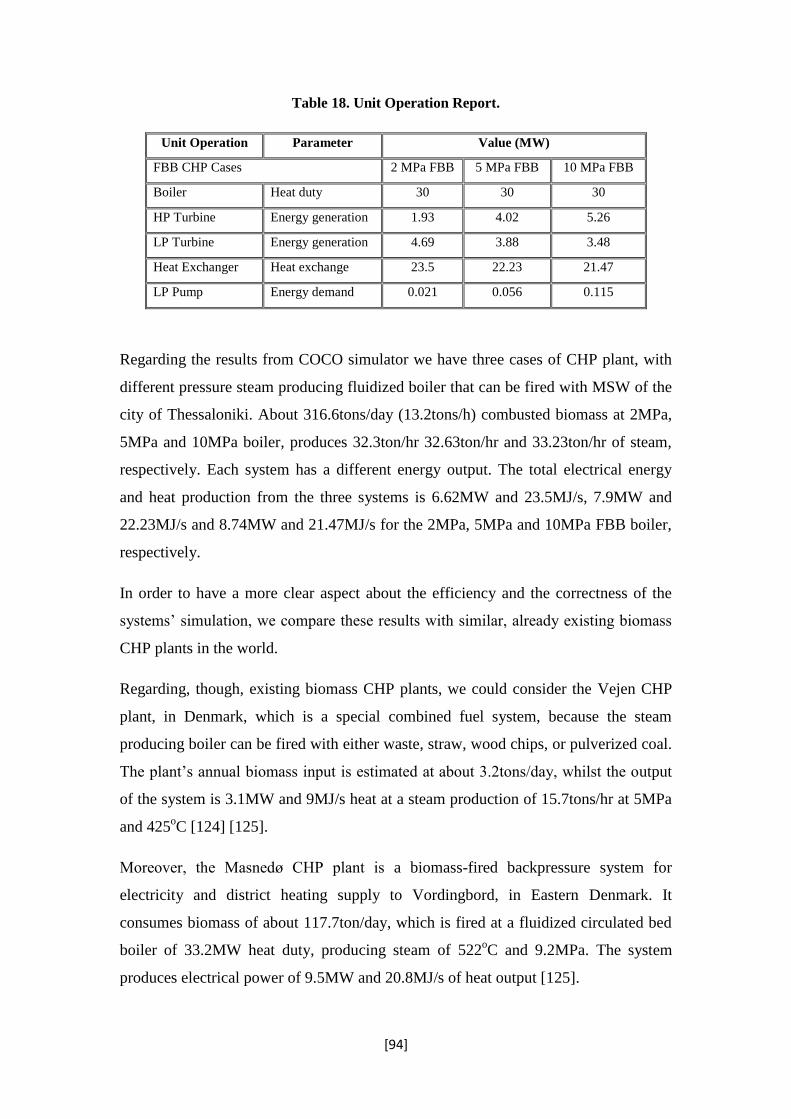
[94]
Table 18. Unit Operation Report.
Unit Operation Parameter Value (MW)
FBB CHP Cases 2 MPa FBB 5 MPa FBB 10 MPa FBB
Boiler Heat duty 30 30 30
HP Turbine Energy generation 1.93 4.02 5.26
LP Turbine Energy generation 4.69 3.88 3.48
Heat Exchanger Heat exchange 23.5 22.23 21.47
LP Pump Energy demand 0.021 0.056 0.115
Regarding the results from COCO simulator we have three cases of CHP plant, with
different pressure steam producing fluidized boiler that can be fired with MSW of the
city of Thessaloniki. About 316.6tons/day (13.2tons/h) combusted biomass at 2MPa,
5MPa and 10MPa boiler, produces 32.3ton/hr 32.63ton/hr and 33.23ton/hr of steam,
respectively. Each system has a different energy output. The total electrical energy
and heat production from the three systems is 6.62MW and 23.5MJ/s, 7.9MW and
22.23MJ/s and 8.74MW and 21.47MJ/s for the 2MPa, 5MPa and 10MPa FBB boiler,
respectively.
In order to have a more clear aspect about the efficiency and the correctness of the
systems’ simulation, we compare these results with similar, already existing biomass
CHP plants in the world.
Regarding, though, existing biomass CHP plants, we could consider the Vejen CHP
plant, in Denmark, which is a special combined fuel system, because the steam
producing boiler can be fired with either waste, straw, wood chips, or pulverized coal.
The plant’s annual biomass input is estimated at about 3.2tons/day, whilst the output
of the system is 3.1MW and 9MJ/s heat at a steam production of 15.7tons/hr at 5MPa
and 425oC [124] [125].
Moreover, the Masnedø CHP plant is a biomass-fired backpressure system for
electricity and district heating supply to Vordingbord, in Eastern Denmark. It
consumes biomass of about 117.7ton/day, which is fired at a fluidized circulated bed
boiler of 33.2MW heat duty, producing steam of 522oC and 9.2MPa. The system
produces electrical power of 9.5MW and 20.8MJ/s of heat output [125].
[95]
Additionally, biomass CHP plant Reuthe in Reuthe Vorarlberg in Austria, consumes
about 27.3tons/day of solid biomass, producing 6.3MW of heat ad 1.3MW of
electricity. Biomass is combusted in a 10MW boiler producing steam of 445oC and
3.2MPa [125].
The slight differences are noted between the already existing CHP plants and those
three cases, result especially from the amount and the type of biomass that is used. As,
for example, the combination of waste, wood and straw has higher heating values ,
high energy production can be succeed with lower feedstock flow rate. In general, we
could conclude that these simulation cases are acceptable and sufficient, taking into
account the already existing facilities.

[96]
6.5 COCO Simulation Results
Table 19 presents an integrated and more detailed view of the three systems’
characteristics and simulation results. Regarding these results we have the ability to
finally select the most efficient case for the specific project.
Table 19. System Characteristic and COCO Simulation Results.
Fluidized Bed Boiler CHP in Thessaloniki
Biomass Fuel Characteristics
Biomass Fuel Feed (tons/day) 316
Moisture content (%) 27.7
Energy content (LHV as received) (MJ/kg) 8.42
Biomass Conversion
Boiler efficiency (zero moisture) (%) 84-95
Boiler efficiency (moisture adjusted) (%) 80
Heat input to boiler (MW) 30
Plant availability factor 0.9
Boiler Steam Conditions 2MPa Boiler 5MPa Boiler 10MPa Boiler
Boiler output pressure (MPa) 2 5 10
Boiler output temperature (°C) 540 540 540
Nominal steam flow (tons/hr) 32.3 32.6 33.2
CHP Back-Pressure High Pressure Turbine
Electric output (MW) 1.93 4.02 5.26
Process steam conditions (MPa) 1 1 1
Process steam flow (tons/hr) 32.3 32.6 33.2
HP-Turbine output Temperature (°C) 436.36 315.19 233.76
HP-Turbine Efficiency (%) 90 90 90
CHP Low Pressure Turbine
Electric output (MW) 4.69 3.88 3.48
Process steam conditions (MPa) 0.1 0.1 0.1
Process steam flow (tons/hr) 32.3 32.6 33.2
LP-Turbine output Temperature (°C) 171.75 99.60 99.60
LP-Turbine Efficiency (%) 90 90 90
Condenser-Heat Exchanger
Thermal energy output (MW) 20.5 19.3 18.6
Liquid Water output Temperature (°C) 48 48 48
Feed Pump
Work input (MW) 0.021 0.056 0.115
Liquid Water output Temperature (°C) 48.18 48.47 48.95
Liquid Water output Pressure (MPa) 2 5 10
Feed Pump Efficiency (%) 80 80 80
CHP
CHP Efficiency (%) 89.65 89.8 90.2
Electrical Efficiency (%) 21.35 25.5 28.2
Thermal Efficiency (%) 75.8 71.7 62.25
[97]
The most commonly used approach to determining a CHP system's efficiency is to
calculate total system efficiency. The total system efficiency (ηCHP) of a CHP system
is the sum of the net useful power output (Wout) and net useful thermal outputs (Qout)
divided by the total fuel input (Qfuel), as shown below. Alternatively, the ηCHP is also
the sum of the electrical (ηe) and thermal (ηth) efficiency of the system. Considering
that the software does not provide the possibility to calculate the heat losses
throughout the whole process, we have to take into account 13% as typical thermal
losses. Thus, the thermal output for the three cases will be 20.5MW, 19.3MW and
18.6MW.
(3) 𝜂𝐶𝐻𝑃 =𝑊𝑜𝑢𝑡+𝑄𝑜𝑢𝑡
𝑄𝑓𝑢𝑒𝑙 (4) 𝜂𝑒 =
𝑊𝑜𝑢𝑡
𝑄𝑓𝑢𝑒𝑙 (5) 𝜂𝑡ℎ =
𝑄𝑜𝑢𝑡
𝑄𝑓𝑢𝑒𝑙
The total CHP plant efficiencies calculated for each one of the three cases are 89.65%,
89.8% and 90.2% for 2MPa, 5MPa and 10MPa FBB CHP system, respectively.
Although, the 10MPa FBB CHP plant seems to have higher efficiency, there are no
significant differences concerning the total CHP efficiencies. However, important
differences are noticed in thermal and electrical energy production separately. In
essence, electrical (ηe) and thermal (ηth) efficiency for the first case is 21.35% and
68.3%, respectively. For the second case, ηe is 25.5% and ηth is 64.3%, while for the
third case ηe is 28.2% and ηth is 62%. In order to select the most suitable case for the
specific project we must take into account the amount and the type of energy needs of
Thessaloniki’s habitants.
According to the survey of energy consumption in households, conducted by the
Hellenic Statistical Authority (HSA) during the period October 2011-September 2012,
the average power consumption of each household, to cover the energy needs, in the
country was 13,994kWh/year. 81% of this energy is consumed for a household’s
needs for space heating and cooking, while the overall annual energy needs for oil
heating and electricity are 44.1% and 26.8% respectively. The average annual thermal
and electrical energy consumption per household in Greece is 10,244KWh and
3,750KWh, respectively [127] [128].
Taking into account these energy needs, as well as the energy production of each case
and the 90% operating availability of the CHP facility we conclude that for 7,884
annual operation hours:

[98]
The 2MPa boiler CHP plant produces 52,192,000kWh/year of electricity and
179,170,000kWh/year of thermal energy, covering thermal and electrical energy
needs of 17,490 and 13.000 households, respectively and 30,490 households
totally.
The 5MPa boiler CHP plant produces 62,283,000kWh/year of electricity and
168,682,000kWh/year of thermal energy, covering thermal and electrical energy
needs of 16,470 and 16,600 households, respectively and 33,070 households
totally.
The 10MPa boiler CHP plant produces 68,906,000kWh/year of electricity and
162,564,000kWh/year of thermal energy, covering thermal and electrical energy
needs of 15,870 and 18,380 households, respectively and 34,250 households
totally.
Regarding Thessaloniki’s population at 1,110,000 habitants and 5 habitants as the
average number of members per household, the total number of households for
Thessaloniki is around 222,000 [127]. Thus, the first case covers the total energy
needs of 13.73% of the city’s households, the second serves the 14.9%, while the
third the 15.43%. It is obvious there are slight differences between the three cases.
The first case provides higher amount of thermal energy and covers the thermal
energy needs of 9.26% more than these of the third case. On the other hand, the latter
covers the electrical energy needs of 29.3% more than the former, while in total
energy needs it overweighs for almost 2%.

[99]
7. Conclusion
The constant increase of Municipal Solid Waste (MSW) as a result of the population
increase, urbanisation as well as human development is a severe global issue
threatening human health, environmental sustainability. The uncontrolled deposition
of MSW in landfills without specific treatment is a serious pollution source. Already,
in 2008, landfills contribution to total world methane production was 23%. In 17th
of
June 2008, the EU Parliaments introduces the Waste Framework Directive and
considers the Waste-to-Energy (WtE) as an energy recovery operation that must be a
part of every integrated waste treatment system. WtE system is an environmental
solution for the waste management issue as well as an alternative renewable energy
source. Currently, 520 WtE plants are operating, in Europe, with about 95 million
tons of MSW and commercial waste to be treated annually. Over the last five years,
the capacity of European WtE grew by 24% annually. WtE facilities exploit the
energy content of MSW to produce electricity, steam, heating and fuels while both
reducing waste’s volume by 90% and CO2 emission by around 50%. However, energy
recovery from waste facilities are not yet applied in Greece, with 293 Uncontrolled
Waste Disposal Sites still operating and facing faces serious penalties from EU for not
conforming to Directives. The lack of an integrated waste treatment with energy
recovery in Greece results in landfilling of 91% of the total amount of MSW, while
only 8% is recycled.
The majority of WtE plants in the world operate with waste combustion. Biomass
combustion is the most advanced, common and simplest technology to extract both
heat and electricity. Biomass CHP facilities can include a high variety of biomass
fuels such as wood, agricultural residues, wood pulping liquor and MSW. Beyond all
the already existed combustion technologies, Fluidized Bed Boiler is the most suitable
for MSW combustion because of its capability of handling high ash and moisture
content and extremely low heating values fuels. The fluidized bed boiler operates at
temperature between 800°C and 950°C, while reaching high capacity ranging between
20MW and 100MW with limited emissions.
The objective of the specific thesis work was to study the modelling of a Fluidized
Bed Boiler CHP facility for energy production from MSW of Thessaloniki, Greece,

[100]
by using the COCO simulation software. The total solid biodegradable fraction of
city’s MSW is about 104,000tons/year corresponding to 316.6tons/day incinerated
and producing 166,100tons of CO2 annually. For this amount of feedstock, three
different pressure types of fluidized boilers, of 30MW capacity each, have been
examined. The boilers pressures that have been studied are 2MPa, 5MPa and 10MPa.
The CHP plant also consists of a high and a low pressure turbine, a condenser and a
low pressure pump. According to available experimental data the efficient of the
boiler and feed pump was determined at 80%, both turbines at 90%, whilst heat loses
of the system were considered to be at 13%.
The COCO results indicate that 316.6tons/day of the city’s MSW is combusted at
2MPa, 5MPa and 10MPa boiler produces 32.3ton/hr 32.63ton/hr and 33.23ton/hr of
steam, respectively. Each system has a different energy output. The total CHP plant
efficiencies calculated for each one of the three cases are 89.65%, 89.8% and 90.2%
for 2MPa, 5MPa and 10MPa FBB CHP system, respectively. The total electrical
energy and heat production from the three systems is 6.62MW and 20.5MJ/s, 7.9MW
and 19.3MJ/s and 8.74MW and 18.6MJ/s for each case, respectively. Regarding the
population of Thessaloniki, the first case covers the total energy needs of 13.73% of
the city’s households, the second serves the 14.9%, while the third the 15.43%.
As it is obvious, there are no major differences between the results of each case.
However there is a dilemma concerning the selection of the most appropriate case for
the specific occasion. The final choice lays on what we want to produce and which
society’s needs we want to cover. In essence, in case we want to cover the electricity
needs more than the thermal then the 10MPa FBB CHP plant would be more suitable.
On the other hand, if we concern more about the thermal needs we should choose the
2MPa FBB CHP plant. The fact is that Thessaloniki thermal needs outweigh the
electricity demand. From this point of view the first case scenario would be suitable.
Nevertheless, the third case provides a higher total energy production while it does
not fall short in heat production as well.
Due to the fact that this thesis does not include an economic analysis for these cases,
we are not in position to come to a decision as we do not know the profitability of
each project. In terms of efficiency and total energy production the third case seems to
be ideal. However, the results might be different when the economic analysis occurs.

[101]
Conclusively, future work of this thesis work could be the economic analysis of each
case and the final selection of the most profitable case. Besides this, another future
action should be realized is the spatial planning of the CHP facility in an appropriate
area. Additionally, the determination of the emissions not only from the CHP
operation but also from the total transportation system should be included, as well as
the calculation of the waste disposal reduction. Finally, a total feasibility study for the
project’s viability and efficiency should be take place. While another future work
could be the study and modelling of a biomass CHP unit for the MSW exploitation of
the greater area of Thessaloniki, including MSW of the other Municipalities.

[102]
Bibliography
[1] Kyosti V. Sarkanen, David A. Tillman, 1979. Progress in Biomass Conversion.
[2] John Willey & Sons, Chichester Hagan, 1996. Biomass conversion and technology.
p. 8.
[3] D.L. Klass, 1989. Biomass for renewable energy fuels and chemical.
[4] D. Vamvouka, 2009. Biomass, Bioenergy & Environment.
[5] Papagrigorakis, Manolis J. Yapijakis, Christos Synodinos, Philippos N.
Baziotopoulou-Valavani Effie, 2006. DNA examination of ancient dental pulp
incriminates typhoid fever as a probable cause of the Plague of Athens.
International Journal of Infectious.
[6] 1665. The Great Plague of London, Contagion, Historical Views of Diseases and
Epidemics. Harvard University.
[7] Mumford, L., 1961. The City in History. New York: Harcourt, Brace & World
Solid Waste Engineering. Second Edition, SI.
[8] William A. Worrell and P. Aarne Vesilind, 2012. Solid Waste Engineering. Second
Edition. Bucknell University.
[9] George Tchobanoglous, Frank Kreith, 2002. Handbook of Solid Waste
Management. Second Edition.
[10] Human Development Report, 2010. The Real Wealth of Nations: Pathways to
Human Development.
[11] A. Imad, 2012. Municipal Solid Waste Management in Developing Countries:
Future Challenges and Possible Opportunities, Khatib, Palestine Polytechnic
University, Hebron, Palestine.
[12] E.A.Voudrias, Democritus University of Thrace, 2004. university notes in the
course of Municipal Solid Waste Technologies and Managemen.
[103]
[13] Mouri, G., Takizawa, S., Oki, T., 2011. Spatial and temporal variation in nutrient
parameters in stream water in a rural-urban catchment, Shikoku, Japan: Effects of
land cover and human impact, J. Environmental Management. pp. 92, 1837–1848.
[14] Bellos, D., Sawidis, T., Tsekos, I., 2004. Nutrient chemistry of River Pinios
(Thessalia, Greece). Environment International, pp. 30, 105–115..
[15] A. Bagchi, 1989. Design, construction, and monitoring of sanitary landfills. New
York: John Wiley.
[16] Ehrig. H.J., 1988. Water and Element Balances of Landfills, in Lecture Notes in
Earth Sciences, The Landfill, Berlin: P. Baccini (Editor), Springer-Verlag Press.
[17] Halvadakis CP., 1983. Methanogenesis in solid-waste landfill bioreactors, PhD
Dissertation, Stanford University, Stanford CA.
[18] Harris JM. Gaspar JA., 1989. Management of leachate from sanitary landfille,
Environmental Engineering Conference Proceedings. Malina JF. (Editor). New
York: ASCE, p. 320–333.
[19] M. El-Fadel, E. Bou-Zeid, W. Chahine, B. Alayli, 2002. Temporal variation of
leachate quality from pre-sorted and baled municipal solid waste with high
organic and moisture content. June, p. 269–282.
[20] Meena Khwairakpam, Renu Bhargava, 2008. Vermitechnology for sewage sludge
recycling. April, p. 949.
[21] Hefa Cheng, Yuanan Hub, 2010. Municipal solid waste (MSW) as a renewable
source of energy: Current and future practices in China. January.
[22] CEWEP (Confederation of European Waste-to-Energy Plants), 2013. Country
Reports on Waste Management: 1600 Waste to Energy facilities in the World.
[23] Energy Council , 2013. World Energy Resources: Waste to Energy.
[24] TECHNOLOGY DATA FOR ENERGY PLANTS, 2012. Generation of Electricity
and District Heating, Energy Storage and Energy Carrier Generation and
Conversion. [Online] Available at: https://www.energinet.dk

[104]
[25] Themelis, Nickolas J. and Zhixiao Zhang, 2010. The importance of WTE to China
and the global climate. Proceedings Waste Engineering, May.
[26] L. Qiu, N.J. Themelis, 2012. Analysis of the economics of Waste-to-Energy plants
in China Earth Engineering Center, Columbia University.
[27] Dr. Efstratios Kalogirou, PresidentN. J. Themelis, Director, 2012. Waste-to-
Energy Research and Technology Council, USA: SYNERGIA, Earth Engineering
Center, Columbia University.
[28] Manolis Klados, 2012. WASTE TO ENERGY TECHNOLOGY. [Online]
Available at: http://www.imbaenergyclub.gr [Accessed 11 August 2015].
[29] A. Gerasimou, President of the Greek Association Development of Biomass, 2013.
Rural Biomass and Potential Exploitation in Greece. October.
[30] M. Hristou, Biomass Department of RES Center, CRES, 2010. Potential of
Biomass in Greece.
[31] Esayas Alemayehu, Jimma University, 2004. Solid and Liquid Waste Management.
[32] EIONET European Topic Centre, Sustainable Consumption and Production.
[Online]
Available at: http://scp.eionet.europa.eu
[33] Ministry for the Environment, Energy and Climate Change, 2011, [Online]
Available at: http://www.ypeka.gr
[34] Ministry for the Environment, Energy and Climate Change, 2012, [Online]
Available at: http://www.ypeka.gr
[35] European Environmental Agency (EEA), 2013. Managing municipal solid waste-a
review of achievements in 32 European countries.
[36] Alexandros Aivazidis, Democritus University of Thrace, 2007. university notes in
the course of Wastewaters and Wastewater Technologies and Management.
[37] Egyptian Environmental Affairs Agency (EEAA), 2002. Industrial Wastewater
Treatment Plants Inspection Manual.
[105]
[38] 2012 WFD review by the European Commission. [Online] Available at:
http://eur-lex.europa.eu/legal
[39] Directive [2008/98/EC] of the European Parliament and of the Council on waste.
[40] E.A.Voudrias, Democritus University of Thrace, 2005. university notes in the
course of Municipal Solid Waste Technologies and Management.
[41] Heracleous E., International Hellenic University (IHU), 2014. university notes in
the course HydroPower-Wave and Tidal Energy-Bioenergy.
[42] Peter McKendry, 2002. Energy production from biomass (part 2): conversion
technologies.
[43] FAO: Corporate Document Repository, Natural Resources Management and
Environment Department, n.d. Waste Treatment and use in agriculture. [Online]
Available at: http://www.fao.org/ [Accessed 18 August 2015].
[44] Konstantinos P. Tsagarakis , Dr Nigel J. Horan, Prof. Duncan D. Mara, Dr
Andreas N. Angelakis, 2002. Management of Biosolids from Municipal Wastewater
Treatment Plants in Greece.
[45] Eurostat, 2015. Municipal waste statistics. [Online] Available at:
http://ec.europa.eu
[Accessed 14 August 2015].
[46] B.N. Karagianis, Chemical Engineer, National TechnicalL University of Athens
(NTUA), 2013. Solid Waste Treatment-Recycling. [Online] Available at:
http://thess.pde.sch.gr [Accessed 13 December 2015].
[47] G. Tchobanoglousetal, George Tchobanoglous, Hilary Theisen, S. A. Vigil, 1993.
Integrated solid waste management. McGraw-Hill (Editor).
[48] Dimitrios C. Panagiotakopoulos, 2002. Sustainable Management of Municipal
Solid Waste.
[49] K. Songtao, W Kun, E. Kalogirou, N.J.Themelis, A.C.Bourtsalas. Waste
management in Greece and in China and potential for waste-to-energy.

[106]
[50] Dr. Efstratios Kalogirou, n.d. WASTE TO ENERGY SOLUTION FOR GREEK
MSW. [Online] Available at: http://www.wtert.gr [Accessed 11 December 2015].
[51] Technical Chamber of Greece , 2006. Municipal Solid Waste Treatment the Case
of Attica.
[52] Ioannis Bakas and Leonidas Milios, Copenhagen Resource Institute, European
Environment Agency (EEA), 2013. Municipal waste management in Greece.
[53] Dr. Efstratios Kalogirou, President N. J. Themelis, SYNERGIA, Earth Engineering
Center, Columbia University, USA, n.d. Waste-to-Energy Research and
Technology Council. [Online]
Available at: http://www.wtert.gr [Accessed 11 December 2015].
[54] Technical Chamber of Greece, 2006. Municipal Waste Treatment and Urban
Environment. [Online] Available at: http://web.tee.gr/
[55] Eurostat, n.d. Environment in the EU Each person in the EU generated 481 kg of
municipal waste in 2013. [Online] Available at: http://www.avgi.gr/ [Accessed 10
August 2015].
[56] Eurostat, 2015. In SL the 81% of the municipal waste in Greece. [Online]
Available at: http://www.avgi.gr/ [Accessed 10 August 2015].
[57] Ministry for the Environment, Energy and Climate Change, 2007. Annex II:
Review and Evaluation of Needs in Solid Waste Treatment Projects. [Online]
Available at: www.dikaiologitika.gr [Accessed 10 August 2015].
[58] Ministry for the Environment, Energy and Climate Change, 2014. Fine 54,450 euro
per day for 239 Sanitary Landfills. [Online] Available at: www.dikaiologitika.gr
[Accessed 8 August 2015].
[59] Ministry for the Environment, Energy and Climate Change, 2015. In 15 days the
fine for illegal Sanitary Landfills. [Online] Available at: www.dikaiologitika.gr
[Accessed 10 August 2015].
[60] Ministry of Interior and Administrative Reconstruction, 2010. [Online] Available
at: http://www.ypes.gr/el/ [Accessed 10 August 2015].

[107]
[61] CEWEP (Confederation of European Waste-to-Energy Plants) , n.d. Available at
(last access 11/8/2015). [Online] Available at: http://www.cewep.eu/ [Accessed 11
August 2015].
[62] Tsagarakis, K.P., 1999. The Treatment of Municipal Wastewater in Greece, Ph.D.
Thesis, Leeds, United Kingdom: University of Leeds, School of Civil Engineering.
[63] Tsagarakis, K.P., P. Tsoumanis, K. Chartzoulakis and A.N. Angelakis, 2001.
Water Resources Status Including Wastewater Treatment and Reuse in Greece
Related Problems and Prospectives. Second Edition. International Water
Resources Association (IWRA).
[64] Tsagarakis, K.P., G.E. Dialynas and A.N. Angelakis. 2004. Water Resources
Management in Crete (Greece) Including Water Recycling and Reuse and
Proposed Quality Criteria. Agricultural Water Management,
[65] A.Karamanos, S. Aggelides, P. Londra, 2007. Non-Conventional Water Use in
Greece.
[66] European Commission - Press release database, 2015. Commission takes Greece
to Court over poor waste water treatment presenting a risk to public health
Brussels. [Online]
Available at: http://europa.eu
[67] EU takes action over wastewater treatment in Greece. [Online] Available at:
http://www.globalprocessingmag.com/ [Accessed 16 August 2015].
[68] Mark Döing, 2014. Time Out: For Waste to Energy in Europe. [Online]
Available at: www.waste-management-world.com [Accessed 11 August 2015].
[69] Manolis Klados, 2012. WASTE TO ENERGY TECHNOLOGY. [Online]
Available at: http://www.imbaenergyclub.gr [Accessed 11 August 2015].
[70] European bioplastic, 2015. Energy Recovery.[Online]
Availableat:http://en.european-bioplastics.org/

[108]
[71] CEWEP (Confederation of European Waste-to-Energy Plants), 2014. Country
Reports on Waste Management.
[72] Jan Manders,Deputy President CEWEP, 2013. Integrated waste management of
MSW across Europe Waste to Energy as a professional route to treat residual
waste.
[73] Donald Klass, n.d. An Introduction to Biomass Energy a Renewable Resource.
[Online]
Available at: www.bera1.org, [Accessed 18 August 2015].
[74] Nisha Sriram, 2005. Renewable Biomass Energy.
[75] Peter McKendry, 2001. Energy production from biomass (part 1): overview of
biomass.
[76] Ralph E.H. Sims (New Zealand), Robert N. Schock (USA), 2007. Energy Supply.
[77] Sameer Maithel, 2009. Biomass Energy-Resource Assessment Handbook.
[78] Biofuels. [Online] Available at: http://www.agroenergy.gr [Accessed 18 August
2015].
[79] INVENT – Integrated Waste Management modules for different courses of
graduate studies, Biomass combustion processes. [Online] Available at:
http://www.invent.hs-bremen.de
[Accessed 13 October 2015].
[80] West to Energy Conversion routes. [Online] Available at:
http://www.bioenergyconsult.com
[Accessed 22 August 2015].
[81] Biomass Power. [Online] Available at: http://www.yokogawa.com [Accessed 22
August 2015].
[82] EPTA, 2010. Study for construction a MSW treatment facility, Analysisi and
Examination of available technologies of MSW processing for the region of
Epirus.
[83] Austrian Ministry of Life, 2010. Waste–to–Energy in Austria, White Book.

[109]
[84] Environmental Protection Agency (EPA) Combined Heat and Power Partnership,
2007. Biomass CHP Catalog, Power Generation Technologies.
[85] IEA Bioenergy, Biomass Combustion and Co-firing: an Overview. [Online]
Available at: http://www.ieabioenergy.com
[86] V. Belgiorno, G. De Feo, C. Della Rocca, Napoli Department of Civil
Engineering, University of Salerno, 2002. Energy from gasification of solid
wastes. 11 September.
[87] J.A. Ruiz, M.C.Juarez, M.P.Morales, P.Munoz, M.A.Mendıvil, 2013. Biomass
gasification for electricity generation: Review of current technology barriers.
[88] Soulios V., Kosmas D., Metavisiadis V., Marnelos G., 2015. Productiona of
Electricity from Municipal Solid Waste in Kos.
[89] A.V. Bridgwater, D. Meier, D. Radlein, 1999. An overview of fast pyrolysis of
biomass.
[90] Peter McKendry, 2002. Energy production from biomass (part 3): gasification
technologies.
[91] U.S. Department of Energy, Bioenergy Technologies Office, n.d. Energy
Efficiency and Renweable Energy. [Online] Available at: http://www.energy.gov
[Accessed 25 August 2015].
[92] M.M Kucuk, A. Demirba, n.d. Biomass Conversion Processes. 1997.
[93] Lise Appelsa, Joost Lauwersa, Jan Degrhvea, Lieve Helsenb, Bart Lievensc, Kris
Willemsc, Jan Van Impea, Raf Dewila, 2011. Anaerobic digestion in global bio-
energy production: Potential and research challenges.
[94] Smet E, Van Langenhove H, De Bo I. , 1999. The emission of volatile compounds
during the aerobic and the combined anaerobic/aerobic composting of bio-waste.
Atmos Environment.
[95] Appels L, Baeyens J, Degrθve J, Dewil R., 2008. Principles and potential of the
anaerobic digestion of waste-activated sludge. Prog Energy Combust.

[110]
[96] Owens JM, Chynoweth DP, 1993. Biochemical methane potential of municipal
solid waste (MSW) component. Water Sci Technol.
[97] Dr. Jasper van Baten, AmsterCHEM, n.d. AN INTRODUCTION TO COCO.
[Online] Available at: http://www.cocosimulator.org
[98] Jasper van Baten, AmsterCHEM Michel Pons, CO-LaN, n.d. RAPID
PROTOTYPING OF UNIT OPERATION MODELS USING GENERIC TOOLS
AND CAPE-OPEN. [Online] Available at: http://www.cocosimulator.org
[99] Ross Taylor, Harry Kooijman, Brett Walker, 2011. Modelling Luyben's Chemical
Processes with COCO and ChemSep.
[100] Ross Taylor, Clarkson University, Jasper van Baten, AmsterCHEM, 2010.
Flowsheeting with COCO and ChemSep.
[101] Handbook Chapter 3: CAPE-OPEN Flowsheet Simulations with ChemSep.
[Online]
Available at: http://www.chemsep.com [Accessed 10 September 2015].
[102] GCO-Final Technical report: Global CAPE-OPEN Delivering the power of
component software and open standard interfaces in computer-aided process
engineering. [Online] Available at: http://www.ims.org [Accessed 10 September
2015].
[103] ChemSep Modelling Separation Process. [Online] Available at:
http://www.chemsep.org [Accessed 10 September 2015].
[104] Jasper van Baten AmsterCHEM, Delft, The Netherlands, Harry Kooijman and
Ross Taylor Clarkson University. Why COCO or Do we really need another
Flowsheeting progam, even if it is free?.
[105] Richard Baur, Anja Olijve, Peter Nellen, Jasper van BatenGeneral. Introduction
on CAPE OPEN Demo of the amine absorption model Demo of the hydrotreating
model Demo of model prototyping toolboxes in Excel & MatLab CAPE-OPEN
applications in Shell.
[106] Jasper van Baten, Ross Taylor, Harry Kooijman. Using Chemsep, COCO and
other modeling tools for versatility in custom process modeling.

[111]
[107] Dr. Jasper van Baten. FLOWSHEET MONITORING: HOW, WHAT AND
WHY?.
[108] Maurizio Fermeglia, Gennaro Longo, Letitia Toma, 2008. COWAR: A CAPE
OPEN Software Module for the Evaluation of Process Sustainability.
[109] William M. Barrett Jr., Jasper van Batenb, Todd Martin, 2011. Implementation
of the waste reduction (WAR) algorithm utilizing flowsheet monitoring.
[110] Manuel Rodríguez, Adrián Sáiz, 2013. Industrial Methanol from Syngas: Kinetic
Study and Process Simulation.
[111] [126] John Vos, (2005), “Biomass Energy for Heating and Hot Water Supply in
Belarus Best Practice Guidelines Part A: Biomass Combustion”
[112] [127] UNEP Technical Study Report on “Biomass Fired Fluidized Bed
Combustion Boiler Technology for Cogeneration” http://www.unep.org
[113] European Biomass Industry Association http://www.eubia.org/index.php/about-
biomass/combustion/medium-to-large-scale-combusters
[114] [129] Qunxing Huang, Yong Chi, Nickolas J. Themelis, (2013) A Rapidly
Emerging WTE Technology: Circulating Fluid Bed Combustion
[115] U.S. Environmental Protection Agency (EPA), 2015. Catalog of CHP
Technologies.
[116] E. Papachristou, H. Hadjianghelou, E. Darakas, K. Alivanis, A. Belou, D.
Ioannidou, E. Paraskevopoulou, K. Poulios, A. Koukourikou, N. Kosmidou, K.
Sortikos, 2009. Perspectives for integrated municipal solid waste management in
Thessaloniki, Greece.
[117] Feleskoura Christina, Papaioannou Eleni, 2004. Dissertation: Modern
Technologies of waste recycling, treatment and energy management of wastes.
[118] I.S. Antonopoulos, A. Karagiannidis, E. Kalogirou, 2010. Estimation of
Municipal Solid Waste Heating Values in Greece in the Frame of Formulating
Appropriate Scenarios on Waste Treatment.
[119] Nikolaos Mourouzidis, 2015. The challenge of waste management in
Thessaloniki.

[112]
[120] Christopher J. Koroneos, Evanthia A. Nanaki, 2012. Integrated solid waste
management and energy production - a life cycle assessment approach: the case
study of the city of Thessaloniki.
[121] C. Feleskoura, E. Papaioannou, 2004. Modern MSW recycling Technologies,
Managemend and Energy Treatment of MSW.
[122] D.L. Granatstein. Technoeconomic Assessment of Fluidized Bed Combustors as
Municipal Solid Waste Incinerators: A Summary of Six Case Studies.
[123] Fluidized Bed Technology - Overview. [Online] Available at:
http://energy.gov/fe/science [Accessed 22 November 2015].
[124] 2014. The Benefits of Supercritical Boilers. [Online] Available at:
http://www.nationalboiler.com/ [Accessed 22 November 2015].
[125] CRES, 2001. Denmark: Current situation on CHP and biomass CHP in the
national energy sector.
[126] Biomass CHP Plant Reuthe, Reuthe Vorarlberg, Austria. [Online] Available at:
www.vol.at/vkw
[127] Regulation Energy Performance of Buildings - Ministry of Environment and
Energy , n.d. Energy consumption in greek households. [Online] Available at:
http://www.kenaktools.gr
[128] Μunicipal Enterprise of Sykies, 2007. Integrated Local Sustainable Development
Programme municipality of Sykies, Thessaloniki.