Embed Size (px)
Citation preview

Modelling of edge localised modes and edge localised mode controlG. T. A. Huijsmans, C. S. Chang, N. Ferraro, L. Sugiyama, F. Waelbroeck, X. Q. Xu, A. Loarte, and S. Futatani Citation: Physics of Plasmas (1994-present) 22, 021805 (2015); doi: 10.1063/1.4905231 View online: http://dx.doi.org/10.1063/1.4905231 View Table of Contents: http://scitation.aip.org/content/aip/journal/pop/22/2?ver=pdfcov Published by the AIP Publishing Articles you may be interested in Collisionality and magnetic geometry effects on tokamak edge turbulent transport. II. Many-blob turbulence inthe two-region model Phys. Plasmas 14, 102307 (2007); 10.1063/1.2780137 Zonal flow sawteeth and the time period between edge-localized transport bursts in tokamaks Phys. Plasmas 14, 012303 (2007); 10.1063/1.2424560 Collisionality and magnetic geometry effects on tokamak edge turbulent transport. I. A two-region model withapplication to blobs Phys. Plasmas 13, 112502 (2006); 10.1063/1.2364858 Edge-localized modes and edge transport in spherical tokamaks Phys. Plasmas 12, 052518 (2005); 10.1063/1.1914806 Edge impurity dynamics during an edge-localized mode cycle on DIII-Da) Phys. Plasmas 12, 056120 (2005); 10.1063/1.1891745
This article is copyrighted as indicated in the article. Reuse of AIP content is subject to the terms at: http://scitation.aip.org/termsconditions. Downloaded to IP:
131.155.151.137 On: Wed, 06 May 2015 08:13:15

Modelling of edge localised modes and edge localised mode control
G. T. A. Huijsmans,1 C. S. Chang,2 N. Ferraro,3 L. Sugiyama,4 F. Waelbroeck,5 X. Q. Xu,6
A. Loarte,1 and S. Futatani71ITER Organization, Route de Vinon sur Verdon, 13067 Saint Paul Lez Durance, France2Princeton Plasma Physics Laboratory, Princeton University, Princeton, New Jersey 08543, USA3General Atomics, P.O. Box 85608, San Diego, California 92186-5608, USA4Laboratory for Nuclear Science, Massachusetts Institute of Technology, Cambridge,Massachusetts 02139-4307, USA5Institute for Fusion Studies, University of Texas at Austin, Austin, Texas 78712, USA6Lawrence Livermore National Laboratory, Livermore, California 94551, USA7Ecole Centrale de Lyon, 69130 �Ecully, Lyon, France
(Received 6 August 2014; accepted 3 December 2014; published online 7 January 2015)
Edge Localised Modes (ELMs) in ITER Q¼ 10 H-mode plasmas are likely to lead to large tran-
sient heat loads to the divertor. To avoid an ELM induced reduction of the divertor lifetime, the
large ELM energy losses need to be controlled. In ITER, ELM control is foreseen using magnetic
field perturbations created by in-vessel coils and the injection of small D2 pellets. ITER plasmas
are characterised by low collisionality at a high density (high fraction of the Greenwald density
limit). These parameters cannot simultaneously be achieved in current experiments. Therefore,
the extrapolation of the ELM properties and the requirements for ELM control in ITER relies on
the development of validated physics models and numerical simulations. In this paper, we
describe the modelling of ELMs and ELM control methods in ITER. The aim of this paper is not
a complete review on the subject of ELM and ELM control modelling but rather to describe the
current status and discuss open issues. [http://dx.doi.org/10.1063/1.4905231]
I. INTRODUCTION
The ITER scenario to obtain an energy amplification
Q¼ 10 is based on the well-established ELMy H-mode. In
this scenario about 20–40% of the energy losses across the
plasma boundary are due to Edge Localised Modes (ELMs).
ELMs have been identified as MHD instabilities destabilised
by the large pressure gradients and the associated bootstrap
current in the H-mode pedestal. Each ELM can expel a sig-
nificant fraction of the plasma energy and density on a typi-
cal time scale of a few hundred microseconds. Extrapolating
the ELM energy loss from current experiments to ITER,
based on the observed scaling with collisionality,1 leads to
the prediction of very large losses per ELM of up to 10% of
the plasma thermal energy. The time scale for the energy
flux to the divertor has been found to scale well with the par-
allel propagation time,2 s//�L/cs, where L is the connection
length, cs the local sound speed. This time scale is expected
to be in the range of 250–500 ls, similar to the time scale in
current machines. As a consequence of the large thermal
energy content of ITER plasmas, the large fraction of the
energy lost per ELM and the time scales, the expected
energy flux to the divertor will be significantly larger in
ITER compared to present experiments. Natural ELMs in
ITER are likely to lead to enhanced erosion of the divertor.
In order to avoid a reduction of the lifetime of the divertor,
the amplitude of ELMs in ITER will need to be controlled to
be below 0.7 MJ per ELM.3
The control of ELMs can be achieved either by an
increase in the ELM frequency or by a complete stabilisation
of ELMs. The total ELM energy losses appear to be largely
independent of the ELM frequency, an increase in the fre-
quency leads to smaller losses per ELM and a reduction in
the peak heat loads. An increase in ELM frequency can be
achieved by providing an external trigger for the ELM, like,
for example, the injection of frozen hydrogenic pellets4 or
the application of fast variations (“kicks”) vertical position
of the plasma.5 A reduction of the ELM energy loss to
0.7 MJ in ITER will require an increase of the ELM fre-
quency by a factor of 30 over the natural ELM frequency.
The estimate of the natural ELM frequency in ITER is based
on a power through the separatrix of �100 MW of which
30% is assumed to be lost through ELMs. The largest natural
ELM size in ITER3 is assumed to be �20 MJ. Complete sta-
bilisation of ELMs has been obtained in DIII-D by applying
an external magnetic field perturbation.6 In other tokamaks,
the application of external magnetic perturbations has been
seen to lead to an increase of the ELM frequency.7–11 In
ITER, there will be two systems for ELM control, a high fre-
quency pellet injector system12 and a set of 27 magnetic field
coils inside the vacuum vessel.13 Vertical kicks may be an
option for ELM control in ITER at plasma currents up to
10 MA, but this method will not be available at the larger
plasma currents needed for Q¼ 10 operation.3
The expected energy loss per ELM in ITER is based on
the extrapolation from current experiments of the scaling of
the ELM size with collisionality. There is, however, no
underlying physics model that would explain or justify the
collisionality as the relevant parameter. In fact, a reduction
of the ELM size with increasing density (relative to the
Greenwald density NGW ½1020m�3� ¼ I½MA�=pa½m�2) has also
been observed1 albeit with a larger scatter in the data. ITER
1070-664X/2015/22(2)/021805/19/$30.00 22, 021805-1
PHYSICS OF PLASMAS 22, 021805 (2015)
This article is copyrighted as indicated in the article. Reuse of AIP content is subject to the terms at: http://scitation.aip.org/termsconditions. Downloaded to IP:
131.155.151.137 On: Wed, 06 May 2015 08:13:15

plasmas will be unique in the sense that ITER will operate at
low collisionality and high relative density N=NGW at the
same time. This regime cannot be obtained in current experi-
ments. The same issue arises in the extrapolation of the
results of ELM stabilisation with RMP coils from current
experiments to ITER. In DIII-D ELM stabilisation has been
obtained at low collisionality14 whereas in AUG the stabili-
sation of type-I ELMs requires a minimum density above a
given fraction of the Greenwald density15 (DIII-D also
achieved ELM stabilisation at high collisionality6). It is
therefore important to develop physics models and a predic-
tive simulation capability of the complete ELM cycle in
order to improve the confidence of the predictions of ELMs
and ELM control methods in ITER.
In this paper, we describe the modelling of ELMs
(Sec. II) and ELM control methods in ITER: externally
applied magnetic perturbations (Sec. III) and pellets (Sec.
IV). The aim of this paper is not a complete review on the
subject of ELM and ELM control modelling but rather to
describe the current status and discuss open issues.
Alternative methods for ELM control not further dis-
cussed here are the trigger of ELMs by fast “kicks” of the
vertical position of the plasma, the application of ECRH
(AUG, TCV), LHCD (EAST), and ELM free QH-mode and
I-mode plasmas.
II. MHD SIMULATIONS OF ELMS
In its simplest model, the ELM cycle can be separated
into 3 phases. In the first phase, as the H-mode pedestal
builds up, the plasma moves from an MHD stable state,
crossing the ideal MHD stability limit, to an MHD unstable
state, either through an increase of the H-mode pedestal pres-
sure gradient16 and/or through an increase of the width of the
pedestal.17,18 The relevant ideal MHD stability limits are
nowadays well known and are due to the onset of ballooning
modes driven by the edge pressure gradients, external kink
(peeling) modes driven by the bootstrap current associated
with the edge pressure gradient or the onset of so-called peel-
ing-ballooning modes driven by both the edge pressure gra-
dient and current.19 The time scale for an MHD instability
driven through the stability boundary can be estimated as20
s � s1=3E s2=3
A where sE is a typical confinement time, sA is the
Alfven time. For an ELM, the relevant confinement time is
the rebuilding of the pedestal after the previous ELM, i.e.,
sE � DW=PSOL � 1=fELM, inversely proportional with the
ELM frequency. This yields a typical time scale of several
tens of microseconds. In the second phase, the most unstable
MHD mode(s) grow exponentially until the instability causes
significant energy transport through convection or conduc-
tion. In this ELM crash phase, the MHD driven transport
reduces the pedestal pressure leading to a collapse of the
pedestal in typically some hundreds of microseconds. This
removes the drive of the MHD instability and the pedestal
recovers. One of the important open questions is what deter-
mines the final state after the ELM crash. It is not obvious
that this should be close the marginally stable state. In the
case of very large MHD induced transport, the MHD pertur-
bation has not yet decayed to a low amplitude when the
pedestal returns to a stable state and the pedestal pressure
can decay well below the marginally stable state.
In this section, the linear MHD stability limits are briefly
discussed, followed by the status of non-linear MHD simula-
tions of ELMs.
A. Linear MHD stability limits
The ideal MHD stability limits of the H-mode edge ped-
estal are due to the onset of pressure driven ballooning
modes, current driven kink (or peeling) modes or a combina-
tion of the two instabilities the so-called peeling-ballooning
modes. The observed maximum pedestal pressure gradients
before an ELM are in good agreement with the stability limit
from ideal MHD stability calculations.21–23 In these compar-
isons with experiment, the background plasma rotation is
usually ignored.
As an illustration, Figure 1 shows the ideal MHD stabil-
ity limits24 for an ITER Q¼ 10 scenario as calculated with
the MISHKA-1 code. The maximum stable pedestal pressure
in this ITER scenario is between 100 and 130 kPa,24,25 for a
“given” pedestal width of 5.4 cm. The limit is consistent
with the confinement requirements to obtain Q¼ 10. The
maximum pedestal pressure does depend on the assumed
pedestal width. The accessibility of the pedestal MHD limits
is not often discussed. However as shown in Ref. 24, for this
particular ITER scenario, the kink limit is not accessible
due to the saturation of the increase of the bootstrap current
with decreasing density. However, the limit due to the exter-
nal kink mode is sensitive to the assumed current at the
separatrix.
The EPED model26 combines the pedestal ideal MHD
stability limits with a local pressure gradient limit due to ki-
netic ballooning modes to give a prediction for both the
height and width of the pedestal. The kinetic ballooning
FIG. 1. Ideal MHD stability limits of the edge pedestal for an ITER Q¼ 10
equilibrium including toroidal mode numbers n¼ 3-40. The grey curve indi-
cates the stability limit as a function of the pedestal density [Reprinted with
permission from Maget et al., Nucl. Fusion 53, 093011 (2013). Copyright
2014 IAEA].
021805-2 Huijsmans et al. Phys. Plasmas 22, 021805 (2015)
This article is copyrighted as indicated in the article. Reuse of AIP content is subject to the terms at: http://scitation.aip.org/termsconditions. Downloaded to IP:
131.155.151.137 On: Wed, 06 May 2015 08:13:15
mode limit is approximated by the infinite-n ideal MHD bal-
looning limit.28 The EPED predictions for the pedestal
height are in good agreement, within an error bar of 20%,
with measured pedestal heights for a large number of dis-
charges on multiple machines. For ITER, the EPED model
predicts a pedestal pressure of 92 kPa at a pedestal width of
0.04 in normalised poloidal flux26 with a strong dependence
of the achievable pedestal pressure on the pedestal density.27
The relatively good agreement between the observed
maximum pedestal pressure and the ideal MHD stability lim-
its appears to indicate that the non-ideal MHD effects such
as resistivity, diamagnetic flows, toroidal and poloidal flows
do not have a large influence on the stability limits. The sta-
bilising influence of the diamagnetic terms is commonly
taken into account using a simple analytic expression, cali-
brated on a limited set of calculations self-consistently
including diamagnetic terms. The effectiveness of the dia-
magnetic stabilisation is typically reduced by a factor of two
compared to the analytic expression. This is likely due to the
radial variation of the diamagnetic frequency calibration
across the width of the pedestal (and the MHD instability)
leading to a reduced or even incomplete stabilisation.29–31
As the diamagnetic terms scale with the toroidal mode num-
ber, the stabilisation is most efficient for high-n ballooning
modes. The relative amplitude of diamagnetic stabilisation is
smaller for larger machines as it scales with the inverse of
the ion-cyclotron frequency normalised to the Alfven time.
Reference 21 found that including diamagnetic stabilization
was needed to match DIII-D results. However, in ITER, with
a high pedestal density, the diamagnetic stabilisation is
expected to be small24 for the most unstable medium-n peel-
ing-ballooning modes. Gyro-fluid simulations32 show that fi-
nite Larmor radius (FLR) effects can effectively stabilize
high-n modes and indicate that ion diamagnetic effects alone
may not be sufficient to fully represent the FLR stabilizing
effects.
The shear in the toroidal rotation profile in the pedestal
is typically found to have a stabilising influence on the high-
n ballooning modes.33–35 The stabilisation can be attributed
to the shearing of the ballooning mode structure. For
medium-n modes, both stabilisation34 and destabilisation
have been observed.33,36 The effect on the stability of peel-
ing modes is negligible.36
In JT60U, analysis of the pedestal stability37 showed
that the pedestal is well below the MHD stability limit when
the (counter) toroidal rotation was neglected. In this case, the
counter toroidal rotation was found to have a significant
destabilising effect on the most unstable modes. Including
the experimental rotation profile in the stability analysis
shows the experimental point is in good agreement with the
stability limit. In this case, the de-stabilising effect is not
attributed to the Kelvin-Helmholtz drive but is related to the
difference in the eigenmode frequency and the toroidal rota-
tion frequency. In the analysis, the rotation was included
self-consistently in both the equilibrium and the linear stabil-
ity. In addition to changing the linear growth rates, the rota-
tion shear can also significantly alter, i.e., reduce, the width
of the linear eigenmode. This may have consequences to the
ELM affected area and the ELM amplitude.
The contribution of the Kelvin-Helmholtz drive of the
perpendicular (ExB) rotation in the pedestal was studied in
Ref. 38 using the BOUTþþ code in circular plasmas. The
KH term was found to be destabilising for medium to large n
ballooning modes, slightly stabilising for low-n modes.
However, the effect only becomes significant when the rota-
tion shear exceeds a certain threshold. In simulations with
the JOREK code in JET X-point plasmas,39 the localised
ExB flow in the pedestal was found to have a strong stabilis-
ing influence for the medium to high-n modes.
The impact of the shaped plasma geometry with X-point
has been studied using edge two-fluid code BOUTþþ. A set
of reduced MHD equations is used to simulate the linear
P–B mode in both snowflake plus and standard single-null
divertor configurations. Analysis shows that the implementa-
tion of snowflake geometry changes the local magnetic shear
in the pedestal region, which leads to different linear behav-
iours of the P–B mode in standard and snowflake divertor
configuration.42
A recurring question is the influence of the X-point on
the linear stability of the peeling and ballooning modes.
Conventional linear stability analysis considers the plasma
closely up to but not including the separatrix and a vacuum
region outside. In this case, the stability of peeling modes19
and peeling-ballooning modes25 can depend on the choice of
the distance of the assumed plasma boundary and the separa-
trix. This restriction is due to the use of a straight field line
coordinate system and the (artificial) separation into an ideal
MHD plasma region and a vacuum region inside the vessel.
A solution to this problem would be to avoid the separation
into plasma and vacuum and to include plasma on the whole
domain on both closed and open field lines as is now com-
monly used for non-linear ELM simulations (see Sec. III). A
significant step forward from the modelling point of view
would be to combine the whole domain approach with an
extended two fluid MHD model including toroidal, poloidal,
and diamagnetic flows and parallel heat conduction. The
flows would need to be included self-consistently in both the
equilibrium and the linear stability. However, validation of
the additional physics beyond the simple, but robust ideal
MHD model will be challenging. The dominant physics of
the most unstable modes is well described by the ideal MHD
model with the additional physics given only first order cor-
rections to the marginal stability boundaries. Validation will
require very accurate measurements of all the relevant pro-
files in the H-mode pedestal.
B. Non-linear MHD simulations of ELMs
The non-linear MHD simulation of the complete ELM
cycle is probably one of the most challenging numerical
problems in MHD in tokamaks. The difficulties in MHD
simulations in tokamak plasmas are generally due to the
large variation of time scales, the low resistivity (high
Lundquist numbers), and the large anisotropy in the parallel
to perpendicular heat conduction. For ELM simulations, the
time scales vary from the Alfven time scale of the MHD
instabilities (sA�ls) to the ELM repetition rate (fELM� few
Hertz for uncontrolled ELMs in ITER). A typical Lundquist
021805-3 Huijsmans et al. Phys. Plasmas 22, 021805 (2015)
This article is copyrighted as indicated in the article. Reuse of AIP content is subject to the terms at: http://scitation.aip.org/termsconditions. Downloaded to IP:
131.155.151.137 On: Wed, 06 May 2015 08:13:15

number at the top of the pedestal in ITER is S� 5 � 109,
leading to very small scale structures and very high spatial
accuracy requirements. The anisotropy of the parallel to per-
pendicular conduction at the ITER pedestal is j///j?� 1010
(for Braginskii, not flux-limited parallel conduction). This
leads to the need for very accurate numerical schemes to
avoid artificial perpendicular diffusion. In addition to these
complications common to many MHD applications, the sim-
ulations of ELMs have also more specific challenges. As
ELMs occur at the edge of the plasmas with x-point geome-
try, the simulation domain will need to include both the
closed and open field lines. This includes the separatrix
where at the X-point the local poloidal wave vector becomes
very large. Simulating the ELM energy losses to the divertor
and the first wall requires specific boundary conditions for
the parallel velocity and the energy fluxes, as commonly
applied in divertor physics codes. An additional complica-
tion is the medium to high-n toroidal mode number
(n� 6–20) of the linearly most unstable (peeling-) balloon-
ing modes with typically a range of unstable modes with
comparable growth rates. At the edge the inverse aspect ratio
is highest, increasing the toroidal mode coupling.
Due to these challenges in the simulation of ELMs, there
are currently no published simulations of the full ELM cycle,
i.e., evolving the plasma from a stable inter-ELM state,
through the instability back to a stable state. Multiple ELMs
have been simulated in circular geometry and a reduced two-
fluid MHD model.40 High frequency ELMs have been
obtained in flux tube geometry using a reduced Braginskii
model in the resistive ballooning mode limit,43 more likely
to be relevant for type-III ELMS.
A number of non-linear MHD codes, M3D,44,45
BOUTþþ,41 JOREK,47 NIMROD35 now have the capability
to simulate ELMs in shaped plasma geometry with X-point,
approaching the experimentally relevant values for the resis-
tivity and parallel heat conduction. At this stage in the devel-
opment of the simulation capability of ELMs, a common
approach is to start the simulations from an unstable equilib-
rium. This avoids the slowly evolving phase passing from
the stable to the unstable state. This approach is suitable for
studying the physics of the non-linear evolution of the ELM
and the energy and particle loss mechanisms. However, it is
not possible to obtain a realistic evaluation of the ELM size
with this approach as it is not clear by how much the plasma
can exceed the stability limit before an instability grows to
an significant size to prevent a further increase of the pedes-
tal (gradients).
An example of a simulated ELM crash48 in a DIII-D dis-
charge (#126 006,t¼ 3500 ms) with the M3D code is shown
in Fig. 2. The time scale of the initial outward ballooning
burst over 100–200 ls for this DIII-D case is consistent with
experimentally observed crashes. After the initial ballooning
outburst, the later ELM can proceed in a series of somewhat
random oscillations, as a series of smaller edge disturbances
grow and decay within a gradual overall damping.
The formation of filaments during the ELM crash is a
characteristic feature present in many ELM simulations per-
formed with the different MHD codes. These filaments are
formed by the interchange motion of the ballooning mode
instability which forms convective cells across the pedestal
onto the open field lines. The convective cells, localised on
the outboard side of the plasma, exchange high density from
the pedestal and low density from the scrape-off layer to
form high density field-aligned filaments outside the separa-
trix and, in some cases, low density holes inside the plasma.
The result strongly resembles the ballooning “filaments”
observed experimentally. Also the typical radial speed of the
order of km/s is in reasonable agreement between simula-
tions39,49–51 and experimental observations.
The non-linear interaction due to the Maxwell stress
leads to a strong growth of an n¼ 0 poloidal flow in the vi-
cinity of the pedestal.48,52,53 The n¼ 0 flow shears off the fil-
aments from the main plasma. After this the ELM
perturbation decays until a new burst of filaments grow and
detach from the plasma. It seems likely that this poloidal
flow leads to a saturation of the maximum amplitude of each
of these bursts. More unstable plasmas lead to a larger num-
ber of bursts.
Strong toroidal mode coupling can lead to a significant
difference between the behaviour of ELMs that evolve from
the interaction of multiple toroidal harmonics compared to
those started from a single dominant harmonic. Because bal-
looning and peeling modes tend to have a range of harmonics
with similar large growth rates, the first case appears to be
more realistic. Large scale numerical simulations with the
M3D extended MHD initial value code have explored48,54,55
this effect. They show that nonlinear toroidal interactions
may provide a purely MHD explanation for the moderate
observed ELM values n¼ 10–15, even in cases where the
linear unstable MHD modes are ballooning-like and have
peak growth rates at much higher harmonics48,55 n � 30. In
simulations started with a full spectrum of toroidal harmon-
ics at similar small amplitude, the MHD perturbation first
grows at the highest harmonics allowed in the simulation,
with the largest amplitude around the outer midplane similar
to ballooning or peeling eigenmodes, but by the time that the
MHD perturbation noticeably affects the total plasma edge
density and temperature, the n of the dominant harmonic has
decreased significantly. Simultaneously, the amplitude in the
outboard region closer to the top and bottom of the plasma,
h�660�, grew to be comparable to that at the midplane, as
shown in Fig. 2. This behavior was observed for nmax¼ 23
and 47; in both cases, the main ELM crash developed simi-
larly moderate harmonic numbers (n¼ 10–15). The maxi-
mum nonlinear growth rate, which occurred shortly before
the ballooning plasma fingers reached their maximum radial
extent, was significantly smaller than the linear growth rates,
including at the same n. Two-fluid terms from the drift order-
ing had little effect nonlinearly.
The non-linear toroidal coupling can also lead to a toroi-
dal and poloidal localisation of the filaments due to the beat-
ing of several linearly unstable toroidal modes56 leading to
the growth of a highly localized helical band with a strong
n¼ 1 component with a few filaments instead of a full set of
n toroidally equally distributed filaments. This effect is espe-
cially strong for spherical tokamaks at very low aspect ra-
tio48 but has also been found in ELM simulations in AUG.50
It should be noted that in other cases, with a dominant single
021805-4 Huijsmans et al. Phys. Plasmas 22, 021805 (2015)
This article is copyrighted as indicated in the article. Reuse of AIP content is subject to the terms at: http://scitation.aip.org/termsconditions. Downloaded to IP:
131.155.151.137 On: Wed, 06 May 2015 08:13:15

unstable toroidal harmonic, this coupling is not observed.51
Figure 3 illustrates some of the different filament structures
obtained in ELM simulations in DIII-D, NSTX-like and
AUG discharges. The resulting structures strongly resemble
the ballooning “filaments” observed experimentally in both
types of experiment. Both tokamaks and STs (e.g., DIII-D,
TCV and NSTX) naturally tend to develop n¼ 3 and n¼ 1
components.
A second characteristic feature of non-linear MHD
simulations of ELMs is related to the magnetic perturbation
of the ballooning mode instability. The formation of a sto-
chastic region during the ELM was found already in early
non-linear ELM simulations.52 In more recent simulations,
the magnetic structures in the stochastic region were identi-
fied as being related to so-called magnetic tangles.48,55 The
presence of a magnetic X-point on the plasma boundary
surface strongly influences the nonlinear character of edge
modes, especially the large ELMs that have the most global
character. In the equilibrium, magnetic field lines on the
separatrix become increasingly toroidal as they approach
the vicinity of the X-point and their intersection points on a
given vertical plane become more closely spaced; at the
X-point the field line is strictly toroidal. Mathematically,
toroidal magnetic fields can be described as Hamiltonian
systems with one (axisymmetric field) or two (non-axisym-
metric) degrees of freedom.57 An X-point in axisymmetric
toroidal plasma corresponds to a hyperbolic saddle point. A
local perturbation analysis58 shows that almost any small
transverse perturbation of the separatrix surface (including
ballooning and peeling modes in a plasma) produces field
line splitting, where two limits for the perturbed field sur-
face coexist near the X-point, one lying on the original
equilibrium surface and the other forming transverse loops
around it, that become narrower but longer as the field line
approaches the X-point. The X-point is a fixed point. The
resulting configuration is called a homoclinic tangle (for a
single X-point) and the many intersections of the transverse
field loops lead to a stochastic magnetic region around the
plasma edge. In the 3D torus, the loops helical corrugations
are aligned along the equilibrium field. Magnetic tangle
structures have been extensively studied for applied RMP
fields, based on the vacuum field generated by the external
coils.6,59 Nonlinear simulations have shown show that bal-
looning modes can self-consistently generate a tangle-like
perturbation.54,55 The tangle feeds back on the nonlinear
ELM evolution and contributes to the coupling of the unsta-
ble ballooning-type instability on the outboard side to the
torus to the initially stable inboard side. Similar effects
FIG. 2. Density contours in vertical cross-section over the ELM crash and saturation of outboard instability for a DIII-D plasma with no background toroidal
rotation. Times in units of shear Alfv�en times (1 sA� 0.5 ls) [Reprinted with permission from Sugiyama et al., Phys. Scr. 86, 058205 (2012). Copyright 2014
IOP Publishing].
021805-5 Huijsmans et al. Phys. Plasmas 22, 021805 (2015)
This article is copyrighted as indicated in the article. Reuse of AIP content is subject to the terms at: http://scitation.aip.org/termsconditions. Downloaded to IP:
131.155.151.137 On: Wed, 06 May 2015 08:13:15

occur around an X-point outside, but near the plasma
boundary.
A homoclinic tangle is limited to the separatrix surface
and the interior region. Open field lines outside the separa-
trix may shift slightly in response but do not split. The
nonlinear simulations show that the field lines can extend
well beyond the original plasma edge, especially very close
to the X-point legs, as expected for a tangle. Where the
extended tangles intersect the divertor, secondary strike
points are formed leading to multiple stripes in the power
deposition profile during the ELM. Figure 4 shows a
Poincare plot of the magnetic field structure during an ELM
simulation in an ITER Q¼ 10 scenario.60
With the formation of filaments and magnetic tangles,
one can identity different loss mechanisms for the thermal
energy during the ELM. The ejection of filaments, due to the
convective motion of a ballooning mode corresponds to con-
vective energy losses of density and energy. The losses from
the filaments, losses once outside plasma, are both in parallel
direction along the filament and due to the radial movement
of the filament into the first wall. The magnetic tangles and
the stochasticity cause a direct connection of field lines from
inside the plasma to the divertor (or the first wall). This leads
to large parallel conductive losses causing mostly a reduction
in the pedestal temperature in the simulations. The relative
importance of these two loss channels may account for the
experimental classification of ELMs into so-called convec-
tive and conductive ELMs.62 Convective ELMs, character-
ised by significant density losses and small temperature
changes, are small amplitude ELMs at high density where
the parallel conduction is low. Conductive ELMs, with large
energy losses and density losses comparable to the convec-
tive ELMs, occur at low density. The minimum ELM density
loss (for both convective and conductive ELMs) would then
be determined by the ejected filaments. If the conducted
losses are indeed related to the magnetic tangles, one would
expect a correlation with the amplitude (and duration) of the
magnetic perturbation of the ELM. This remains to be veri-
fied experimentally.
C. MHD models
The BOUTþþ code has been applied to investigate the
influence on the linear stability of the pedestal and the ELM
crash of different MHD models from 3-field model, which
evolves vorticity, pressure and vector potential31,38,46,61 to
FIG. 3. More and less localised filament formation during ELM simulations
of DIII-D (density perturbation, left), NSTX (density perturbation, middle)
[Reprinted with permission from Sugiyama et al., Phys. Scr. 86, 058205
(2012). Copyright 2014 IOP Publishing] and AUG (perturbed poloidal flux,
right) [Hoelzl et al., Phys. Plasmas 19, 082505 (2012). Copyright 2014 AIP]
plasmas.
FIG. 4. A Poincare plot of the magnetic field, showing the magnetic tangles
at the time of the maximum magnetic perturbation during a simulated ELM
in ITER [Reprinted with permission from Huijsmans et al., Nucl. Fusion 53,
123023 (2013). Copyright 2014 IAEA].
021805-6 Huijsmans et al. Phys. Plasmas 22, 021805 (2015)
This article is copyrighted as indicated in the article. Reuse of AIP content is subject to the terms at: http://scitation.aip.org/termsconditions. Downloaded to IP:
131.155.151.137 On: Wed, 06 May 2015 08:13:15

6-field53,63–65 and gyro-Landau-fluid models65 on the linear
stability of the pedestal and the ELM crash. Through these
comparisons, it is found that although the equations of the 6-
field model are very different from the original 3-field
model, both linear and nonlinear dynamics of peeling-
ballooning instability are still similar for both modelling
approaches. This result indicates that the peeling-ballooning
instability, ion diamagnetic effects, resistivity and hyper-
resistivity, which can be well described by the 3-field model,
are the dominant physics effects during the burst of ELMs.
Therefore, the 3-field model is sufficient to simulate peeling-
ballooning instabilities and the early nonlinear phase of
ELM crashes if the simulations start from a strongly unstable
equilibrium. However, inclusion of the additional physics
from 6-field and gyro-Landau-fluid models is important if
the simulations start from an equilibrium close the margin-
ally stable state.64,66 Furthermore, ELM dynamics is a multi-
scale problem, ranging from meso-scale MHD events to
micro-scale turbulent dissipation due to electron gyro-radius
effects. In order to simulate an ELM cycle and perform ex-
perimental validations, sophisticated multi-field models are
necessary to obtain (1) ELM power loss via separate ion and
electron channels; (2) ELM power deposition on plasma fac-
ing components (PFCs); and (3) self-consistent turbulence
and transport between ELMs for the pedestal profiles to
rebuild.
D. Power deposition
The main concern with respect to ELMs in ITER is the
predicted large ELM heat fluxes to the divertor. The peak
heat flux is determined by the total ELM energy loss, the
time scale of the losses and the ELM “wetted” area, i.e., the
area of the divertor target over which the ELM energy is dis-
tributed. Experimentally, the ELM wetted area is seen to
increase approximately linearly with the amount of energy
lost at each ELM.68 ELM simulations in JET-like geometry
with the JOREK code60 show that the origin of this broaden-
ing of the wetted area is the correlation between the ELM
size and the amplitude of the magnetic perturbation (of the
ballooning mode). The larger magnetic perturbation leads to
more pronounced magnetic tangles and more secondary
strike points at the divertor, distributing the energy over a
larger area. Also the filaments ejected from the plasma con-
tribute to the widening of the wetted area. Simulations in
MAST51 and ITER60 show, in the case of convective ELMs
with a small magnetic perturbation, a significant broadening
caused by the energy in the filaments convected along the
unperturbed magnetic field. Both mechanisms lead to a spiral
pattern of the heat flux on the divertor.39,49 The MHD simu-
lations typically find that the ELM driven heat flux goes pre-
dominantly to the outer divertor, due to the ballooning
character of the MHD instability. This also leads to a time
delay for the power to arrive at the inner divertor, due to the
longer connection length to the outboard. Experimentally,
the ELM losses are larger on the inner divertor, opposite to
the simulation results. This is one of the open problems
remaining to be addressed. ELM particle fluxes to the diver-
tor from BOUTþþ simulations show features consistent
with measurements on upper and lower divertor plates when
the magnetic field is reversed on EAST.67
E. Validation
Even though the ELM simulations are still in a relatively
early stage of development, the validation of the simulation
results against experimental observations can already be
very useful. Validation is essential to have any confidence in
predictions made for ELMs in ITER. Validation can take the
form of comparing global trends such as the observed scaling
of the amplitude of the ELM energy losses with collisional-
ity, the scaling of the ELM duration with the parallel ion
sound speed, the change in the relative density and energy
losses as a function of the pedestal density, the scaling of the
width of the ELM power footprint with the ELM amplitude,
etc. In Ref. 39, the relative ELM energy losses in ELM simu-
lations for JET were found to increase with decreasing colli-
sionality whereas no dependence was found for the relative
density losses. This trend is similar to the one observed in
experiments,62,69 although not as strong. This points to the
importance of the parallel heat conduction for the energy
losses with a strong temperature dependence and the role of
filaments as the source of density losses, independent of col-
lisionality. However, it should be noted that the ELM ampli-
tudes are determined from an unstable starting equilibrium
not yet from a full ELM cycle. This may have an influence
on the results.
A more direct validation can be obtained through the
comparison of fast diagnostic measurements of the ELM pre-
cursors, ELM crash, ELM affected area and the power and
particles fluxes to the divertor. Fast visible light cameras
give detailed information on the structure and evolution of
the filaments ejected by the ELM. Figure 5 show an example
of a direct comparison of a camera image of an ELM in
MAST with the predicted image of the Da light based on the
temperature and density in the filaments from the simulation
of an ELM with the JOREK code.51 The radial width of the
filaments as they detach from the plasma can be determined
by fast Thomson scattering measurements of the density pro-
file. Comparison with simulations shows good qualitative
agreement, including the fact that the filament structure is
much less visible in the electron temperature profiles.
Precise toroidal mode numbers and their evolution during an
ELM cannot yet be quantitatively compared. The same simu-
lations also show good agreement for the footprint of the
ELM energy and particle fluxes as observed with the visible
and IR cameras in MAST.51 Comparison of observations of
filaments in EAST with BOUTþþ simulations is described
in Ref. 70. The recent development of ECE imaging diagnos-
tics71–73 gives very detailed 2D data of the ELM fluctuations.
This will be very valuable for detailed validation of the ELM
dynamics in the future. First comparisons of ECE imaging
data with the linear mode structures predicted by BOUTþþshow good agreement.73,74 Direct comparison with fast mag-
netics data may be more challenging as the magnetic
response may depend on the interaction with a conducting
wall. Magnetics data can give information on the toroidal
localisation of the ELM perturbation.75 Similar strong
021805-7 Huijsmans et al. Phys. Plasmas 22, 021805 (2015)
This article is copyrighted as indicated in the article. Reuse of AIP content is subject to the terms at: http://scitation.aip.org/termsconditions. Downloaded to IP:
131.155.151.137 On: Wed, 06 May 2015 08:13:15

localisation is also found in ELM simulations in AUG50,56
using the JOREK code (see Fig. 3(c)).
F. Discussion
One of the important questions for extrapolation to
ITER is what determines the amplitude of the ELM energy
losses. Assuming that one cannot significantly cross an ideal
MHD stability boundary, the ELM losses are determined by
the state to which the pedestal relaxes during the ELM.
Thus, the question is: what determines this state immediately
after an ELM. Despite the importance of this issue, there has
been little emphasis on this topic in recent studies both
experimentally and from simulations. A return to a margin-
ally stable state after the ELM crash would lead to too small
ELMs. The ELM energy loss may be enhanced when the
ELM itself changes the marginal stability boundary as it
occurs. It has been proposed in Ref. 34 that the reduction in
plasma rotation due to an ELM may lower the marginal sta-
bility limit from the rotation stabilised higher limit to the
zero rotation lower limit. This could be especially relevant in
spherical tokamaks with a large rotation. The locking of the
rotation or the reduction in rotation shear may also decrease
the efficiency of the stabilisation of the turbulence in the H-
mode pedestal, leading to an increased turbulent transport.
The formation of magnetic tangles due to the magnetic per-
turbation of the ballooning mode leads to a direct connection
from inside the original separatrix to the divertor. The result-
ing ELM energy losses depend on the parallel conduction
and the lifetime of the tangles. The formation of an
avalanche-like process may also contribute to increased
energy losses. In this case, the flattening of the pressure in
the pedestal leads to large gradients further inwards, destabil-
ising additional MHD instabilities increasing the flattened
region by the ELMs and moving the place where large gra-
dients occur further inwards. This behaviour is sometimes
observed in simulations, leading to very large ELM affected
areas. However, this is mostly observed in case of high resis-
tivity simulations, raising the question whether this is rele-
vant also for realistic values of the resistivity.
For more realistic simulation of ELMs, it is likely to be
necessary to include more divertor physics in the non-linear
MHD codes. This includes, for example, the divertor bound-
ary conditions. In steady state, the standard Bohm boundary
conditions link the convective and conductive fluxes at the
target through a constant sheath transmission factors, cSH.
PIC simulations76 in 1D show that during a transient ELM
phase, cSH can vary significantly in time. However, recent
comparisons of 1D fluid simulations with PIC and Vlasov
solutions indicate that the error in the parallel electron and
ion heat fluxes at the divertor target due to the assumption of
a constant cSH in the fluid approach is relatively small.77 In
addition to the divertor boundary conditions, the divertor re-
gime may also have a strong influence on the ELM driven
heat loads. In the long term, predictions for ELMs in ITER
will need to include a description of the high recycling, par-
tially detached divertor that is expected between ELMs in
ITER.
As mentioned above, typical non-linear MHD ELM sim-
ulations start from an MHD unstable initial state and only
consider a single ELM. This approach does not allow predic-
tions for the amplitude of the ELM energy and particle
losses, as these tend to depend on how unstable the initial
state was chosen to be. Simulations of multiple full ELM
cycles will be necessary such that the ELMs do not depend
on the choice of the initial state. From simulations of multi-
ple ELMs is in simplified geometry,40,43 it appears that the
diamagnetic terms in the MHD model are essential obtain a
cycling regime with repeated ELM crashes. A similar con-
clusion was reached from non-linear MHD simulations of
sawteeth where obtaining repeated fast crashes requires a
minimum threshold in the diamagnetic stabilisation.78
An alternative concept to explain the crash during the
ELM cycle, based on the phase coherence time, was pro-
posed in Ref. 79. The interaction of many unstable peeling-
ballooning modes destroys the phase coherence of the lin-
ear instability, not giving enough time for the modes to
grow to large amplitude and leading to a background,
peeling-ballooning, turbulence. The formation of discrete
ELM-like crashes requires a long enough “phase coherence
time,” i.e., coherence between the pressure and potential
(ExB flow) so that a mode can grow from the turbulence to
large event. This concept leads to a non-linear criterion for
the ELM onset.
FIG. 5. Comparison of visible camera image of an ELM in MAST (right)
with the predicted image from non-linear MHD ELM simulation [Reprinted
with permission from Pamela et al., Plasma Phys. Controlled Fusion 55,
095001(2013). Copyright 2014 IOP Publishing].
021805-8 Huijsmans et al. Phys. Plasmas 22, 021805 (2015)
This article is copyrighted as indicated in the article. Reuse of AIP content is subject to the terms at: http://scitation.aip.org/termsconditions. Downloaded to IP:
131.155.151.137 On: Wed, 06 May 2015 08:13:15
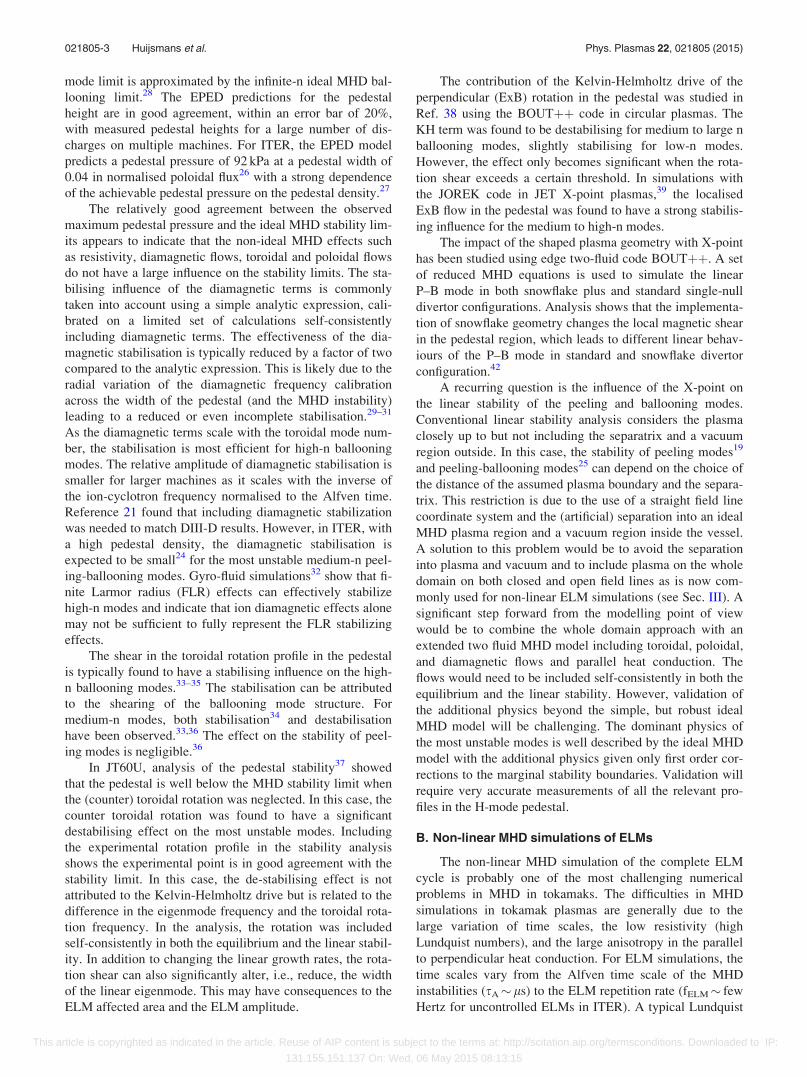
III. ELM CONTROL METHODS: RESONANT MAGNETICPERTURBATIONS
The complete stabilisation of type-I ELMs with the
application of external magnetic field perturbations was first
observed in DIII-D at high collisionality6 and at, ITER rele-
vant, low collisionality.81 Type-I ELM stabilisation at high
and medium collisionality was also observed in AUG8 and
KSTAR,9 respectively. Experiments in MAST82 and JET10
find mitigation of ELMs but no ELM stabilisation.
ITER will include a set of in-vessel ELM coils for the
control of ELMs. The set of 27 coils is arranged in 9 coils
sets in the toroidal direction with each coil set consisting of
3 coils, with 6 turns each. The coils are located above, below
and in the mid-plane on the low field side vessel wall.3,13 At
present, the requirements of the ITER coil currents are based
on the criterion for the stabilisation as established in the
DIII-D experiments.80 This criterion sets the minimum am-
plitude of the applied magnetic perturbation in terms of a
minimum width of the stochastic layer at the plasma bound-
ary (Chirikov island overlap parameter > 1, in a region
Dw> 0.165). Applied to ITER, depending on the details of
the plasma scenarios, this leads to a requirement on the coil
current between IRMP¼ 20–75 kA-turns,83 This leaves some
margin, for example, for some RMP coil failures, with
respect to the maximum coil current of 90 kA-turns.
The DIII-D ELM stabilisation criterion is not universal.
In other machines, ELM mitigation, but not stabilisation, is
observed while satisfying the criterion. One uncertainty in
the predicted RMP current requirements comes from the
response of the plasma to the applied external magnetic field
perturbation. It is well known that a rotating plasma tends to
shield the perturbations whereas in a static plasma the pertur-
bations can penetrate.84 The shielding acts through the for-
mation of radially localised current sheaths, located at (or
close to) the rational q surfaces. These currents reduce the
amplitude of the q¼m/n harmonic of the radial magnetic
field Br at the rational surface. The amount of screening is
influenced by the plasma rotation but also by the resistivity,
with increased shielding at low resistivity. The time scale for
the build-up of the screening currents is inversely propor-
tional to the resistivity.8 In cylindrical geometry, the ampli-
tude of the screened harmonic remains low inside the
rational surface. In shaped plasmas in toroidal geometry, due
to the coupling of poloidal harmonics, the mode amplitude
as a function of radius typically has a minimum value at the
rational surface.92,93
For RMP ELM control, the dominant flow is due to the
large ExB and diamagnetic flows in the H-mode pedestal. In
particular, the screening and penetration of the external field
are determined by the rotation of the electrons, as was pre-
dicted analytically in Ref. 86 and confirmed in kinetic87 and
two-fluid MHD88,90 models. The initial cylindrical analysis
was extended to more relevant toroidal plasmas with x-point
geometry in Refs. 91 and 92. The penetration is most effec-
tive for the m/n harmonic of the external perturbation, whose
rational surface is closest to the point (when it exists) where
the electron fluid velocity has a zero. As a consequence, the
m/n perturbation at the rational surface has a resonant
window as a function of q95 in which the perturbation pene-
trates inwards.85 The width of this resonant window was
found to depend on the amplitude of the externally applied
perturbation.
The toroidal rotation is found to be the dominant flow
determining the penetration of the applied perturbation
towards the plasma centre, as the neoclassical and diamag-
netic flows are expected to be low due to the small density
and temperature radial gradients in the core plasma. This is
relevant for the question whether the RMP fields will act as a
source for neoclassical tearing modes (NTMs). ITER expects
to operate the RMP coils in an n¼ 3 or n¼ 4 configuration
to minimize the amplitude of the RMP fields that could trig-
ger NTMs.
The response of the plasma to RMP fields can also lead
to an amplification of the applied perturbations. This typi-
cally occurs when the plasma is close to an MHD stability
limit.93 In the case of ELM control, the relevant MHD stabil-
ity limits are the kink and ballooning limits in the H-mode
pedestal. Given the low-n mode numbers of the RMPs, the
kink or peeling mode stability limit will be the most relevant
for amplification. We note that the conditions for a given
perturbation spectrum to couple to the kink mode (kink-reso-
nance) differs from those that optimize coupling to edge tear-
ing modes94 (pitch resonance). The distinction between the
nonlocal kink response and the tearing response, which is
local to a rational surface, explains how the plasma response
can at the same time amplify and shield the perturbation.
In addition to the shielding and amplification of the
RMP fields by the plasma, the RMP fields cause a braking of
the plasma rotation due to the torques from the perturbed
currents, i.e., from 3D JxB forces, and from the Neoclassical
Toroidal Viscosity85,95 (NTV). For a consistent modelling,
the shielding, amplification, and braking all need to be taken
into account to determine the self-consistent stationary state
in which there is a balance between the shielding of the
RMP due to the rotation and the reduction in plasma rotation
due to the resonant and non-resonant braking due to the
RMPs. In Ref. 96, the linear MHD RMP response calcula-
tions, using the MARS-F code, are combined with a toroidal
torque balance equation including the JxB and NTV torques
to model the RMP penetration and plasma braking in MAST
plasmas. The results show that, in MAST, the braking of
rotation is strongest for n¼ 3 where the toroidal rotation is
reduced to zero over a large fraction of the minor radius.
With increasing toroidal mode number, the braking is less
strong. The time scale for the plasma braking to reach a sta-
tionary state is on the transport-like time scale of 50–100 ms.
In Ref. 92, the poloidal and parallel flows, including diamag-
netic and neoclassical flows in the pedestal, are evolved self-
consistently within a non-linear two-fluid reduced MHD
model (without NTV braking) using the JOREK code.
However, it is challenging to obtain truly stationary solutions
on the transport time-scale with non-linear MHD codes and
it is likely that a self-consistent stationary state solution will
be needed as a basis for a first-principle based criterion for
the ELM stabilisation.
The cause for the stabilisation of ELMs by RMP
fields is generally thought to be due to a reduction of the
021805-9 Huijsmans et al. Phys. Plasmas 22, 021805 (2015)
This article is copyrighted as indicated in the article. Reuse of AIP content is subject to the terms at: http://scitation.aip.org/termsconditions. Downloaded to IP:
131.155.151.137 On: Wed, 06 May 2015 08:13:15

pedestal pressure (gradient) to below to the MHD stability
limit, due to additional transport induced by the RMP
fields. Section III A describes a comparison of the observed
plasma perturbations due to the RMP coils with the MHD
simulations of the experiment towards a validation of
the MHD model in describing the plasma response. In
Secs. III B–III C, the transport induced by the RMP fields is
discussed in detail, both in a fluid description and a fully ki-
netic model.
A. Validation of the plasma response
In experiments, the location of the pedestal temperature
and density profiles (in real space) is found to depend on the
toroidal phase of the applied non-axisymmetric fields. The
peak-to-peak displacement of these profiles as the phase is
alternated may often exceed 2 cm in typical DIII-D dis-
charges.89 In some cases, the measured displacement is com-
parable to the displacement of the separatrix manifolds due
to the applied fields in the absence of plasma response.97–99
However, in other cases, particularly with n¼ 1 and n¼ 2
applied fields in DIII-D, displacements can be much greater
than the predictions of vacuum modelling (i.e., without
plasma response). For example, in DIII-D discharge 117 327
in which a n¼ 1 field was applied using 2 kA in the DIII-D I-
coils, the manifold displacement from vacuum modelling
was found to be roughly 0.7 cm, much smaller than the
nearly 4 cm measured displacement. This implies that the
displacement may be significantly enhanced by the response
of the plasma in some cases. In order to investigate the role
of plasma response in the measured displacements, calcula-
tions of the linear response to applied non-axisymmetric
fields have been carried out for several DIII-D discharges
using the M3D-C1 code.100,101 M3D-C1 is well-suited for
calculating the plasma response in the pedestal, both because
it includes the plasma, diverted separatrix, and open-field-
line region self-consistently in its computational domain,
and because it includes the diamagnetic contributions to the
plasma velocity that dominate the E�B flows in the steep
gradient region. These diamagnetic flows have been shown
to strongly affect the tearing response of the plasma driven
by external perturbations and tend to reduce the size of
islands in the H-mode pedestal considerably.86–88,91 In par-
ticular, it is found that islands tend to be well-screened by
the plasma except where the component of the electron rota-
tion perpendicular to the magnetic field is small. These cal-
culations generally find good quantitative agreement with
the experimentally measured temperature and density dis-
placements for several DIII-D discharges.102 For example, in
DIII-D discharge 148 712, Thomson scattering measure-
ments reveal a displacement of the temperature perturbation
resulting from 4 kA of current in the DIII-D I-coils in an
even-parity n¼ 3 configuration reveal a shift of the electron
temperature profile along the Thomson chord (R¼ 1.94 m)
of roughly 1 cm when the sign of the I-coil current is flipped.
The temperature perturbations from these applied field calcu-
lated by M3D-C1 are in relatively good agreement with
both the phase and magnitude of these measurements, as
illustrated in Figure 6. Single-fluid resistive modeling
was also found to yield better agreement with experimental
measurements than vacuum modeling in this case; however,
the inclusion of two-fluid effects and equilibrium rotation
FIG. 6. Left: Electron temperature measured by Thomson scattering (sym-
bols) and calculated by M3D-C1 (dashed lines) with even-parity n¼ 3 fields
applied by þ4 kA (red) and �4 kA (blue) in the DIII-D I-coils. Middle: the
difference between SXR signal measured with even-parity n¼ 3 fields
applied by þ4 kA (red) and �4 kA (blue) in the DIII-D I-coils. Right: The
simulated differential SXR signal from the M3D-C1 calculation [Reprinted
with permission from Ferraro et al., Nucl. Fusion 53, 073042 (2013).
Copyright 2014 IAEA].
021805-10 Huijsmans et al. Phys. Plasmas 22, 021805 (2015)
This article is copyrighted as indicated in the article. Reuse of AIP content is subject to the terms at: http://scitation.aip.org/termsconditions. Downloaded to IP:
131.155.151.137 On: Wed, 06 May 2015 08:13:15

were both found to improve the quantitative agreement.
The expected helical displacements due to fields from ELM
control coils in ITER have also been calculated for several
15 MA Q¼ 10 scenarios. The magnitude of the displacement
was found to increase with the pedestal height and, in con-
trast with DIII-D results, with toroidal mode number. These
trends are thought to be a reflection of the fact that the sce-
narios under consideration were close to ideal peeling-
ballooning stability thresholds, which tend to be less stable
at larger n and larger pedestal height. For these cases, the
calculated displacements at the midplane were found to
range from less than 1 cm (for n¼ 1 fields applied to a
3.8 keV pedestal scenario) to more than 6 cm (for n¼ 4 fields
applied to a 6.0 keV pedestal scenario) at the maximum
designed ELM coil currents (90 kA). Because these displace-
ments are comparable to the equilibrium gradient scale
lengths in the pedestal, the validity of the linear approxima-
tion used in these calculations is questionable. Indeed, a pos-teriori analysis of the linear results has found that the linear
approximation breaks down in the pedestal for the ITER cal-
culations with displacements larger than roughly 3 cm and
often breaks down in the edge and near mode-rational surfa-
ces for typical DIII-D parameters.102 In addition, qualitative
differences between linear and nonlinear ideal-MHD per-
turbed equilibria calculated for a typical DIII-D discharge by
IPEC103 and VMEC,104 respectively, indicate that nonlinear
effects may be important. Fully nonlinear two-fluid calcula-
tions at realistic values of dissipation are extremely numeri-
cally challenging, but such calculations using M3D-C1 and
JOREK92 have had some recent success. These calculations
will provide a clearer picture of the role of nonlinear effects
in the plasma response. A consistent finding of the linear,
two-fluid calculations are that the plasma response tends to
strongly reduce the pitch-resonant components of the per-
turbed normal field in the H-mode edge and thus reduces the
size of the islands,105 due to the large diamagnetic perpen-
dicular electron rotation in that region. However, for dis-
charges in which the ion rotation is in the co-current
direction, the perpendicular electron rotation changes sign
near the top of the pedestal (typically near w � 0:9), and in
this region, the islands are not screened and may be
enhanced. This suggests a potential mechanism for ELM
suppression by resonant magnetic perturbations (RMP):
magnetic stochastization near the top of the pedestal may
create a “wall” of transport that does not allow the pedestal
to widen to the point of ELM instability.106 Indeed, a recent
analysis of a set of DIII-D discharges with applied non-
axisymmetric magnetic perturbations has found that the
modelled level of stochasticity localized at the pedestal top
correlates with ELM suppression better than measures of sto-
chasticity throughout the entire edge that have been consid-
ered previously.80
A recent study on the validation plasma displacements
due to applied RMP fields can be found in Ref. 128.
Ultimately, a predictive model of ELM suppression will
likely require a combined understanding of the helical defor-
mations of the plasma in response to the applied fields and of
the transport processes arising from these deformations.
B. RMP induced transport: Fluid modelling
In the following, we discuss the effect of RMPs on
transport in the case where most of the islands it induces are
suppressed, so that island overlap plays a negligible
role.85,87,90 This does not rule out the existence of a fully
reconnected, isolated island, such as that which is predicted
to occur at the flux surface near the top of the pedestal where
the electron rotation reverses.86,87,90 In the absence of chaos,
the plasma can be divided into three regions: resonant layers
containing suppressed islands, non-resonant regions separat-
ing the layers, and (possibly) an isolated fully reconnected
island. The changes in the profiles caused by the application
of a resonant magnetic perturbation can then be attributed to
three causes: resonant fluxes caused by the singular response
of the plasma near field-line resonances, non-resonant neo-
classical fluxes caused by the distortions of the equilibrium,
and changes in the spectrum and amplitude of turbulent fluc-
tuations. We consider these three causes in turn.
In singular layers where the RMP is screened by the
plasma currents, so that the induced island is narrow, the
response of the plasma to the applied field gives rise to non-
diffusive transport effects.88,107 The best known of these
transport effects is the resonant braking that is responsible
for the appearance of locked modes. Resonant braking is
caused by a non-ambipolar radial current that also results in
localized fluxes of particles and heat. In the core, these local-
ized fluxes have a negligible effect. In the edge, by contrast,
the strong density and temperature gradients enable the reso-
nant fluxes to cause significant particle and temperature
transport. These fluxes can be divided into convective fluxes
caused by RMP-induced eddies and "magnetic flutter" fluxes,
so named because they can be interpreted as resulting from
the parallel current along the perturbed magnetic field, i.e.,
Jr¼ (Br/B) Jjj. Calculations using reduced isothermal models
show that the flutter fluxes strongly dominate the convective
fluxes.107 The calculated "braking" forces are consistent with
experimental observations, while the particle pump-out is
comparable to but smaller than in experiments. Note that the
braking changes the electric field so as to reduce the velocity
of the electrons. Since the ions are rotating in the opposite
direction in the edge, their velocity increases during the
application of the RMP, consistent with observations.
Similar result are obtained for the transport caused by RMPs
away from the resonances.108,109 In this case, the RMP-
induced fluxes are much smaller, but they act over a much
larger region. Recent calculations for the non-resonant trans-
port have included the thermal transport and find that it dom-
inates over the particle transport by a factor of 3 or so, in
contradiction with experiments. The relative magnitude of
the resonant and non-resonant contributions to RMP-induced
heat and particle fluxes is an open question that can only be
resolved by considering a model describing both phenomena
consistently.
The effects of the RMPs on turbulent transport are
poorly known both theoretically and experimentally. This
question has recently been examined with the help of gyroki-
netic simulations of a reconnected magnetic island in DIII-
D.111 The simulations confirm that the electron temperature
021805-11 Huijsmans et al. Phys. Plasmas 22, 021805 (2015)
This article is copyrighted as indicated in the article. Reuse of AIP content is subject to the terms at: http://scitation.aip.org/termsconditions. Downloaded to IP:
131.155.151.137 On: Wed, 06 May 2015 08:13:15

does not fully flatten in the island due to the contribution of
trapped particles110 and that the density steepens in the
island for positive radial electric field.112 They also find that
the force acting on the island scales like the product of the
radial electric field, the island width, and the square root of
the turbulent intensity. Lastly, they show that when the mag-
nitude of the electric field exceeds a threshold, the island
unlocks from the RMP, spins up, and heals until only a sup-
pressed island remains.
C. Kinetic simulation of RMP penetration and plasmatransport response
In this section, we discuss the results of a nonlinear ki-
netic study of self-consistent RMP penetration and plasma
transport response, including the radial electric field and
plasma rotation responses. The full distribution function
(full-f) drift-kinetic particle-in-cell code XGC0110 is used.
XGC0 includes kinetic ions, kinetic electrons, Monte Carlo
neutral particles with ionization and charge exchange cross-
sections, plasma loss to the material wall, logical wall
sheath, and heat and momentum fluxes from the core plasma.
A particle-momentum-energy conserving Monte Carlo
Coulomb collision operator is used for this simulation.
Ambipolar anomalous transport is modeled as random walk
of marker particles in the radial direction, in addition to the
Lagrangian equation of motion in tokamak geometry.
Given the experimental observation that the plasma
pressure profile is supported by the magnetic field in the
presence of RMPs, it is assumed that the perturbed 3D mag-
netic field from RMP coils can only be partially stochastic,
that statistically averaged macroscopic plasma quantities
(density, temperature, flow, etc.) are functions of unper-
turbed magnetic flux w, and that the electrostatic potential is
also function of the unperturbed magnetic flux, U(w), due to
strong equilibration along non-stochastic magnetic field
component and the existence of partial-barriers cantori in
weak chaos.113 The last assumption implies that the local
electric field along the perturbed magnetic field is described
by Ejj ¼ –brwdU(w)/dw, in a quasi-steady state, where b is
the unit vector in the total local magnetic field direction. It is
also assumed that the perturbation in the toroidal component
of the magnetic field BT is negligible due to its rigidness in
low plasma b (¼ plasma energy/magnetic field energy). An
additional assumption is that the turbulence-driven transport
is weaker than the RMP-driven transport. Thus, anomalous
transport fluxes are used only to match the plasma profile
prior to RMP application.
In the plasma, the perturbed poloidal flux dw is related
to the toroidal component of the perturbed 3D plasma current
djT according to the Ampere’s law in a tokamak geometry
Ddw ¼ l0 I djT=BT0; (1)
where D* is the two-dimensional Laplacian operator in toroi-
dal geometry (conventionally called the Grad-Shafranov op-
erator) D*w¼R @/@R [(1/R) @w/@R]þ @2w/@Z2, BT0 is the
magnitude of the axisymmetric magnetic field vector B0 in
the toroidal direction, B¼B0þ dB, I¼RBT0, and R and Z
are the cylindrical coordinates (major radius and vertical
distance, respectively). dw consists of the vacuum RMP part
dwv and the plasma response part dwp, dw¼ dwvþ dwp. Far
into the scrape-off plasma (w� 1.06 in this study), it is
assumed that dwp vanishes. Thus, dw¼ dwv for w� 1.06,
forming the boundary condition to Eq. (1). The simulations
are started without RMPs until the plasma and rotation pro-
files qualitatively resemble the experimental profiles under a
trial-and-error combination of heating power, torque and
anomalous transport rate before turning on the RMP field.
In order to study the basic physics of the RMP penetra-
tion and the plasma response processes, a plasma in which
ELM suppression was obtained in DIII-D by the application
of RMP fields—shot number 126 006—has been considered.
Figure 7 shows that the changes of the experimentally meas-
ured pedestal plasma profiles due to RMP driven transport is
rather different compared to predictions by the well-known
free-streaming model of plasma transport in a stochastic
magnetic field by Rechester115 and Rosenbluth (called R-R
theory hereafter). After applying RMPs, experimental meas-
urements show a strong reduction in the pedestal electron
density ne without reduction in the electron temperature Te,
which is opposite to the predicted Te profile collapse with lit-
tle effect on the ne profile from the R-R model. The experi-
mental observation on the electron particle and thermal
transport is more consistent with a recent numerical under-
standing of stochastic plasma transport in fixed stochastic
magnetic field structure.110
Figs. 7(a) shows the electron transport barrier moving
radially outward and narrowing in the close vicinity of the
magnetic separatrix after the RMP application. Figures 7(b)
and 7(c) show that the dip in the toroidal rotation profile
moves out together with the electron transport barrier and
the negative Er well is preserved to some degree in the vicin-
ity of the separatrix. For a confident extrapolation of the
RMP physics to ITER, these peculiar features need to be
understood self-consistently from each other in a kinetic
study that can simulate the RMP penetration, plasma
FIG. 7. Experimentally observed changes in (a) n, Te and Ti pedestal pro-
files, (b) toroidal rotation, and (c) radial electric field before (black) and af-
ter (red) the RMP application on DIII-D discharge 126 006 [Reprinted with
permission from Park et al., Phys. Plasmas 17, 102503 (2010). Copyright
2014 AIP].
021805-12 Huijsmans et al. Phys. Plasmas 22, 021805 (2015)
This article is copyrighted as indicated in the article. Reuse of AIP content is subject to the terms at: http://scitation.aip.org/termsconditions. Downloaded to IP:
131.155.151.137 On: Wed, 06 May 2015 08:13:15

transport response, radial electric field, and the toroidal rota-
tion together.
In the kinetic study with self-consistent RMP penetra-
tion described here, the even parity vacuum RMPs resulting
from 4 kAt current in the DIII-D I-coil system current are
utilized. In order to match approximately the plasma temper-
ature, density, and rotation profiles between the simulation
and experimental results prior to the start of RMPs, 6 MW of
total heat flux from the core plasma is evenly divided into
ions and electrons at the core-edge boundary (wN¼ 0.8), to-
gether with 4 N-m of toroidal torque. These values are some-
what lower than the total heating power and the total neutral
beam torque into the plasma in the experiment. Effective ra-
dial anomalous transport coefficients at the level of
Deff¼ ve¼ vi¼ 0.2 m2/s are found to be adequate to repro-
duce the experimental profiles before the application of
RMPs in this qualitative study.
Figure 8 shows the density, Te and Ti profiles before
(black) and 4 ms after (red) the start of RMPs from the
XGC0 simulation,110 where wN is the normalized poloidal
magnetic flux. It can be seen that most of the features
observed in the experimental electron density and tempera-
ture plasma profiles described earlier are reproduced by the
simulations; namely, the density pump-out and the radially
outward movement of the steep Te region. Also shown in
Figure 8 is the radial electric field profile before (black) and
4 ms after (red) RMPs. It can be seen that the strong ErxB
shearing remains at larger minor radii near the magnetic
separatrix surface as found in experiment; the toroidal rota-
tion in the simulations also behaves qualitatively similarly
to the experiment (Fig. 7(b)).
In-depth investigation of the physical processes occur-
ring in these kinetic simulations has revealed that the vac-
uum stochasticity and islands are suppressed by the plasma
response at the outer part of the original pedestal layer just
inside the separatrix surface. However, at the inner part from
that layer, the stochasticity and islands are recovered to a
similar level as expected from the vacuum evaluation due to
the effect of the plasma response. As a result, the pedestal
top is extended radially outward by the RMPs until the RMP
suppression layer is reached. Figure 8 shows the resonant
components m¼ 8–14 in vacuum (black) and in plasma (red)
at the resonance radii for each component illustrating the
suppression of the outer most resonant components (m¼ 12
and 13) and amplification of the inner resonant components
back to the vacuum level. This kinetic study reveals that
regardless of the initial condition, the perpendicular electron
rotation self-organizes to be small in the amplification region
and large in the suppressed region, consistently with the the-
oretical MHD insight presented above.
Kinetic simulations have also been applied to study the
effect of the plasma safety factor (q95) on the RMP penetra-
tion. Experiments in DIII-D6,81 show that there is a “q95-win-
dow,” inside which the RMPs act to suppress ELMs and
outside which the RMPs do not act to suppress ELMs even
though the RMPs in the vacuum approximation is similar
inside or outside of the q95-window. Understanding the de-
pendence of RMP penetration on q95 is important for ITER
operation since the existence of the q95-window indicates
that the ELM suppression by RMPs could be sensitive to the
q95 value. In the XGC0 simulations for DIII-D plasmas, the
global safety factor q profile has been varied by increasing
the toroidal magnetic field strength. Figure 9 shows the ra-
dial distribution of the Chirikov parameter at three different
q95 values: q95¼ 3.47, 3.58, and 3.69. The value 3.58 is
inside the experimentally determined q95 window in DIII-D
and the other two values are outside. The Chirikov profile
evaluated in the vacuum approximation is similar for all
FIG. 8. Plasma profile changes (density, electron and ion temperature, radial electric field, and resonant perturbed magnetic flux) before (black) after (red)
4 ms of RMP penetration from XGC0 simulation.
021805-13 Huijsmans et al. Phys. Plasmas 22, 021805 (2015)
This article is copyrighted as indicated in the article. Reuse of AIP content is subject to the terms at: http://scitation.aip.org/termsconditions. Downloaded to IP:
131.155.151.137 On: Wed, 06 May 2015 08:13:15

three values of q95. However, the Chirikov profiles including
plasma response are very different for the values of q95 out-
side the ELM suppression window and the one inside the
ELM suppression window. When q95 is inside the ELM sup-
pression window (red diamonds), there is a stronger connec-
tion between pedestal top and the scrape-off layer/divertor
plate along stochastic field lines as can be identified by a
higher Chirikov parameter in the region between the pedestal
top and the scrape-off layer. The kinetic edge plasma current
responds sensitively to the RMP alignment with the equilib-
rium magnetic field pitch in the edge pedestal region.
Stronger stochastic magnetic perturbation is generated by the
kinetic plasma when the equilibrium edge magnetic field is
aligned well (q95¼ 3.58) with the external RMPs. On the
other hand, when the equilibrium edge magnetic field is less
well aligned with the external RMPs, the kinetic pedestal
plasma responds more like MHD plasma, and the edge sto-
chasticity becomes small. Moreover, the full-f plasma
response from XGC0 shows that the electron perpendicular
fluid velocity becomes vanishingly small in the highly sto-
chastic pedestal top region when q95 is in the ELM suppres-
sion window (q95¼ 3.58). The high electron perpendicular
flow region, driven by the strong ExB from orbit loss and the
diamagnetic flows, is squeezed toward the magnetic separa-
trix. On the other hand, when q95 is outside of the ELM sup-
pression window, the electron perpendicular flow speed
remains significant at the pedestal top region. More details
will be reported in a subsequent paper.
Kinetic modelling has also been applied to study the
effects of electron collisionality, density, and toroidal plasma
rotation on penetration of RMP fields, pedestal transport
response and implications for ELM suppression. ELM sup-
pression on DIII-D has been reliably obtained at ITER rele-
vant low electron collisionality (�e*� 0.1). However, such a
low collisionality has been achieved in DIII-D for densities
which are much lower than those required to achieve Q¼ 10
in ITER. When the pedestal electron density is raised in
DIII-D to an ITER-relevant level ELM suppression cannot
be achieved. Since the increase in pedestal density at DIII-D
is accompanied by a decrease in pedestal Te and, thus, by an
order of magnitude rise in the pedestal collisionality, it is
cannot be determined if the loss of the ELM suppression in
DIII-D is caused by the higher collisionality or by the higher
density. This has been studied with the kinetic code XGC0
by multiplying the collision operator by a constant accelera-
tion factor, while keeping the initial density and temperature
profile the same, which corresponds to an increase in colli-
sionality. Figure 10 shows the dependence of the Chirikov
parameter profile on the electron collisionality. A sharp
decrease in the stochastic connection between pedestal top
and divertor plate, corresponding to a Chirikov parameter
under unity in this region, is found when the collisionality
increases by factor of 10 from its initial value in the DIII-D
experiments. This is a similar behaviour for the reduction of
the stochasticity as for the cases in which q95 is outside the
ELM suppression window. Using the stochasticity behaviour
as an indication for ELM suppression, as indicated from our
limited study, the kinetic studies indicate than an increase in
collisionality of the DIII-D plasmas by a factor of 10 would
take these plasmas to conditions in which no ELM suppres-
sion is expected. Since the stochasticity and islands are sup-
pressed throughout the entire pedestal region the pedestal
plasma profiles is not modified by the application of RMPs
for the high collisionality simulations, as observed in DIII-D
experiments.8 On the other hand simulations for DIII-D in
which the plasma density is increased by a factor of 2 closer
to the values required for Q¼ 10 in ITER while keeping the
electron collisionality at ITER relevant level only show
minor changes to the profiles of the Chirikov parameter. It
thus appears that the ELM suppression results from DIII-D
at low collisionalities and low densities are relevant to ITER
even though the experimental results cannot be confirmed at
an ITER relevant pedestal density level.
Kinetic modelling has also been applied to study the
sensitivity of the penetration of applied RMP fields on
plasma rotation. It is found that, for the DIII-D conditions
considered, a 50% reduction in the toroidal rotation speed
shows a relatively insignificant effect on the Chirikov param-
eter profile in the pedestal area, while it shows a more signif-
icant effect toward the core plasma increasing the Chirikov
FIG. 9. Radial distribution of Chirikov parameter for three different q95 val-
ues: q95¼ 3.58 inside the suppression window, and 3.47 and 3.69 outside it.
FIG. 10. Dependence of the Chirikov parameter profile on the electron col-
lisionality. A sharp decrease in the stochastic connection between pedestal
top and divertor plate can be seen as the collisionality increases by factor
of 10.
021805-14 Huijsmans et al. Phys. Plasmas 22, 021805 (2015)
This article is copyrighted as indicated in the article. Reuse of AIP content is subject to the terms at: http://scitation.aip.org/termsconditions. Downloaded to IP:
131.155.151.137 On: Wed, 06 May 2015 08:13:15

parameter there. The strong reduction in Chirikov parameter
in the core plasma from 50% higher toroidal rotation in
the core is consistent with insight from the linear MHD
theory. However, in the edge transport barrier, where a
strongly sheared ExB rotation exists, toroidal rotation has
only a small effect on the level of stochasticity and magnetic
islands formed in this region. At the edge of a tokamak
(including ITER), the rotation spontaneously generated in
the edge transport barrier should be dominant over the exter-
nally driven rotation. Thus, the results of the present kinetic
studies cautiously suggest that the low externally driven to-
roidal rotation speed predicted in the core of ITER is not
expected to affect the edge RMP penetration to a significant
level.
More detailed studies on extended experimental data-
sets, including results from other tokamak devices, and on
the expected ITER plasmas are needed for a more complete
understanding of the RMP effect on ELM suppression in
ITER plasmas.
IV. ELM CONTROL METHODS: PELLET PACING
A well-established method for the control of the ELM
frequency, and thereby the ELM energy loss, is the injection
of pellets into the H-mode pedestal region (ELM pellet pac-
ing). First observed in AUG,4 pellet pacing is now a reliable
method for ELM frequency control in JET,114,116 AUG,117
and DIII-D.118,119 Recently, ELM pacing experiments in
DIII-D have demonstrated an increase of the natural ELM
frequency by a factor of 12 and a corresponding reduction in
energy loss per ELM. A question remains on the efficiency
of pellet pacing in reducing the peak heat flux of the ELMs
at the divertor. In JET116 pellet pacing experiments it is
observed that, although the total energy loss per ELM
decreases with increasing ELM frequency, the peak power
flux onto the target does not decrease significantly. This is in
contrast to the results from DIII-D experiments118 where it is
found that the peak heat flux during pellet triggered ELMs
scales with the inverse of the pellet pacing frequency.
ITER will have 5 pellet injectors for the combined use
of fuelling and ELM control. The pellets can be injected
from the low-field side, above the x-point and from two loca-
tions on the high field side. The requirements on the pellet
size and speed for ELM pacing have been derived from the
observation114,120 that the pellet needs to reach the top of the
H-mode pedestal to reliably trigger an ELM.121,122 For a
more detailed derivation of the required pellet parameters, a
physics model for the onset of the pellet triggered ELM is
needed. This physics model will need to be validated against
current experiments.
The non-linear MHD code JOREK49 has been extended
to include a model for the density source coming from the
ablation of an injected Deuterium pellet.123 The pellet is
assumed to travel along a straight line with a given fixed ve-
locity. The amplitude of the space and time varying density
source is such that the integrated source rate is consistent
with the NGS pellet ablation model.124 Due to limitations on
the grid resolution, the pellet density source rate is assumed
to be spread over a significantly wider region in space.
The results of the non-linear MHD simulations of pellet
injection into an, initially MHD stable, H-mode pedestal
lead to the following model for the pellet trigger of an ELM.
The ablation of the pellet as it travels into the plasma causes
a large local, moving density source. Since the deuterium
pellet injection is mostly adiabatic, the temperature at the
location of the density source will drop such that the local
pressure stays constant initially. At this initially constant
pressure, there is no parallel pressure gradient driving a par-
allel flow of the density perturbation. Due to the large elec-
tron heat conductivity, the region over which the density
perturbation extends will be quickly heated up. This will
result in a local pressure maximum which will cause the den-
sity perturbation to spread in the parallel direction with the
local sound speed. Due to faster parallel heating time com-
pared to the ion-sound transit time, the local pressure pertur-
bation can be significant (see below). The resulting 3D high
pressure structure can in principle destabilize ballooning
modes, even if the 2D axi-symmetric pressure profile
remains below the ballooning stability limit. The destabilisa-
tion of a ballooning mode by this 3D pressure perturbation
has been proposed as the trigger for the ELM by a pellet.
The amplitude of the 3D pressure perturbation depends
on parallel heat transport into the high density cloud. In an
unperturbed axisymmetric plasma, the volume connected by
field lines to the pellet cloud is determined by the flux sur-
face and the radial width of the pellet. However, the MHD
simulations49,123 show that the 3D pellet perturbation causes
a significant magnetic perturbation leading to an ergodic
layer around the pellet cloud. This increases the magnetically
connected volume and the amount of energy available to
heat the pellet cloud.
Simulations of pellet injection in DIII-D plasmas have
shown that the amplitude of the pressure perturbation created
by the pellet must exceed a critical value in order to trigger a
ballooning-type instability (leading to an ELM). This critical
pressure perturbation implies that a minimum pellet size is
necessary to trigger an ELM. Figure 11 shows the perturbed
pressure profile at the mid-plane in DIII-D for different pellet
sizes, either at the time of the maximum perturbation or at
the time of the onset of an MHD instability. It shows that the
onset of the MHD instability occurs at the same level of per-
turbed pressure independent of the pellet size (as long as the
pellet size is above the minimum size). The required pressure
perturbation is about 2.5 times above the pressure at the top
of the pedestal, which allows the minimum pellet size
needed for ELM trigger to be predicted from the simulations.
For a DIII-D ITER-like plasma, with pellet injection at the
mid-plane, the predicted minimum pellet size is 1.3 mm (8.6
� 1019 atoms). Recent experiments in DIII-D125 have estab-
lished a critical pellet size at 3.5 � 1019 atoms, a factor 2.5
below the predicted value. The difference is likely due to the
larger volume of the density source in the simulations com-
pared to the experimental pellet cloud, due to the achievable
numerical resolution.
The MHD simulations show that the minimum pellet
size depends on the pellet injection geometry. Injection from
the high field side (HFS) triggers the ELM instability at
smaller pellets compared to low field side (LFS) midplane
021805-15 Huijsmans et al. Phys. Plasmas 22, 021805 (2015)
This article is copyrighted as indicated in the article. Reuse of AIP content is subject to the terms at: http://scitation.aip.org/termsconditions. Downloaded to IP:
131.155.151.137 On: Wed, 06 May 2015 08:13:15
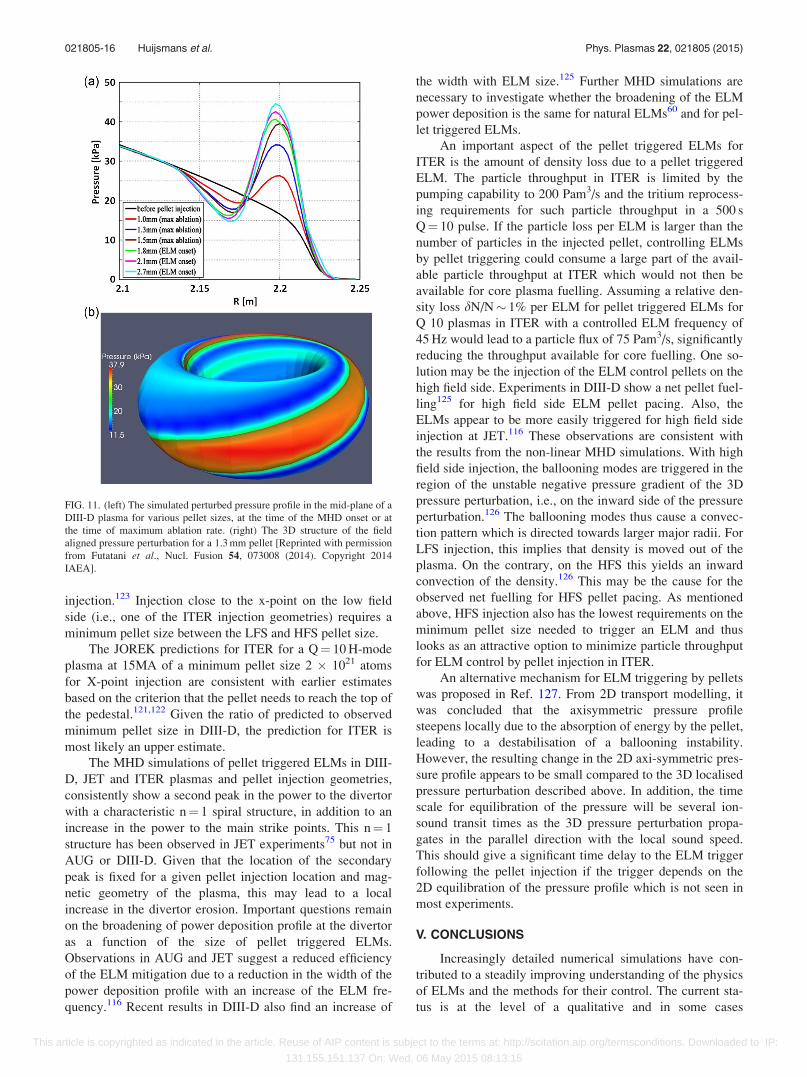
injection.123 Injection close to the x-point on the low field
side (i.e., one of the ITER injection geometries) requires a
minimum pellet size between the LFS and HFS pellet size.
The JOREK predictions for ITER for a Q¼ 10 H-mode
plasma at 15MA of a minimum pellet size 2 � 1021 atoms
for X-point injection are consistent with earlier estimates
based on the criterion that the pellet needs to reach the top of
the pedestal.121,122 Given the ratio of predicted to observed
minimum pellet size in DIII-D, the prediction for ITER is
most likely an upper estimate.
The MHD simulations of pellet triggered ELMs in DIII-
D, JET and ITER plasmas and pellet injection geometries,
consistently show a second peak in the power to the divertor
with a characteristic n¼ 1 spiral structure, in addition to an
increase in the power to the main strike points. This n¼ 1
structure has been observed in JET experiments75 but not in
AUG or DIII-D. Given that the location of the secondary
peak is fixed for a given pellet injection location and mag-
netic geometry of the plasma, this may lead to a local
increase in the divertor erosion. Important questions remain
on the broadening of power deposition profile at the divertor
as a function of the size of pellet triggered ELMs.
Observations in AUG and JET suggest a reduced efficiency
of the ELM mitigation due to a reduction in the width of the
power deposition profile with an increase of the ELM fre-
quency.116 Recent results in DIII-D also find an increase of
the width with ELM size.125 Further MHD simulations are
necessary to investigate whether the broadening of the ELM
power deposition is the same for natural ELMs60 and for pel-
let triggered ELMs.
An important aspect of the pellet triggered ELMs for
ITER is the amount of density loss due to a pellet triggered
ELM. The particle throughput in ITER is limited by the
pumping capability to 200 Pam3/s and the tritium reprocess-
ing requirements for such particle throughput in a 500 s
Q¼ 10 pulse. If the particle loss per ELM is larger than the
number of particles in the injected pellet, controlling ELMs
by pellet triggering could consume a large part of the avail-
able particle throughput at ITER which would not then be
available for core plasma fuelling. Assuming a relative den-
sity loss dN/N� 1% per ELM for pellet triggered ELMs for
Q 10 plasmas in ITER with a controlled ELM frequency of
45 Hz would lead to a particle flux of 75 Pam3/s, significantly
reducing the throughput available for core fuelling. One so-
lution may be the injection of the ELM control pellets on the
high field side. Experiments in DIII-D show a net pellet fuel-
ling125 for high field side ELM pellet pacing. Also, the
ELMs appear to be more easily triggered for high field side
injection at JET.116 These observations are consistent with
the results from the non-linear MHD simulations. With high
field side injection, the ballooning modes are triggered in the
region of the unstable negative pressure gradient of the 3D
pressure perturbation, i.e., on the inward side of the pressure
perturbation.126 The ballooning modes thus cause a convec-
tion pattern which is directed towards larger major radii. For
LFS injection, this implies that density is moved out of the
plasma. On the contrary, on the HFS this yields an inward
convection of the density.126 This may be the cause for the
observed net fuelling for HFS pellet pacing. As mentioned
above, HFS injection also has the lowest requirements on the
minimum pellet size needed to trigger an ELM and thus
looks as an attractive option to minimize particle throughput
for ELM control by pellet injection in ITER.
An alternative mechanism for ELM triggering by pellets
was proposed in Ref. 127. From 2D transport modelling, it
was concluded that the axisymmetric pressure profile
steepens locally due to the absorption of energy by the pellet,
leading to a destabilisation of a ballooning instability.
However, the resulting change in the 2D axi-symmetric pres-
sure profile appears to be small compared to the 3D localised
pressure perturbation described above. In addition, the time
scale for equilibration of the pressure will be several ion-
sound transit times as the 3D pressure perturbation propa-
gates in the parallel direction with the local sound speed.
This should give a significant time delay to the ELM trigger
following the pellet injection if the trigger depends on the
2D equilibration of the pressure profile which is not seen in
most experiments.
V. CONCLUSIONS
Increasingly detailed numerical simulations have con-
tributed to a steadily improving understanding of the physics
of ELMs and the methods for their control. The current sta-
tus is at the level of a qualitative and in some cases
FIG. 11. (left) The simulated perturbed pressure profile in the mid-plane of a
DIII-D plasma for various pellet sizes, at the time of the MHD onset or at
the time of maximum ablation rate. (right) The 3D structure of the field
aligned pressure perturbation for a 1.3 mm pellet [Reprinted with permission
from Futatani et al., Nucl. Fusion 54, 073008 (2014). Copyright 2014
IAEA].
021805-16 Huijsmans et al. Phys. Plasmas 22, 021805 (2015)
This article is copyrighted as indicated in the article. Reuse of AIP content is subject to the terms at: http://scitation.aip.org/termsconditions. Downloaded to IP:
131.155.151.137 On: Wed, 06 May 2015 08:13:15

quantitative description of the phenomena. The EPED
model, predicting the height and width of the H-mode pedes-
tal, is a good example of an existing quantitative model, hav-
ing been validated on a large database including multiple
machines. Other examples include the comparison of the pre-
dicted plasma response with measured perturbed equilibrium
profiles due to RMP fields. Quantitative predictions, for
example, for amplitudes of ELM energy and particle losses,
RMP fields required for ELM stabilisation and pellet require-
ments for ELM triggering are still being developed. These
are essential for the validation of the physics models and for
extrapolation to future devices such as ITER.
The basic physics model used for the modelling of
ELMs and ELM control is the MHD model. However, it is
clear that the MHD model needs to be extended for a more
accurate description of the experimental observations and
predictions for ITER. Simulations of multiple ELM cycles
will need to include a detailed description of the interaction
of the plasma with the divertor, most likely including a
description of neutrals and impurities (necessary to describe
the high recycling/partially detached ITER divertor plasma).
A description of (heavy) impurities is needed to model the
effects of ELMs on the density of impurities at the plasma
edge which are key to the control of high Z impurities in the
core plasma in existing devices and ITER and vice-versa.
Predictive RMP simulations will need an accurate model for
neo-classical physics including neo-classical toroidal viscos-
ity and a (fluid) model for the RMP induced transport com-
bined with non-linear MHD. Alternatively, gyro-kinetic
models including a consistent magnetic response with a con-
sistent time-varying equilibrium can be used (but reaching a
truly steady-state solution will be challenging). These exten-
sions to the MHD model are essential for the next steps
towards a fully predictive model of ELMs and ELM control.
Disclaimer: The views and opinions expressed herein
do not necessarily reflect those of the ITER Organization.
1A. Loarte, G. Saibene, R. Sartori, D. Campbell, M. Becoulet, L. Horton,
T. Eich, A. Herrmann, G. Matthews, N. Asakura, A. Chankin, A.
Leonard, G. Porter, G. Federici, G. Janeschitz, M. Shimada, and M.
Sugihara, Plasma Phys. Controlled Fusion 45, 1549 (2003).2A. Loarte, B. Lipschultz, A. S. Kukushkin, G. F. Matthews, P. C.
Stangeby, N. Asakura, G. F. Counsell, G. Federici, A. Kallenbach, K.
Krieger, A. Mahdavi, V. Philipps, D. Reiter, J. Roth, J. Strachan, D.
Whyte, R. Doerner, T. Eich, W. Fundamenski, A. Herrmann, M.
Fenstermacher, P. Ghendrih, M. Groth, A. Kirschner, S. Konoshima, B.
LaBombard, P. Lang, A. W. Leonard, P. Monier-Garbet, R. Neu, H.
Pacher, B. Pegourie, R. A. Pitts, S. Takamura, J. Terry, E. Tsitrone, the
ITPA Scrape-off Layer and Divertor Physics Topical Group et al., Nucl.
Fusion 47, S203 (2007).3A. Loarte, G. Huijsmans, S. Futatani, D. J. Campbell, T. Casper, E. Daly,
Y. Gribov, R. A. Pitts, S. Lisgo, A. Sashala Naik et al., Nucl. Fusion 54,
033007 (18pp) (2014).4P. T. Lang, G. D. Conway, T. Eich, L. Fattorini, O. Gruber, S. Gunter, L.
D. Horton, S. Kalvin, A. Kallenbach, M. Kaufmann et al., Nucl. Fusion
44, 665–677 (2004).5A. W. Degeling, Y. R. Martin, J.-B. Lister, L. Villard, V. N. Dokouka, V.
E. Lukash, and R. R. Khayrutdinov, Plasma Phys. Controlled Fusion 45,
1637 (2003).6T. E. Evans, R. A. Moyer, P. R. Thomas, J. G. Watkins, T. H. Osborne, J.
A. Boedo, E. J. Doyle, M. E. Fenstermacher, K. H. Finken, R. J.
Groebner et al., Phys. Rev. Lett. 92, 235003 (2004).7A. Kirk, J. Harrison, Y. Liu, E. Nardon, I. T. Chapman, P. Denner, and
the MAST team, Phys. Rev. Lett. 108, 255003 (2012).
8W. Suttrop, T. Eich, J. C. Fuchs, S. G€unter, A. Janzer, A. Herrmann, A.
Kallenbach, P. T. Lang, T. Lunt, M. Maraschek, R. M. McDermott, A.
Mlynek, T. P€utterich, M. Rott, T. Vierle, E. Wolfrum, Q. Yu, I.
Zammuto, and H. Zohm (ASDEX Upgrade Team), Phys. Rev. Lett. 106,
225004 (2011).9Y. M. Jeon, J. K. Park, S. W. Yoon, W. H. Ko, S. G. Lee, K. D. Lee, G.
S. Yun, Y. U. Nam, W. C. Kim, J.-G. Kwak, K. S. Lee, H. K. Kim, and
H. L. Yang, Phys. Rev. Lett. 109, 035004 (2012).10Y. Liang, H. R. Koslowski, P. R. Thomas, E. Nardon, B. Alper, P.
Andrew, Y. Andrew, G. Arnoux, Y. Baranov, M. Becoulet et al., PRL 98,
265004 (2007).11J. M. Canik, R. Maingi, T. E. Evans, R. E. Bell, S. P. Gerhardt, H. W.
Kugel, B. P. LeBlanc, J. Manickam, J. E. Menard, T. H. Osborne et al.,Nucl. Fusion 50, 034012 (2010).
12S. Maruyama, Y. Yang, R. A. Pitts, M. Sugihara, S. Putvinski, S.
Carpentier-Chouchana, B. Li, W. Li, L. R. Baylor, S. J. Meitner, C. Day,
B. LaBombard, and M. Reinke, in 23th Fusion Energy Conference(2010), Daejong, Paper No. ITR/P1-28.
13E. F. Daly, K. Ioki, A. Loarte, A. Martin, A. Brooks, P. Heitzenroeder,
M. Kalish, C. Neumeyer, P. Titus, Y. Zhai et al., Fusion Sci. Technol. 64,
168 (2013), see http://www.ans.org/pubs/journals/fst/a_18073.14T. E. Evans, M. E. Fenstermacher, R. A. Moyer, T. H. Osborne, J. G.
Watkins, P. Gohil, I. Joseph, M. J. Schaffer, L. R. Baylor, M. Becoulet
et al., Nucl. Fusion 48, 024002 (2008).15R. Fischer, J. C. Fuchs, R. McDermott, S. K. Rathgeber, W. Suttrop, M.
Willensdorfer, E. Wolfrum, and the ASDEX Upgrade Team et al.,Plasma Phys. Controlled Fusion 54, 115008 (2012).
16S. Saarelma, M. N. A. Beurskens, D. Dickinson, L. Frassinetti, M. J.
Leyland, C. M. Roach, and EFDA-JET Contributors, Nucl. Fusion 53,
123012 (9pp) (2013).17R. J. Groebner, P. B. Snyder, T. H. Osborne, A. W. Leonard, T. L.
Rhodes, L. Zeng, E. A. Unterberg, Z. Yan, G. R. McKee, C. J. Lasnier, J.
A. Boedo, and J. G. Watkins, Nucl. Fusion 50, 064002 (2010).18R. Scannell, A. Kirk, and I. T. Chapman, Plasma Phys. Controlled Fusion
55, 035013 (2013).19G. T. A. Huysmans, Plasma Phys. Controlled Fusion 47(12), 2107–2121
(2005).20J. D. Callen, C. C. Hegna, B. W. Rice, E. J. Strait, and A. D. Turnbull,
Phys. Plasmas 6(8), 2963 (1999).21P. B. Snyder, H. R. Wilson, J. R. Ferron, L. L. Lao, A. W. Leonard, D.
Mossessian, M. Murakami, T. H. Osborne, A. D. Turnbull, and X. Q. Xu,
Nucl. Fusion 44, 320–328 (2004).22S. Saarelma, V. Parail, Y. Andrew, E. de la Luna, A. Kallenbach, M.
Kempenaars, A. Korotkov, A. Loarte, J. Lonnroth, P. Monier-Garbet, J.
Stober, W. Suttrop, and Contributors to the EFDA-JET Workprogramme,
Plasma Phys. Controlled Fusion 47, 713–731 (2005).23A. Burckhart, “Different ELM regimes at ASDEX Upgrade and their lin-
ear stability analysis,” Dissertation, LMU M€unchen (2013).24P. Maget, J.-F. Artaud, M. Becoulet, T. Casper, J. Faustin, J. Garcia, G.
T. A. Huijsmans, A. Loarte, and G. Saibene, Nucl. Fusion 53, 093011
(2013).25S. Saarelma, T. Casper, I. T. Chapman, G. T. A. Huijsmans, O. Kwon, J.
Lee, and A. Loarte, Nucl. Fusion 52, 103020 (7pp) (2012).26P. B. Snyder, R. J. Groebner, J. W. Hughes, T. H. Osborne, M.
Beurskens, A. W. Leonard, H. R. Wilson, and X. Q. Xu, Nucl. Fusion 51,
103016 (8pp) (2011).27P. B. Snyder, T. H. Osborne, K. H. Burrell, J. Candy, R. J. Groebner, A.
W. Leonard, R. Nazikian, D. Orlov, O. Schmitz, M. R. Wade, and H. R.
Wilson, in IAEA Fusion Energy Conference, TH/P3-17 (2012).28R. J. Groebner, C. S. Chang, J. W. Hughes, R. Maingi, P. B. Snyder, X.
Q. Xu, J. A. Boedo, D. P. Boyle, J. D. Callen, J. M. Canik et al., Nucl.
Fusion 53, 093024 (2013).29R. J. Hastie, P. J. Catto, and J. J. Ramos, Phys. Plasmas 7, 4561 (2000).30G. T. A. Huysmans, Phys. Plasmas 8, 4292 (2001).31X. Q. Xu, B. Dudson, P. B. Snyder, M. V. Umansky, and H. Wilson,
Phys. Rev. Lett. 105, 175005 (2010).32P. W. Xi, X. Q. Xu, T. Y. Xia, W. M. Nevins, and S. S. Kim, Nucl.
Fusion 53, 113020 (2013).33P. B. Snyder, K. H. Burrell, H. R. Wilson, M. S. Chu, M. E.
Fenstermacher, A. W. Leonard, R. A. Moyer, T. H. Osborne, M.
Umansky, W. P. West, and X. Q. Xu, Nucl. Fusion 47, 961–968 (2007).34S. Saarelma, T. C. Hender, A. Kirk, H. Meyer, H. R. Wilson, and MAST
Team, Plasma Phys. Controlled Fusion 49, 31–42 (2007).
021805-17 Huijsmans et al. Phys. Plasmas 22, 021805 (2015)
This article is copyrighted as indicated in the article. Reuse of AIP content is subject to the terms at: http://scitation.aip.org/termsconditions. Downloaded to IP:
131.155.151.137 On: Wed, 06 May 2015 08:13:15

35A. Y. Pankin, G. Bateman, D. P. Brennan, A. H. Kritz, S. Kruger, P. B.
Snyder, C. Sovinec, and the NIMROD team, Plasma Phys. Controlled
Fusion 49(7), S63 (2007).36N. Aiba, M. Furukawa, M. Hirota, and S. Tokuda, Nucl. Fusion 50,
045002 (1pp) (2010).37N. Aiba, M. Furukawa, M. Hirota, N. Oyama, A. Kojima, S. Tokuda, and
M. Yagi, Nucl. Fusion 51, 073012 (9pp) (2011).38P. W. Xi, X. Q. Xu, X. G. Wang, and T. Y. Xia, Phys. Plasmas 19,
092503 (2012).39S. Pamela, G. T. A. Huysmans, M. N. A. Beurskens, S. Devaux, T. Eich,
S. Benkadda, and JET EFDA contributors, Plasma Phys. Controlled
Fusion 53, 054014 (2011).40A. Thyagaraja, M. Valovic, and P. J. Knight, Phys. Plasmas 17, 042507
(2010).41B. D. Dudson, M. V. Umansky, X. Q. Xu, P. B. Snyder, and H. R.
Wilson, Comput. Phys. Commun. 180, 1467 (2009).42J. F. Ma, X. Q. Xu, and B. D. Dudson, Nucl. Fusion 54, 033011 (2014).43R. G. Kleva and P. N. Guzdar, Phys. Plasmas 14, 012303 (2007).44W. Park, E. V. Belova, G. Y. Fu, X. Z. Tang, H. R. Strauss, and L. E.
Sugiyama, Phys. Plasmas 6, 1796 (1999).45L. E. Sugiyama and W. Park, Phys. Plasmas 7, 4644 (2000).46B. D. Dudson, X. Q. Xu, M. V. Umansky, H. R. Wilson, and P. B.
Snyder, Plasma Phys. Controlled Fusion 53, 054005 (2011).47O. Czarny and G. Huysmans, J. Comput. Phys. 227(16), 7423–7445
(2008).48L. E. Sugiyama, Phys. Scr. 86, 058205 (2012).49G. T. A. Huysmans, S. Pamela, E. van der Plas, and P. Ramet, Plasma
Phys. Controlled Fusion 51, 124012 (14pp) (2009).50M. Hoelzl, S. Gunter, R. P. Wenninger, W.-C. M€uller, G. T. A.
Huysmans, K. Lackner, I. Krebs, and ASDEX Upgrade Team, Phys.
Plasmas 19, 082505 (2012).51S. Pamela, G. T. A. Huijsmans, A. Kirk, I. T. Chapman, J. R. Harrison, R.
Scannell, A. J. Thornton, M. Becoulet, F. Orain, and the MAST Team,
Plasma Phys. Controlled Fusion 55, 095001 (13pp) (2013).52G. T. A. Huysmans and O. Czarny, Nucl. Fusion 47, 659–666 (2007).53T. Y. Xia and X. Q. Xu, Phys. Plasmas 20, 052102 (2013).54L. E. Sugiyama and the M3D Team, J. Phys.: Conf. Ser. 180, 012060
(2009).55L. E. Sugiyama and H. R. Strauss, Phys. Plasmas 17, 062505 (2010).56I. Krebs, M. H€olzl, K. Lackner, and S. G€unter, Phys. Plasmas 20, 082506
(2013).57A. H. Boozer, Phys. Fluids 26, 1288 (1983).58A. J. Lichtenberg and M. A. Lieberman, Regular and Chaotic Dynamics,
2nd ed. (Springer-Verlag, New York, NY, 1992).59R. K. W. Roeder, B. I. Rapoport, and T. W. Evans, Phys. Plasmas 10,
3796 (2003).60G. T. A. Huijsmans and A. Loarte, Nucl. Fusion 53, 123023 (10pp)
(2013).61X. Q. Xu, B. D. Dudson, P. B. Snyder, M. V. Umansky, H. R. Wilson,
and T. Casper, Nucl. Fusion 51, 103040 (2011).62A. W. Leonard, R. J. Groebner, M. A. Mahdavi, T. H. Osborne, M. E.
Fenstermacher, C. J. Lasnier, T. W. Petrie et al., Plasma Phys. Controlled
Fusion 44(6), 945 (2002).63T. Y. Xia, X. Q. Xu, B. D. Dudson, and J. Li, Contrib. Plasma Phys. 52,
353 (2012).64T. Y. Xia, X. Q. Xu, and P. W. Xi, Nucl. Fusion 53, 073009 (2013).65X. Q. Xu, P. W. Xi, A. Dimits, I. Joseph, M. V. Umansky, T. Y. Xia, B.
Gui, S. S. Kim, G. Y. Park, T. Rhee, H. Jhang, P. H. Diamond, B.
Dudson, and P. B. Snyder, Phys. Plasmas 20, 056113 (2013).66P. W. Xi, X. Q. Xu, and P. H. Diamond, Phys. Plasmas 21, 056110
(2014).67H. Y. Guo, J. Li, B. N. Wan, X. Z. Gong, Y. F. Liang, G. S. Xu, X. D.
Zhang, S. Y. Ding, K. F. Gan, J. S. Hu et al., Phys. Plasmas 21, 056107
(2014).68T. Eich, H. Thomsen, W. Fundamenski, G. Arnoux, S. Brezinsek, S.
Devaux, A. Herrmann, S. Jachmich, and J. Rapp, J. Nucl. Mater. 415,
S856–S859 (2011).69A. W. Leonard, N. Asakura, J. A. Boedo, M. Becoulet, G. F. Counsell, T.
Eich, W. Fundamenski, A. Herrmann, L. D. Horton, Y. Kamada, A. Kirk,
B. Kurzan, A. Loarte, J. Neuhauser, I. Nunes, N. Oyama, R. A. Pitts, G.
Saibene, C. Silva, P. B. Snyder, H. Urano, M. R. Wade, and H. R. Wilson
for the Pedestal and Edge Physics ITPA Topical Group, Plasma Phys.
Controlled Fusion 48, A149–A162 (2006).70T. S. Hahm, Nucl. Fusion 53, 104026 (2013).
71J. E. Boom, E. Wolfrum, I. G. J. Classen, P. C. de Vries, M. Maraschek,
W. Suttrop, C. P. P0erez von Thun, A. J. H. Donne, B. J. Tobias, C. W.
Domier, N. C. Luhmann, Jr., H. K. Park, and the ASDEX Upgrade Team,
Nucl. Fusion 51, 103039 (9pp) (2011).72G. S. Yun, W. Lee, M. J. Choi, J. Lee, H. K. Park, B. Tobias, C. W.
Domier, N. C. Luhmann, Jr., A. J. H. Donne, J. H. Lee, and KSTAR
Team, PRL 107, 045004 (2011).73H. K. Park, M. J. Choa, M. Kim, J. Lee, W. Lee, G. S. Yun, Y. S. Bae, Y.
M. Jeon, J. H. Lee, S. W. Yoon, C. W. Domier, N. C. Luhmann, Jr., A. J.
H. Donn�e, W. W. Xiao, I. Joseph, W. Meyer, X. Q. Xu, and KSTAR
Team, in IAEA Fusion Energy Conf., San Diego, USA (2012), Paper No.
EX/11-3.74M. Kim, M. J. Choi, J. Lee, G. S. Yun, W. Lee, H. K. Park, C. W.
Domier, N. C. Luhmann, Jr., X. Q. Xu, and the KSTAR Team, Nucl.
Fusion 54, 093004 (2014).75R. Wenninger, T. H. Eich, G. T. A. Huysmans, P. T. Lang, S. Devaux, S.
Jachmich, F. K€ochl, JET EFDA Contributors et al., Plasma Phys.
Controlled Fusion 53, 105002 (2011).76D. Tskhakaya, R. A. Pitts, W. Fundamenski, T. Eich, S. Kuhn, and JET
EFDA Contributors, J. Nucl. Mater. 390–391, 335–338 (2009).77E. Havlickova, W. Fundamenski, D. Tskhakaya, G. Manfredi, and D.
Moulton, Plasma Phys. Controlled Fusion 54, 045002 (21pp) (2012).78F. D. Halpern, H. L€utjens, and J.-F. Luciani, Phys. Plasmas 18, 102501
(2011).79P. W. Xi, X. Q. Xu, and P. H. Diamond, Phys. Rev. Lett. 112, 085001
(2014).80M. E. Fenstermacher, T. E. Evans, T. H. Osborne, M. J. Schaffer, M. P.
Aldan, J. S. deGrassie, P. Gohil, I. Joseph, R. A. Moyer, P. B. Snyder, R.
J. Groebner, M. Jakubowski, A. W. Leonard, O. Schmitz, and the DIII-D
Team, Phys. Plasmas 15, 056122 (2008).81K. H. Burrell, T. E. Evans, E. J. Doyle, M. E. Fenstermacher, R. J.
Groebner, A. W. Leonard, R. A. Moyer, T. H. Osborne, M. J. Schaffer, P.
B. Snyder, P. R. Thomas, W. P. West, J. A. Boedo, A. M. Garofalo, P.
Gohil, G. L. Jackson, R. J. La Haye, C. J. Lasnier, H. Reimerdes, T. L.
Rhodes, J. T. Scoville, W. M. Solomon, D. M. Thomas, G. Wang, J. G.
Watkins, and L. Zeng, Plasma Phys. Controlled Fusion 47, B37 (2005).82A. Kirk, Y. Liu, E. Nardon, P. Tamain, P. Cahyna, I. Chapman, P.
Denner, H. Meyer, S. Mordijck, D. Temple, and the MAST team, Plasma
Phys. Controlled Fusion 53, 065011 (18pp) (2011).83T. E. Evans, D. M. Orlov, A. Wingen, W. Wu, A. Loarte, T. A. Casper,
O. Schmitz, G. Saibene, M. J. Schaffer, and E. Daly, Nucl. Fusion 53,
093029 (13pp) (2013).84R. Fitzpatrick, Phys. Plasmas 5(9), 3325 (1998).85M. Becoulet, G. Huysmans, X. Garbet, E. Nardon, D. Howell, A.
Garofalo, M. Schaffer, T. Evans, K. Shaing, A. Cole, J.-K. Park, and P.
Cahyna, Nucl. Fusion 49, 085011 (13pp) (2009).86F. L. Waelbroeck, Phys. Plasmas 10, 4040 (2003).87M. F. Heyn, I. B. Ivanov, S. V. Kasilov, W. Kernbichler, I. Joseph, R. A.
Moyer, A. M. Runov et al., Nucl. Fusion 48, 024005 (2008).88E. Nardon, P. Tamain, M. Becoulet, G. Huysmans, F. L. Waelbroeck
et al., Nucl. Fusion 50, 034002 (2010).89R. A. Moyer, M. A. Van Zeeland, D. M. Orlov, A. Wingen, T. E. Evans,
N. M. Ferraro, J. M. Hanson, R. Nazikian, M. R. Wade, L. Zeng et al.,Nucl. Fusion 52, 123019 (2012).
90M. Becoulet, F. Orain, P. Maget, N. Mellet, X. Garbet, E. Nardon, G. T.
A. Huysmans, T. Casper, A. Loarte, P. Cahyna, A. Smolyakov, F. L.
Waelbroeck, M. Schaffer, T. Evans, Y. Liang, O. Schmitz, M. Beurskens,
V. Rozhansky, E. Kaveeva et al., Nucl. Fusion 52, 054003 (2012).91N. M. Ferraro, Phys. Plasmas 19, 056105 (2012).92F. Orain, M. Becoulet, G. Dif-Pradalier, G. Huijsmans, S. Pamela, E.
Nardon, C. Passeron, G. Latu, V. Grandgirard, A. Fil, A. Ratnani, I.
Chapman, A. Kirk, A. Thornton, M. Hoelzl, and P. Cahyna, Phys.
Plasmas 20, 102510 (2013).93Y. Q. Liu, A. Kirk, and E. Nardon, Phys. Plasmas 17, 122502 (2010).94M. J. Lanctot, H. Reimerdes, A. M. Garofalo, M. S. Chu, J. M. Hanson,
Y. Q. Liu, G. A. Navratil, I. N. Bogatu, Y. In, G. L. Jackson, R. J. La
Haye, M. Okayabashi, J.-K. Park, M. J. Schaffer, O. Schmitz, E. J. Strait,
A. D. Turnbull et al., Phys. Plasmas 18, 056121 (2011).95K. C. Shaing, P. Cahyna, M. Becoulet, J.-K. Park, S. A. Sabbagh, and M.
S. Chu, Phys. Plasmas 15, 082506 (2008).96Y. Q. Liu, A. Kirk, Y. Sun, P. Cahyna, I. T. Chapman, P. Denner, G.
Fishpool, A. M. Garofalo, J. R. Harrison, E. Nardon, and the MAST
Team, Plasma Phys. Controlled Fusion 54, 124013 (2012).
021805-18 Huijsmans et al. Phys. Plasmas 22, 021805 (2015)
This article is copyrighted as indicated in the article. Reuse of AIP content is subject to the terms at: http://scitation.aip.org/termsconditions. Downloaded to IP:
131.155.151.137 On: Wed, 06 May 2015 08:13:15

97A. Wingen, T. E. Evans, and K. H. Spatschek, Nucl. Fusion 49, 055027
(2009).98D. M. Orlov, T. E. Evans, R. A. Moyer, M. J. Schaffer, O. Schmitz, and
A. Loarte, Fusion Eng. Des. 87, 1536 (2012).99M. W. Shafer, E. A. Unterberg, D. M. Orlov, T. E. Evans, J. H. Harris, D.
L. Hillis, R. Maingi, R. A. Moyer, R. Nazikian, A. Wingen et al., Nucl.
Fusion 52, 122001 (2012).100S. C. Jardin, J. Breslau, and N. Ferraro, J. Comput. Phys. 226, 2146
(2007).101N. M. Ferraro, S. C. Jardin, and P. B. Snyder, Phys. Plasmas 17, 102508
(2010).102N. M. Ferraro, T. E. Evans, L. L. Lao1, R. A. Moyer, R. Nazikian, D. M.
Orlov, M. W. Shafer, E. A. Unterberg, M. R. Wade, A. Wingen et al.,Nucl. Fusion 53, 073042 (8pp) (2013).
103J.-K. Park, A. H. Boozer, and A. H. Glasser, Phys. Plasmas 14, 052110
(2007).104S. P. Hirshman and J. C. Whitson, Phys. Fluids 26, 3553 (1983).105M. J. Schaffer, J. E. Menard, M. P. Aldan, J. M. Bialek, T. E. Evans, and
R. A. Moyer, Nucl. Fusion 48, 024004 (2008).106P. B. Snyder, T. H. Osborne, K. H. Burrell, R. J. Groebner, A. W.
Leonard, R. Nazikian, D. M. Orlov, O. Schmitz, M. R. Wade, and H. R.
Wilson, Phys. Plasmas 19, 056115 (2012).107F. L. Waelbroeck, I. Joseph, E. Nardon, M. Becoulet, and R. Fitzpatrick,
Nucl. Fusion 52, 074004 (2012).108J. D. Callen, A. J. Cole, and C. C. Hegna, Phys. Plasmas 19, 112505
(2012).109J. D. Callen, A. J. Cole, C. C. Hegna, S. Mordijck, and R. A. Moyer,
Nucl. Fusion 52, 114005 (2012).110G. Park, C. S. Chang, I. Joseph, and R. A. Moyer, Phys. Plasmas 17,
102503 (2010).111R. E. Waltz and F. L. Waelbroeck, Phys. Plasmas 19, 032508 (2012).112Q. Yu and S. G€unter, Nucl. Fusion 49, 062001 (5pp) (2009).113G. M. Zaslavsky, R. Z. Sagdeev, and D. A. Usikov, Weak Chaos and
Quasi-Regular Patterns (Cambridge University Press, 1991), p. 67.114P. T. Lang, A. Alonso, B. Alper, E. Belonohy, A. Boboc, S. Devaux, T.
Eich, D. Frigione, K. Gal, L. Garzotti, A. Geraud, G. Kocsis, F. Kochl, K.
Lackner, A. Loarte, P. J. Lomas, M. Maraschek, H. W. Muller, R. Neu, J.
Neuhauser, G. Petravich, G. Saibene, J. Schweinzer, H. Thomsen, M.
Tsalas, R. Wenninger, H. Zohm, and JET EFDA Contributors, Nucl.
Fusion 51, 033010 (16pp) (2011).115A. B. Rechester and M. N. Rosenbluth, Phys. Rev. Lett. 40, 38 (1978).116P. T. Lang, D. Frigione, A. Geraud, T. Alarcon, P. Bennett, G. Cseh, D.
Garnier, L. Garzotti, F. Kochl, G. Kocsis, M. Lennholm, R. Neu, R.
Mooney, S. Saarelma, B. Sieglin, and JET-EFDA Contributors, Nucl.
Fusion 53, 073010 (2013).
117P. T. Lang, K. Lackner, M. Maraschek, B. Alper, E. Belonohy, K. G�al, J.
Hobirk, A. Kallenbach, S. K�alvin, G. Kocsis, C. P. Perez von Thun, W.
Suttrop, T. Szepesi, R. Wenninger, H. Zohm, and the ASDEX Upgrade
Team and JET-EFDA contributors, Nucl. Fusion 48, 095007 (2008).118L. Baylor, N. Commaux, T. C. Jernigan, N. H. Brooks, S. K. Combs, T.
E. Evans, M. E. Fenstermacher, R. C. Isler, C. J. Lasnier, S. J. Meitner, R.
A. Moyer, T. H. Osborne, P. B. Parks, P. B. Snyder, E. J. Strait, E. A.
Unterberg, and A. Loarte, PRL 110, 245001 (2013).119L. Baylor, N. Commaux, T. C. Jernigan, S. J. Meitner, S. K. Combs, R.
C. Isler, E. A. Unterberg, N. H. Brooks, T. E. Evans, A. W. Leonard, T.
H. Osborne, P. B. Parks, P. B. Snyder, E. J. Strait, M. E. Fenstermacher,
C. J. Lasnier, R. A. Moyer, A. Loarte, G. T. A. Huijsmans, and S.
Futatani, Phys. Plasmas 20, 082513 (2013).120G. Kocsis, S. Kalvin, P. T. Lang, M. Maraschek, J. Neuhauser, W.
Schneider, T. Szepesi, and the ASDEX Upgrade Team, Nucl. Fusion 47,
1166–1175 (2007).121A. Polevoi, A. S. Kukushkin, W. Houlberg, S. Maruyama, K. G�al, P.
Lang, B. Pegourie, H. Nehme, M. Sugihara, A. Loarte, D. Campbell, and
V. A. Chuyanov, in 35th EPS Conference on Plasma Phys. Hersonissos,
ECA, Vol. 32D, P-1.109 (2008).122K. G�al et al., in 22th IAEA Fusion Energy Conference, Geneva (2008),
Paper No. TH/P4-5.123S. Futatani, G. Huijsmans, A. Loarte, L. R. Baylor, N. Commaux, T. C.
Jernigan, M. E. Fenstermacher, C. Lasnier, T. H. Osborne, and B.
Pegourie, Nucl. Fusion 54, 073008 (20pp) (2014).124K. G�al, E. Belonohy, G. Kocsis, P. T. Lang, G. Veres, and the ASDEX
Upgrade Team, Nucl. Fusion 48, 085005 (2008).125L. Baylor, P. T. Lang, S. L. Allen, S. K. Combs, N. Commaux, T. E.
Evans, M. E. Fenstermacher, G. Huijsmans, T. C. Jernigan, C. J. Lasnier,
A. W. Leonard, A. Loarte, R. Maingi, S. Maruyama, S. J. Meitner, R. A.
Moyer, and T. H. Osborne, “ELM mitigation with pellet ELM triggering
and implications for PFCs and plasma performance in ITER,” J. Nucl.
Mater. (published online), see http://www.sciencedirect.com/science/article/
pii/S0022311514006709/pdfft?md5=ac62c2324d0ca7fa655c82958b391bd8
&pid=1-s2.0-S0022311514006709-main.pdf.126G. T. A. Huysmans, S. Pamela, M. Beurskens, M. B�ecoulet, and E. van
der Plas, in 23th IAEA Fusion Energy Conference, Korea (2010).127N. Hayashi, N. Aiba, T. Takizuka, and N. Oyama, Nucl. Fusion 53,
123009 (2013).128I. Chapman, M. Becoulet, T. Bird, J. Canik, M. Cianciosa, W. A. Cooper,
T. Evans, N. Ferraro, C. Fuchs, M. Gryaznevich, Y. Gribov, C. Ham, J.
Hanson, G. Huijsmans, A. Kirk, S. Lazerson, Y. Liang, I. Lupelli, R. A.
Moyer, C. N€uhrenberg, F. Orain, D. Orlov, W. Suttrop, D. Yadykin, the
ASDEX Upgrade, DIII-D, MAST and NSTX Teams, and EFDA-JET
Contributors, Nucl. Fusion 54, 083006 (2014).
021805-19 Huijsmans et al. Phys. Plasmas 22, 021805 (2015)
This article is copyrighted as indicated in the article. Reuse of AIP content is subject to the terms at: http://scitation.aip.org/termsconditions. Downloaded to IP:
131.155.151.137 On: Wed, 06 May 2015 08:13:15


![Energy relaxation in edge modes in the quantum Hall effect · used in all the experiments that measured the thermal conductance of chiral edge modes in the QHE [9–12,26,27]. The](https://img.pdfslide.us/doc/110x75/5f35c24ff21b525e932dc7b4/energy-relaxation-in-edge-modes-in-the-quantum-hall-effect-used-in-all-the-experiments.jpg)