Embed Size (px)
Citation preview

1
Modelling, Design and Analysis of Low Frequency Platform
for Attenuating Micro-Vibration in Spacecraft D. Kamesh,† R. Pandiyan †, Ashitava Ghosal *
†ISRO Satellite Centre , Bangalore, INDIA * Indian Institute of Science, Bangalore, INDIA
______________________________________________________________________________________
Abstract
One of the most important factors that affect the pointing of precision payloads
and devices in space platforms is the vibration generated due to static and dynamic
unbalanced forces of rotary equipments placed in the neighborhood of payload.
Generally, such disturbances are of low amplitude, less than 1 kHz, and are termed as
‘micro-vibrations’. Due to low damping in the space structure, these vibrations have long
decay time and they degrade the performance of payload. This paper addresses the
design, modeling and analysis of a low frequency space frame platform for passive and
active attenuation of micro-vibrations. This flexible platform has been designed to act as
a mount for devices like reaction wheels, and consists of four folded continuous beams
arranged in three dimensions. Frequency and response analysis have been carried out by
varying the number of folds, and thickness of vertical beam. Results show that lower
frequencies can be achieved by increasing the number of folds and by decreasing the
thickness of the blade. In addition, active vibration control is studied by incorporating
piezoelectric actuators and sensors in the dynamic model. It is shown using simulation
that a control strategy using optimal control is effective for vibration suppression under a
wide variety of loading conditions.
_______________________________________________________________________
1. Introduction
Vibration propagation into mechanical systems can cause many problems at
different levels resulting in performance degradation of sensitive systems [1]. Vibrations
______________________ † Corresponding author. E-mail address: [email protected]
2
that occur at frequencies up to 1 kHz have often been neglected in the past due to the low
levels of disturbances. However, recently these have become very important and have
received a great deal of attention by many researchers. This is especially true for
spacecraft structures where, due to the ever increasing requirements to protect sensitive
payloads, such as optical instruments or microgravity experiments, there is a pressing
need for such micro-vibration suppression. In a spacecraft, micro-vibrations are produced
by the functioning of on-board equipment such as reaction wheels, gyroscopes, thrusters,
electric motors, cryo-coolers and data storage devices. They propagate through the
satellite structure towards sensitive payloads such as mid-wave infrared surveillance
sensors, laser communication devices and astronomical telescopes thereby jeopardizing
their correct functioning. Spacecraft that use control moment gyroscopes (CMG) for
attitude control tend to have high sensitivity to pointing and jitter, creating a need for
isolation [2]. Passive vibration suppression and isolation is the recommended first
approach, to try to reduce these unwanted disturbances [3, 4, 5, 6]. From a practical
standpoint, the reduction of the vibration level at a sensitive location of a structure can be
attempted by placing the equipment on appropriate mountings [7, 8]. The Hubble Space
Telescope (HST) is probably the best known example of a spacecraft that includes an
isolation system that is necessary to achieve its science mission [9] - it uses a passive
isolation system to mitigate effects from the reaction wheel assembly that points the
spacecraft. The system, designed by Honeywell, employs a viscous fluid-damped
isolator. Another example of an isolator used in several space missions is the Honeywell
D-Strut [10] that uses a bellows system with a viscous damped-fluid and is similar to the
Hubble system. This isolator has been reengineered in recent years to combine a passive
and active system. Vibration isolation has been tested with an Ultra Quite Platform
(UQP) – a six axis Stewart platform active isolation system [11]. A high performance
strut isolator has been developed for multi-axis isolation for reaction wheel assembly
[12]. In this case a three parameter system with spring elements in series and parallel
with the damper have been incorporated for each strut elements. The shape memory alloy
(SMA) actuators have been used in [13], but its response time is too slow for vibration
suppression using the thermal control to effect changes in 10 to 50 Hz range. An
experimental investigation of shape memory alloy springs for passive vibration isolation
3
has also been studied in [14]. All of the above passive isolation systems use a variety of
implementation devices including visco-elastic materials, springs, soft materials, and
hydraulic dampers, pneumatic isolator [15].
Passive damping limits the amplification at resonance but tends to reduce the high
frequency attenuation of the isolation system. For demanding missions, passive solutions
may have limited effectiveness, particularly if the disturbances are harmonic in nature
and with broad frequency content such as those generated by cryo-cooler and reaction
wheels. Active isolation has been introduced to resolve this conflict, allowing to achieve,
simultaneously, a low amplification at resonance and a large attenuation at high
frequency. Active six degree of freedom local vibration isolation applied to a flexible
space telescope has been studied by Kaplow and Velman [16] for attenuating high
frequency disturbances. Active vibration isolation interface to protect the spacecraft
pointing accuracy from payload disturbances has been discussed in [17, 18, 19]. The
piezoelectric Stewart platform for general purpose active damping has been studied in
[17]. This uses stiff active damping interface as a support for payloads and it consists of a
six degree of freedom Stewart platform, where each leg of the active interface is made of
a linear piezoelectric actuator. Another six-axis single-stage active vibration isolator
based on Stewart platform has been developed for space application [18]. The structural
vibration control using an active resonator absorber (ARA) has been studied with PZT
inertial actuators [19]. An integrated active damping device (IADD- a piezo based
device) and the Multi-purpose Active Isolation System (MAIS) with a six DOF isolator
based on six active struts (co-located piezo sensor & actuator) arranged in hexapod
configuration have been studied for high pointing accuracy satellites [20]. Active
vibration control is also increasingly being used for flexible structures. In such control
systems, the piezoelectric materials is embedded in the structural elements as actuators
and these smart structures have advantages such as high stiffness, light weight, low cost,
low power consumption and easy implementation. Crawley and Javier [21] have derived
the static and dynamic models for segmented piezoelectric actuators bonded or embedded
in the flexible structures. The use of surface mounted piezo-actuators as active dampers
in reducing the free vibration decay time of cantilevered beams has been studied by
4
Bailey and Hubbard [22]. Optimal control of vibration in flexible smart structures using
piezo-sensors and actuators has been studied in [23, 24].
In this paper, a low frequency space platform has been proposed which can be
used as a mounting device for payloads in spacecrafts for both passive and active control
of disturbances arising due to micro-vibrations. Finite element analysis of the platform is
carried out for static and dynamic load cases. Passive vibration control has been analyzed
using modal analysis techniques to simulate the response of each mode for free and
forced vibration cases. Active control has been studied by embedding the platform with
piezo actuators and sensors. The simulation results show further improvement in
vibration attenuation when active control is used.
This paper is organized as follows: In section 2, we present a detailed description
of the space frame platform designed to suppress micro-vibrations. Section 3 describes
the finite element formulation of the proposed platform. Results for different load cases
described in section 4 show the effectiveness of the platform for passive control of
vibration. Simulation results for active control are described in section 5. Concluding
remarks on the performance of the designed isolator system are presented in section 6.
2. Description of flexible platform
The study of isolator must be viewed as a system consisting of three parts - the source
system in which the vibration is generated, the receiver system in which vibration force
or response is felt and the interconnecting isolation system which connects the source to
the receiver. The requirements of any isolator therefore will be to support the objects with
sufficient static stiffness and strength and also to provide the smallest possible dynamic
stiffness. Therefore, the isolator must support the equipment under static loading and
must also be compliant so that disturbances are not transmitted to the precision
equipments in spacecrafts. Design criteria [25] require that the low frequency platform
support a generic payload up to 5.5 kg with a low isolation plunge frequency less than 15
Hz. Simulations were performed using Matlab [26] to determine the optimum geometry
of the platform. The proposed low frequency space frame platform consisting of four
folded beams is shown in Fig. 1. It comprises of four single folded beams placed
orthogonal to each other. Each of these four folded beams is assembled on to the payload

5
as shown in Fig. 2 which is considered to be a source of micro-vibrations. The other end
of these beams is connected to a base platform of high stiffness whose first fundamental
frequency is greater than 100 Hz. The dimensions and properties of the flexible beams
are given in Table 1. These dimensions have been arrived at by calculating the
frequencies, displacements and reaction forces for varying geometric dimensions of the
beam. The vertical beams are thinner than the horizontal beams, thus making them less
stiff.
Figure 1 -- Flexible space frame platform.

6
Figure 2 -- A rigid mass mounted on the flexible platform.
Table 1 Geometric, Mass and Physical properties of one fold beam. Geometric properties For elements 1, 2, 3, 4 Depth (m) Length (m)
0.003 0.035
For elements 5, 6, 7, 8, 21, 22, 23, 24 Depth (m) Length (m)
0.001/or 0.0008/or 0.0006 0.024/or 0.036/or 0.048
For elements 9, 10, 11, 12, 17, 18, 19, 20 Depth (m) Length (m)
0.003 0.008
For elements 13, 14, 15, 16 Depth (m) Length (m)
0.001/or 0.0008/or 0.0006 0.048/or 0.060/or 0.072
For elements 25, 26, 27, 28 Depth (m) Length (m)
0.003 0.030
Width of all elements (m) 0.025 Physical and Mass properties E, Modulus of elasticity G, Modulus of rigidity Density Mass of the object Mass moment of inertia, Iyy Mass moment of inertia, Ixx & Izz
21000 GPa 7000 GPa 7800 kg/mm3 5.5 kgs 0.0465 kg-m2 0.0270kg-m2

7
3. Finite Element Formulation
Finite element analysis of the platform is carried out using frame elements with six
degrees of freedom for each node. Flexure part of the frame element is modeled using the
Euler-Bernoulli beam theory.
3.1. Dynamic equation of motion of frame element
For a typical element in the four folded beam shown in Fig. 3, the element degrees of
freedom expressed in local axes Oxyz are [27]
Figure 3 -- A typical beam element.
(1)
and the rotation and are linked to deflection by
(2)
As the frame element consists of beam element, bar element and torsional element, the
strain energy of the frame element with uniform cross section is obtained as the sum of

8
energies of the above elements. The element (12 x 12) stiffness matrix in local axes
is composed of (6 x 6) sub-matrices and is of the form
(3)
with
The element mass matrix as described from the kinetic energy of the frame element is
also composed of (6 x 6) sub-matrices and is of the form
(4)
with
The elementary stiffness and mass matrices are expressed in structural axes OXYZ, by
performing the rotation from local frame to structural frame using the operator T
(5)
where T is a 12x12 block diagonal matrix with 4 blocks of 3x3 rotation matrix. The
structural degrees of freedom for the element are
(6)
The undamped equations of motion describing the nodal displacements of the attached
and free nodes, devoid of contribution from the rigid body are given as [27]
(7)
9
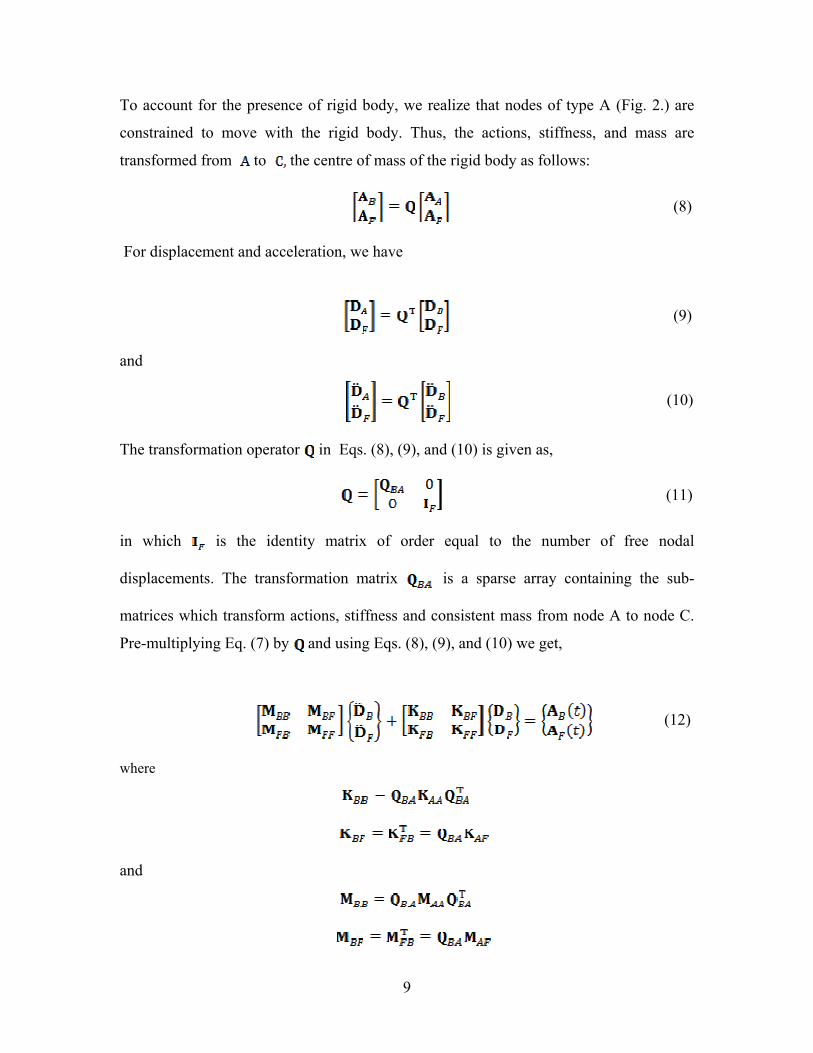
To account for the presence of rigid body, we realize that nodes of type A (Fig. 2.) are
constrained to move with the rigid body. Thus, the actions, stiffness, and mass are
transformed from to the centre of mass of the rigid body as follows:
(8)
For displacement and acceleration, we have
(9)
and
(10)
The transformation operator in Eqs. (8), (9), and (10) is given as,
(11)
in which is the identity matrix of order equal to the number of free nodal
displacements. The transformation matrix is a sparse array containing the sub-
matrices which transform actions, stiffness and consistent mass from node A to node C.
Pre-multiplying Eq. (7) by and using Eqs. (8), (9), and (10) we get,
(12)
where
and

10
The final mass matrix after adding the mass inertia of the rigid body will be as follows:
(13)
where, is a 6x6 matrix with top left 3x3 sub-matrix as and right bottom corner
3x3 sub-matrix as the inertia matrix. The equation of motion for platform in the nodal
form after the full assembly can be written as
(14)
(15)
where , and are the mass, damping and stiffness matrices and , and are the
nodal displacement, nodal velocity & nodal acceleration respectively. is the external
force vector, y is the output vector, is output displacement matrix and is output
velocity matrix. In Eq. (15), the damping matrix is assumed to be a linear combination of
stiffness and mass matrices as where α and β are nonnegative scalars.
3.2. Constitutive equations of the piezo actuators and sensors
The linear piezoelectric coupling between the elastic field and the electric field can be
expressed by the direct and the converse piezoelectric equations respectively [28]:
(16)
where, is the strain vector, the stress vector, is the electric field, is the
electric displacement, is the compliance matrix when the electric field is constant,
relates electric displacement vector H to stress under a zero
electric field matrix is the dielectric constant matrix under constant stress. For a
piezoelectric strip with thickness hp hb, where subscript p stands for piezo and
11
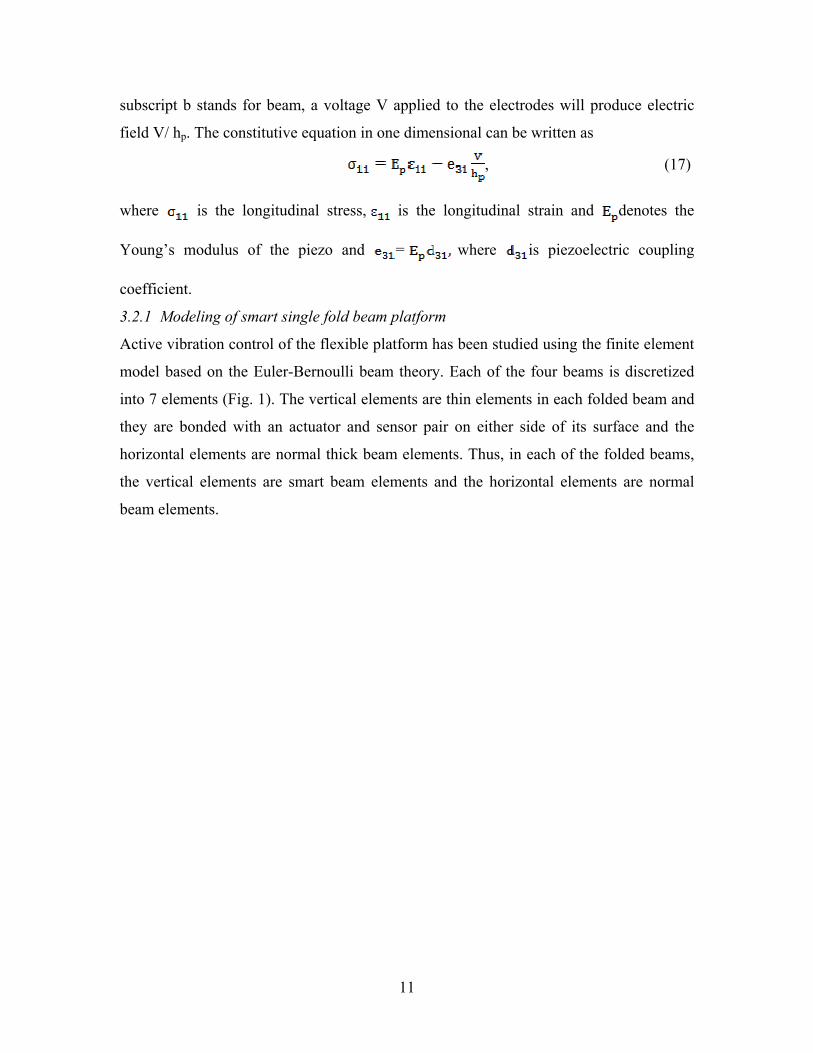
subscript b stands for beam, a voltage V applied to the electrodes will produce electric
field V/ hp. The constitutive equation in one dimensional can be written as
, (17)
where is the longitudinal stress, is the longitudinal strain and denotes the
Young’s modulus of the piezo and = where is piezoelectric coupling
coefficient.
3.2.1 Modeling of smart single fold beam platform
Active vibration control of the flexible platform has been studied using the finite element
model based on the Euler-Bernoulli beam theory. Each of the four beams is discretized
into 7 elements (Fig. 1). The vertical elements are thin elements in each folded beam and
they are bonded with an actuator and sensor pair on either side of its surface and the
horizontal elements are normal thick beam elements. Thus, in each of the folded beams,
the vertical elements are smart beam elements and the horizontal elements are normal
beam elements.
12
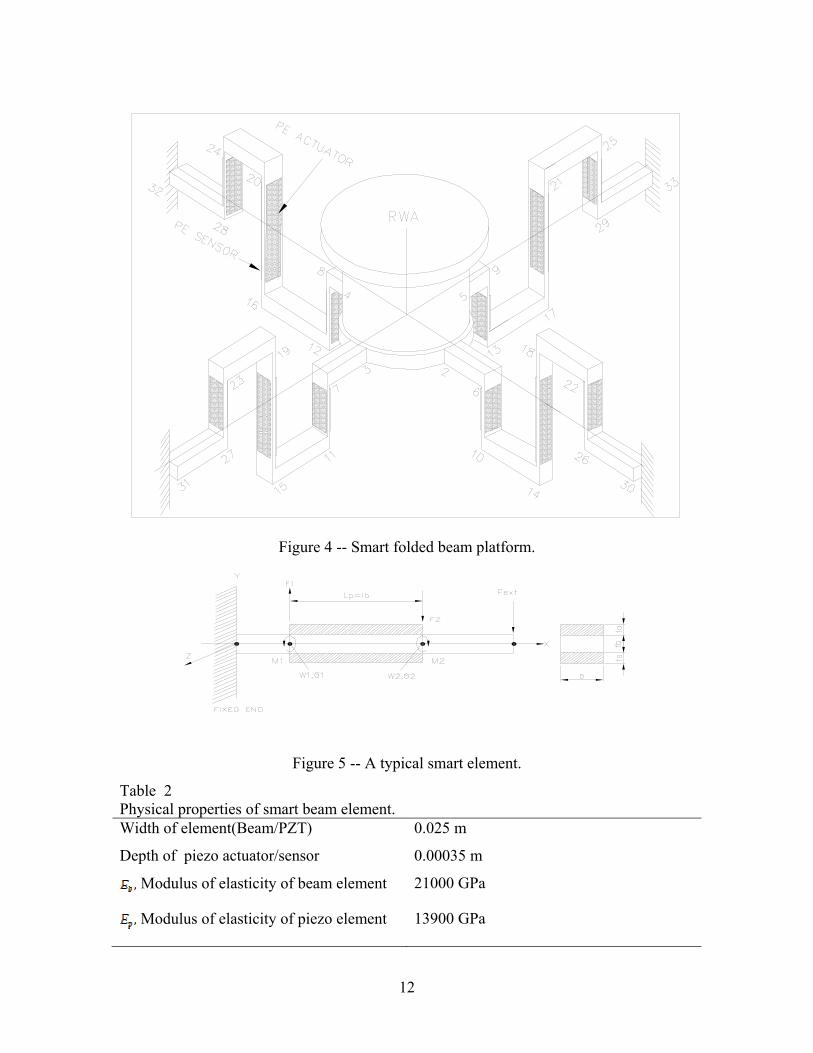
Figure 4 -- Smart folded beam platform.
Figure 5 -- A typical smart element.
Table 2 Physical properties of smart beam element. Width of element(Beam/PZT) 0.025 m
Depth of piezo actuator/sensor 0.00035 m
Modulus of elasticity of beam element 21000 GPa
Modulus of elasticity of piezo element 13900 GPa
13
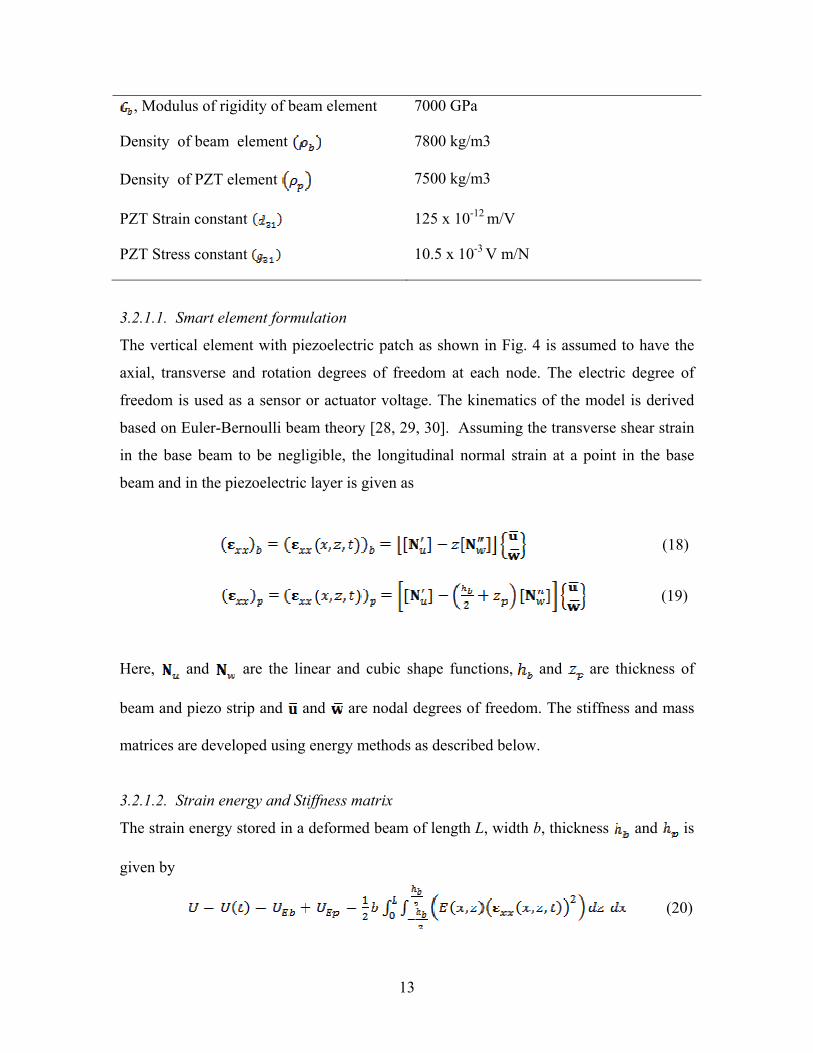
, Modulus of rigidity of beam element 7000 GPa
Density of beam element 7800 kg/m3
Density of PZT element 7500 kg/m3
PZT Strain constant 125 x 10-12 m/V
PZT Stress constant 10.5 x 10⁻³ V m/N
3.2.1.1. Smart element formulation
The vertical element with piezoelectric patch as shown in Fig. 4 is assumed to have the
axial, transverse and rotation degrees of freedom at each node. The electric degree of
freedom is used as a sensor or actuator voltage. The kinematics of the model is derived
based on Euler-Bernoulli beam theory [28, 29, 30]. Assuming the transverse shear strain
in the base beam to be negligible, the longitudinal normal strain at a point in the base
beam and in the piezoelectric layer is given as
(18)
(19)
Here, and are the linear and cubic shape functions, and are thickness of
beam and piezo strip and and are nodal degrees of freedom. The stiffness and mass
matrices are developed using energy methods as described below.
3.2.1.2. Strain energy and Stiffness matrix
The strain energy stored in a deformed beam of length L, width b, thickness and is
given by
(20)

14
where, and are strain energies of beam and piezo strip elements and are given as
(21)
(22)
In the above equations, and are the modulus of elasticity of beam and piezo
materials. These strain energy terms contribute to the stiffness matrix which is given as
(23)
3.2.1.3 Kinetic energy and Mass matrix
The kinetic energy of beam of width and length is given by
(24)
For a beam with uniform density and thickness, the kinetic energy associated with the
transverse motion and longitudinal motion of the beams are given by
(25)
(26)

15
The densities of beam and piezo materials are and respectively. These expressions
lead to the following element mass matrix
(28)
3.2.2. Sensor equation
The sensor equation is derived from the direct piezoelectric equation as described in [30].
The electric displacement developed on the sensor surface is directly proportional to the
stress acting on the sensor. If the polling is done along the thickness direction of the
sensors with the electrodes on the upper and lower surfaces, then the electric
displacement is given as
(29)
where is the piezoelectric constant, is the piezoelectric stress / charge constant,
is the strain produced and is the Young’s modulus. The total charge developed
on the sensor surface (due to the strain) is the spatial summation of all the point charges
developed on the sensor layer and is given by
(30)
Since the strain of the testing structure at a point can be expressed in terms of the
second spatial derivative of the displacement function as , where z is
a coordinate of the point on the beam with respect to the axis of the beam, Eq. (30) can
be written as
, (31)

16
where The output current of the piezo sensor measures the moment rate of
the flexible beam. This current is converted into the open circuit sensor voltage
using a signal conditioning device with gain which is then applied to an actuator
with a suitable controller gain. Thus, the sensor output voltage is obtained as
(32)
which is the signal conditioning gain multiplied by the closed circuit current
generated by the piezoelectric lamina. The sensor output voltage can further be written
for the beam elements as
(33)
3.2.3 Actuator equation
The actuator equation is derived from the converse piezoelectric equation as described in
[30]. The strain developed by the electric field on the actuator layer is given by
, (34)
where is the piezoelectric constant. When the input voltage is applied to the
piezoelectric actuator in the thickness direction , the electric field and the stress
developed by the actuator is given by
and , (35)
where, is the young’s modulus of the piezoelectric layer. Because of this stress in the
structure, bending moments act at nodes. In general, the expression for the bending
moment in a small cross section of the piezoelectric element is given by
(36)
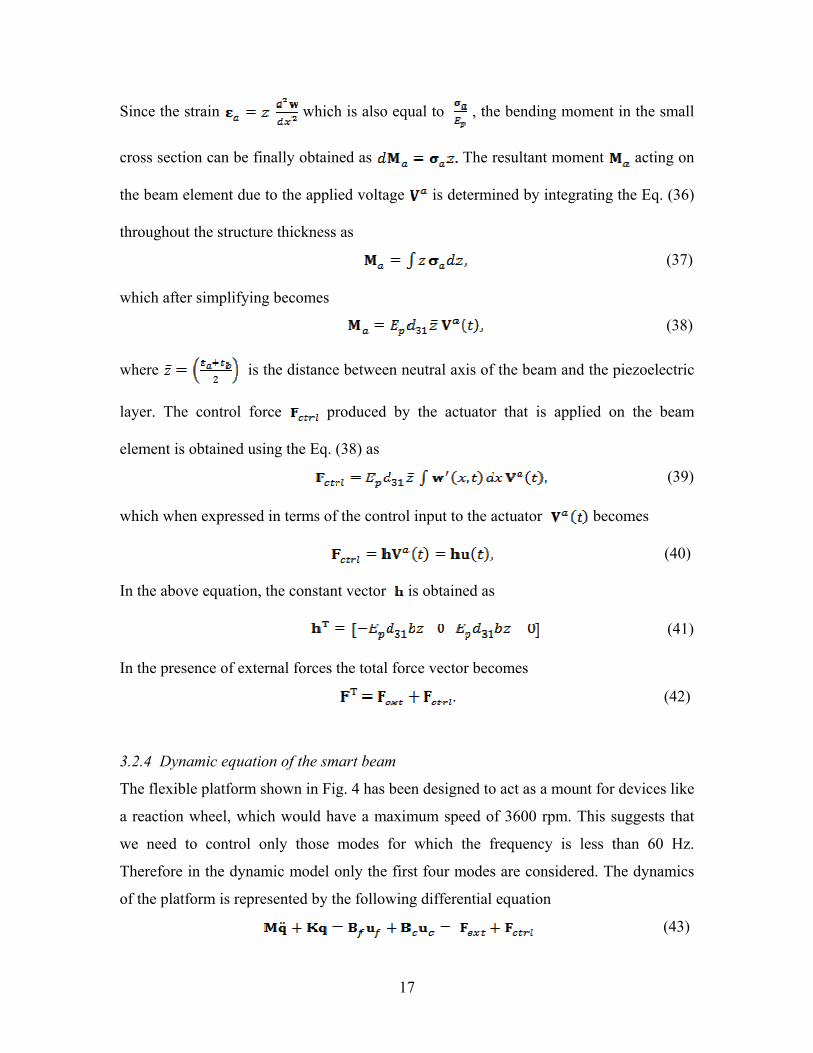
17
Since the strain which is also equal to , the bending moment in the small
cross section can be finally obtained as The resultant moment acting on
the beam element due to the applied voltage is determined by integrating the Eq. (36)
throughout the structure thickness as
(37)
which after simplifying becomes
(38)
where is the distance between neutral axis of the beam and the piezoelectric
layer. The control force produced by the actuator that is applied on the beam
element is obtained using the Eq. (38) as
(39)
which when expressed in terms of the control input to the actuator becomes
(40)
In the above equation, the constant vector is obtained as
(41)
In the presence of external forces the total force vector becomes
. (42)
3.2.4 Dynamic equation of the smart beam
The flexible platform shown in Fig. 4 has been designed to act as a mount for devices like
a reaction wheel, which would have a maximum speed of 3600 rpm. This suggests that
we need to control only those modes for which the frequency is less than 60 Hz.
Therefore in the dynamic model only the first four modes are considered. The dynamics
of the platform is represented by the following differential equation
(43)

18
where K and M are taken from Eqs. (23) and (28), respectively and for a system with
the size of the mass and stiffness matrices is . In Eq.
(43), is the nodal displacement vector, is the nodal acceleration vector,
is the s x1 input force vector, is the t x1 control force vector. The input force
matrix is and the control force matrix is . The modal form of Eq. (43)
is derived by using the transformation where and represent the modal
displacement and modal acceleration respectively. Therefore,
Φ (44)
Here, Φ is the modal matrix of size ( x 4) and consists of the eigenvectors
corresponding to the first four modes.
Pre-multiplying Eq. (44) by , we get
(45)
which can be written as
(46)
where and are the diagonalized mass and stiffness
matrices.
By introducing the modal damping matrix in the above Eq. (46), where
with and as nonnegative scalars, we get the dynamic equation of
smart flexible beam platform with four modes as
(47)
The state space model of the flexible platform of four folded beams with twelve inputs
and twelve outputs is given in state space form as
(48)
where, A and B are given by

19
(49)
(50)
and u is an input matrix. In Eq. (50), is a constant vector which depends on the type of
the actuator, its location on the beam, its characteristic properties and is given by
(51)
The output equation is
, (52)
where,
, (53)
and, is a constant vector which depends on sensor characteristics and its
location/position on the beam and is given as
(54)
4. Passive control simulation results
The equations developed in section 3.1, namely Eq. (14) were simulated using Matlab.
Results obtained are discussed next.
20
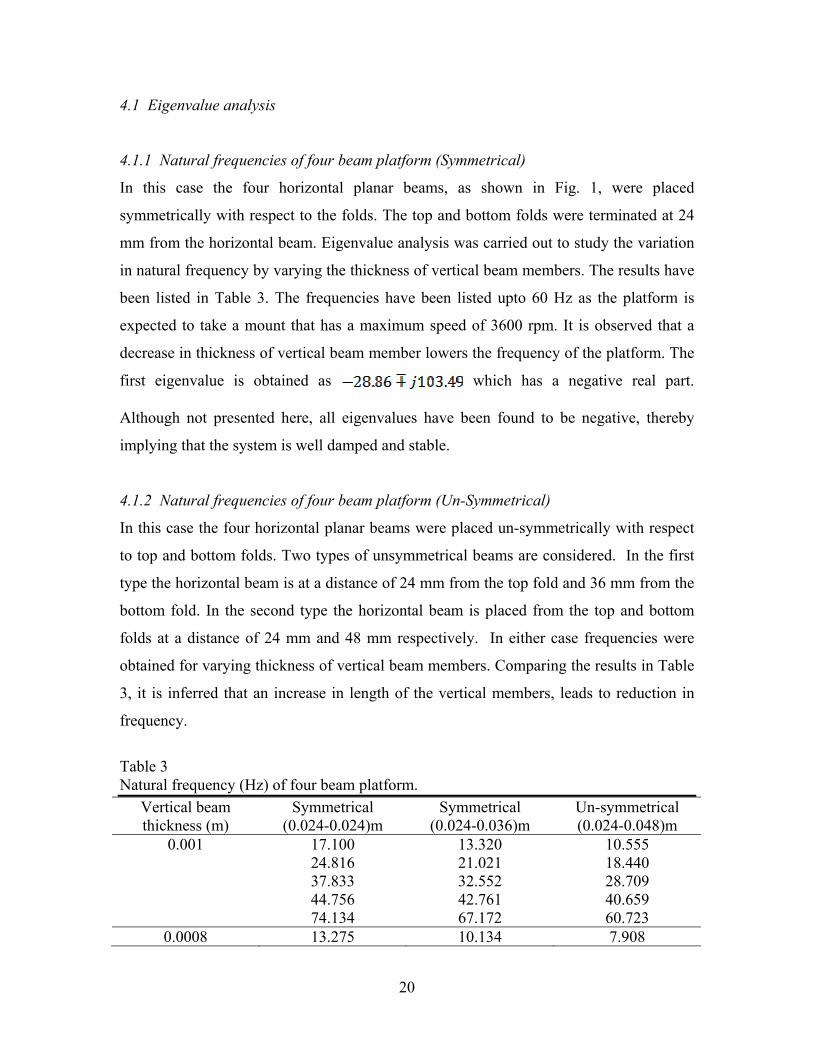
4.1 Eigenvalue analysis
4.1.1 Natural frequencies of four beam platform (Symmetrical)
In this case the four horizontal planar beams, as shown in Fig. 1, were placed
symmetrically with respect to the folds. The top and bottom folds were terminated at 24
mm from the horizontal beam. Eigenvalue analysis was carried out to study the variation
in natural frequency by varying the thickness of vertical beam members. The results have
been listed in Table 3. The frequencies have been listed upto 60 Hz as the platform is
expected to take a mount that has a maximum speed of 3600 rpm. It is observed that a
decrease in thickness of vertical beam member lowers the frequency of the platform. The
first eigenvalue is obtained as which has a negative real part.
Although not presented here, all eigenvalues have been found to be negative, thereby
implying that the system is well damped and stable.
4.1.2 Natural frequencies of four beam platform (Un-Symmetrical)
In this case the four horizontal planar beams were placed un-symmetrically with respect
to top and bottom folds. Two types of unsymmetrical beams are considered. In the first
type the horizontal beam is at a distance of 24 mm from the top fold and 36 mm from the
bottom fold. In the second type the horizontal beam is placed from the top and bottom
folds at a distance of 24 mm and 48 mm respectively. In either case frequencies were
obtained for varying thickness of vertical beam members. Comparing the results in Table
3, it is inferred that an increase in length of the vertical members, leads to reduction in
frequency.
Table 3 Natural frequency (Hz) of four beam platform.
Vertical beam thickness (m)
Symmetrical (0.024-0.024)m
Symmetrical (0.024-0.036)m
Un-symmetrical (0.024-0.048)m
0.001 17.100 24.816 37.833 44.756 74.134
13.320 21.021 32.552 42.761 67.172
10.555 18.440 28.709 40.659 60.723
0.0008 13.275 10.134 7.908
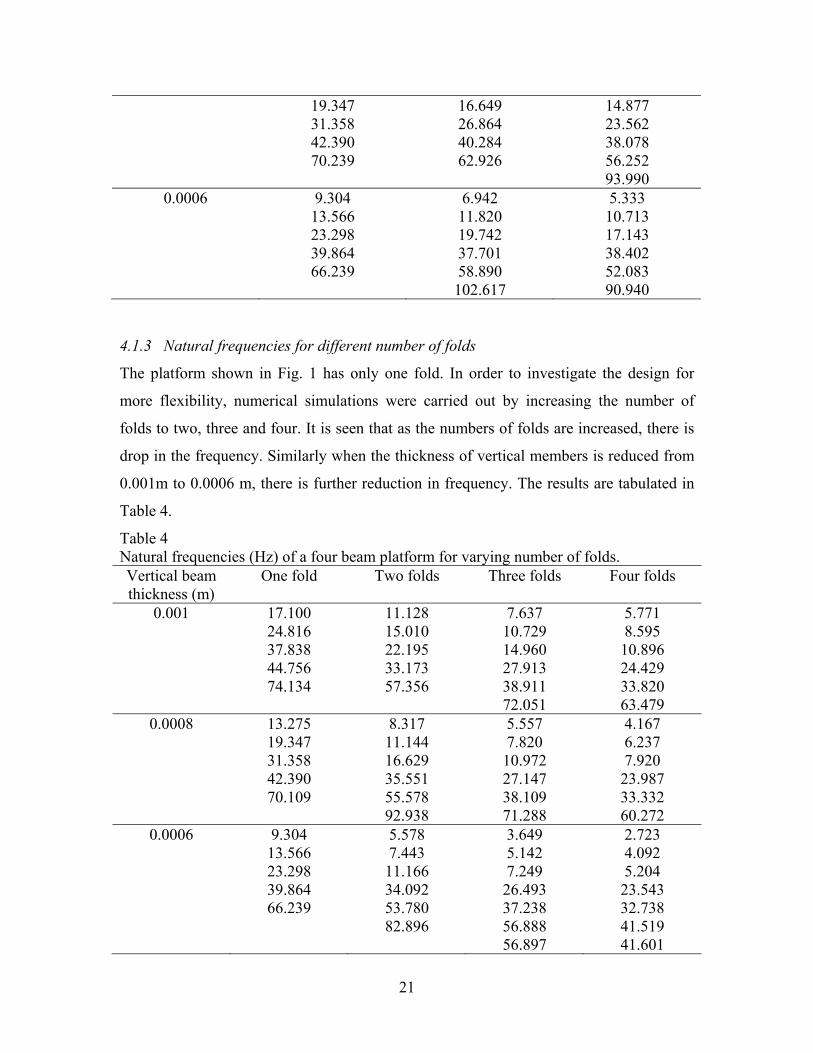
21
19.347 31.358 42.390 70.239
16.649 26.864 40.284 62.926
14.877 23.562 38.078 56.252 93.990
0.0006 9.304 13.566 23.298 39.864 66.239
6.942 11.820 19.742 37.701 58.890 102.617
5.333 10.713 17.143 38.402 52.083 90.940
4.1.3 Natural frequencies for different number of folds
The platform shown in Fig. 1 has only one fold. In order to investigate the design for
more flexibility, numerical simulations were carried out by increasing the number of
folds to two, three and four. It is seen that as the numbers of folds are increased, there is
drop in the frequency. Similarly when the thickness of vertical members is reduced from
0.001m to 0.0006 m, there is further reduction in frequency. The results are tabulated in
Table 4.
Table 4 Natural frequencies (Hz) of a four beam platform for varying number of folds. Vertical beam thickness (m)
One fold Two folds Three folds Four folds
0.001
17.100 24.816 37.838 44.756 74.134
11.128 15.010 22.195 33.173 57.356
7.637 10.729 14.960 27.913 38.911 72.051
5.771 8.595 10.896 24.429 33.820 63.479
0.0008 13.275 19.347 31.358 42.390 70.109
8.317 11.144 16.629 35.551 55.578 92.938
5.557 7.820 10.972 27.147 38.109 71.288
4.167 6.237 7.920 23.987 33.332 60.272
0.0006 9.304 13.566 23.298 39.864 66.239
5.578 7.443 11.166 34.092 53.780 82.896
3.649 5.142 7.249 26.493 37.238 56.888 56.897
2.723 4.092 5.204 23.543 32.738 41.519 41.601

22
68.288 52.930 53.314 58.111 59.361 60.473
Thus, low frequencies for the platform can be achieved by:
(i) Increasing the number of folds, (ii) Decreasing the thickness of vertical members, (iii) Placing the horizontal beams un-symmetrically with respect to the top and
bottom folds.
The flexible platform can therefore be used as a mounting device with an optimal set of
design parameters to meet the frequency specification in any given application.
4.2. Response Analysis
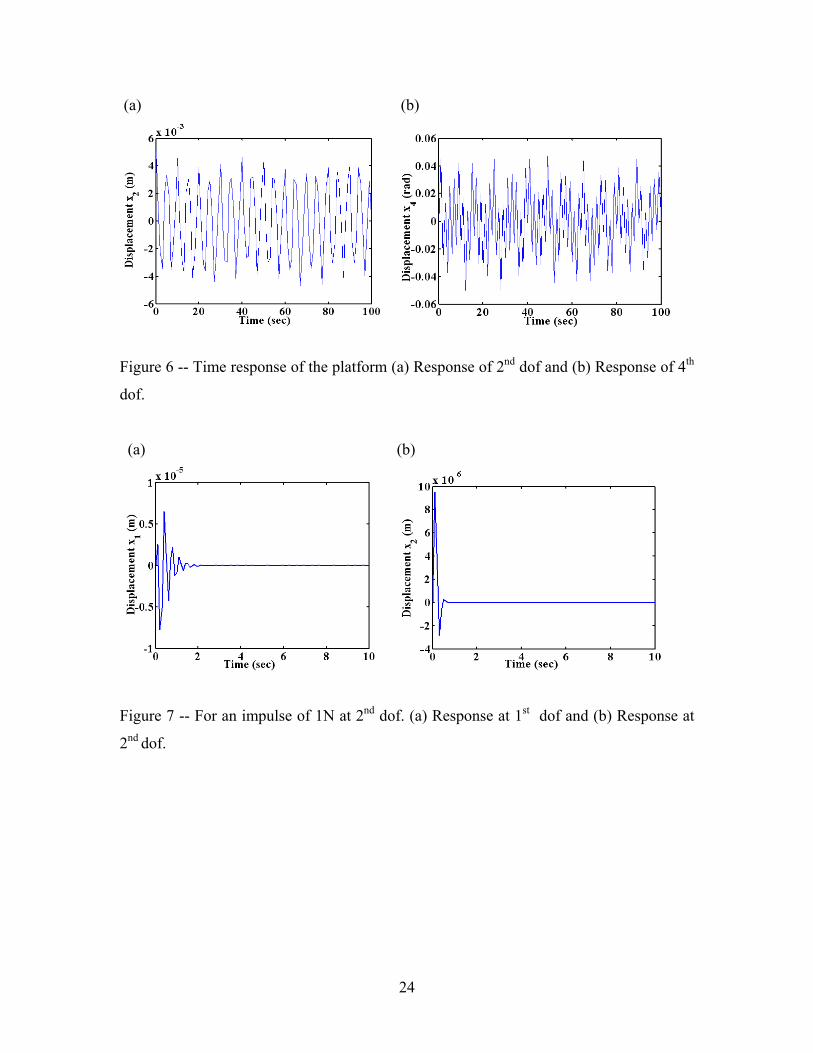
4.2.1. Free un-damped response analysis
Time responses were computed from Eq. (14) by assuming the initial condition vector as
x(0) = {0.002, 0.005, 0.002, 0, …}T. Results corresponding to 2nd and 4th degree of
freedom for the platform are shown in Fig. 6(a) and Fig. 6(b). It can be seen that the
largest amplitude response in either case is as high as ~ 4 x 10⁻³ m and ~ 4 x 10⁻² rad.
All other degrees of freedom have lower response.
4.2.2. Impulse response analysis
For an external impulse of 1 N at 2nd degree of freedom, the responses were calculated at
all nodes. It is observed that for all degrees of freedom of the platform the peak responses
are small and they damp out in a very short time. This behavior for the first two degrees
of freedom has been depicted in Fig. 7(a) and Fig. 7(b). Since the damping ratio ( ζ ) for a
metal structure generally lies between 0.01 and 0.05, in this simulation, we consider 1ς =
0.025 for the first mode. For the other modes damping ratio [26] is calculated using the
relation
23
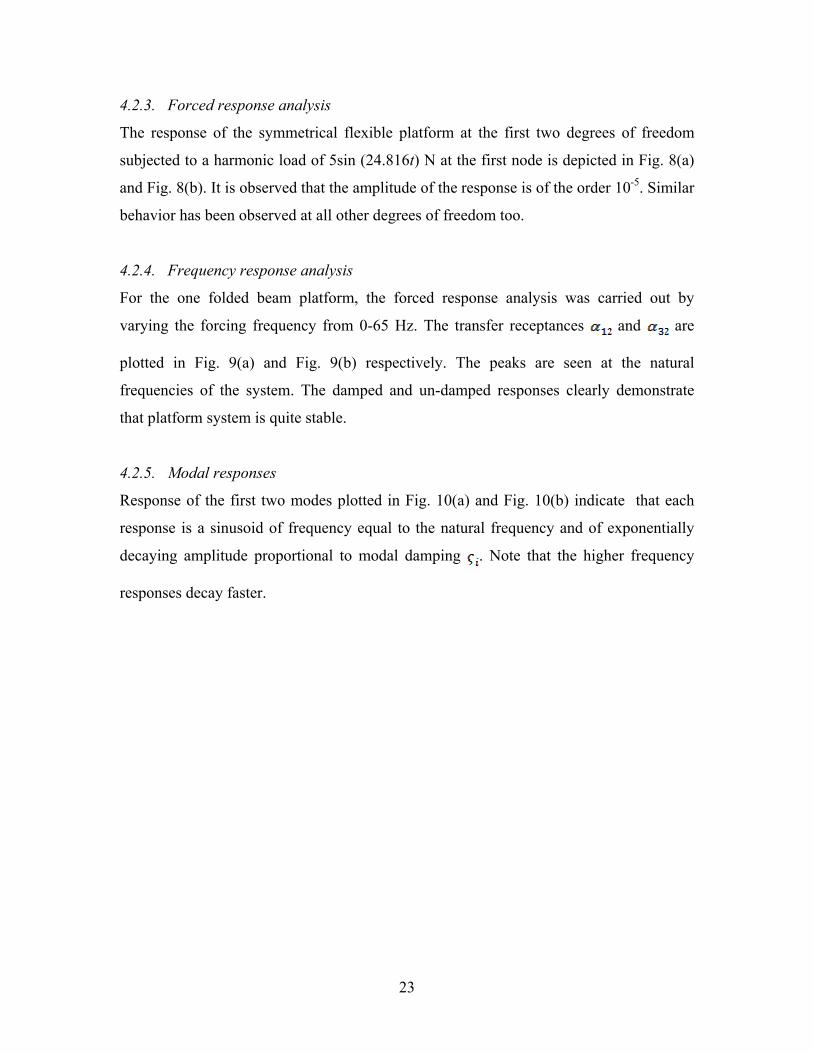
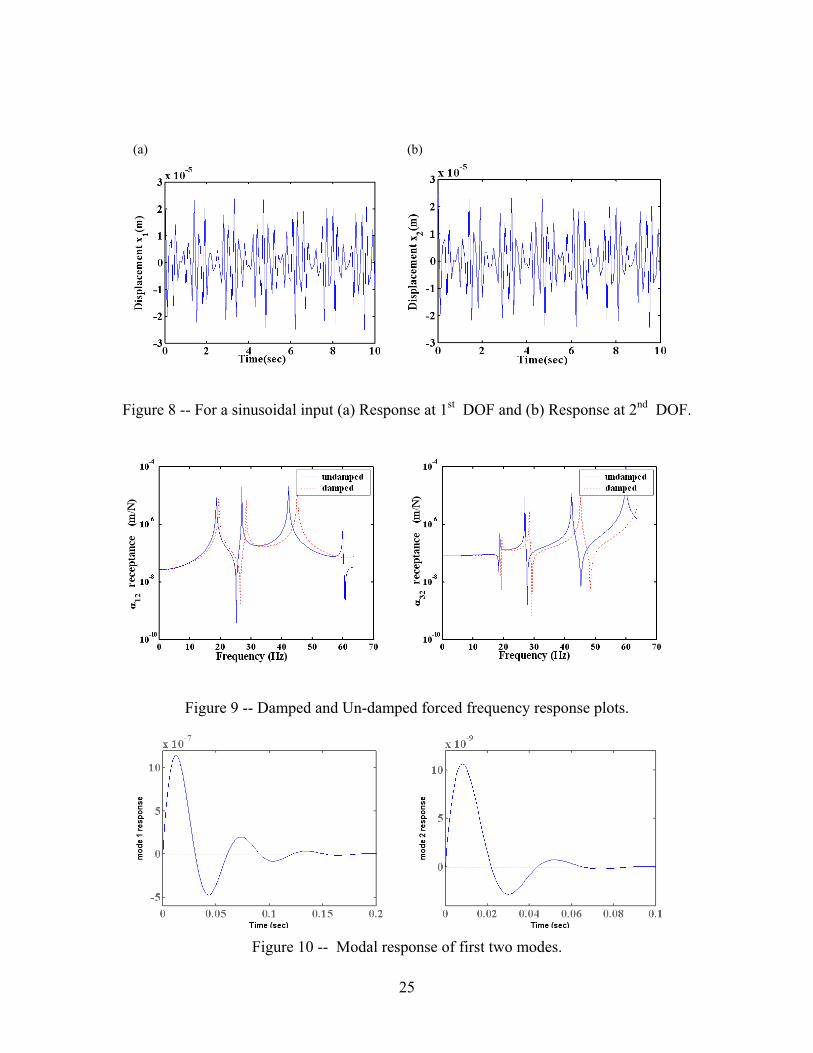
4.2.3. Forced response analysis
The response of the symmetrical flexible platform at the first two degrees of freedom
subjected to a harmonic load of 5sin (24.816t) N at the first node is depicted in Fig. 8(a)
and Fig. 8(b). It is observed that the amplitude of the response is of the order 10-5. Similar
behavior has been observed at all other degrees of freedom too.
4.2.4. Frequency response analysis
For the one folded beam platform, the forced response analysis was carried out by
varying the forcing frequency from 0-65 Hz. The transfer receptances and are
plotted in Fig. 9(a) and Fig. 9(b) respectively. The peaks are seen at the natural
frequencies of the system. The damped and un-damped responses clearly demonstrate
that platform system is quite stable.
4.2.5. Modal responses
Response of the first two modes plotted in Fig. 10(a) and Fig. 10(b) indicate that each
response is a sinusoid of frequency equal to the natural frequency and of exponentially
decaying amplitude proportional to modal damping . Note that the higher frequency
responses decay faster.
24
(a) (b)
Figure 6 -- Time response of the platform (a) Response of 2nd dof and (b) Response of 4th
dof.
(a) (b)
Figure 7 -- For an impulse of 1N at 2nd dof. (a) Response at 1st dof and (b) Response at
2nd dof.
25
(a) (b)
Figure 8 -- For a sinusoidal input (a) Response at 1st DOF and (b) Response at 2nd DOF.
Figure 9 -- Damped and Un-damped forced frequency response plots.
Figure 10 -- Modal response of first two modes.
26
4.3. Effectiveness Of the Platform Isolator
Platform isolation has been estimated for a typical symmetric flexible platform
comprising of three folded beams. For vertical beams with thickness equal to 0.8 mm and
a forcing frequency of 60 Hz, it is found that the ratio of forcing frequency to the first
natural frequency is 10.797 which amounts to an isolation of 99.0905 % .
5. Active control simulation results
Active vibration control of the flexible platform was studied using piezo-laminated beam
elements. Two PZT layers were bonded on either side of the vertical beams to act as a
sensor and actuator pair. Finite element formulation was done with the following
assumptions:
(i) Sensor-actuator patches are placed on either side of the most flexible part of the four
beams.
(ii) PZT sensor actuator patches are made of lead zirconate titanate material of 35µm
thickness.
(iii) Length of both the piezoelectric sensor and actuator patch is equal to the length of
one finite element.
(iv) Structural damping is proportional and is taken to be ;
where . These values are deliberately assumed to be very low in
order to study the effectiveness of active control on response.
Optimal control has been applied using the Linear Quadratic Regulator [23, 24]. The
optimal control problem consists of solving for the feedback gain matrix, G, such that the
performance matrix is minimal. The cost function to be minimized is given by
(55)
27
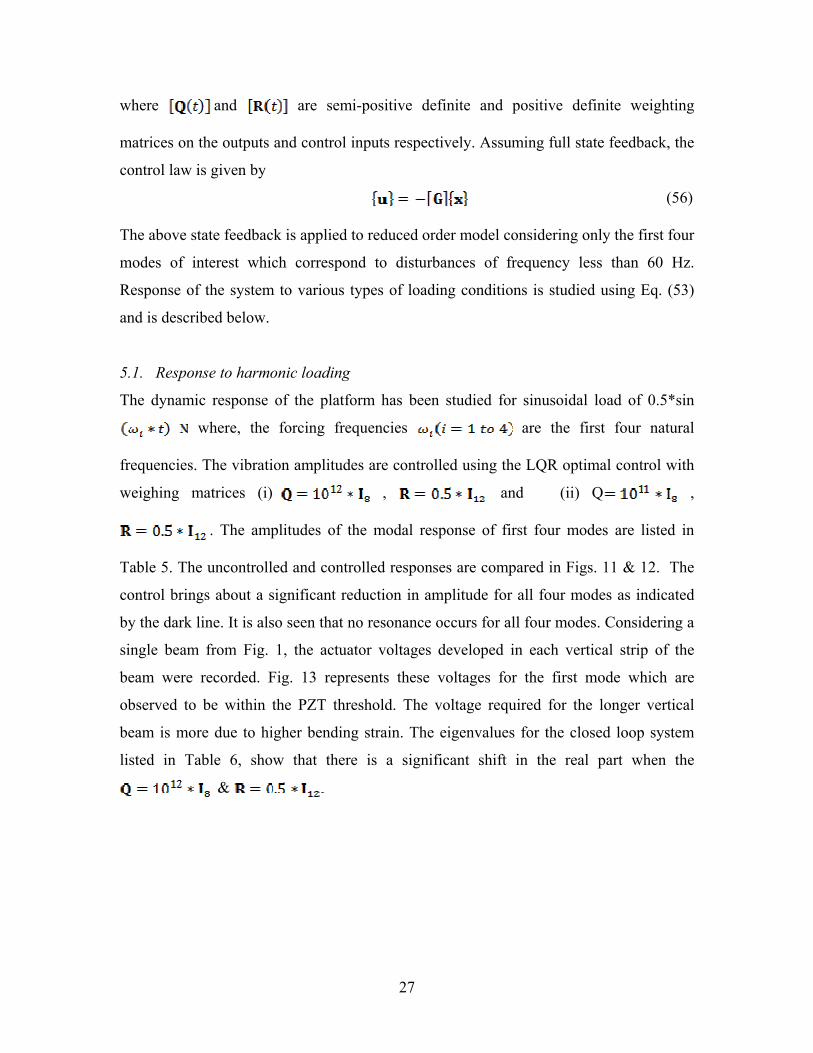
where and are semi-positive definite and positive definite weighting
matrices on the outputs and control inputs respectively. Assuming full state feedback, the
control law is given by
(56)
The above state feedback is applied to reduced order model considering only the first four
modes of interest which correspond to disturbances of frequency less than 60 Hz.
Response of the system to various types of loading conditions is studied using Eq. (53)
and is described below.
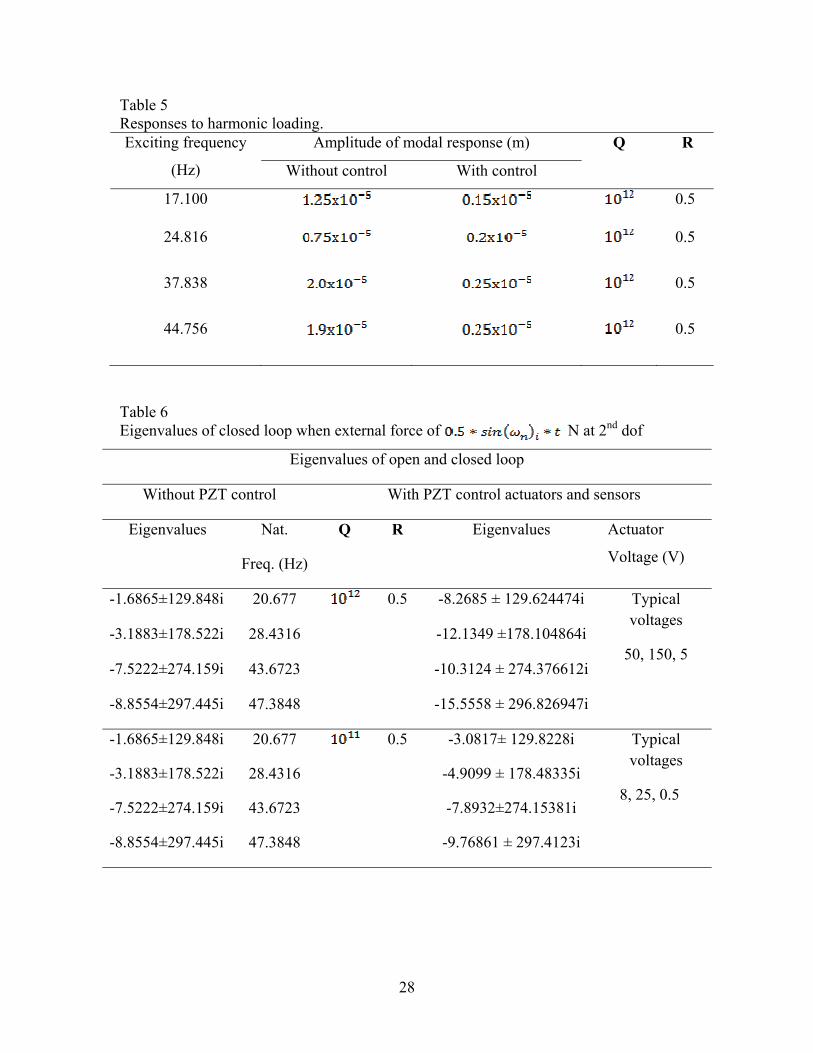
5.1. Response to harmonic loading
The dynamic response of the platform has been studied for sinusoidal load of 0.5*sin
where, the forcing frequencies are the first four natural
frequencies. The vibration amplitudes are controlled using the LQR optimal control with
weighing matrices (i) , and (ii) Q ,
. The amplitudes of the modal response of first four modes are listed in
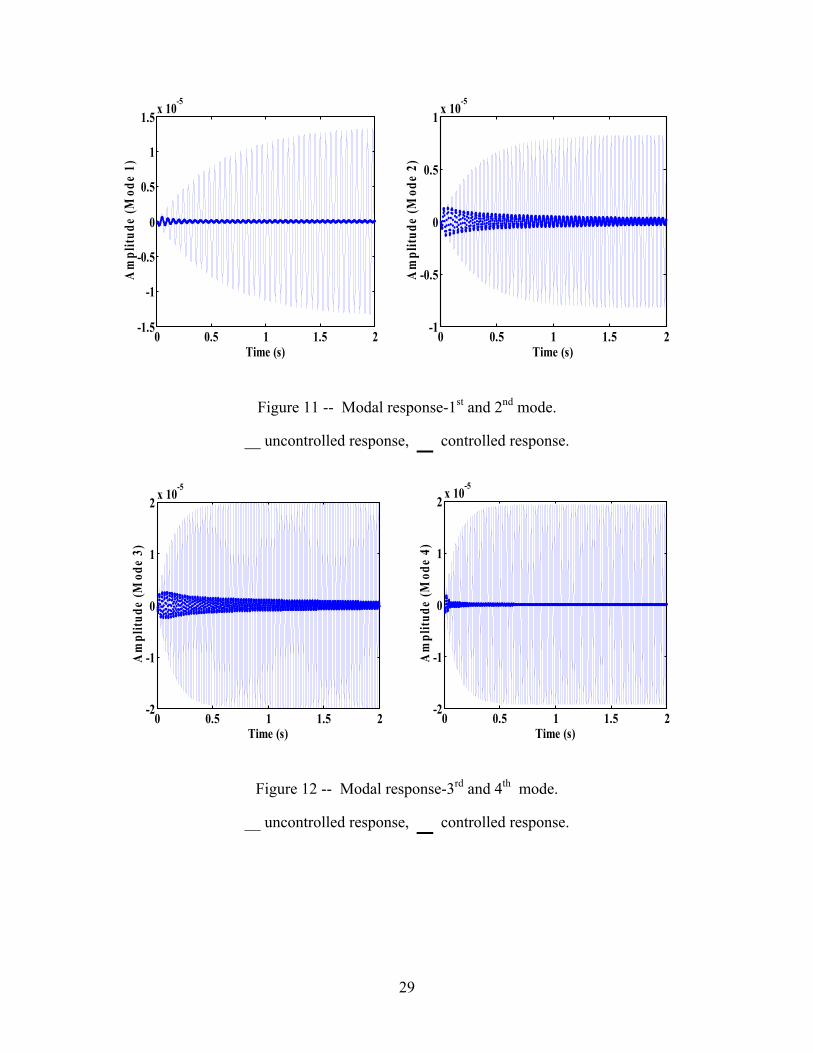
Table 5. The uncontrolled and controlled responses are compared in Figs. 11 & 12. The
control brings about a significant reduction in amplitude for all four modes as indicated
by the dark line. It is also seen that no resonance occurs for all four modes. Considering a
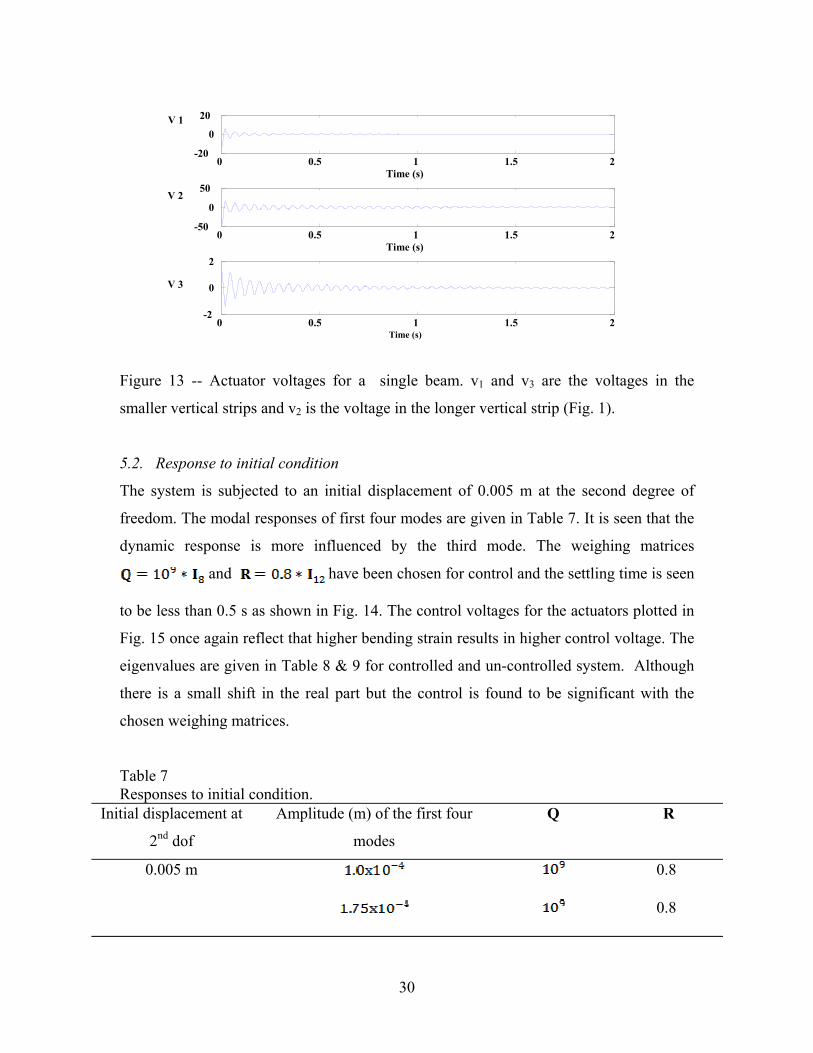
single beam from Fig. 1, the actuator voltages developed in each vertical strip of the
beam were recorded. Fig. 13 represents these voltages for the first mode which are
observed to be within the PZT threshold. The voltage required for the longer vertical
beam is more due to higher bending strain. The eigenvalues for the closed loop system
listed in Table 6, show that there is a significant shift in the real part when the
&
28
Table 5 Responses to harmonic loading. Exciting frequency
(Hz)
Amplitude of modal response (m) Q R
Without control With control
17.100
0.5
24.816
0.5
37.838
0.5
44.756
0.5
Table 6 Eigenvalues of closed loop when external force of N at 2nd dof
Eigenvalues of open and closed loop
Without PZT control With PZT control actuators and sensors
Eigenvalues Nat.
Freq. (Hz)
Q R Eigenvalues Actuator
Voltage (V)
-1.6865±129.848i 20.677 0.5 -8.2685 ± 129.624474i Typical voltages
50, 150, 5 -3.1883±178.522i 28.4316 -12.1349 ±178.104864i
-7.5222±274.159i 43.6723 -10.3124 ± 274.376612i
-8.8554±297.445i 47.3848 -15.5558 ± 296.826947i
-1.6865±129.848i 20.677
0.5 -3.0817± 129.8228i Typical voltages
8, 25, 0.5 -3.1883±178.522i 28.4316 -4.9099 ± 178.48335i
-7.5222±274.159i 43.6723 -7.8932±274.15381i
-8.8554±297.445i 47.3848 -9.76861 ± 297.4123i
29
0 0.5 1 1.5 2-1.5
-1
-0.5
0
0.5
1
1.5 x 10⁻⁵
Time (s)
Am
plitu
de (M
ode
1)
0 0.5 1 1.5 2-1
-0.5
0
0.5
1 x 10⁻⁵
Time (s)
Am
plitu
de (M
ode
2)
Figure 11 -- Modal response-1st and 2nd mode.
__ uncontrolled response, _ controlled response.
0 0.5 1 1.5 2-2
-1
0
1
2 x 10⁻⁵
Time (s)
Am
plitu
de (M
ode
3)
0 0.5 1 1.5 2-2
-1
0
1
2 x 10⁻⁵
Time (s)
Am
plitu
de (M
ode
4)
Figure 12 -- Modal response-3rd and 4th mode.
__ uncontrolled response, _ controlled response.
30
Figure 13 -- Actuator voltages for a single beam. v1 and v3 are the voltages in the
smaller vertical strips and v2 is the voltage in the longer vertical strip (Fig. 1).
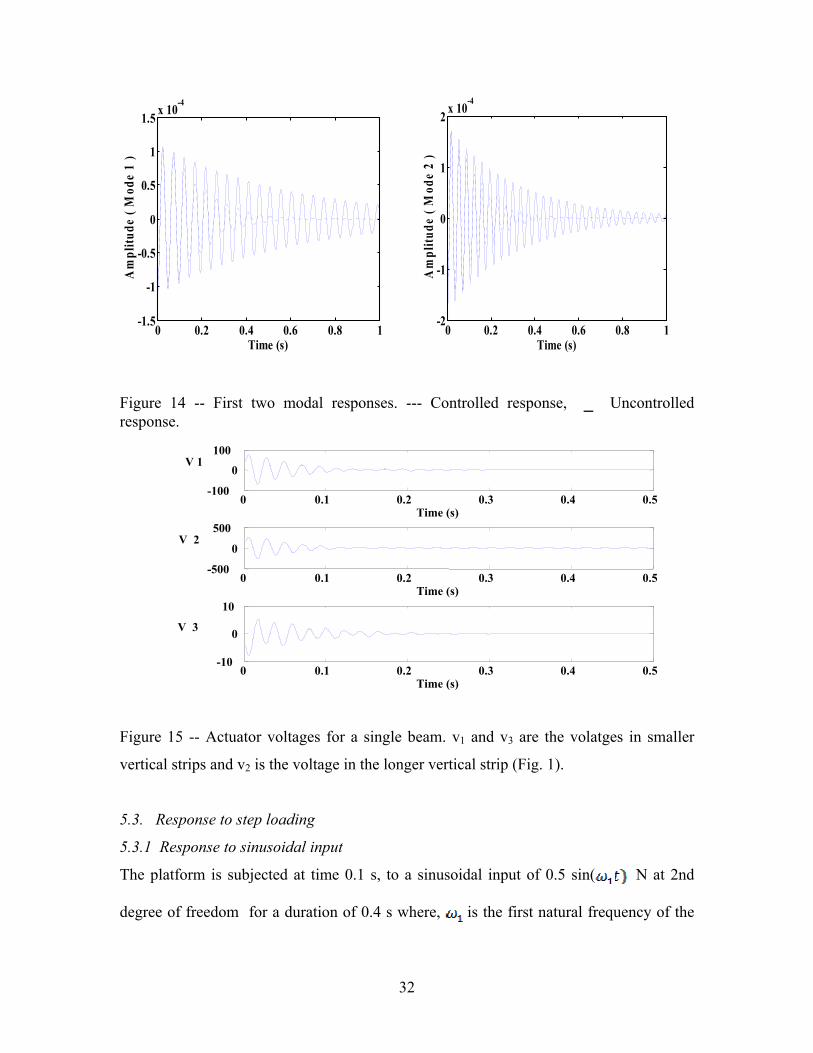
5.2. Response to initial condition
The system is subjected to an initial displacement of 0.005 m at the second degree of
freedom. The modal responses of first four modes are given in Table 7. It is seen that the
dynamic response is more influenced by the third mode. The weighing matrices
and have been chosen for control and the settling time is seen
to be less than 0.5 s as shown in Fig. 14. The control voltages for the actuators plotted in
Fig. 15 once again reflect that higher bending strain results in higher control voltage. The
eigenvalues are given in Table 8 & 9 for controlled and un-controlled system. Although
there is a small shift in the real part but the control is found to be significant with the
chosen weighing matrices.
Table 7 Responses to initial condition.
Initial displacement at
2nd dof
Amplitude (m) of the first four
modes
Q R
0.005 m 0.8
0.8
0 0.5 1 1.5 2 -20 0
20
Time (s)
V 1
0 0.5 1 1.5 2 -50 0
50
Time (s)
V 2
0 0.5 1 1.5 2 -2
0
2
Time (s)
V 3
31
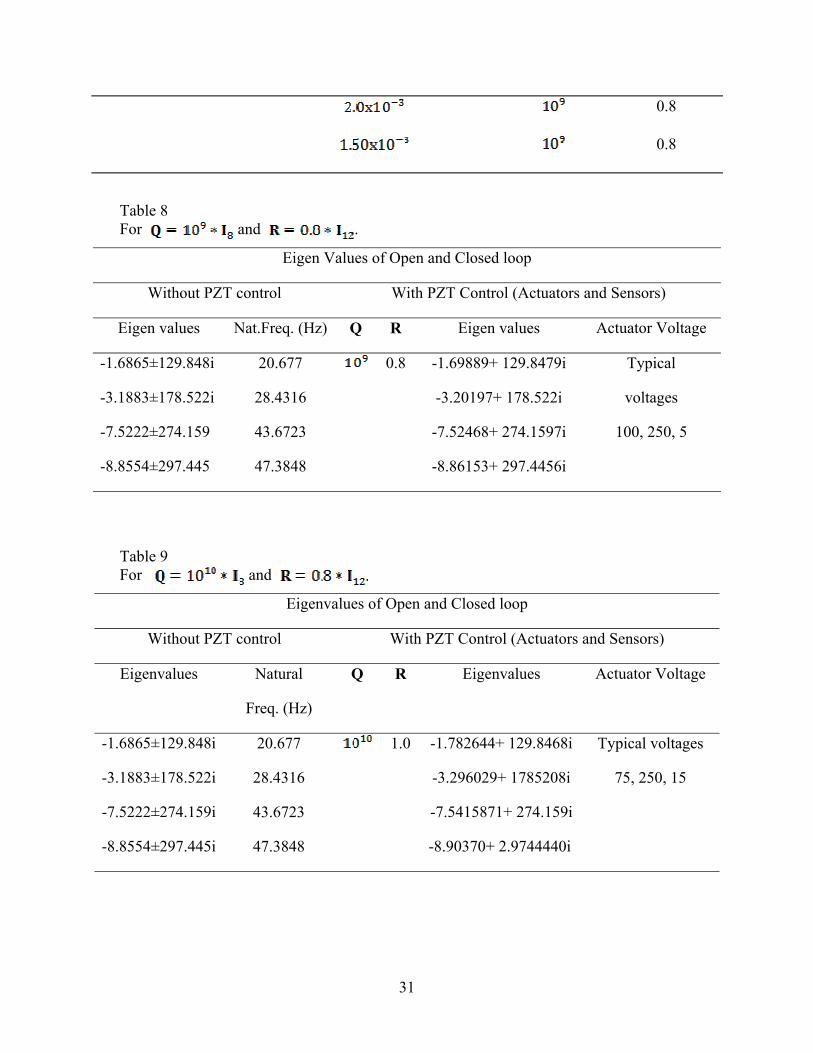
0.8
0.8
Table 8 For and .
Eigen Values of Open and Closed loop
Without PZT control With PZT Control (Actuators and Sensors)
Eigen values Nat.Freq. (Hz) Q R Eigen values Actuator Voltage
-1.6865±129.848i 20.677 0.8 -1.69889+ 129.8479i Typical
voltages
100, 250, 5
-3.1883±178.522i 28.4316 -3.20197+ 178.522i
-7.5222±274.159 43.6723 -7.52468+ 274.1597i
-8.8554±297.445 47.3848 -8.86153+ 297.4456i
Table 9 For and
Eigenvalues of Open and Closed loop
Without PZT control With PZT Control (Actuators and Sensors)
Eigenvalues Natural
Freq. (Hz)
Q
R Eigenvalues Actuator Voltage
-1.6865±129.848i 20.677
1.0
-1.782644+ 129.8468i Typical voltages
75, 250, 15 -3.1883±178.522i 28.4316 -3.296029+ 1785208i
-7.5222±274.159i 43.6723 -7.5415871+ 274.159i
-8.8554±297.445i 47.3848 -8.90370+ 2.9744440i
32
0 0.2 0.4 0.6 0.8 1-1.5
-1
-0.5
0
0.5
1
1.5 x 10⁻⁴
Time (s)
Am
plitu
de (
Mod
e 1
)
0 0.2 0.4 0.6 0.8 1
-2
-1
0
1
2 x 10⁻⁴
Time (s)
Am
plitu
de (
Mod
e 2
)
Figure 14 -- First two modal responses. --- Controlled response, _ Uncontrolled response.
Figure 15 -- Actuator voltages for a single beam. v1 and v3 are the volatges in smaller
vertical strips and v2 is the voltage in the longer vertical strip (Fig. 1).
5.3. Response to step loading
5.3.1 Response to sinusoidal input
The platform is subjected at time 0.1 s, to a sinusoidal input of 0.5 sin( N at 2nd
degree of freedom for a duration of 0.4 s where, is the first natural frequency of the
0 0.1 0.2 0.3 0.4 0.5-100
0 100
Time (s)
V 1
0 0.1 0.2 0.3 0.4 0.5-500
0 500
Time (s)
V 2
0 0.1 0.2 0.3 0.4 0.5-10
0
10
Time (s)
V 3
33
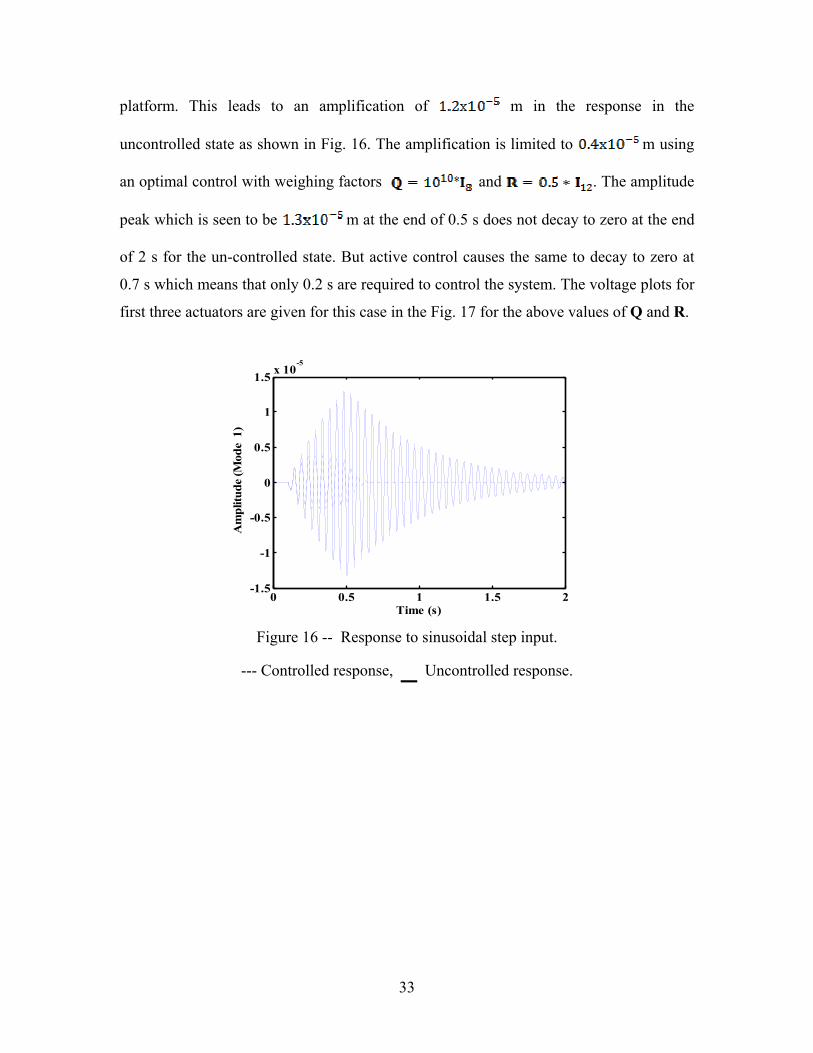
platform. This leads to an amplification of m in the response in the
uncontrolled state as shown in Fig. 16. The amplification is limited to m using
an optimal control with weighing factors and . The amplitude
peak which is seen to be m at the end of 0.5 s does not decay to zero at the end
of 2 s for the un-controlled state. But active control causes the same to decay to zero at
0.7 s which means that only 0.2 s are required to control the system. The voltage plots for
first three actuators are given for this case in the Fig. 17 for the above values of Q and R.
0 0.5 1 1.5 2
-1.5
-1
-0.5
0
0.5
1
1.5 x 10⁻⁵
Time (s)
Am
plitu
de (M
ode
1)
Figure 16 -- Response to sinusoidal step input.
--- Controlled response, _ Uncontrolled response.

34
Figure 17 -- Actuator voltages for sinusoidal input for a single beam. v1 and v3 are the
volatges in smaller vertical strips and v2 is the voltage in the longer vertical strip (Fig. 1).
5.3.2. Response to pulse loading
The uncontrolled and controlled modal response of the flexible platform for a pulse load
of 2 N applied at 2nd degree of freedom for a duration of 0.4 s is simulated. The modal
response contribution for this input is plotted only for the first mode and it is given in Fig.
18. It can be noted that the controlled responses are of low magnitude and the decay is
very fast. When the load is taken off, the system tends to go the equilibrium and thus
oscillates. It is again controlled within 0.2 s. The LQR weighing factors are chosen as
and . The response peak is seen to be m at the end
of 0.5 s and the controlled plot peak is m. The decay is happening within 0.3 s for
the first modal response contribution. The uncontrolled vibration lasts over 2 s. The
voltage plots for first three actuators are given for this case in the Fig. 19. The voltage
again indicates that the middle vertical beam experiences higher bending strain thus
producing higher control voltage.
0 0.5 1 1.5 2 -2
0 2
Time (s)
V 1
0 0.5 1 1.5 2 -5
0 5
Time (s)
V 2
0 0.5 1 1.5 2 -0.2
0
0.2
Time (s)
V 3

35
0 0.2 0.4 0.6 0.8 1-3
-2
-1
0
1
2 x 10⁻⁶
Time (s)
Am
plitu
de (M
ode
1)
Figure 18 -- Modal response for pulse loading.
--- Controlled response, _ Uncontrolled response.
Figure 19 -- Actuator voltages for pulse input for a single beam. v1 and v3 are the volatges
in smaller vertical strips and v2 is the voltage in the longer vertical strip (Fig. 1).
6. Conclusion
This paper addresses the design, modeling and analysis of low frequency space frame
platform for passive and active attenuation of low amplitude vibrations. Finite element
analysis of the proposed platform suggests that low frequencies can be achieved by
increasing the flexibility of the platform which can be done either by decreasing the
vertical beam thickness or by increasing the length of the flexible vertical beam or both.
0 0.2 0.4 0.6 0.8 1 -5
0 5
Time (s)
V 1
0 0.2 0.4 0.6 0.8 1 -10
0 10
Time (s)
V 2
0 0.2 0.4 0.6 0.8 1 -0.5
0
0.5
Time (s)
V 3
36
An increase in the number of folds also leads to low frequencies. Numerical simulations
confirm that vibration isolation of disturbances on-board spacecraft could be achieved
passively through this kind of platform. Active vibration control of the device, using
sensors and actuators embedded as collocated pair on flexible arms, has been studied
using the optimal control technique. Numerical results show that although the flexible
folded beam platform is able to passively suppress the vibration for space usage, it could
also be equipped with piezo-ceramic actuators and sensors to actively cut down further
vibrations. Suppression of vibration has been demonstrated for harmonic loading, pulse
loading and initial displacement loading conditions. In all such cases the first few modes
of vibration have been effectively controlled. Therefore, we conclude that this platform
configured with flexible beam structure can be used as a platform for mounting the
payload where source generated vibration have to be insulated to reach out to critical
location /areas of structure.
References
[1] Richard G. Cobb, Jeanne M. Sullivan, Alok Das, L. Porter Davis, T. Tupper Hyde,
Torey Davis, Zahidul H. Rahman and John T. Spanos, Vibration isolation and
suppression system for precision payloads in space, Smart Materials and Structure, 8,
(1999), 798-812.
[2] Porter L. Davis, Delano R. Carter, Tristrem T. Hyde, Second gereration hybrid D-
Strut, Proc. SPIE, Vol. 2445, (1994), pp. 161-175.
[3] Joseph R. Maly, Scott C. Pendleton, J. Salmanoff, Garcia J. Blount, Kevin Mathews,
Hubble Space Telescope Solar Array Damper, Proc. SPIE, Vol. 3672, (1999) pp. 186-
197.
[4] J. J. Rodden, H.J. Dougherty, L.F. Reschke, M.D. Hasha and L.P. Davis, Line-of-
Sight Performance Improvement with Reaction-Wheel Isolation, AAS Paper 86-005,
Proceedings of the Annual Rocky mountain Guidance and Control conference, Keystone,
CO, Feb 1-5, 1986.
[5] D. Cunningham, P. Davis and F. Schmitt, A Multi-Axis Isolation System for the
French Earth Observation Satellite’s Magnetic Bearing Reaction Wheel, Paper presented

37
at the DPA/AIAA/ASME/SPIE Conference on Active Materials and Adaptive Structures,
1996.
[6] F. Dekens, and G. Neat, Micro-Precision Interferometer: Pointing System
Performance in On-Orbit Disturbance Environment, Proceedings of the 1999, SPIE
Smart Materials and Structures Conference, Vol. 3668, pp. 426-439.
[7] C. R. Fuller, S.J. Elliott and P.A. Nelson, Active Control of Vibration, Academic
Press, 1996.
[8] Denys J. Mead, Passive Vibration Control, John Wiley and Sons, 1998.
[9] L. Porter Davis, J.F. Wilson, and R.E. Jewell, Hubble Space Telescope Reaction
Wheel Assembly Vibration Isolation System, Presented at NASA Marshall Space Flight
Center, Huntsville, Alabama, 1986.
[10] L. Porter Davis, Delano R. Carter and T. Tupper Hyde, Second Generation Hybrid
D-Strut™, Presented at the SPIE Smart Structures and Materials Conference, San Diego,
CA, 1995.
[11] E.H. Anderson, J.P. Fumo, R.S. Erwin, Satellite ultraquiet isolation technology
experiment (SUITE), Aerospace Conference Proceedings, IEEE (2000) 299-313.
[12] L. Porter Davis, Dave Cunningham and John Harrell, Advanced 1.5 Hz Passive
Viscous Isolation System, 35 AIAA SDM Conference, South Carolina, 1994.
[13] Y. C. Yiu, Regelbrugge Marc E., Shape–Memory alloy isolators for vibration
suppression in space application, AIAA-95-1120-CP, (1995) 3390-3398.
[14] Mayes J. John, C. Lagoudas Dimitris and Henderson B. Kyle, An experimental
investigation of shape memory alloy springs for passive vibration isolation, AIAA-2001-
4569, pp. 321-327.
[15] Eugene I. Rivin, Passive Vibration Isolation, ASME Press, 2003.
[16] C. E. Kaplow, J. R. Velman, Active Local Vibration Isolation Applied to a Flexible
Space Telescope, J. Guidance and Control, 3 (1980) 227-233.
[17] Ir. A. Abu Hanieh, and A. Preumont, Piezoelectric Stewart Platform for General
Purpose Active Damping Interface and Precision Control, Proc.9th European Space
Mechanisms & Tribology Symposium, Liege, ESA SP-480, (2001) 331-334.

38
[18] A. Preumont, M. Horodinca, I. Romanescu, B.de Marneffe, M. Avraam, A.
Deraemaeker, F. Bossens, and A. Abu Hanieh, A six-axis single stage active vibration
isolator based on Stewart platform, Journal of Sound and Vibration, (2007) 644-661.
[19] Nader Jalili and David W Knowles IV, Structural vibration control using an active
resonator absorber: Modelling and Control implementation, Smart Materials and
structures 13 (2004) 998-1005.
[20] L. Vaillon and C. Philippe, Passive and active vibration microvibration control for
very high pointing accuracy space system, Smart Materials and Structure, 8 (1999) 719-
728.
[21] Edward F. Crawley and Javier de Luis, Use of piezoelectric actuators as elements of
intelligent structures, AIAA Journal, 25 (1987) 1373-1385.
[22] Thomas Bailey and James E. Hubbard Jr., Distributed piezoelectric polymer active
vibration control of a cantilever beam, Journal of Guidance, Dynamics and Control, 8
(5) (1985) 605-611.
[23] S. Hanagud, M.W. Obal, and A.J. Callise, Optimal vibration control by the use of
piezosensors and actuators, Journal of Guidance, Control, and Dynamics, 15 (5) (1992)
1199-1206.
[24] S. Narayanan and V. Balamurugan, Finite element modelling of piezolaminated
smart structures for active vibration control with distributed sensors and actuators,
Journal of Sound and Vibration, 262 (2003) 529-562.
[25] CARTOSAT-2 project, Preliminary design review document on IRU and high
torque reaction wheel, ISRO IISU (125) 2002.
[26] Stephen J. Chapma, Matlab Programming for Engineers, Second Edition, Thomson
Books Cole, 2004.
[27] William Weaver, Jr,, Paul R. Johnston, Structural Dynamics by Finite elements,
Prentice Hall, Inc., Eaglewood Cliffs, New Jersey, 1987.
[28] Andre Preumont, Vibration Control of Active Structures, An Introduction, 2nd
Edition, Kluwer Academic Publishers, 2002.
[29] George A Lesieutre, Usik Lee, A finite element for beams having segmented active
constrained layers with frequency-dependent viscoelastic material properties, SPIE 3045,
pp. 315-328.

39
[30] T. C. Manjunath, B. Bandyopadhyay, Control of Vibration in Flexible Smart
Structures using Fast Output Sampling Feedback Technique, International Journal of
Computational Intelligence, 3 (1) (2006) 1304-2386.