Embed Size (px)
Citation preview
Modelling an Untended Scottish Forest Ecosystem Utilising Standard and Customised Software
S.J.J. Walkera, R. Watlingb, H.J. Stainesa, A.Garsidea, D. Knottb, J.W. Palfreymana and V. Krivtsova
a SIMBIOS, Schools of Science & Engineering and Computing, University of Abertay Dundee, Bell Street,
Dundee DD1 1HG, Scotland, UK ([email protected]) b Royal Botanic Garden Edinburgh (RBGE), Edinburgh, Scotland, UK
Abstract: The Heron Wood Reserve in Peeblesshire, Scotland is a 7.5-hectare wood, left untended to facilitate investigation into a natural Scottish Forest Ecosystem. Data on fungal fruiting have been collected since 1994, and since November 2000 physico-chemical and biotic experiments on soil and forest litter have also been conducted with the aim to construct and integrate a number of simulation sub-models of the various ecological systems present in an untended Scottish woodland. Important systems for modelling include patterns of fungal succession, habitat characteristics and fungal biochemical patterns. For example, Glomalin, a protein secreted by arbuscular mycorrhizal fungi, is believed to bind soil particles together in stable structures called aggregates. During the last 40 years, nearly one third of the world's arable land was lost by erosion, with a current loss rate of more than 10 million hectares per year [Pimentel et al. 1995, Science, 267, 1117-1123]. Modelling this system facilitates the understanding of a paramount component of soil ecology. A large volume of data has been collected so computer software is used for the storage and handling of data. Microsoft Access is the database used for storage, Microsoft Excel is the spreadsheet used for various calculations and customised software written in Microsoft Visual Basic and Microsoft VBA allows commercially unavailable statistical tests to be carried out, and the quick display of data in a suitable manner. Model Maker software is used to construct and test models formulated from the data and ultimately to facilitate the running of various simulations to make predictions within these important ecological sub-systems. Keywords: Forest Ecosystem; Heron Wood Reserve; Customised software; Scheffé test; Database. 1. INTRODUCTION Half of Britain’s forest and woodland area is located in Scotland with forest and woodland covering an area of 1.2 million hectares - 15% of Scotland’s land area, three times that of 1924. Over 17,000 hectares of land are planted with trees every year to replace those felled and to establish new forests, while employment in the forestry and primary wood processing sectors exceeds ten thousand. Around 40% of Scotland’s forests are managed for recreation and include important conservation habitats such as the Caledonian Forest Reserves [Forestry Commission, statistics published on the internet]. Modelling key ecosystem dynamics within an untended Scottish forest may improve management, forecasting, sustainability and conservation of Scotland’s forests. To obtain suitable and substantial data required for such a model, a number of dynamic systems are under investigation. These include bacteria and fungal dynamics, decomposition of plant material, abiotic factors such as pH and soil composition, fungal fruiting and local weather conditions. Many areas
under investigation are beneficial in their own right. For example, Glomalin is a protein secreted by arbuscular mycorrhizal fungi and is believed to contribute to stable soil structures, paramount in agriculture [USDA Agriculture Research published on the internet]. Increasing our knowledge of Glomalin’s dynamics in the environment is valuable in the research to minimise soil erosion. Fungi are very important in ecosystem functioning [Frankland et al, 1996], yet are not given enough consideration in many investigations. In temperate lands, pollution and changes in forest management are leading to a decline in the numbers of many fungi [Arnolds, 1991]. The present investigation may indicate alternative management practices to reduce this decline. Standard techniques used to analyse samples have been adapted and may be beneficial in future forest ecosystem studies. Conclusions drawn from this investigation may also assist in educating the public about their local environment. Computer software has been utilised to integrate the information obtained throughout this research,
473
from data storage, calculations for different dynamic systems, displaying of data, statistical calculation and ultimately constructing simulation models. This may all be adapted for modelling other temperate forests. 2. THE HERON WOOD RESERVE The Heron Wood Reserve was established in 1994 in Peeblesshire, Scotland. Eight biodiversity plots were assembled and left unmanaged to provide a natural environment. The plots are dominated by different vegetation, including Beech, Birch and grassland. This and the previous research have been carried out to determine if ecosystem dynamics within the different plots vary due to their dominant vegetation, and how these sub-systems may be integrated [Bezginova et al., 2001; Krivtsov et al., 2001, 2002]. 3. SYSTEMS UNDER INVESTIGATION A program to observe and record fungal fruiting bodies was established in 1994. Soil and litter samples have been collected on a monthly basis since December 2000 allowing more substantial physico-chemical testing to be carried out on the area, including: • Estimation of total microbial biomass through
differences in Abs 280nm levels between fumigated and control samples.
• Estimation of fungal biomass utilising the biomarkers Glomalin and Ergosterol.
• Estimation of bacteria numbers. • pH of soil. • Soil and surface litter composition. • Leaf decomposition (using mesh bags). • Patterns of fungal succession from sporome
observations.
Among the systems under investigation is estimation of fungal biomass utilising the fungal biomarkers, Ergosterol and Glomalin. By modelling the Glomalin subsystem, it may be possible to predict the extent of soil aggregation in different forests based on their tree and under story composition. 4. OBJECTIVES
The main objectives of this investigation are: • To observe, collect and quantify data from the
forest ecosystem.
• To utilise customised software to observe quantifiable interactions.
• To construct a dynamic simulation model able to represent various aspects of the ecosystem.
To create such a model, various statistical tests must be carried out and patterns of data displayed which the software enables. 5. APPLICATION OF COMPUTER
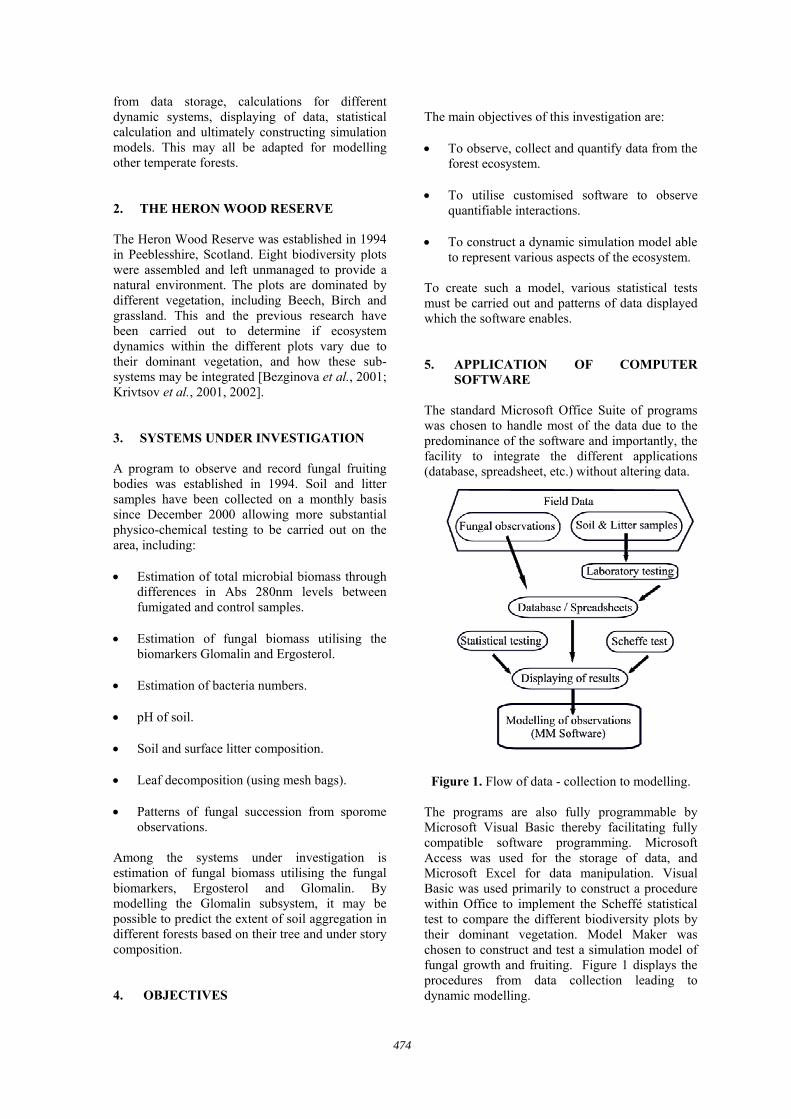
SOFTWARE The standard Microsoft Office Suite of programs was chosen to handle most of the data due to the predominance of the software and importantly, the facility to integrate the different applications (database, spreadsheet, etc.) without altering data.
Figure 1. Flow of data - collection to modelling.
The programs are also fully programmable by Microsoft Visual Basic thereby facilitating fully compatible software programming. Microsoft Access was used for the storage of data, and Microsoft Excel for data manipulation. Visual Basic was used primarily to construct a procedure within Office to implement the Scheffé statistical test to compare the different biodiversity plots by their dominant vegetation. Model Maker was chosen to construct and test a simulation model of fungal growth and fruiting. Figure 1 displays the procedures from data collection leading to dynamic modelling.
474
Computer software facilitates the storage and handling of such a large volume of data. A separate database stores data on fungal fruiting while spreadsheets and a database are used for the storage and calculation of data from laboratory experiments. To analyse the data, customised software was programmed in Microsoft Visual Basic 6.0. The software facilitated the extraction of necessary data stored in Access and controlled the algorithm used in Excel for its analysis. The software was written as a stand-alone program and as Visual Basic for Applications Macros. This enables the user to carry out analysis on different formats of data and on different computers. The program is easily expandable should future avenues of investigation be explored. 6. DATABASE OF OBSERVED FUNGAL
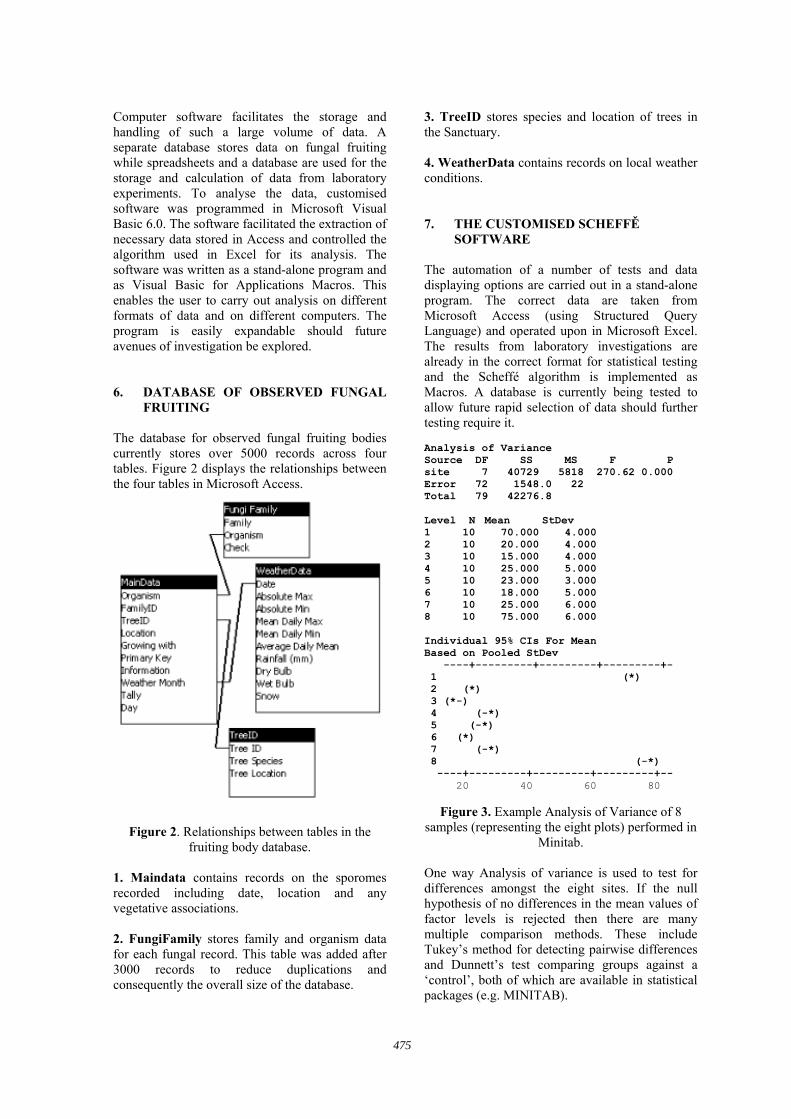
FRUITING The database for observed fungal fruiting bodies currently stores over 5000 records across four tables. Figure 2 displays the relationships between the four tables in Microsoft Access.
Figure 2. Relationships between tables in the fruiting body database.
1. Maindata contains records on the sporomes recorded including date, location and any vegetative associations. 2. FungiFamily stores family and organism data for each fungal record. This table was added after 3000 records to reduce duplications and consequently the overall size of the database.
3. TreeID stores species and location of trees in the Sanctuary. 4. WeatherData contains records on local weather conditions. 7. THE CUSTOMISED SCHEFFĚ
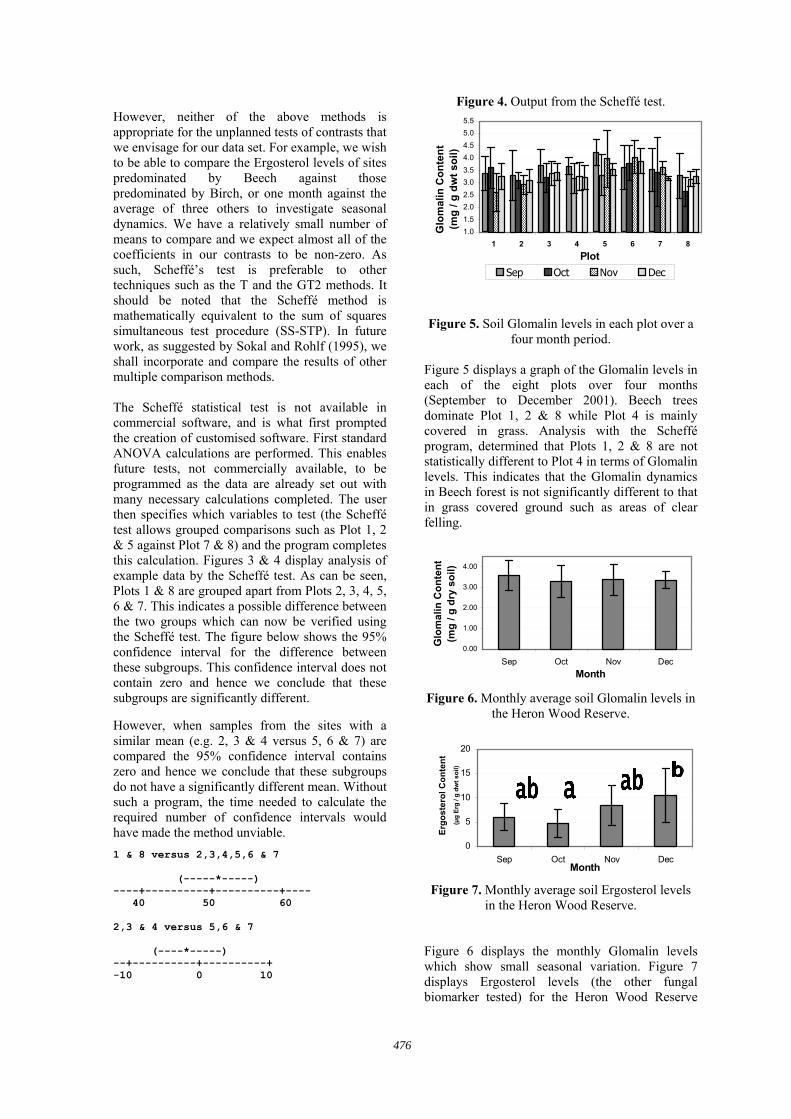
SOFTWARE The automation of a number of tests and data displaying options are carried out in a stand-alone program. The correct data are taken from Microsoft Access (using Structured Query Language) and operated upon in Microsoft Excel. The results from laboratory investigations are already in the correct format for statistical testing and the Scheffé algorithm is implemented as Macros. A database is currently being tested to allow future rapid selection of data should further testing require it. Analysis of Variance Source DF SS MS F P site 7 40729 5818 270.62 0.000 Error 72 1548.0 22 Total 79 42276.8 Level N Mean StDev 1 10 70.000 4.000 2 10 20.000 4.000 3 10 15.000 4.000 4 10 25.000 5.000 5 10 23.000 3.000 6 10 18.000 5.000 7 10 25.000 6.000 8 10 75.000 6.000 Individual 95% CIs For Mean Based on Pooled StDev ----+---------+---------+---------+- 1 (*) 2 (*) 3 (*-) 4 (-*) 5 (-*) 6 (*) 7 (-*) 8 (-*) ----+---------+---------+---------+-- 20 40 60 80
Figure 3. Example Analysis of Variance of 8 samples (representing the eight plots) performed in
Minitab. One way Analysis of variance is used to test for differences amongst the eight sites. If the null hypothesis of no differences in the mean values of factor levels is rejected then there are many multiple comparison methods. These include Tukey’s method for detecting pairwise differences and Dunnett’s test comparing groups against a ‘control’, both of which are available in statistical packages (e.g. MINITAB).
475
However, neither of the above methods is appropriate for the unplanned tests of contrasts that we envisage for our data set. For example, we wish to be able to compare the Ergosterol levels of sites predominated by Beech against those predominated by Birch, or one month against the average of three others to investigate seasonal dynamics. We have a relatively small number of means to compare and we expect almost all of the coefficients in our contrasts to be non-zero. As such, Scheffé’s test is preferable to other techniques such as the T and the GT2 methods. It should be noted that the Scheffé method is mathematically equivalent to the sum of squares simultaneous test procedure (SS-STP). In future work, as suggested by Sokal and Rohlf (1995), we shall incorporate and compare the results of other multiple comparison methods. The Scheffé statistical test is not available in commercial software, and is what first prompted the creation of customised software. First standard ANOVA calculations are performed. This enables future tests, not commercially available, to be programmed as the data are already set out with many necessary calculations completed. The user then specifies which variables to test (the Scheffé test allows grouped comparisons such as Plot 1, 2 & 5 against Plot 7 & 8) and the program completes this calculation. Figures 3 & 4 display analysis of example data by the Scheffé test. As can be seen, Plots 1 & 8 are grouped apart from Plots 2, 3, 4, 5, 6 & 7. This indicates a possible difference between the two groups which can now be verified using the Scheffé test. The figure below shows the 95% confidence interval for the difference between these subgroups. This confidence interval does not contain zero and hence we conclude that these subgroups are significantly different. However, when samples from the sites with a similar mean (e.g. 2, 3 & 4 versus 5, 6 & 7) are compared the 95% confidence interval contains zero and hence we conclude that these subgroups do not have a significantly different mean. Without such a program, the time needed to calculate the required number of confidence intervals would have made the method unviable. 1 & 8 versus 2,3,4,5,6 & 7 (-----*-----) ----+----------+----------+---- 40 50 60 2,3 & 4 versus 5,6 & 7 (----*-----) --+----------+----------+ -10 0 10
Figure 4. Output from the Scheffé test.
Figure 5. Soil Glomalin levels in each plot over a four month period.
Figure 5 displays a graph of the Glomalin levels in each of the eight plots over four months (September to December 2001). Beech trees dominate Plot 1, 2 & 8 while Plot 4 is mainly covered in grass. Analysis with the Scheffé program, determined that Plots 1, 2 & 8 are not statistically different to Plot 4 in terms of Glomalin levels. This indicates that the Glomalin dynamics in Beech forest is not significantly different to that in grass covered ground such as areas of clear felling.
0.00
1.00
2.00
3.00
4.00
Sep Oct Nov DecMonth
Glo
mal
in C
onte
nt(m
g / g
dry
soi
l)
Figure 6. Monthly average soil Glomalin levels in
the Heron Wood Reserve.
0
5
10
15
20
Sep Oct Nov DecMonth
Ergo
ster
ol C
onte
nt
(µg
Erg
/ g d
wt s
oil)
Figure 7. Monthly average soil Ergosterol levels
in the Heron Wood Reserve.
Figure 6 displays the monthly Glomalin levels which show small seasonal variation. Figure 7 displays Ergosterol levels (the other fungal biomarker tested) for the Heron Wood Reserve
1.01.52.02.53.03.54.04.55.05.5
1 2 3 4 5 6 7 8Plot
Glo
mal
in C
onte
nt(m
g / g
dw
t soi
l)
Sep Oct Nov Dec
476
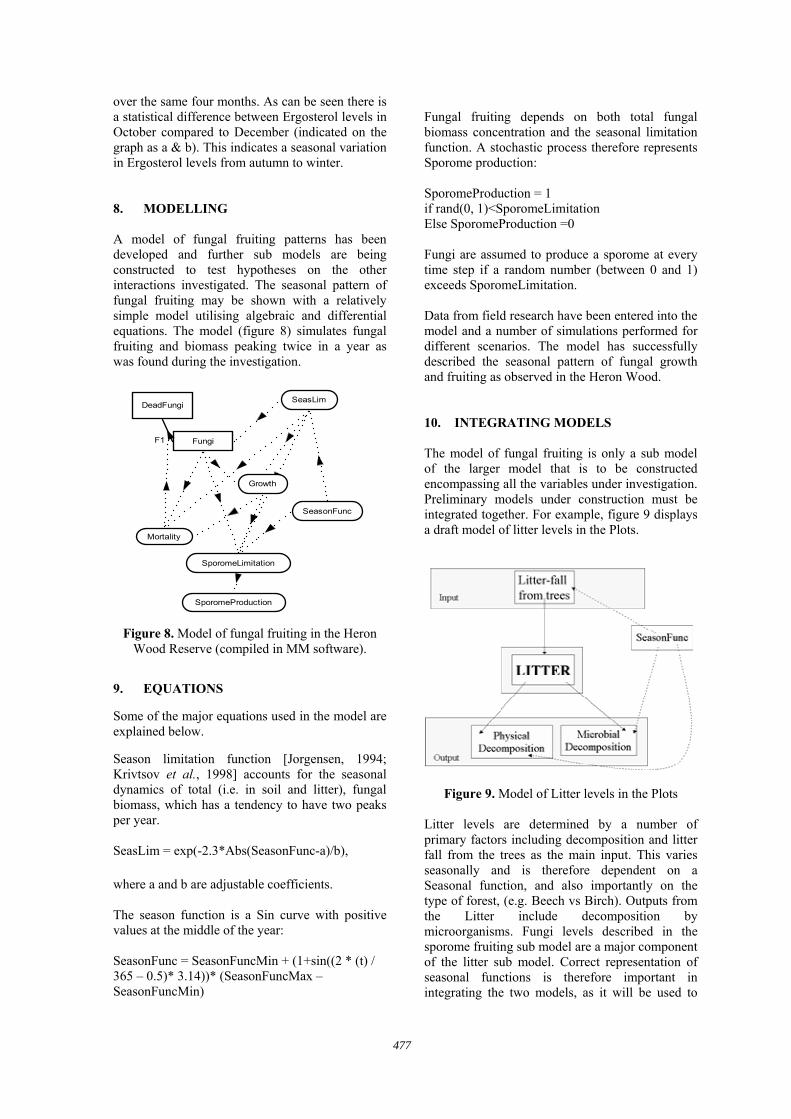
over the same four months. As can be seen there is a statistical difference between Ergosterol levels in October compared to December (indicated on the graph as a & b). This indicates a seasonal variation in Ergosterol levels from autumn to winter. 8. MODELLING A model of fungal fruiting patterns has been developed and further sub models are being constructed to test hypotheses on the other interactions investigated. The seasonal pattern of fungal fruiting may be shown with a relatively simple model utilising algebraic and differential equations. The model (figure 8) simulates fungal fruiting and biomass peaking twice in a year as was found during the investigation.
Figure 8. Model of fungal fruiting in the Heron Wood Reserve (compiled in MM software).
9. EQUATIONS Some of the major equations used in the model are explained below. Season limitation function [Jorgensen, 1994; Krivtsov et al., 1998] accounts for the seasonal dynamics of total (i.e. in soil and litter), fungal biomass, which has a tendency to have two peaks per year. SeasLim = exp(-2.3*Abs(SeasonFunc-a)/b), where a and b are adjustable coefficients. The season function is a Sin curve with positive values at the middle of the year: SeasonFunc = SeasonFuncMin + (1+sin((2 * (t) / 365 – 0.5)* 3.14))* (SeasonFuncMax – SeasonFuncMin)
Fungal fruiting depends on both total fungal biomass concentration and the seasonal limitation function. A stochastic process therefore represents Sporome production: SporomeProduction = 1 if rand(0, 1)<SporomeLimitation Else SporomeProduction =0 Fungi are assumed to produce a sporome at every time step if a random number (between 0 and 1) exceeds SporomeLimitation. Data from field research have been entered into the model and a number of simulations performed for different scenarios. The model has successfully described the seasonal pattern of fungal growth and fruiting as observed in the Heron Wood. 10. INTEGRATING MODELS The model of fungal fruiting is only a sub model of the larger model that is to be constructed encompassing all the variables under investigation. Preliminary models under construction must be integrated together. For example, figure 9 displays a draft model of litter levels in the Plots.
Figure 9. Model of Litter levels in the Plots
Litter levels are determined by a number of primary factors including decomposition and litter fall from the trees as the main input. This varies seasonally and is therefore dependent on a Seasonal function, and also importantly on the type of forest, (e.g. Beech vs Birch). Outputs from the Litter include decomposition by microorganisms. Fungi levels described in the sporome fruiting sub model are a major component of the litter sub model. Correct representation of seasonal functions is therefore important in integrating the two models, as it will be used to
Fungi
SeasonFunc
SeasLimDeadFungi
F1
SporomeLimitation
SporomeProduction
Growth
Mortality
477
calculate microbial biomass, fungal fruiting and litter fall within the different Plots. 11. FURTHER INVESTIGATIONS There is now a large amount of data from the physico-chemical analysis which are undergoing statistical testing with the customised software. A number of other non-commercial statistical tests may be implemented along with a few standard tests already found in commercial software. This would enable the bulk of the testing to be carried out within the Microsoft Excel platform as opposed to extracting data to other programs as is currently the case (e.g. to Minitab and SPSS). More sub models will be constructed to describe the physico-chemical and microbiological dynamics and ultimately an integration of all these models will be obtained. After all the submodels are integrated, the overall model will be used for the analysis of interactions within the ecosystem studied [sensu Krivtsov et al., 2000]. It is our feeling that Scottish forests should be managed in a more natural way, to improve conservation and attract rare species of fungi. The attraction of arbuscular mycorrhizal fungi to areas of clear felling and grassland may reduce soil erosion and improve conditions for sustainable crop growth. In general, the results of this study will enhance our understanding of forest ecosystem dynamics and hopefully improve management practices to reduce human impact on the environment. Timber production in Scotland will double over the next 15 years to nearly 8 million m3 per year [Forestry Commission, statistics published on the internet]. With some adaptation, the models may be applied to those forest areas where intense management is practiced. With further adaptaion, the models may also be applied to temperate forests in general. 12. ACKNOWLEDGMENTS Sandy Glimore and Lachlan Newham are kindly thanked for their valuable comments on style and content. This work has been supported by SHEFC and ESF funding.
13. REFERENCES Arnolds, E., Mycologists and nature conservation,
in Frontiers in Mycology, 3rd ed. Wiley, Chichester, 1991.
Bezginova, T., Thompson, J., Staines, H., Salmond, R., Krivtsov, V., A. Garside, B. Griffiths, K. Liddell, R. Watling and Palfreyman, J., Interrelations between leaf litter composition and nematodes in the 'Heron Wood Reserve', Peebleshire, Scotland. R. J. Nematology, 9(2), 145, 2001.
Frankland, J.C., Magan, N and Gadd, G.G., Fungi and Environmental Change, Press Syndicate of the University Of Cambridge, Cambridge, 1996.
Jorgensen, S. E., Fundamentals of Ecological Modelling, (2nd Edition), Part 19, Elsevier, Amsterdam, 1994.
Krivtsov V., Bellinger E.G., Sigee D.C. & Corliss J., Application of SEM XRMA data to lake ecosystem modelling. Ecological Modelling, 113/1-3, 95-123, 1998.
Krivtsov, V., Corliss,J., Bellinger, E., Sigee, D. Indirect regulation rule for consecutive stages of ecological succession, Ecological Modelling 133/1-2, 73-81, 2000.
Krivtsov, V., Garside, A., Thompson, J., Bezginova, T., Salmond, R., Liddell, K., Griffiths, B., Staines, H., Watling, R. and Palfreyman, J., Interrelations between soil nematodes, bacteria, fungi and protozoa in the 'Dawyck cryptogamic sanctuary' in winter, R. J. Nematology, 9(2), 150-151, 2001.
Krivtsov, V., Lidell, K., Salmond, R., Garside, A., Thompson, J., Bezginova, T., Griffiths, B., Staines, H. J., Watling, R. and Palfreyman, J.W. Analysis of microbial interactions in forest soil. Proceedings of the first workshop on information technologies application to problems of biodiversity and dynamics of ecosystems in North Eurasia (WITA). In press, 2002.
Pimentel D., Harvey C., Resosudarmo, P., Sinclair, K., Kurz, D., McNair, M., Crist, S., Shpritz, L., Fitton, L., Saffouri, R. and Blair, R., Environmental and economic costs of soil erosion and conservation benefits, Science, 267 (5201), 1117-1123, 1995.
Sokal, R.R. and Rohlf, F.J., Biometry. W. H. Freeman and Company, New York, 1995.
Websites: www.forestry.gov.uk - Forestry Commission
Website www.ars.usda.gov/is/index.html - US Department
of Agriculture Website
478