Embed Size (px)
Citation preview

Modeling the Philippine Cities’ Competitiveness Toward a
Sustained Development Amid COVID-19 Pandemic
Reymund B. Flores1
ABSTRACT
Cities and urban centers are viewed as drivers of regional and national development. The COVID-
19 pandemic and the subsequent enhanced community quarantine (ECQ) implemented by the
Philippine government and related public mobility restrictions imposed had resulted to closure of
businesses – from the micro, small, and medium enterprises (MSMEs) sector to several major
industries in regional and provincial centers across the country. In the current crisis, it is argued
that urban centers play a crucial role in sustaining the country’s competitiveness. Thus, we should
not limit our understanding of cities competitive on rankings alone. Assessing the vital signs of
competitiveness in terms of the underlying fundamentals that ultimately drive these results and
providing prescriptions to address the economic challenges we are facing in this time of pandemic
are also necessary. It is then at this level that the interrelationships of the four pillars of
competitiveness – economic dynamism, government efficiency, infrastructure, and resiliency,
should be understood better. Applying the structural equation modeling (SEM) approach, this
study analyzes the interrelationships of these four pillars of competitiveness using the Cities and
Municipalities Competitiveness Index (CMCI) data from 2017-2019. Through model development
and analysis, the findings in this study provide direction for Philippine cities in framing their
development agenda and recommendations for local government officials and development
planners on what to prioritize in attaining and sustaining local competitiveness particularly in this
very challenging time.
Keywords: competitiveness of cities, Philippine competitiveness, competitiveness indicators,
Philippine cities competitiveness
1 Independent Researcher; Assistant Professor of Politics and Public Administration/Governance, West Visayas State
University, Iloilo City | Doctor of Public Administration, National College of Public Administration and Governance,
University of the Philippines Diliman. <email: [email protected] | [email protected]>

Cities compete with each other in many different fields. It is for this reason that tools for
benchmarking and “Index of Competitiveness” are becoming more relevant. Since its
establishment in 2011, the Philippine National Competitiveness Council (PNCC) has been
mandated to promote and develop strategies and push for the implementation of the action agenda
for competitiveness. The Cities and Municipalities Competitiveness Index (CMCI), developed by
PNCC, is an annual ranking of Philippine cities and municipalities based on Michael Porter’s
(2004) framework. Porter’s competitiveness focused on the idea of productivity defined as output
per unit of input. According to him, competitiveness is the ability of firms to thrive in a business
environment (Porter 1990). He also said, “national competitiveness” corresponds to the economic
structures and institutions of the state for economic growth within the structure of global economy.
Following the same lens, “local competitiveness” is viewed as how well cities or
municipalities know their resources and how these resources are used to improve the standard of
living. Henceforth, it is argued that through productivity improvement, cities and municipalities
can have greater opportunity to raise their citizens’ standard of living; thereby, could contribute to
the country’s economic development, particularly in this time of pandemic.
At present, the Philippines’ general understanding of competitiveness is limited to the
descriptive findings of PNCC, specifically the ranking of cities and municipalities based on an
overall competitiveness score. The overall competitiveness score is determined by the sum of
scores on the four main pillars – economic dynamism, government efficiency, infrastructure, and
resilience, which pool data from several sub-indicators. The higher the score of a city or
municipality, the more competitive it is (CMCI Website). Hence, this study was conceptualized to
provide better understanding of the interrelationship of these four main pillars of competitiveness
of Philippine cities to guide city government officials and planners in framing their development
agenda and what to prioritize in attaining and sustaining the city/urban-competitiveness and
development which are deemed useful in keeping local and national economic activities.
Specifically, it aimed to:
1. Analyze and interpret the three-year (2017, 2018, and 2019) Philippine
competitiveness index data; and
2. Provide recommendations to local government officials and planners, on what to
prioritize, in attaining and sustaining LGU-competitiveness.
The findings in this study are based from the 2017, 2018, and 2019 datasets (the
scores/ratings of Philippine cities) of the four pillars of competitiveness as determined in CMCI.
Using these datasets for analysis of the interrelationships of these four indicators is essentially
important in understanding the general standpoint of Philippine economic development. Generally,
because there is a growing consensus that nation-states are not really the only relevant operational
and economic units in the new economy. The cities and their regional environments are now
considered key players in the global economy.

Moreover, this study can provide inputs to institutions working for national
competitiveness like the PNCC to also assess and track the country’s performance in terms of the
underlying fundamentals that ultimately drive competitiveness as an outcome. It is at this level of
underlying fundamentals that policies, backed by data-driven analysis, have to intervene in order
to make a sustainable development in the country’s standard of living over time.
The competitiveness of firms is normally defined by their ability to sell their products in contested
markets (Turok, 2005:25). A competitive city is identified as one with relatively high per capita
incomes or employment and features as a prominent goal of development agencies on how to
increase economic development (Turok, 2005). It is in this context that competitiveness, according
to Turok (2005), should be viewed as encompassing three key determinants of growth and
prosperity; namely, the ability of a city’s firms to sell their products in contested external markets
(trade), the value of these products and the efficiency with which they are produced
(‘productivity’), and the extent to which local human, capital and natural resources are utilized
(e.g., the “employment rate”).
The importance of the concept of competitiveness has increased rapidly in recent years,
with the issues surrounding it becoming more empirically refined and theoretically complex at the
same time (Porter, 1990, 2000; Huggins and Izushi, 2011). Porter (1990) defined national
competitiveness as an outcome of a nation’s ability to innovate in order to achieve, or maintain,
an advantageous position over other nations in a number of key industrial sectors. In his early
study, Porter (1990) linked national competitiveness to productivity and, principally, a nation’s
ability to innovate.
The comprehensive competitiveness of a city is the result of economic, political, and
cultural forces playing their roles together (Pengfei, N. and Kresl, P.K., 2010). Hence, it is a
function of complex interrelationships of variables. It should not be reduced to any single one of
them. Moreover, there remains unresolved questions about the factors and forces underlying these
features, and how the concept should be deeply measured and understood.
The role of the cities as spatial unit of organization has pulled attention of governance
scholars and practitioners of competitiveness at the local level. From this spatial perspective,
Porter’s (2000) major contribution was to take a micro-level understanding of the conditions
determining firm competitiveness, such as the capacity to innovate, and apply it to the territorial
unit – like a city. It is Porter’s (2000) notion of the microeconomic determinants of prosperity and
wealth generation, as opposed to determinants related to monetary exchange rates and the like, that
is at the heart of the concept of local competitiveness.
Of relative similarity, there is also growing consensus in the Philippines that cities are
primary spatial units that compete to attract investment. In urban center or city level, knowledge

is circulated and transferred, resulting in agglomerations or clusters of industrial and service sector
enterprises. Yet, the Philippines ranks 103th among 189 countries according to the World Bank’s
Doing Business 2016 Report.
The 2010 Global Urban Competitiveness Report presented an analysis on why some cities
are more competitive while others are less competitive. The observation indicates that cities with
leading comprehensive competitiveness tend to have high scores in each of the aspects, and do not
have any distinct disadvantages in any other components. Some cities have high ranks in some of
the indices, but are restricted by other aspects. Therefore, their comprehensive competitiveness
ranks remain low. Obviously, in order to improve their comprehensive competitiveness, cities
should focus on balanced development and leverage their competitive advantages.
The quality of urban living environment contributes to a city’s competitiveness by
attracting and cultivating talented individuals (Pengfei, 2012). This means that high quality living
environment plays an important role in attracting and cultivating high-quality talent as well as the
maximum application of their abilities. Competitive places have developed diverse,
multidimensional ways to attract mobile workers as well as mobile investment. Benchmarks,
including knowledge metrics, innovation indices, and report cards, are increasingly common and
increasingly critical to the monitoring of key features of economies and societies whose factors of
production and of success are highly mobile (Malecki, 2007). While nations can only do much to
facilitate these adjustments, the primary burden of action always falls on the shoulders of city
leaders. Hence, the city’s leadership and policymakers need to grasp the nature of “place
competition” and the critical roles of knowledge in the strategies of the most competitive places in
order to sustain the economic activities despite the pandemic.
Cities have been engines of productivity and growth throughout history. The massive and
rapid urbanization of countries, particularly in Asia, suggests that the role of cities is even more
essential in the overall economy of nations and regions, their future growth, and competitiveness.
Moreover, it is important to recall that early Asian prosperity was also driven by cities. The World
Economic Forum (WEF) defined the city’s competitiveness as the set of factors – policies,
institutions, strategies and processes –that determines the level of a city’s sustainable productivity
(2014). Here, WEF argues that sustainability encompasses economic, environmental, and social
issues.
A city competitiveness index is becoming very useful for benchmarking and understanding
how they behave in relation with other cities. Indicators and Indices can help measure the level of
competitiveness of a city. Measuring certain key urban indicators and providing relevant
comparisons through benchmarking analysis allows stakeholders of the city to make appropriate
decision to achieve their specific objectives. In the Philippines, the PNCC measures the cities and

municipalities’ competitiveness using four indicators – economic dynamism, government
efficiency, infrastructure, and resiliency.
The PNCC associates economic dynamism to the city’s activities that create stable
expansion of business and industries and higher employment. It recognizes that localities are at
the center of economic activities. These business expansion and job creation are easily observable
in local settings. Government efficiency refers to the quality and reliability of government services
and government support for effective and sustainable productive expansion. This factor looks at
government as an institution that is generally not corrupt, able to protect and enforce contracts,
and apply moderate and reasonable taxation and is able to regulate proactively. PNCC measures
local infrastructure indicator of competitiveness by looking into the physical building blocks that
connect, expand, and sustain a locality and its surroundings that enable the provision of goods and
services. In 2017, PNCC introduced resiliency in measuring the cities and municipalities
competitiveness. Generally, this indicator attempts to look into the capacity of a locality to
facilitate businesses and industries to create jobs, raise productivity, and increase the incomes of
citizens over time despite of the shocks and stresses it encounters. This implies that the role of
local governments is critical in ensuring a competitive environment to make businesses sustain
their profits, create jobs, and increase the productivity of its people. In order for localities to be
able to do this, it must be resilient in its infrastructure, governance, social and environmental
systems.
However, in spite of the relevance of cities in this new century, Vegara (2016) explained
that Urban Science concepts and methodologies are still going through a major evolution. We need
also to take note that many of the great challenges that cities are facing do not have corresponding
major framework for analysis. This makes comparing initiatives and performance of different
cities difficult to measure. Hence, this study gained interest at modeling the scores of Philippine
cities in these four indicators, using the CMCI datasets from 2017 to 2019, to provide new meaning
in competitiveness interpretation other than using the CMCI rankings as a form of benchmarking.
It is at this point that the SEM structure (Figure 1) is advanced to analyze the
interrelationships of the four pillars of competitiveness of Philippine cities.
Figure 1. SEM Structure for Data Analysis

The concept aims to provide policymakers with a basis to make data-driven decisions on
where action is needed to sustain competitiveness in a given situation, particularly in emergency
situations or during this period of pandemic. The model stands in the idea extracted from the World
Bank’s 2013 Doing Business Publication that says, “since rules and regulation that government
imposes on markets and companies have long been a natural focus of competitiveness analysis,
thus, rules matter.” Following this idea, urban governments need to focus more attention on how
to institutionalize proactive regulation and efficient design, promote growth and development
through transparency and accessibility, and shape better-functioning institutions with reasonably
efficient design to build infrastructure support and sustainability for markets to enhance local
economic dynamism.
This is a scientific, non-experimental study that systemically investigated the interrelationships of
the four pillars of competitiveness measured by PNCC in its Annual CMCI reports. The study used
the structural equation modeling (SEM) approach in the data analysis.
Frequency counts of cities from each clustered geographical area was used to describe the
pattern of the number of cities included in the top ten in each CMCI indicator. Three-year data sets
(2017, 2018, and 2019) from PNCC’s Annual CMCI reports for Philippine cities were used in
quantitative data analysis. A systematic review of literatures in urban competitiveness served as
basis in framing the model or SEM structure for analysis. Hence, this research is largely
quantitative in its generic sense, but embedded qualitative analysis – specifically systematic review
through desk-archival research.
SEM is a “second generation” multivariate method used to assess the reliability and
validity of the model measures. It allows simultaneous analysis of all the variables in the model
instead of analyzing them separately. The main reason for using SEM approach in this study is
that, the simultaneous evaluation of the model construct relationships is possible. Evaluation need
not to be performed in sequential steps. The approach likewise provides flexibility for the
researcher to compare observed data with the theory. Lastly, instead of doing path analysis using
the traditional regression procedures, the use of SEM for path models enables the researcher to
generate output for measures of model-fit, and modification indices.
In data analysis, standardized maximum likelihood estimation was used in SEM analysis.
SEM standardized path coefficients and model-fit analyses were done using IBM® SPSS® AMOS
software version 21 to analyze the interrelationships of the four pillars of cities competitiveness
namely: government efficiency, resiliency, economic dynamism, and infrastructure. Normative Fit
Index (NFI), Tucker Lewis Index (TLI), Comparative Fit Index (CFI), and Goodness of Fit Index
(GFI) were used for model-fit analysis. The analysis of the goodness of fit of the SEM structure
used in this study is shown in Table 8 (See Annex D).

The next section outlines and discusses the key findings of and takeaways from this study.
Urban/cities competitiveness index serves as essential baseline for city and regional leaders and
managers to better understand the performance of their own area in relation with other
cities/regions according to various indicators in a precise moment of time. Through this
competitiveness index, cities can take advantage of the opportunity to also learn from other cities
and benefit each other. The city’s leadership/management can discover, through benchmarking,
how they can compete and cooperate with other cities and look for integrated strategies and
solutions to achieve their respective objectives.
In the Philippines, cities are concentrated in NCR and Luzon areas. There is a total of 33
Highly Urbanized Cities (HUCs); and 112 Component Cities (CCs) included in the CMCI rankings
in 2017, 2018, and 2019 respectively (See Tables 1 and 2). Of this total, 16 (48.5 %) HUCs are
located in NCR; 5 (15.1 %) in Luzon; 6 (18.2 %) in Visayas; and 6 (18.2 %) in Mindanao. For
component cities, 52 (46.4 %) cities are in Luzon; 33 (29.5 %) in Visayas; and 27 (24.1 %) in
Mindanao.
Table 1. Frequency Distribution of Highly Urbanized Cities in the Philippines According to Geographical Area
Geographical Area 2017-2019
Number of Cities %
NCR 16 48.5
Luzon 5 15.1
Visayas 6 18.2
Mindanao 6 18.2
Total 33 100
Table 2. Frequency Distribution of Component Cities in the Philippines According to Geographical Area
Geographical Area 2017-2019
Number of Cities %
Luzon 52 46.4
Visayas 33 29.5
Mindanao 27 24.1
Total 112 100

Number of Top Performing Philippine Cities in the Competitiveness Index from Each
Geographical Area
More cities from the National Capital Region (NCR) are top performing in the four-pillars of
competitiveness index among highly urbanized cities (HUCs) in the Philippines from 2017-
2019.
From 2017 to 2019, more cities from NCR are among the top performing cities HUCs in all four
CMCI indicators. Six to seven Metro Manila cities were included in each of the four indicators of
competitiveness during this three-year period. This suggests that being part of the primary
international entry point in the country is an advantage for cities in Metro Manila which have
already established governance mechanisms and strategies to be more attractive to markets and
keep a dynamic economic environment.
Moreover, it is observed that cities from Luzon are seldom ranked within the top ten
performing HUCs in the areas of infrastructure and resiliency.
Figures 2 to 5 show the comparative frequencies of cities from NCR, Luzon, Visayas, and
Mindanao in the top ten HUC rankings of four CMCI indicators.
Figure 2. Number of HUCs from their respective areas included in the top ten for Economic Dynamism
0
1
2
3
4
5
6
7
8
2017 2018 2019
Economic Dynamism (Highly Urbanized Cities)
NCR Luzon Visayas Mindanao

Figure 3. Number of HUCs from their respective areas included in the top ten for Government Efficiency
Figure 4. Number of HUCs from their respective areas included in the top ten for Infrastructure
0
1
2
3
4
5
6
7
8
2017 2018 2019
Government Efficiency (Highly Urbanized Cities)
NCR Luzon Visayas Mindnao
0
1
2
3
4
5
6
7
8
2017 2018 2019
Infrasructure (Highly Urbanized Cities)
NCR Luzon Visayas Mindanao
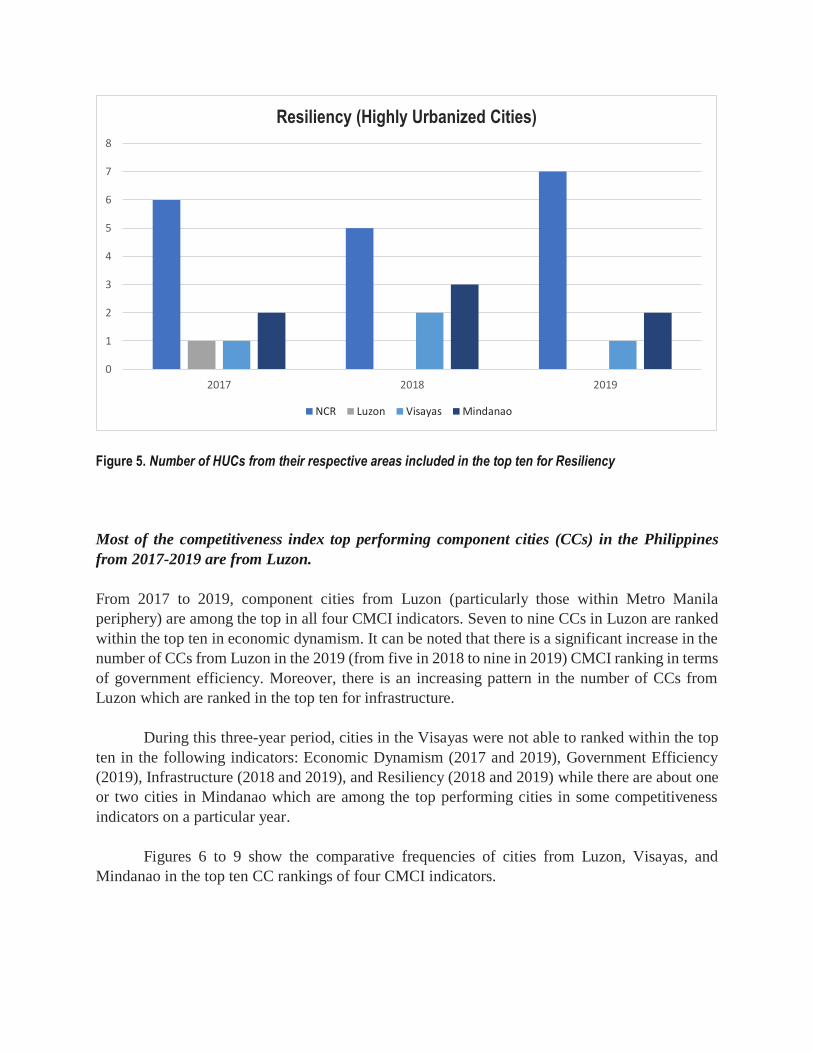
Figure 5. Number of HUCs from their respective areas included in the top ten for Resiliency
Most of the competitiveness index top performing component cities (CCs) in the Philippines
from 2017-2019 are from Luzon.
From 2017 to 2019, component cities from Luzon (particularly those within Metro Manila
periphery) are among the top in all four CMCI indicators. Seven to nine CCs in Luzon are ranked
within the top ten in economic dynamism. It can be noted that there is a significant increase in the
number of CCs from Luzon in the 2019 (from five in 2018 to nine in 2019) CMCI ranking in terms
of government efficiency. Moreover, there is an increasing pattern in the number of CCs from
Luzon which are ranked in the top ten for infrastructure.
During this three-year period, cities in the Visayas were not able to ranked within the top
ten in the following indicators: Economic Dynamism (2017 and 2019), Government Efficiency
(2019), Infrastructure (2018 and 2019), and Resiliency (2018 and 2019) while there are about one
or two cities in Mindanao which are among the top performing cities in some competitiveness
indicators on a particular year.
Figures 6 to 9 show the comparative frequencies of cities from Luzon, Visayas, and
Mindanao in the top ten CC rankings of four CMCI indicators.
0
1
2
3
4
5
6
7
8
2017 2018 2019
Resiliency (Highly Urbanized Cities)
NCR Luzon Visayas Mindanao

Figure 6. Number of CCs from their respective areas included in the top ten for Economic Dynamism
Figure 7. Number of CCs from their respective areas included in the top ten for Government Efficiency
0
1
2
3
4
5
6
7
8
9
10
2017 2018 2019
Economic Dynamism (Component Cities)
Luzon Visayas Mindanao
0
1
2
3
4
5
6
7
8
9
10
2017 2018 2019
Government Efficiency (Component Cities)
Luzon Visayas Mindanao

Figure 8. Number of CCs from their respective areas included in the top ten for Infrastructure
Figure 9. Number of CCs from their respective areas included in the top ten for Resiliency
0
2
4
6
8
10
12
2017 2018 2019
Infrastructure (Component Cities)
Luzon Visayas Mindanao
0
2
4
6
8
10
12
2017 2018 2019
Resiliency (Component Cities)
Luzon Visayas Mindanao

Interrelationships of the Four Pillars of Competitiveness of Philippine Cities
(2017-2019) and their Policy Implications
Other than capturing local differences, these four pillars of CMCI have been able to enhanced the
frequency of benchmarking, point out the areas of improvement for a particularly city to improve
their competitiveness, and highlight good practices that are easily replicable in some other cities.
This section presents the key takeaways in SEM analysis of the Philippine HUCs and CCs’
CMCI scores from 2017 to 2019. The overall model path coefficients for each year are presented
in Annex A, B, and C respectively.
When the [local] government becomes more efficient, the more likely it can build/facilitate better
infrastructures to support a dynamic economic environment. The results of the simultaneous
regression and path analysis of the three-year period datasets showed that government efficiency
has significant effect to infrastructure (See Table 3). This means that as the city government
becomes more efficient better infrastructures to support local economic growth and expansion will
more likely improve. Simpler entry regulations could encourage the creation of more new firms
that would eventually result to new jobs in the formal sector. Moreover, according to the World
Bank (2013), economies at varying income levels and in different regions saw noticeable increases
in the number of new firm registrations after implementing such reforms, such as in business
registration. In relation to this, within-country studies have confirmed the positive association
between improvements in business registration and registration of new firms (World Bank, 2013).
Efficiency in local tax collection is also essential to support public infrastructure which are
important for the growth of local markets.
Thus, the city’s leadership needs to have a clear vision of the city’s direction in order to
get the basics right. This involves thinking of a regulatory framework to improve the city’s
business climate which involves stable and prudent fiscal policies, including efficient and simple
taxation; a flexible labor market; openness to trade and foreign investment; and simple and
transparent business regulation – is the primary lesson for good public policy (WEF, 2014).
Table 3. Standardized Regression Weights (Maximum Likelihood Estimates) Summary between Government
Efficiency and Infrastructure
Year Estimated β C.R.* P** Label
2017 0.45 5.5.07 <0.000 Significant
2018 0.52 5.435 <0.000 Significant
2019 0.86 15.048 <.0.000 Significant
β (standardized regression coefficient); *c.r.>1.96 (<-1.96); **p<0.05
With more infrastructure support for hosting businesses and industries, cities are more likely to
experience dynamic economic activities. The results of the simultaneous regression and path
analysis of the three-year period datasets showed that when there is improvement in infrastructure
support cities will more likely have an increase in economic dynamism (See Table 4). Public
infrastructures such as schools, hospitals, courts, roads, seaports, and airports help businesses and
society to become more productive and better off (World bank, 2006). In contrast, when the quality
and accessibility of infrastructure services are poor, companies’ productivity and growth suffer
(World Bank, 2010). This means that the existence of the right infrastructure supports for market
expansion could foster dynamism in the Philippine cities’ economy.
Table 4. Standardized Regression Weights (Maximum Likelihood Estimates) Summary between Infrastructure
and Economic Dynamism
Year Estimated β C.R.* P** Label
2017 0.73 11.362 <0.000 Significant
2018 0.68 10.346 <0.000 Significant
2019 0.75 12.564 <0.000 Significant
β (standardized regression coefficient); *c.r.>1.96 (<-1.96); **p<0.05
The more efficient the government is, the more likely the city will perform better in the resiliency
indicator. To increase competitiveness, [city] governments of emerging economies need to
promptly and efficiently implement structural reforms. The right mix of priorities requires tailoring
to specific conditions and stages of city development (WEF, 2014). These reforms are necessary
to build their resilience against future external shocks, allow a more efficient allocation of
resources, and facilitate the transition toward more productive activities (WEF, 2014). Those that
are flexible and adapt quickly to changing conditions are successful cities.
The results of the simultaneous regression and path analysis to the model using the three-
year period datasets revealed that government efficiency has significant effect to resiliency (See
Table 5). This supports the idea that as the efficiency in [local] governance improves the city’s
performance (score) in the indicators of resiliency is likewise improving. However, it is important
to note that resiliency here is primarily based on the existence and documentation of outputs; and
adherence to the national DRRM policies and mandates to local governments which are generally
true to all local government units.

Table 5. Standardized Regression Weights (Maximum Likelihood Estimates) Summary between Government
Efficiency and Resiliency
Year Estimated β C.R.* P** Label
2017 0.60 8.919 <0.000 Significant
2018 0.69 11.497 <0.000 Significant
2019 0.57 8.393 <0.000 Significant
β (standardized regression coefficient); *c.r.>1.96 (<-1.96); **p<0.05
Resiliency has less likely influenced the notion of competitiveness among Philippine cities.
Climate change exacerbates nature loss, which in turn reduces our resilience to climate change and
its impacts. Incorporating the sustainability/resilience goals and design into each stage of the
infrastructure asset cycle, particularly in the early stages of strategy and design has been a
successful strategy (WEF, 2020). Another element of a successful strategy according to WEF
(2020) is environmental considerations. Establishing the goals and expected outcomes in
conjunction with a predetermined set of sustainability and resilience drivers are relevant to the
city’s competitiveness. These considerations include mitigating effects of natural disasters and
climate change, climate resilience, ensuring efficient energy utilization during construction and
operation phases, optimizing use of natural resources, optimizing land use, waste minimization/
design optimization.
Interestingly, during this three-year period, resiliency was found to have no significant
effect to improvement in the infrastructure supports for markets (except in 2017) and economic
dynamism (See Tables 6 and 7). The results suggest that an increase in resiliency score does not
significantly mean that a city has more likely have better infrastructure to attract more business or
an improving economic environment.
While it is believed that the role of local governments is critical in ensuring a competitive
environment to make businesses sustain their profits, create jobs, and increase the productivity of
its people, the present component of resiliency being measured is limited to the existence of the
following local government’s output: Organization and Coordination – Land Use Plan, Disaster
Risk Reduction Plan, Annual Disaster Drill, Early Warning System; Resiliency Financing –
Budget for DRRMP, Resiliency Reports – Local Risk Assessments, Resiliency Infrastructure –
Emergency Infrastructure, and Utilities; Resilience of System – Employed Population, Sanitary
System.
By looking into this, the quality of the outcomes of these plans and outputs have not yet
captured in the assessments as it is argued that in order for localities to be able to do this, it must
be resilient in its infrastructure, governance, social and environmental systems (cmci.dt.gov.ph).
This could be the reason why resiliency has not significantly associated to economic dynamism or
having a better infrastructure supports for markets.

A social system shows resilience when it can absorb temporary or permanent shocks and
adapt to quickly changing conditions without compromising its stability (World Bank, 2014).
Hence, it would seem logical enough to assume that the notion of resilience will be analyzed
according to how localities react to and recover from shocks (Martin & Sunley, 2015). Moreover,
the implications of these shocks in the spatial dynamics of economic growth and development over
time also need to be assessed.
Table 6. Standardized Regression Weights (Maximum Likelihood Estimates) Summary between Resiliency and
Infrastructure
Year Estimated β C.R.* P** Label
2017 0.21 2.587 0.010 Significant
2018 0.07 0.774 0.439 Not Significant
2019 -0.07 -1.266 0.205 Not Significant
β (standardized regression coefficient); *c.r.>1.96 (<-1.96); **p<0.05
Table 7. Standardized Regression Weights (Maximum Likelihood Estimates) Summary between Resiliency and
Economic Dynamism
Year Estimated β C.R.* P** Label
2017 0.00 0.015 0.988 Not Significant
2018 0.06 0.933 0.351 Not Significant
2019 0.04 0.684 0.494 Not Significant
β (standardized regression coefficient); *c.r.>1.96 (<-1.96); **p<0.05
Sub-national competitiveness indicators, like that of CMCI, provide both the national and local
governments with standard measures that allow objective domestic comparisons in positioning the
country against other economies in the region and the world. These indicators have been essential
assessment tools in positioning the competitiveness of our national economy.
However, due to COVID-19 there is an ongoing rapid change acceleration in how people
live, work, and consume. It is in fact faster than most societies are prepared for. While it is believed
that building the city’s economic resilience largely depends on the local government’s efficiency
and capacity to strengthen the fundamentals of its local economy, there is a need to change the

way we should appreciate resiliency among cities and urban areas. Resiliency, as an indicator of
competitiveness, should attempt to see to it that it looks into the capacity of a locality to facilitate
businesses and industries to create jobs, raise productivity, and increase the incomes of citizens
over time despite the shocks and stresses it encounters. Local public managers are therefore
challenged to understand “what-to-reform and how-to-reform” to boost competitiveness in this
time of pandemic; and for the “next normal.” Adaptation needs to be given urgent priority not only
to prepare for the possible occurrence of another dangerous climate change related hazards in the
future but also to eliminate the resilience deficit we face today.
In the context of pandemic and other economic risks, public economic managers and
policymakers need to adopt prudent regulations that will accomplish the desired outcome in the
most efficient way; that have measurable positive impact in facilitating interactions in the
marketplace; that adapt to changes in the environment; that are proportionate to the problem they
are designed to solve; and, that are clear and accessible to anyone who needs to use them in order
to improve efficiency and sustain the economy. Health systems are vital to security, resilience and
growth. They form part of countries’ critical infrastructure. At the population level, health
underpins productivity. Well-functioning health systems enable countries to respond to, and
recover from, natural and human-induced disruptions. Hence, for cities to be resilient and
sustainable, urban plans need to be designed, evaluated, and approved using a health lens.
Lastly, with the current scale, complexity, and urgency of the situation, if governments and
industries are to ensure business continuity, protect employees, and shore up supply systems for
the future, they need to find new approaches particularly in knowledge sharing and achieving better
outcomes in working together as never before.
REFERENCES
Cities and Municipalities Competitiveness Index. Website:
<https://cmci.dti.gov.ph/pages/about%20the%20index/>.
Gordon, I. & Buck, N. (2005). Introduction: cities in the new conventional wisdom. In Buck, N.,
Gordon, I. Harding, A., and Turok, I. (Eds), Changing cities: Rethinking urban
competitiveness, cohesion, and governance. London: Mcmillan.
Malecki, E.J. (2007). Cities and regions competing in the global economy: Knowledge and local
development policies. Environment and Planning C Government and Policy, 25(5):638-
654.
Martin, R. & Sunley, P. (2015). On the notion of regional economic resilience:
Conceptualization and explanation. Journal of Economic Geography, 15: 1–42.

Pengfei, N. & Kresl, P.K. (2010). The global urban competitiveness report. Cheltenham: Edward
Elgar.
Pengfei, N. (2012) Italian cities and global urban competitiveness. In Kresl, P.K. and Ietri, D.
(Eds.). European cities and global competitiveness: Strategies for improving
performance. Cheltenham: Edward Elgar.
Porter, M. E. (1990) The competitive advantage of nations. New York: The Free Press.
Porter, M. E. (2000). Locations, clusters, company strategy. In Clarke, G. L., Feldman, M. P. and
Gertler, M. S. (Eds), The oxford handbook of economic geography. Oxford: Oxford
University Press.
Turok, I. (2005). Cities, competition and competitiveness: identifying new connections. In Buck,
N., Gordon, I. Harding, A., and Turok, I. (Eds), Changing cities: Rethinking urban
competitiveness, cohesion, and governance. London: Mcmillan.
Vegara, A. (2016). The critical factors for the competitiveness of cities. Proceedings of the 11
International 11th Conference on Urban Regeneration and Sustainability.
World Economic Forum (WEF) (2014). The global competitiveness report 2014–2015.
World Economic Forum (WEF) (2020). Global Future Council on Infrastructure Six Qualities of
Sustainable Infrastructure.
Doing business 2004: Understanding regulations. Washington DC: The World Bank Group.
Doing business 2006: Creating jobs. Washington DC: The World Bank Group.
Doing business 2010: Reforming through difficult times. Washington DC: The World Bank
Group.
Doing business 2013: Smarter regulations for small and medium-sized enterprises. Washington
DC: The World Bank Group.
Doing business 2014: Understanding regulations for small and medium-sized enterprises.
Washington DC: The World Bank Group.
Doing business 2016: Measuring regulatory quality and efficiency. Washington DC: The World
Bank Group.
2017 Philippines urbanization review fostering competitive, sustainable and inclusive cities.
Washington DC: The World Bank Group.

(ANNEX A)
Figure 10. Overall Path Coefficients (2017 Datasets)

(ANNEX B)
Figure 11. Overall Path Coefficients (2018 Datasets)

(ANNEX C)
Figure 12. Overall Path Coefficients (2019 Datasets)

(ANNEX D)
Table 8 Model Fit Summary Baseline Comparisons using the 2017, 2018, and 2019 CMCI Datasets
Measures of Fit Recommended
Value 2017
Value of the Model 2018
Value of the Model 2019
Value of the Model
NFI ≥0.90 1.00 0.99 0.98
TLI ≥0.90 1.00 0.99 0.91
CFI ≥0.95 1.00 1.00 0.99
GFI ≥0.95 1.00 1.00 0.98
NFI – Normative Fit Index
TLI – Tucker Lewis Index
CFI – Comparative Fit Index
CFI – Goodness of Fit Index